
You also want an ePaper? Increase the reach of your titles
YUMPU automatically turns print PDFs into web optimized ePapers that Google loves.
By DaveStevens<br />
Unless you’ve been living in a cave somewhere<br />
for the last year or so, chances<br />
are you’ve at least heard about and<br />
probably have been impacted in some way by<br />
the changing regulatory landscape for wireless<br />
mics and monitoring systems.<br />
That Was Then… RT<br />
Back in the days of yore, using wireless<br />
was less complex than it is now. There wasn’t<br />
the variety of over-the-air TV offerings. Venues<br />
were smaller and not housed together in complexes,<br />
or used in the density that many urban<br />
areas endure in the present day. Chances are<br />
wherever you worshipped had only a minimal<br />
sound system and not a production that<br />
would rival most commercial broadcasts. The<br />
theater folks have dealt with multiple radio<br />
units for several years, but only over the last<br />
decade or so have concert sound reinforcement<br />
types managed an increasingly crowded<br />
spectrum.<br />
Back in the day, we’d wire up a couple of<br />
radio mics, perhaps a guitar rig or two, and call<br />
it a done deal. These days it seems nearly everything<br />
that is practical to have wireless, we<br />
make wireless — and even some things that<br />
aren’t so practical. In the theatrical, broadcast<br />
and production show worlds, the use of radio<br />
equipment is off the hook.<br />
Gone are the days when you can just poke<br />
around and hope to find a slice of clear air in<br />
which to park your mics or in-ear packs. These<br />
days, you need basic knowledge of how the<br />
gear works and how best to integrate it into a<br />
crowded spectrum.<br />
This is Now RT<br />
At our show (Cirque du Soliel’s KA at the<br />
MGM Grand in Las Vegas) we coordinate not<br />
only the 181 UHF carriers (frequencies) that<br />
are used on our show, but also an additional<br />
100 plus that are used in other venues on the<br />
property. We also coordinate with outside artists<br />
coming into our arena.<br />
The person for whom this responsibility<br />
lies is the lead RF tech, CJ Hermann. CJ employs<br />
the latest in tools and technology to maintain<br />
the show, from high end spectrum analyzers to<br />
comprehensive software that plots frequency<br />
coordination. CJ not only deals with the usual<br />
wireless mics and musician ear packs, but also<br />
a variety of other devices including an extensive<br />
radio communications system and an IFB<br />
and “listen only” radio comm systems.<br />
While we have the budget to operate an<br />
elaborate monitoring environment, most people<br />
don’t. One of the greatest tools for determining<br />
where best to locate your radio gear in<br />
terms of frequencies, particularly in this everchanging<br />
environment, is a radio frequency<br />
spectrum analyzer (SA).<br />
A high-end SA comes at a significant cost<br />
and involves a steep learning curve. Most people<br />
need something less expensive and easier<br />
to use. That’s where a new crop of low-cost,<br />
use-right-out-of-the-box devices come into<br />
play.<br />
Recently, CJ and I have been supplementing<br />
our current tools with the Kaltman Creations<br />
Invisible Waves IW1800 PC-based radio<br />
spectrum analyzer. We’ve found it to be a good<br />
tool to supplement our test environment. I<br />
think it’s a good value for the average user of<br />
wireless audio gear: The Invisible Waves works<br />
in the same way a traditional audio analyzer<br />
works for sound, except this displays radio frequencies.<br />
www.fohonline.com<br />
Road Test<br />
Kaltman Creations IW1800<br />
Easy to Set Up and Use RT<br />
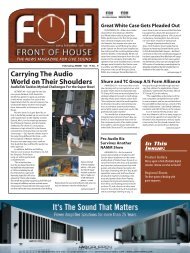
The hardware is packaged well, easy to<br />
set up and configure, and it’s portable. It can<br />
be operated on an included battery if required.<br />
The hardware is a modified Winrado<br />
G305 series receiver, but it’s not the hardware<br />
that makes this package useful for the typical<br />
sound person. In this case, it’s all about the<br />
software.<br />
Kaltman Creations has taken an existing<br />
hardware design and engineered software<br />
geared toward sound reinforcement users.<br />
The included Invisible Waves software and<br />
documentation allow even a novice user to<br />
get up to speed quickly and start making informed<br />
decisions about frequency coordination.<br />
We installed the software and drivers on a<br />
nearly five-year-old Pentium III laptop running<br />
Windows XP Pro SP3. The system found the<br />
hardware, we started the program, entered<br />
the serial number and we were ready to start<br />
measuring.<br />
Don’t Toss the Manual RT<br />
When the software first starts, there<br />
aren’t many options available in the menu.<br />
As the program relies on right mouse clicks,<br />
one would be wise to read the manual prior<br />
to installing the drivers and software.<br />
While the software is for the most part<br />
intuitive to use, unless you know how to access<br />
some of the features not found in the<br />
menu, you won’t be able to get the most out<br />
of the software. Reading the manual is particularly<br />
necessary if you’ve never used an<br />
RF spectrum analyzer before.<br />
There is enough information to guide you<br />
to making your first measurements. In the<br />
control panel, you define your sweep range<br />
and activate the sweep, and you’ve made<br />
your first measurement. That measurement<br />
is going to show you the congestion in that<br />
area, but won’t necessarily get you closer to<br />
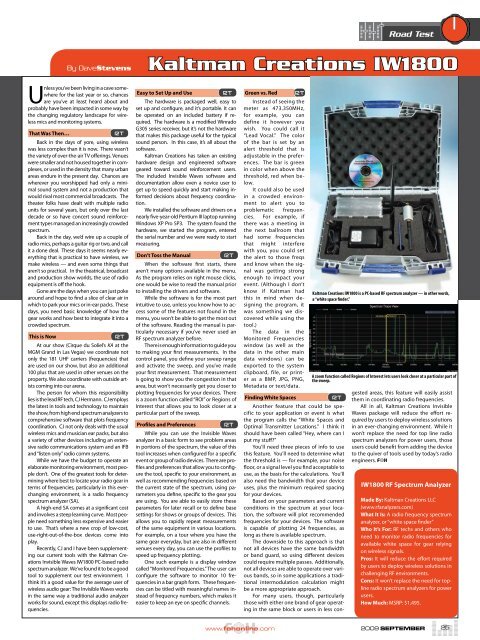
plotting frequencies for your devices. There<br />
is a zoom function called “ROI” or Regions of<br />
Interest that allows you to look closer at a<br />
particular part of the sweep.<br />
Profiles and Preferences RT<br />
While you can use the Invisible Waves<br />
analyzer in a basic form to see problem areas<br />
in portions of the spectrum, the value of this<br />
tool increases when configured for a specific<br />
event or group of radio devices. There are profiles<br />
and preferences that allow you to configure<br />
the tool, specific to your environment, as<br />
well as recommending frequencies based on<br />
the current state of the spectrum, using parameters<br />
you define, specific to the gear you<br />
are using. You are able to easily store these<br />
parameters for later recall or to define base<br />
settings for shows or groups of devices. This<br />
allows you to rapidly repeat measurements<br />
of the same equipment in various locations.<br />
For example, on a tour where you have the<br />
same gear everyday, but are also in different<br />
venues every day, you can use the profiles to<br />
speed up frequency plotting.<br />
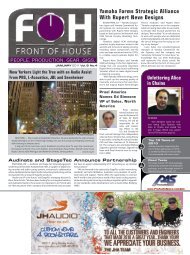
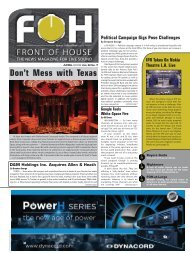
One such example is a display window<br />
called “Monitored Frequencies.” The user can<br />
configure the software to monitor 10 frequencies<br />
in a bar graph form. These frequencies<br />
can be titled with meaningful names instead<br />
of frequency numbers, which makes it<br />
easier to keep an eye on specific channels.<br />
Green vs. Red RT<br />
Instead of seeing the<br />
meter as 473.350MHz,<br />
for example, you can<br />
define it however you<br />
wish. You could call it<br />
“Lead Vocal.” The color<br />
of the bar is set by an<br />
alert threshold that is<br />
adjustable in the preferences.<br />
The bar is green<br />
in color when above the<br />
threshold, red when below.<br />
It could also be used<br />
in a crowded environment<br />
to alert you to<br />
problematic frequencies.<br />
For example, if<br />
there was a meeting in<br />
the next ballroom that<br />
had some frequencies<br />
that might interfere<br />
with you, you could set<br />
the alert to those freqs<br />
and know when the signal<br />
was getting strong<br />
enough to impact your<br />
event. (Although I don’t<br />
know if Kaltman had<br />
this in mind when designing<br />
the program, it<br />
was something we discovered<br />
while using the<br />
tool.)<br />
The data in the<br />
Monitored Frequencies<br />
window (as well as the<br />
data in the other main<br />
data windows) can be<br />
exported to the system<br />
clipboard, file, or printer<br />
as a BMP, JPG, PNG,<br />
Metadata or text/data.<br />
Finding White Spaces RT<br />
Another feature that could be specific<br />
to your application or event is what<br />
the program calls the “White Spaces and<br />
Optimal Transmitter Locations.” I think it<br />
should have been called “Hey, where can I<br />
put my stuff?”<br />
You’ll need three pieces of info to use<br />
this feature. You’ll need to determine what<br />
the threshold is — for example, your noise<br />
floor, or a signal level you find acceptable to<br />
use, as the basis for the calculations. You’ll<br />
also need the bandwidth that your device<br />
uses, plus the minimum required spacing<br />
for your devices.<br />
Based on your parameters and current<br />
conditions in the spectrum at your location,<br />
the software will plot recommended<br />
frequencies for your devices. The software<br />
is capable of plotting 24 frequencies, as<br />
long as there is available spectrum.<br />
The downside to this approach is that<br />
not all devices have the same bandwidth<br />
or band guard, so using different devices<br />
could require multiple passes. Additionally,<br />
not all devices are able to operate over various<br />
bands, so in some applications a traditional<br />
intermodulation calculation might<br />
be a more appropriate approach.<br />
For many users, though, particularly<br />
those with either one brand of gear operating<br />
in the same block or users in less con-<br />
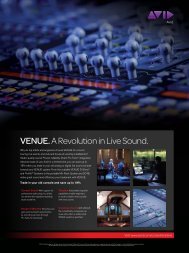
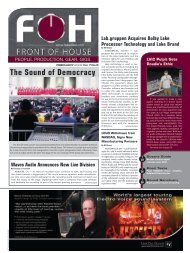
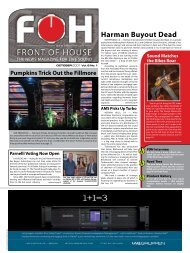
Kaltman Creations IW1800 is a PC-based RF spectrum analyzer — in other words,<br />
a “white space finder.”<br />
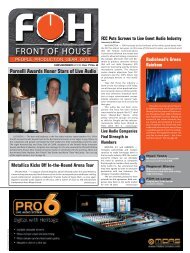
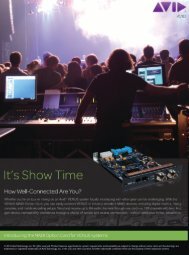
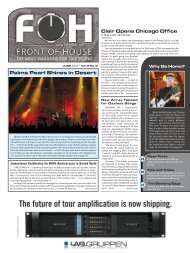
A zoom function called Regions of Interest lets users look closer at a particular part of<br />
the sweep.<br />
gested areas, this feature will easily assist<br />
them in coordinating radio frequencies.<br />
All in all, Kaltman Creations Invisible<br />
Waves package will reduce the effort required<br />
by users to deploy wireless solutions<br />
in an ever-changing environment. While it<br />
won’t replace the need for top line radio<br />
spectrum analyzers for power users, those<br />
users could benefit from adding the device<br />
to the quiver of tools used by today’s radio<br />
engineers.<br />
IW1800 RF Spectrum Analyzer<br />
Made By: Kaltman Creations LLC<br />
(www.rfanalyzers.com)<br />
What It Is: A radio frequency spectrum<br />
analyzer, or “white space finder”<br />
Who It’s For: RF techs and others who<br />
need to monitor radio frequencies for<br />
available white space for gear relying<br />
on wireless signals.<br />
Pros: It will reduce the effort required<br />
by users to deploy wireless solutions in<br />
challenging RF environments.<br />
Cons: It won’t replace the need for topline<br />
radio spectrum analyzers for power<br />
users.<br />
How Much: MSRP: $1,495.<br />
2009 SEPTEMBER<br />
25