

MALDIVES
Census-Summary-Tables
Census-Summary-Tables

Create successful ePaper yourself
Turn your PDF publications into a flip-book with our unique Google optimized e-Paper software.
Population & Households: CENSUS 2014<br />
42<br />
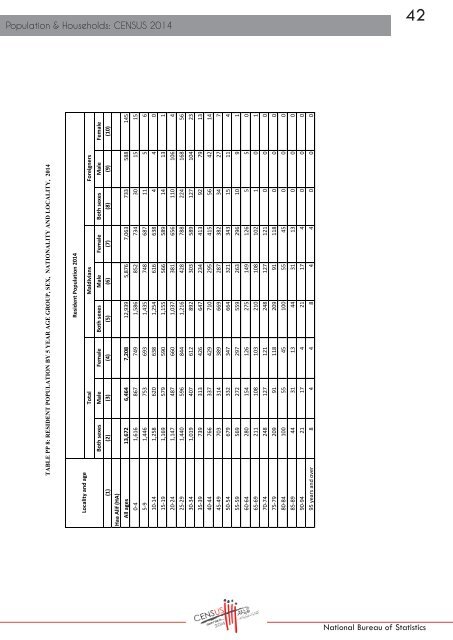
TABLE PP 8: RESIDENT POPULATION BY 5 YEAR AGE GROUP, SEX, NATIONALITY AND LOCALITY, 2014<br />
Locality and age<br />
Haa Alif (HA)<br />
Total<br />
Resident Population 2014<br />
Maldivians Foreigners<br />
Both sexes Male Female Both sexes Male Female Both sexes Male Female<br />
(1) (2) (3) (4) (5) (6) (7) (8) (9) (10)<br />
All ages 13,672 6,464 7,208 12,939 5,876 7,063 733 588 145<br />
0-4 1,616 867 749 1,586 852 734 30 15 15<br />
5-9 1,446 753 693 1,435 748 687 11 5 6<br />
10-14 1,258 620 638 1,254 616 638 4 4 0<br />
15-19 1,169 579 590 1,155 566 589 14 13 1<br />
20-24 1,147 487 660 1,037 381 656 110 106 4<br />
25-29 1,440 596 844 1,216 428 788 224 168 56<br />
30-34 1,019 407 612 892 303 589 127 104 23<br />
35-39 739 313 426 647 234 413 92 79 13<br />
40-44 766 337 429 710 295 415 56 42 14<br />
45-49 703 314 389 669 287 382 34 27 7<br />
50-54 679 332 347 664 321 343 15 11 4<br />
55-59 569 272 297 559 263 296 10 9 1<br />
60-64 280 154 126 275 149 126 5 5 0<br />
65-69 211 108 103 210 108 102 1 0 1<br />
70-74 248 127 121 248 127 121 0 0 0<br />
75-79 209 91 118 209 91 118 0 0 0<br />
80-84 100 55 45 100 55 45 0 0 0<br />
85-89 44 31 13 44 31 13 0 0 0<br />
90-94 21 17 4 21 17 4 0 0 0<br />
95 years and over 8 4 4 8 4 4 0 0 0<br />
National Bureau of Statistics