

MALDIVES
Census-Summary-Tables
Census-Summary-Tables

Create successful ePaper yourself
Turn your PDF publications into a flip-book with our unique Google optimized e-Paper software.
43<br />
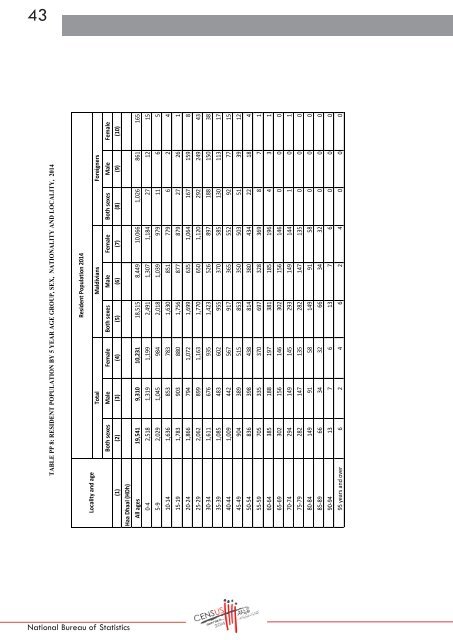
TABLE PP 8: RESIDENT POPULATION BY 5 YEAR AGE GROUP, SEX, NATIONALITY AND LOCALITY, 2014<br />
Locality and age<br />
Haa Dhaal (HDh)<br />
Total<br />
Resident Population 2014<br />
Maldivians Foreigners<br />
Both sexes Male Female Both sexes Male Female Both sexes Male Female<br />
(1) (2) (3) (4) (5) (6) (7) (8) (9) (10)<br />
All ages 19,541 9,310 10,231 18,515 8,449 10,066 1,026 861 165<br />
0-4 2,518 1,319 1,199 2,491 1,307 1,184 27 12 15<br />
5-9 2,029 1,045 984 2,018 1,039 979 11 6 5<br />
10-14 1,636 853 783 1,630 851 779 6 2 4<br />
15-19 1,783 903 880 1,756 877 879 27 26 1<br />
20-24 1,866 794 1,072 1,699 635 1,064 167 159 8<br />
25-29 2,062 899 1,163 1,770 650 1,120 292 249 43<br />
30-34 1,611 676 935 1,423 526 897 188 150 38<br />
35-39 1,085 483 602 955 370 585 130 113 17<br />
40-44 1,009 442 567 917 365 552 92 77 15<br />
45-49 904 389 515 853 350 503 51 39 12<br />
50-54 836 398 438 814 380 434 22 18 4<br />
55-59 705 335 370 697 328 369 8 7 1<br />
60-64 385 188 197 381 185 196 4 3 1<br />
65-69 302 156 146 302 156 146 0 0 0<br />
70-74 294 149 145 293 149 144 1 0 1<br />
75-79 282 147 135 282 147 135 0 0 0<br />
80-84 149 91 58 149 91 58 0 0 0<br />
85-89 66 34 32 66 34 32 0 0 0<br />
90-94 13 7 6 13 7 6 0 0 0<br />
95 years and over 6 2 4 6 2 4 0 0 0<br />
National Bureau of Statistics