Coal Kills
1TndvUf
1TndvUf

You also want an ePaper? Increase the reach of your titles
YUMPU automatically turns print PDFs into web optimized ePapers that Google loves.
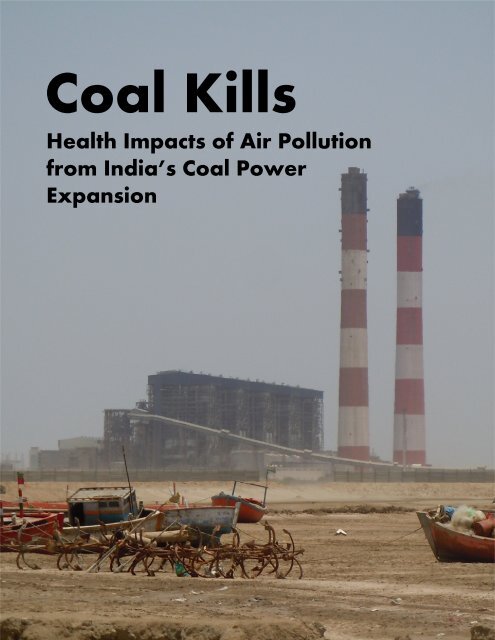
<strong>Coal</strong> <strong>Kills</strong><br />
Health Impacts of Air Pollution<br />
from India’s <strong>Coal</strong> Power<br />
Expansion
Clusters of coal-fired thermal<br />
power plants in 2030. The brown<br />
circles represent the thermal<br />
power plants operational in 2014<br />
and the second colour represents<br />
all the expansions likely to be<br />
operational in 2030. The largest<br />
circle is 4620MW. Note that many<br />
of these circles are overlapping<br />
due their close proximity<br />
Report written and edited by staff @ Conservation Action Trust (India) and<br />
Urban Emissions (India)<br />
Founded in 2005, the Conservation Action Trust is a non-profit organization<br />
dedicated to the protection of the environment through advocacy and action.<br />
Founded in 2007, Urban Emissions (Pvt. Ltd.) is an independent research<br />
group, with the vision to bridge the knowledge gap between science and<br />
policy related to air pollution, through information, research, and analysis.<br />
This report is distributed for free.<br />
Cover page photo from Mundra; Back page<br />
inside photo from Tiroda; Back page photo from<br />
Dahanu © Conversation Action Trust (2014)<br />
Please send your comments to<br />
Conservation Action Trust,<br />
5 Sahakar Building, LBS Road,<br />
Ghatkopar (West), Mumbai 400086 INDIA<br />
Email – debi1@cat.org.in<br />
Conservation<br />
ACTION TRUST
<strong>Coal</strong> <strong>Kills</strong>: Health Impacts of Air Pollution from India’s <strong>Coal</strong> Power Expansion<br />
Table of Contents<br />
Executive Summary 1<br />
Chapter 1 Background 3<br />
Chapter 2 <strong>Coal</strong>-fired Thermal Power Plants in India 6<br />
Chapter 3 Future <strong>Coal</strong>-fired Thermal Power Plants in India 12<br />
Chapter 4 Role of Flue Gas Desulphurization 21<br />
Chapter 5 In Retrospect 24<br />
Relevant References 26<br />
Figures<br />
1 (a) Ambient PM 2.5 concentrations derived from the satellite observations (b) Gridded population in India 4<br />
for 2011<br />
2 (a) Sources of electricity in India, based on the installed capacity in 2013 and (b) Growth of installed power 6<br />
generation in India<br />
3 Summary of new emission standards for the coal-fired thermal power plants (zero listing = no standard) 7<br />
4 Simplified schematics of a coal-fired TPP 7<br />
5 Source profile of the heavy metals in a particulate sample collected from a power plant in Delhi and<br />
8<br />
Kanpur<br />
6 Installed capacity of the coal-fired thermal power plants in India. The largest circle is 4620MW. Note that 10<br />
many of these circles are overlapping due their close proximity to other TPPs, which is displayed in the<br />
inlays of the largest clusters in 2014<br />
7 Proposed expansions for the coal-fired TPPs in India 13<br />
8 Proposed locations of the coal-fired TPPs in India through 2030. The brown circles represent the TPPs<br />
14<br />
operational in 2014 (details in Figure 6) and the second colour in each map represents all the new plants<br />
and expansions expected after 2014 and likely to be operational in the representative year. The largest<br />
circle is 4620MW. Note that many of these circles are overlapping due their close proximity to other TPPs<br />
9 Pollution and health impact assessment schematics employed in this study 17<br />
10 Modelled annual average PM 2.5 and SO 2 concentrations (μg/m 3 ) from the coal-fired TPPs in India 18<br />
11 Percentage change in the PM 2.5 concentrations upon implementation of FGD (with 95% efficiency) in all<br />
the proposed TPPs<br />
23<br />
Tables<br />
E1 Anticipated health impacts of planned coal-fired TPPs and likely number of lives saved by operating a flue 2<br />
gas desulphurization unit at all the coal-fired TPPs in India<br />
1 Ranking of health ricks in India in 2010 3<br />
2 Summary of new emissions standards (all in mg/Nm 3 ) for the coal-fired Thermal Power Plants 6<br />
3 Estimated energy consumption and emissions for the coal-fired TPPs operational in 2014 15<br />
4 Estimated energy consumption and emissions for the coal-fired TPPs operational in 2030 15<br />
5 Anticipated percent increase in the installed capacity compared to 2014 by state 16<br />
6 Modelled state average PM 2.5 concentrations (indicative of the pollution load) due to the emissions from 19<br />
the coal-fired TPPs<br />
7 Anticipated health impacts due to ambient PM 2.5 pollution from the proposed coal-fired TPPs in India 20<br />
8 Estimated health impacts by state due to PM 2.5 pollution from the coal-fired TPPs in India 20<br />
9 Anticipated health impacts of planned coal-fired TPPs and likely number of lives saved by operating a flue<br />
gas desulphurization unit at all the coal-fired TPPs in India<br />
23<br />
Boxes<br />
1 Health Hazards of Emissions from the <strong>Coal</strong>-Fired Thermal Power Plants in India<br />
5<br />
(Press Information Bureau of India, August 2013)<br />
2 India pledges 24-hour electricity to all by 2019 13<br />
3 Sulphur Emission Control Systems 23
Acronyms and Abbreviations<br />
µg/m 3<br />
micro-grams per cubic meter<br />
1 crore 10,000,000<br />
3D<br />
Three-dimensional<br />
CAMx<br />
Comprehensive Air Quality Model with extensions<br />
CEA<br />
Central Electrical Authority<br />
CO<br />
Carbon Monoxide<br />
CO 2<br />
Carbon Dioxide<br />
COPD<br />
Cardio Obstructive Pulmonary Disorder<br />
CPCB<br />
Central Pollution Control Board<br />
ESP<br />
Electro Static Precipitator<br />
EU<br />
European Union<br />
FGD<br />
Flue Gas Desulphurisation<br />
GBD<br />
Global Burden of Disease<br />
GDP<br />
Gross Domestic Product<br />
GW<br />
Gigawatt<br />
Hg<br />
Mercury<br />
INR<br />
Indian Rupees<br />
km<br />
Kilometre<br />
Kwh<br />
Kilowatt-hour<br />
mg/Nm 3 milli-grams per normal cubic meter<br />
MoEF<br />
Minister of Environment, Forest, and Climate Change<br />
MW<br />
Megawatt<br />
MWh<br />
Megawatt-hour<br />
NCEP<br />
National Centre for Environmental Prediction<br />
NO x<br />
Nitrogen Oxides<br />
NTPC<br />
National Thermal Power Corporation<br />
PM<br />
Particulate Matter<br />
PM 10<br />
Particulate Matter (with aerodynamic diameter less than 10 µm)<br />
PM 2.5<br />
Particulate Matter (with aerodynamic diameter less than 2.5 µm)<br />
SO 2<br />
Sulphur Dioxide<br />
TPP<br />
Thermal Power Plants<br />
USA<br />
United States of America<br />
USD<br />
US Dollar<br />
VOC<br />
Non-methane Volatile Organic Compounds<br />
WHO<br />
World Health Organisation
EXECUTIVE SUMMARY<br />
As the 3 rd largest economy in the world with more than a billion people, the supply of power in<br />
India can scarcely keep up with demand. Across the country, households and industry suffer from<br />
regular power cuts, while more than 400 million lack access to even this unreliable supply. Given<br />
the energy scenario, the need to expand power generation capacity and deliver more electricity<br />
for India is immediate. To meet the growing electricity demand, the expansion of the coal-fired<br />
thermal power plants (TPPs) is the most likely scenario, which consequently also leads to an array<br />
of environmental and health impacts.<br />
Our key findings are<br />
Our last assessment, found significant impacts from the existing fleet of coal<br />
fired TPPs including between 80,000 and 115,000 deaths annually due to<br />
exposure linked their particulate emissions in 2011-12. Keeping that in<br />
perspective, this study is an attempt to help rationalise the discourse around<br />
expansion of coal power generation - with the goal of presenting the likely<br />
impacts of planned future coal-fired TPPs and the likely benefits of more<br />
stringent environment regulations on human health.<br />
• <strong>Coal</strong> generation capacity grows 300% - The total installed capacity is expected to<br />
increase three times from 159 GW in 2014 to 450 GW in 2030; under the proposed list of<br />
power plant projects. Largest (three fold) expansions are expected in the states of Andhra<br />
Pradesh, Odisha, Chhattisgarh, Bihar, and Jharkhand, all of which have coal reserves. A<br />
two fold expansion is expected in the states of Karnataka, Madhya Pradesh, Maharashtra,<br />
Punjab, Tamilnadu, and Uttar Pradesh<br />
• <strong>Coal</strong> consumption increases 200-300% - The total coal consumption is estimated<br />
to increase 2-3 times from 660 million tons/year to 1800 million tons/year; accordingly<br />
the CO 2 emissions from 1,590 million tons/year to 4,320 million tons/year<br />
• Air emissions at least double through 2030 - The PM, SO 2 , and NO x emissions will<br />
at least double in the same period. Most of the planned plants are supercritical- and ultra-<br />
TPPs, which tend to utilise less coal per MWh of electricity generated. With no emission<br />
regulations in place for SO 2 and NO x , these are assumed uncontrolled and allowed to<br />
release through the elevated stacks for dispersion<br />
• 100% increase in health impacts - The total premature mortality due to the<br />
emissions from coal-fired TPPs is expected to grow 2-3 times reaching 186,500 to 229,500<br />
annually in 2030. Asthma cases associated with coal-fired TPP emissions will grow to 42.7<br />
million by 2030<br />
• Limited emission standards for power plants - India currently has no standards<br />
for either SO 2 or NO x both of which drive a large portion of the estimated these health<br />
impacts – in the form of secondary suphates and secondary nitrates.<br />
1 | <strong>Coal</strong>-fired TPPs in India
Technology improvements worldwide have made electricity<br />
generation more efficient and hence cleaner and safer for the<br />
environment. Establishing standards, especially for SO 2 and<br />
NO x , at par with those observed in USA, EU, and China, and<br />
mandating the flue gas desulphurization (FGD) systems like<br />
limestone injection during the combustion process, wet FGD<br />
using limestone scrubbing, and high efficiency regeneration,<br />
could reduce the annual premature mortality by at least 50%<br />
every year.<br />
Anticipated health impacts of planned coal-fired TPPs and likely number<br />
of lives saved by operating a flue gas desulphurization unit at all the coalfired<br />
TPPs in India<br />
Premature mortality<br />
under no FGD<br />
Lives saved under 60%-<br />
and 95%- FGD efficiency<br />
Monetary benefits<br />
under FGD (crores)<br />
Year 2017 112,500 – 126,000 39,000 – 63,000 7,800 – 12,600<br />
Year 2020 132,500 – 153,500 45,000 – 74,000 9,000 – 14,800<br />
Year 2025 164,000 – 197,500 54,500 – 90,500 10,900 – 18,100<br />
Year 2030 186,500 – 229,500 61,000 – 101,500 12,200 – 20,300<br />
Our key recommendations are<br />
• Set emission standards - Immediate introduction of emission standards for SO 2 ,<br />
NO x , and Mercury for all the coal-fired TPPs<br />
• Mandate FGD at the plant level - Regulating emissions at the plant level by<br />
mandating FGD operations for all the existing, the newly commissioned, and the<br />
planned TPPs in India, to benefit from the associated reduction in the ambient PM<br />
pollution<br />
• Practice rigorous monitoring - Introduction of protocols to continuously monitor<br />
emissions at all stacks and make the data available to pollution control authorities, civil<br />
society, and the public, for further analysis, scrutiny of the emission loads, and<br />
verifications. At present, there is absolutely no data available publicly on emissions or<br />
the ambient concentrations surrounding the TPPs. The larger TPPs are suposedly<br />
equipped with continuous stack monitors; however this information is not open<br />
• Ensure transparency - Use of information to enforce the emission and pollution<br />
standards as necessary, pending the introduction of emission standards and protocols to<br />
release monitoring data<br />
• Improve EIA protocols – The environment clearance procedures require self<br />
assessment for only 10km radius of the TPPs; whilst the impacts are observed at much<br />
greater distances, considering the minimum stack height for a 500MW TPP is 275m.<br />
2 | <strong>Coal</strong>-fired TPPs in India
1. BACKGROUND<br />
The direct link between outdoor air pollution and human health has been extensively<br />
documented. Most notable of the health impacts resulting in premature deaths include chronic<br />
obstructive pulmonary disease, respiratory infections, heart diseases, strokes, and cancers of<br />
trachea, bronchitis, and lung. Of all the pollutants, the public health concerns in India are focused<br />
on particulate matter (PM) that contributes to a host of cardiopulmonary ailments and increasing<br />
the risk of premature death. Epidemiological studies conducted in India also highlighted the<br />
linkages between outdoor air pollution and premature mortality, hospital admissions, and<br />
asthma cases 1 .<br />
The global burden of disease (GBD) for 1990- Table 1: Ranking of health ricks in India in<br />
2010 quantified the trends of more than 200 2010 (GBD, 2012)<br />
causes of death and listed outdoor air pollution<br />
Health Risk Premature deaths<br />
among the top 10 risks for India, with the<br />
outdoor PM 2.5 and ozone pollution contributing<br />
to an estimated 695,000 premature deaths 2 .<br />
Dietary Risks<br />
High Blood Pressure<br />
Household air pollution<br />
1.622 million<br />
1.072 million<br />
1.022 million<br />
Smoking 1.008 million<br />
PM 2.5 refers to particulate matter less than<br />
Ambient PM pollution 0.627 million<br />
2.5μm in aerodynamic diameter. The ambient<br />
PM pollution was ranked 6 th High fasting plasma glucose 0.618 million<br />
in 1990 with<br />
Physical inactivity 0.436 million<br />
440,000 annual deaths, which moved to 5 th<br />
overall in 2010. The morbidity and mortality<br />
burden of outdoor air pollution is particularly<br />
Alcohol use<br />
Occupational risks<br />
Childhood underweight<br />
0.349 million<br />
0.342 million<br />
0.213 million<br />
costly in terms of work days lost, lost productivity, and loss in terms of gross domestic product<br />
(GDP), which was approximately USD 23.4 billion and 1.7% of national GDP in 2009 3 .<br />
Air quality is a cause for concern in India, with air pollutants including PM, sulphur dioxide (SO 2 ),<br />
nitrogen oxides (NO x ), carbon monoxide (CO), and ozone, often exceeding the national ambient<br />
air quality standards. According to the World Health Organisation (WHO), 37 cities from India<br />
feature in the top 100 world cities with the worst PM 10 pollution, and the cities of Delhi, Raipur,<br />
Gwalior, and Lucknow are listed in the top 10 (WHO, 2014) 4 . A similar assessment by WHO, in<br />
2011, listed 27 cities in the top 100. More than 100 cities under the national ambient monitoring<br />
program exceed the WHO guideline for PM 10 . The most commonly identified urban sources are<br />
1 Guttikunda et al. (2014) “Nature of air pollution, emission sources, and management in the Indian cities” @<br />
http://www.sciencedirect.com/science/article/pii/S1352231014005275<br />
2 The methodologies and a compilation of air pollution and health related studies worldwide, along with the results of the global burden<br />
of disease assessments for 1990-2010 are presented by the Institute for Health Metrics and Evaluation (IHME) @<br />
https://www.healthdata.org<br />
3 “An Analysis of Physical and Monetary Losses of Environmental Health and Natural Resources in India”, Policy Research Working<br />
Papers, WPS-6219, The World Bank, Washington DC, USA.<br />
4 The monitoring data is collected from the National Ambient Monitoring Program (NAMP), which collects 24-hour averages of PM10, SO2,<br />
and NO2, 2-3 times per week, at 342 manual stations in 127 cities. This network is operated, managed, and data is disseminated by the<br />
Central Pollution Control Board (CPCB).<br />
3 | <strong>Coal</strong>-fired TPPs in India
vehicles, manufacturing industries, diesel generator sets, construction activities, road dust, waste<br />
burning, combustion of oil, coal, and biomass in the households, and marine/sea salt.<br />
Figure 1: (a) Ambient PM 2.5 concentrations derived from the satellite observations 5 (b)<br />
Gridded population in India for 2011 6<br />
(a)<br />
(b)<br />
Only a handful of Indian cities have coal-fired thermal power plants (TPPs) within the city limits<br />
(for example Delhi, Chennai, Mumbai, and Ahmedabad), which otherwise tend to underestimate<br />
their contribution (and of coal combustion) to urban air pollution. The ambient PM 2.5<br />
concentrations (Figure 1a) in the Indo-Gangetic plain are high and this overlaps with the highest<br />
population density (Figure 1b) in the country. This region also has the largest number of brick<br />
kilns with old and inefficient combustion technology, using a mix of biomass and coal for<br />
combustion. The states of Bihar, West Bengal, Jharkhand, Odisha, and Chhattisgarh harbour the<br />
largest coal mines in the country, and a cluster of TPPs. Several of the large TPPs also exist in the<br />
states of Punjab, Haryana, Delhi, and Uttar Pradesh, making the north and north-eastern belt the<br />
most polluted. Using the OMI satellite data, Lu et al. (2013) reported that the annual average SO 2<br />
concentrations in coal-fired power plant regions of India increased by more than 60% between<br />
2005 and 2012 7 . The coal-fired TPPs contribute to ~50% of the total annual SO 2 emissions and<br />
~15% of the total annual PM 2.5 emissions in India 8 .<br />
An Impact assessment of the coal-fired TPPs in India, those operational in 2011, was conducted<br />
in 2012-13 9 . Following the methodology, this research study aims to present the likely impacts of<br />
5 Methodology on the satellite data retrievals and uncertainties is explained by van Donkelaar et al (2010). The report and data is<br />
available @ http://fizz.phys.dal.ca/~atmos/martin/?page_id=140<br />
6 Grid resolution is 0.25° and gridded data is obtained from GRUMP @ http://sedac.ciesin.columbia.edu and adjusted to the 2011 state<br />
totals from Census @ http://censusindia.gov.in<br />
7 Details on the satellite data retrieval procedures and analysis is presented in “OMI Observations of Inter-annual Increases in SO2<br />
Emissions from Indian <strong>Coal</strong>-Fired TPPs during 2005–2012” @ http://pubs.acs.org/doi/abs/10.1021/es4039648<br />
8 National emissions inventories for multiple years and for multiple sectors is compiled by IIASA as part of the GAINS-India program; and<br />
used for science and policy discussions. More details @ http://www.iiasa.ac.at<br />
9 More details of the study and methodology are available @ http://www.urbanemissions.info<br />
4 | <strong>Coal</strong>-fired TPPs in India
the proposed coal-fired TPPs to come online through 2030 and the likely benefits of more<br />
stringent environment regulations on human health.<br />
Box 1: Health Hazards of Emissions from the <strong>Coal</strong>-Fired Thermal Power Plants in India<br />
(Press Information Bureau of India, August 2013)<br />
Government is aware of the report titled “<strong>Coal</strong> kills- An assessment of death and disease caused by India’s dirtiest energy<br />
source” which was published in Dec 2012. The report shows that in 2011-2012, emission from Indian coal plants resulted in<br />
80,000 to 1,15,000 premature deaths and more than 20 million asthma cases from exposure to air pollution. The study<br />
quantified additional health impacts such as large number of cases of heart attacks, emergency room visits, hospital<br />
admission and lost workdays caused by coal based emissions. The study estimates that monetary cost associated with these<br />
health impacts exceeds Rs. 16,000 to 23,000 crores per year.<br />
Central Electricity Authority (CEA) has informed that Ministry of Power has constituted a Standing Committee on occupational<br />
health and safety of workers of TPPs. The committee has members from various stake holders. On the recommendations of<br />
the standing committee a task force was constituted which has submitted its report on 06/08/2013.<br />
Considering the impact of the emissions on the environment including human health, the central Pollution Control Board<br />
under Ministry of Environment and Forest has informed that following steps have been taken to prevent/minimize emissions<br />
from TPPs:<br />
• Developed emission and effluent standards for control of air & water pollution<br />
• To minimize dust generation, power plant has been directed to use beneficiated coal not having ash content more<br />
than 34% (low ash coal).<br />
• In order to mitigate problems related to flyash disposal such as land degradation, fugitive dust emission from ash<br />
ponds, flyash utilisation has been made mandatory since September 14, 1999.<br />
• Emphasis is giving to cleaner coal technology (like supercritical, Circulating fluidized Bed Combustion) while<br />
granting environmental clearance to new coal based TPPs.<br />
• Asking TPPs to install pollution control systems for control of SO2 emission on case to case basis wherever need is<br />
felt based on ambient air quality and sensitivity of area.<br />
• National Ambient Air Quality standards have been notified which are to be met by applying suitable control<br />
measures by the all air polluting industries including TPPs.<br />
This information was given by Union Minister of Health & Family Welfare Shri Ghulam Nabi Azad, in written reply to a question<br />
in the Rajya Sabha today.<br />
BN/HB (Release ID :98090)<br />
5 | <strong>Coal</strong>-fired TPPs in India
2. COAL-FIRED THERMAL POWER PLANTS in INDIA<br />
India is the 4 th largest consumer of electricity in the world, with coal as the primary fuel of choice<br />
for power generation and this will only get larger in the coming years. Most of the existing coalfired<br />
TPPs are based on conventional pulverized coal or fluidized bed combustion technology.<br />
Some newer projects plan to use supercritical- and ultra- steam conditions, which offer better<br />
performance ratios.<br />
Figure 2: (a) Sources of electricity in India, based on the installed capacity in 2013 and (b)<br />
Growth of installed power generation in India<br />
Source: Central Electrical Authority, 2013<br />
<strong>Coal</strong>-fired power comes with significant<br />
costs to environment and human health.<br />
The water runoff from coal washeries<br />
carries pollution loads of heavy metals that<br />
contaminate ground water, rivers, and<br />
lakes - thus affecting aquatic flora and<br />
fauna. Fly-ash residue and pollutants settle<br />
on soil contaminating areas and are<br />
Table 2: Summary of new emissions standards<br />
(all in mg/Nm 3 ) for the coal-fired Thermal<br />
Power Plants 10<br />
PM SO2 NO2 Mercury<br />
India a 50 - - -<br />
China b 30 100 100 0.03<br />
Australia b 50 - 500 -<br />
European Union b 50 200 200 -<br />
USA b 22.5 160 117 0.001<br />
especially harmful to agricultural activities. Most importantly for human health, combustion of<br />
coal releases emissions of SO 2 , NO x , PM, CO, VOCs, and various trace metals like mercury, into<br />
the air through stacks that can disperse this pollution over large areas. To date, the<br />
environmental regulations lag behind those observed in the developed countries like the United<br />
States, the European Union, China, and Japan, with no control regulations for SO 2 , NO x , and<br />
Mercury (Table 2). Given the plans to greatly expand the contribution of coal to the Indian power<br />
sector, it is vital that decision makers understand the hidden costs of air pollution from coal fired<br />
TPPs.<br />
10 Sources for the data are (a) http://cpcb.nic.in/Industry_Specific_Standards.php and (b) http://www.airclim.org/acidnews/china-newemission-standards-power-plants<br />
6 | <strong>Coal</strong>-fired TPPs in India
Figure 3: Summary of new emission standards for the coal-fired thermal power plants<br />
(zero listing = no standard)<br />
For SO 2 and NO x , there are no mandatory requirements to operate emission control equipment,<br />
except for specifications for stack heights, assuming that the emissions will be dispersed to<br />
farther distances and thus diluting the ambient concentrations. For example, MoEF requires all<br />
TPPs with generation capacity more than 500 MW to build a stack of 275m; those between 210<br />
MW and 500 MW to build a stack of 220 m; and those with less than 210 MW to build a stack<br />
based on the estimated SO 2 emissions rate (Q in kg/hr) and a thumb rule of height = 14*(Q) 0.3 .<br />
The stack heights for old TPPs ranged between 150 m and 220 m. Some of the new installations<br />
and extensions are equipped with low-NOx burners, with little details on their operational<br />
performance.<br />
PM is the only pollutant for which<br />
controls are widely applied. The<br />
standards for PM polluion were revised<br />
in 2013 to 50 mg/Nm 3 , which was<br />
standing at 150 mg/Nm 3 for the plants<br />
commissioned prior to 2013. A<br />
schematic of a coal-fired power plant is<br />
presented in Figure 4 that shows flue<br />
gas from the boilers at high<br />
temperature and velocity passing<br />
through heat exchangers to recycle the<br />
residual energy. This then enters the<br />
Figure 4: Simplified schematics of a coal-fired TPP<br />
7 | <strong>Coal</strong>-fired TPPs in India
particulate control equipment (ESPs and cyclone bag filters) for removal of entrained ash. ESPs<br />
are installed in all coal-fired TPPs in India. As removal efficiencies at ESPs are higher for coarse<br />
particles, most of the PM dispersing from the top of the stack is in the size range of respirable<br />
PM. The PM in the flue gas also contains high concentrations of heavy metals such as arsenic,<br />
lead, cadmium, mercury, copper, and zinc, which not only contributes to potential health hazard<br />
than the bottom ash, but also increases the resistivity and reduces the ESPs collection efficiency<br />
to as low as 98%. A composite of the share of heavy metals in samples collected at the TPPs in<br />
Delhi and Kanpur is presented in Figure 5.<br />
Figure 5: Source profile of the heavy metals in a particulate sample collected from a<br />
power plant in Delhi and Kanpur (CPCB, 2010) 11<br />
Besides flue gas PM emissions, fugitive dust from coal-handling plants and ash ponds (after the<br />
disposal from the plants) is a problem. According to the Central Electrical Authority, after the<br />
combustion and application of control equipment, ash collection at the TPPs ranged 70-80% of<br />
the total ash in the coal. It is assumed that the remaining particulates is dispersed from the stacks.<br />
An amendment notification from MoEF mandates that 100% of ash utilisation within four years<br />
of generation; at least 25% of ash utilisation in all brick kilns within 100km radius of TPPs; and all<br />
building construction within 100km for any coal-fired TPP to use 100% ash based bricks, blocks,<br />
11 These samples from the coal-fired TPPs in Delhi and Kanpur were collected and analysed as part of the particulate pollution source<br />
apportionment study in six cities, commissioned by the Ministry of Environment and Forests, and executed by the Central Pollution<br />
Control Board (2010). Details of the program and results are available @ http://cpcb.nic.in/Source_Apportionment_Studies.php<br />
8 | <strong>Coal</strong>-fired TPPs in India
and tiles 12 . To date, percentage of ash utilised in the construction industry is low - approximately<br />
13% used for brick manufacturing and other construction activities.<br />
For 2011-12, a study was conducted to assess the impact of the coal-fired TPPs in India on the<br />
ambient air quality and health 13 . In this study, we isolated the emissions from the coal-fired TPPs<br />
and estimated a premature mortality rate of 80,000 to 115,000 due to their contribution to the<br />
ambient PM 2.5 concentrations. This number does not include the impacts of the water run-off<br />
and soil contamination due to the release of heavy metals. Combined with a strong demand for<br />
reliable electricity and consistent shortage in supply, it is doubtful that pollution will be controlled<br />
absent strong regulation for the operational 111 coal-fired TPPs.<br />
The coal-fired TPPs operational in 2014 are presented in Figure 6. With so many TPPs<br />
commissioned in clusters, it is not easy to present them all in one figure without overlaps. Also<br />
presented in Figure 6 are inlays for four of major clusters.<br />
• The North India cluster is centered around the National Capital Region of Delhi (with a<br />
combined population of 22 million), with large TPPs supporting its electricity demand are<br />
located within 100km. Two large TPPs are in Jhajjar (Indira Gandhi TPP and Mahatma<br />
Gandhi TPP), one large power plant in Dadri (closet to the city) with a combination of gas<br />
and coal, one in Hisar (Rajiv Gandhi TPP); and some smaller TPPs operating on coal, oil,<br />
and gas. The remaining cluster consists of five TPPs supporting the needs in Punjab and<br />
one 1500MW TPP in Suratgrah (Rajasthan)<br />
• The Central India cluster around the coal mines of Chhattisgarh, Odisha, Jharkhand, and<br />
West Bengal, are the largest in the country. The Korba cluster and the Singrauli cluster<br />
have a combined generation capacity of more than 5000MW and 10000MW respectively;<br />
with the plants signing MoUs to supply electricity to the neighbouring states<br />
• The Kutch region, with its access to the largest ports, hosts the largest operational TPPs<br />
in the country. The Mundra cluster (state: Gujarat) has a combined generation capacity<br />
of 9620 MW between two privately run TPPs located within 5km of each other.<br />
• The Western Maharashtra region (Amravati, Tiroda, Parli, Warora, Chandarpur, and<br />
Bhusawai) and Telangana (Ramagundam and Kothagudam) are also hub to large TPPs<br />
nearest to the coal mines<br />
12 Press Information Bureau of India notifications #51345 July/31/2009 and #106550 on July/14/2014;<br />
and one notification from the archives (2003) “Use of fly ash made mandatory”<br />
@ http://pib.nic.in/archieve/lreleng/lyr2003/rjan2003/01012003/r010120033.html<br />
13 Press Information Bureau of India notification # 98090 on August/13/2013 and a press release in the New York times @<br />
http://india.blogs.nytimes.com/2013/03/22/indias-coal-power-plants-kill-tens-of-thousands-every-year-study-says<br />
9 | <strong>Coal</strong>-fired TPPs in India
Figure 6: Installed capacity of the coal-fired thermal power plants in India. The largest circle<br />
is 4620MW. Note that many of these circles are overlapping due their close proximity to<br />
other TPPs, which is displayed in the inlays of the largest clusters in 2014<br />
10 | <strong>Coal</strong>-fired TPPs in India
The main conclusions of 2011-12 study are the following<br />
• To date, the pollution standards exist only for ambient air quality and not for individual<br />
TPPs, which compromises the efforts to control any pollution. Only after standards are<br />
regulated at the plant level, can we proceed to the next steps of monitoring and<br />
enforcing, and reduce the impact of emissions from coal-fired TPPs<br />
• Going forward, coal-fired TPPs should be subjected to tighter emission standards,<br />
similar to those found in emerging economies (like China) and developed economies<br />
(like EU, Australia, and USA). For example, a mandate for installation of FGD systems for<br />
the existing 111 coal-fired TPPs could reduce the PM 2.5 concentrations significantly, by<br />
eliminating the formation of secondary sulphates and nitrates, and some additional<br />
benefits to the primary particulates. For 2011-12, if FGD was operational at all the<br />
plants, we estimate that 42,500 premature deaths (~55% of the estimated total for that<br />
period)<br />
• The efficiency improvement of existing older TPPs, irrespective of the boiler size, should<br />
become a starting point for reducing overall coal consumption and associated<br />
atmospheric emissions<br />
• The stack emissions can be monitored relatively easily as compared to non-point<br />
sources (such as vehicles, garbage burning, domestic burning, and fugitive dust). While,<br />
the larger TPPs are now equipped with continuous stack monitors, this information is<br />
not open to public, either for analysis or for scrutiny of the emission loads. This adds to<br />
the uncertainty of similar studies. Besides strengthening standards, newer policies are<br />
required for dissemination of information from the coal-fired TPPs<br />
• The environmental impact assessment procedures need to be revised, in order to<br />
include the health and environment damages due to long-range transport of pollution<br />
from the stacks, as high as 275m, and travelling the distances of more than 300km in<br />
less than 24 hours. Currently, the procedure require assessment for an area of 10km<br />
radius from the plants<br />
11 | <strong>Coal</strong>-fired TPPs in India
3. FUTURE COAL-FIRED POWER PLANTS in INDIA<br />
The power sector in India, has an installed capacity of 250GW (as of June, 2014); with 148 GW<br />
coming from coal 14 . In India, the supply of electricity lags behind the demand. According to the<br />
Central Electricity Authority, in 2010-11, of the 122 GW peak demand, only 110 GW was supplied<br />
– which amounted to a shortfall of 10%. A third of the population that lives in rural India does<br />
not have access to electricity. Even those with access in urban India have to endure frequent<br />
power cuts and load shedding, which results in use of in-situ diesel generator sets.<br />
Box 2: India pledges 24-hour electricity to all by 2019<br />
The Indian government estimates that it will need to spend around $250bn over the next five years in order to connect the<br />
entire nation to the grid. The country’s energy minister, Piyush Goyal, said $100bn of the new investment would be in<br />
renewables and $50bn in transmission, with the rest in other areas. “We can see a situation where we will have power for all<br />
businesses, all homes, all offices right through the length and breadth of India,” Mr Goyal said.<br />
The minister re-affirmed that output would be increased through improving the overall power mix. This includes greater use<br />
of renewables such as wind and solar, and a doubling of state-run <strong>Coal</strong> India’s mine output to 1 billion tonnes a year in the<br />
next five years to provide fuel for big new coal-fired TPPs starved of coal.<br />
India currently has 2.9 GW of solar electricity capacity and the government is ambitiously targeting a raise in that to 20 GW<br />
by 2022, with a new solar target of 100 GW within the next eight years.<br />
The FT reports that the government is however reluctant to invest to the same extent in nuclear power, without further<br />
analysis. Yet India’s existing long-term energy strategy also calls for adding up to 26 GW of nuclear power to help meet its<br />
electricity deficit, and companies from around the world, including Areva and Rosatom, as well as Japanese engineering giants<br />
are all hoping for a share.<br />
As it stands 53 million homes on the subcontinent are without power, with much reliance on diesel generators to produce<br />
electricity during lengthy power cuts. In the summer of 2012, the grid in northern India collapsed, leaving hundreds of millions<br />
of Indians without electricity for up to three days in the worst outage in history.<br />
Power Engineering, November 2014<br />
@ http://www.powerengineeringint.com/articles/2014/11/india-pledges-24-hour-electricity-to-all-by-2019.html<br />
An analysis by McKinsey 15 claims that India's demand for electricity may cross 300 GW, earlier<br />
than most estimates. To explain their estimates, they point to four reasons:<br />
• India's manufacturing sector is likely to grow faster than in the past<br />
• Domestic demand will increase more rapidly as the quality of life for more Indians<br />
improve<br />
• About 125,000 villages are likely to get connected to India's electricity grid<br />
• Blackouts and load shedding artificially suppresses demand; this demand will be sought<br />
as revenue potential by power distribution companies<br />
14 Central Electrical Authority, Monthly report, June 30 th , 2014 @ http://cea.nic.in/reports/monthly/inst_capacity/jun14.pdf<br />
15 “Powering India – The road to 2017”, McKinsey (2008) – Link @ http://en.wikipedia.org/wiki/Electricity_sector_in_India<br />
12 | <strong>Coal</strong>-fired TPPs in India
In 2011, Prayas Energy Group (Pune, India) listed that ~700 GW of power generation from coal,<br />
is in the pipeline, with the environmental clearances and project preparations at various stages;<br />
if come online will certainly meet the necessary demand for electricity in the industrial and<br />
domestic sector through 2030 16 . However, what is the impact of these future coal-fired TPPs on<br />
the ambient air quality and human health, given the lack of regulations in place to control the<br />
pollutants like PM, SO 2 , NO x , CO, and GHGs?<br />
The database of TPPs under<br />
Figure 7: Proposed expansions for the coal-fired TPPs in India<br />
construction, under advanced<br />
development, planning, and<br />
under consideration are<br />
binned for operations<br />
between 2014 to 2030; with<br />
their likeliness of being<br />
operational in 2017-18, 2020-<br />
21, 2025, and 2030. The<br />
temporal distribution of the<br />
TPPs is currently speculative<br />
based on the project<br />
documents and their project<br />
status. This status is<br />
dependent on resource, financial, and environmental viability for each plant. The plants with less<br />
probability of securing either of the required clearances are not included in the assessment.<br />
Having excluded these, the likely installed capacity at the end of 2014 is 159.1 GW and the<br />
estimated installed generation capacity for the years 2017, 2020, 2025, and 2030 are 231 GW,<br />
296 GW, 396 GW, and 458 GW, respectively; with new capacity of ~300GW between 2014 and<br />
2030. This is less than ~700 GW of generation capacity anticipated by Prayas (Pune, India), as a<br />
result of cancellations and withdrawals due to lack of either resource, financial, and<br />
environmental clearances. The future TPPs presented in Figure 8 for 2017-18, 2020-21, 2025, and<br />
2030 are not all established as new plants. Some of these are extensions at the existing TPPs. The<br />
circles in Figure 8 are overlapping with the existing and the new TPPs.<br />
16 Prayas Energy Group (Pune, India) “Thermal TPPs on the Anvil – Implications and Need for Rationalisation” @<br />
http://www.prayaspune.org/peg/publications/item/164-thermal-power-plants-on-the-anvil-implications-and-need-forrationalisation.html<br />
13 | <strong>Coal</strong>-fired TPPs in India
Figure 8: Proposed locations of the coal-fired TPPs in India through 2030. The brown circles<br />
represent the TPPs operational in 2014 (details in Figure 6) and the second colour in each<br />
map represents all the new plants and expansions expected after 2014 and likely to be<br />
operational in the representative year. The largest circle is 4620MW. Note that many of<br />
these circles are overlapping due their close proximity to other TPPs<br />
14 | <strong>Coal</strong>-fired TPPs in India
Table 3: Estimated energy consumption and emissions for the coalfired<br />
TPPs operational in 2014<br />
GW <strong>Coal</strong> PM 2.5 SO 2 NO x CO CO 2<br />
mil.tons ktons ktons ktons ktons mil.tons<br />
Andhra Pradesh 8.9 35 21 172 160 129 85<br />
Bihar 6.2 25 30 120 107 89 59<br />
Chhattisgarh 11.1 46 57 223 250 166 110<br />
Delhi 0.8 4 12 17 23 13 9<br />
Gujarat 15.9 63 107 309 275 231 152<br />
Haryana 6.0 25 15 124 165 92 61<br />
Jharkhand 6.2 27 28 129 172 97 64<br />
Karnataka 5.5 23 32 93 151 85 56<br />
Madhya Pradesh 12.4 51 30 250 281 186 123<br />
Maharashtra 21.3 87 78 373 449 316 209<br />
Odisha 11.0 47 36 229 305 171 113<br />
Punjab 4.7 20 11 95 117 71 47<br />
Rajasthan 7.4 30 62 148 167 111 73<br />
Tamilnadu 9.1 39 40 189 252 141 93<br />
Telangana 5.3 22 17 110 146 82 54<br />
Uttar Pradesh 15.3 65 64 317 423 237 156<br />
West Bengal 11.9 51 56 247 330 185 122<br />
Grand Total 159.1 660 695 3,147 3,774 2,402 1,584<br />
Table 4: Estimated energy consumption and emissions for the coal-fired<br />
TPPs operational in 2030<br />
Year GW <strong>Coal</strong> PM 2.5 SO 2 NO x CO CO 2<br />
mil.tons ktons ktons ktons ktons mil.tons<br />
Andhra Pradesh 37.1 141 94 687 514 513 338<br />
Assam 1.3 5 3 25 34 19 12<br />
Bihar 30.2 117 83 572 560 427 282<br />
Chhattisgarh 50.1 200 149 973 1,008 726 479<br />
Delhi 0.8 4 12 17 23 13 9<br />
Gujarat 37.7 143 173 699 557 522 344<br />
Haryana 6.6 28 16 135 170 101 67<br />
Jharkhand 29.4 113 93 553 511 412 272<br />
Karnataka 18.9 73 61 319 317 267 176<br />
Kerala 1.3 5 3 23 11 17 11<br />
Madhya Pradesh 34.6 138 87 673 653 502 331<br />
Maharashtra 42.4 171 144 764 860 622 410<br />
Meghalaya 0.8 3 2 15 20 11 7<br />
Odisha 44.3 173 151 682 810 631 416<br />
Punjab 11.0 44 26 217 228 162 107<br />
Rajasthan 14.9 58 101 282 235 210 139<br />
Tamilnadu 26.9 104 92 453 461 379 250<br />
Telangana 10.0 39 35 192 197 143 95<br />
Uttar Pradesh 36.3 143 110 699 715 522 344<br />
West Bengal 23.2 96 82 467 558 349 230<br />
Grand Total 457.9 1,799 1,514 8,447 8,440 6,547 4,318<br />
15 | <strong>Coal</strong>-fired TPPs in India
The energy and emissions outlook through 2030 is<br />
• The total installed capacity is expected to increase three times from 159 GW in 2014 to<br />
450 GW in 2030; under the proposed and active list of power plant projects<br />
• Largest (three fold) expansions are expected in the states of Andhra Pradesh, Odisha,<br />
Chhattisgarh, Bihar, and Jharkhand, all of which have coal reserves. A two fold expansion<br />
is expected in the states of Karnataka, Madhya Pradesh, Maharashtra, Punjab, Tamilnadu,<br />
and Uttar Pradesh<br />
• The total coal consumption is estimated to increase 2-3 times from 660 million tons/year<br />
to 1800 million tons/year; accordingly the CO 2 emissions from 1,590 million tons/year to<br />
4,320 million tons/year<br />
• The PM, SO 2 , and NO x emissions will at least double in the same period. The improvement<br />
in the rate of increase in the emissions is primarily due to the introduction of supercriticaland<br />
ultra- TPPs in the future, which tend to utilise less coal per MWh of electricity<br />
generated. With no emission regulations in place for SO 2 and NO x , these are assumed<br />
uncontrolled and allowed to release at the elevated stacks for dispersion<br />
Table 5: Anticipated percent increase in the installed<br />
capacity compared to 2014 by state<br />
2014 2017 2020 2025 2030<br />
(GW)<br />
Andhra Pradesh 8.9 25% 153% 243% 319%<br />
Assam 100% 100% 100% 100%<br />
Bihar 6.2 23% 97% 352% 390%<br />
Chhattisgarh 11.1 131% 201% 314% 351%<br />
Delhi 0.8<br />
Gujarat 15.9 20% 20% 80% 137%<br />
Haryana 6.0 11%<br />
Jharkhand 6.2 92% 113% 349% 370%<br />
Karnataka 5.5 73% 110% 230% 245%<br />
Kerala 100% 100%<br />
Madhya Pradesh 12.4 72% 142% 168% 178%<br />
Maharashtra 21.3 30% 76% 92% 99%<br />
Meghalaya 100% 100%<br />
Odisha 11.0 82% 147% 173% 301%<br />
Punjab 4.7 97% 97% 125% 136%<br />
Rajasthan 7.4 26% 47% 102% 102%<br />
Tamilnadu 9.1 36% 54% 100% 195%<br />
Telangana 5.3 87% 89%<br />
Uttar Pradesh 15.3 19% 41% 88% 137%<br />
West Bengal 11.9 23% 74% 74% 94%<br />
Grand Total 159.1 45% 86% 149% 188%<br />
16 | <strong>Coal</strong>-fired TPPs in India
What are the anticipated changes in the contribution of coal-fired TPPs to ambient pollution?<br />
Following the methodologies utilised in the previous assessments, the emissions from the future<br />
coal-fired TPPs through 2030 are also assessed for their impacts on the human health, due to the<br />
outdoor air pollution from the primary and secondary PM 2.5 pollution.<br />
Figure 9: Pollution and health impact assessment schematics employed in this study<br />
The atmospheric dispersion modeling of the emissions from all the coal-fired TPPs was<br />
conducted, following the above schematic and using the ENVIRON - Comprehensive Air Quality<br />
Model with Extensions (CAMx), an Eulerian photochemical dispersion model, suitable for<br />
integrated assessments of gaseous and particulate air pollution. The model formulation,<br />
advection and scavenging schematics, chemical solvers, and gas-to-aerosol conversion<br />
mechanisms 17 .<br />
The most important advantage of CAMx is the use of 3D meteorology and independently control<br />
plume rise and emission release point for each power plant, according to the stability profile at<br />
the plants location. The meteorological data (3D wind, temperature, pressure, relative humidity,<br />
and precipitation fields) is derived from the National Center for Environmental Prediction 18 , a<br />
global reanalysis database and processed through WRF 3.5.1 meteorological model at 1 hour<br />
temporal resolution 19 . The horizontal resolution of the analysis is 0.25° grid (approximately 25km<br />
x 25km grids). The vertical resolution of the model extends to 10.5km stretched over 28 layers,<br />
with the lowest layer designated at 30m and 15 layers within 1km to advance vertical advection<br />
closer to the ground level.<br />
17 The model utilises full gas phase chemistry with 217 reactions and 114 species; with two mode coarse/fine PM fractions including gas<br />
to aerosol conversions, for SO2 to sulphates, NOx to nitrates, and VOCs to secondary organic aerosols (SOA). The removal processes<br />
include dry deposition schemes using an updated approach with 26 landuse patterns and wet deposition due to predominant<br />
meteorological conditions. More details on the model architecture, manual, and operational instructions are available @<br />
http://www.camx.com.<br />
18 NCEP operational meteorological fields are available @ http://rda.ucar.edu/datasets/ds083.2/index.html<br />
19 The Weather Research and Forecasting (WRF) model is a state-of-the-art meteorological modeling system to generate CAMx<br />
dispersion model ready data for chemical transport modeling at multiple scales. More details on the model architecture, manual, and<br />
operational instructions are available @ http://wrf-model.org/index.php<br />
17 | <strong>Coal</strong>-fired TPPs in India
Figure 10: Modelled annual average PM 2.5 and SO 2 concentrations<br />
(μg/m 3 ) from the coal-fired TPPs in India<br />
18 | <strong>Coal</strong>-fired TPPs in India
While the impact of the emissions from the TPPS are felt within 300km of the stacks, under windy<br />
conditions their influence can be tracked to distances as far as 500km from the source region.<br />
Major cities in the Korba region are Ranchi, Jamshedpur, Rourkela, Jabalpur, Nagpur, and Raipur<br />
(capital of Chhattisgarh); Major cities in the Mundra region are Jamnagar (major industrial port),<br />
Rajkot, and Ahmedabad (300km away, with two TPPs of 1000MW in the city); The city of Delhi<br />
with large TPPs within 100km of radius; experience the impact of the emissions from the coalfired<br />
TPPs, though most of these cities do not host one in their administrative boundaries. The<br />
phenomenon of long range transport of these emissions released at stacks as high as 275m was<br />
illustrated in the form of 24hr forward trajectories, which is currently not accounted in the<br />
environmental impact assessments. The collective impact of the TPPs over each state is<br />
presented in Table 6, as population weighted concentrations, which is indicative of the pollution<br />
load observed in each state, irrespective of the size of the installed capacity in that state.<br />
Table 6: Modelled state average PM 2.5 concentrations (indicative of the<br />
pollution load) due to the emissions from the coal-fired TPPs<br />
2017 2020 2025 2030<br />
Andhra Pradesh 4.9 ± 0.9 (8.5) 6.1 ± 1.1 (9.8) 7.5 ± 1.3 (11.6) 8.4 ± 1.5 (13)<br />
Arunachal Pradesh 1.6 ± 0.3 (2.0) 2.0 ± 0.4 (2.4) 2.5 ± 0.5 (3.0) 2.9 ± 0.6 (3.5)<br />
Assam 2.1 ± 0.3 (2.6) 2.6 ± 0.4 (3.2) 3.3 ± 0.5 (4.1) 3.8 ± 0.6 (4.6)<br />
Bihar 3.7 ± 1 (6.0) 4.3 ± 1.2 (6.5) 5.5 ± 1.7 (7.7) 6.1 ± 1.9 (8.8)<br />
Chhattisgarh 6.6 ± 0.9 (12.7) 8.0 ± 1.0 (14.0) 9.6 ± 1.1 (16.0) 10.6 ± 1.2 (16.9)<br />
Delhi 4.1 ± 1 (5.8) 4.3 ± 1.0 (6.0) 4.7 ± 1.0 (6.4) 5.0 ± 1.0 (6.8)<br />
Goa 3.6 ± 0.1 (3.8) 4.4 ± 0.1 (4.6) 5.4 ± 0.1 (5.6) 6.0 ± 0.1 (6.2)<br />
Gujarat 3 ± 0.7 (5.7) 3.3 ± 0.8 (6.2) 3.9 ± 0.9 (7.0) 4.2 ± 1 (7.5)<br />
Haryana 3.3 ± 0.7 (5.8) 3.5 ± 0.7 (6.0) 3.9 ± 0.8 (6.4) 4.2 ± 0.8 (6.8)<br />
Himachal Pradesh 1.4 ± 0.4 (2.1) 1.5 ± 0.4 (2.2) 1.8 ± 0.5 (2.5) 1.9 ± 0.6 (2.7)<br />
Jammu & Kashmir 0.9 ± 0.2 (1.4) 1.0 ± 0.3 (1.5) 1.2 ± 0.3 (1.8) 1.2 ± 0.3 (1.9)<br />
Jharkhand 5.2 ± 0.7 (10.1) 6.2 ± 0.9 (11.5) 8.0 ± 0.9 (13.3) 8.8 ± 0.9 (14.3)<br />
Karnataka 3.3 ± 0.8 (5.5) 4.1 ± 1.0 (6.4) 5.1 ± 1.2 (7.5) 5.7 ± 1.3 (8.2)<br />
Kerala 1.9 ± 0.2 (2.6) 2.3 ± 0.3 (3.2) 2.9 ± 0.4 (4.0) 3.3 ± 0.4 (4.5)<br />
Madhya Pradesh 3.7 ± 0.9 (8.2) 4.4 ± 1.2 (8.7) 5.2 ± 1.4 (10.0) 5.6 ± 1.5 (10.8)<br />
Maharashtra 4.4 ± 0.9 (9.3) 5.2 ± 1.1 (10.6) 6.3 ± 1.3 (12.1) 6.8 ± 1.4 (12.9)<br />
Manipur 2.4 ± 0.1 (2.6) 2.9 ± 0.1 (3.2) 3.7 ± 0.2 (4) 4.1 ± 0.2 (4.5)<br />
Meghalaya 2.4 ± 0.1 (2.8) 2.9 ± 0.1 (3.3) 3.8 ± 0.2 (4.4) 4.3 ± 0.2 (5.0)<br />
Mizoram 2.5 ± 0.1 (2.6) 3.1 ± 0.1 (3.2) 3.9 ± 0.1 (4) 4.4 ± 0.1 (4.5)<br />
Nagaland 2.1 ± 0.1 (2.4) 2.6 ± 0.2 (2.9) 3.2 ± 0.2 (3.7) 3.7 ± 0.2 (4.2)<br />
Odisha 6.4 ± 0.6 (10.1) 8.1 ± 0.7 (11.5) 10.1 ± 0.9 (13.6) 11.2 ± 0.9 (15.0)<br />
Punjab 1.9 ± 0.3 (2.7) 2.1 ± 0.3 (2.8) 2.4 ± 0.4 (3.2) 2.6 ± 0.4 (3.4)<br />
Rajasthan 2.4 ± 0.6 (6.3) 2.7 ± 0.7 (7.6) 3.1 ± 0.8 (8.1) 3.3 ± 0.8 (8.2)<br />
Sikkim 1.4 ± 0.3 (1.6) 1.7 ± 0.4 (1.9) 2.1 ± 0.5 (2.4) 2.3 ± 0.6 (2.6)<br />
Tamilnadu 2.6 ± 0.5 (5.2) 3.1 ± 0.7 (5.6) 3.9 ± 0.8 (6.3) 4.4 ± 0.9 (6.8)<br />
Tripura 2.6 ± 0.1 (2.8) 3.2 ± 0.1 (3.4) 4.2 ± 0.1 (4.4) 4.7 ± 0.2 (5.0)<br />
Uttar Pradesh 3.2 ± 1.1 (7.4) 3.6 ± 1.4 (8.6) 4.3 ± 1.6 (10.0) 4.7 ± 1.8 (10.8)<br />
Uttarakhand 1.4 ± 0.3 (1.8) 1.6 ± 0.4 (2.0) 1.9 ± 0.4 (2.3) 2.0 ± 0.5 (2.5)<br />
West Bengal 6.0 ± 1.6 (12.9) 7.1 ± 1.9 (14.1) 8.8 ± 2.3 (16.0) 9.7 ± 2.6 (17.0)<br />
The concentrations are in μg/m 3 and the data represents - population weighted state average concentration ± standard deviation of<br />
concentrations for all grids covering the state and (in the brackets - maximum concentration among the grids covering the state)<br />
The model grid size is 0.25 degrees (~25km x 25km). Because of this spatial coverage, these numbers cannot be directly compared to<br />
the data from the monitoring stations, which only represent their immediate vicinity.<br />
19 | <strong>Coal</strong>-fired TPPs in India
What are the anticipated health impacts of the coal-fired TPPs?<br />
Of all the pollutants, the public health<br />
concerns are focused on PM, which<br />
contributes to a host of respiratory and<br />
cardiopulmonary ailments. Using the<br />
established dose-response functions<br />
from the GBD assessments 20 , health<br />
impacts of the emissions from the coalfired<br />
TPPs in India, as binned for the years<br />
2017-18, 2020-21, 2025, and 2030<br />
were estimated, utilising the<br />
modeled PM 2.5 concentrations and<br />
gridded population are presented<br />
in Table 7. The total premature<br />
mortality due to the emissions from<br />
coal-fired TPPs is expected to grow<br />
2-3 times reaching 186,500 to<br />
229,500 annually in 2030 and the<br />
asthma cases associated with coalfired<br />
TPP emissions will grow to<br />
42.7 million by 2030.<br />
Air pollution knows neither political<br />
nor administrative boundaries. The<br />
emissions from the high stacks also<br />
find their way into the states with<br />
limited generation capacity or no<br />
generation capacity, which is<br />
evident from the extracts of the<br />
health burden assessments at the<br />
state level in Table 8. The most<br />
populated states of Maharashtra,<br />
Uttar Pradesh, Bihar, Andhra<br />
Pradesh, (including Telangana),<br />
Odisha, Madhya Pradesh, and West<br />
Table 7: Anticipated health impacts due to<br />
ambient PM 2.5 pollution from the proposed coalfired<br />
TPPs in India<br />
Premature mortality Asthma attacks<br />
Year 2017-18 112,500 – 126,000 23.4 million<br />
Year 2020-21 132,500 – 153,500 28.4 million<br />
Year 2025 164,000 – 197,500 36.7 million<br />
Year 2030 186,500 – 229,500 42.7 million<br />
Table 8: Estimated health impacts by state due to<br />
PM 2.5 pollution from the coal-fired TPPs in India<br />
2017 2020 2025 2030<br />
Andhra Pradesh 9,870 12,170 15,170 17,510<br />
Arunachal Pradesh 70 90 110 130<br />
Assam 1,780 2,160 2,800 3,300<br />
Bihar 9,450 11,070 14,410 16,410<br />
Chhattisgarh 3,870 4,610 5,600 6,340<br />
Delhi 1,520 1,640 1,880 2,090<br />
Goa 120 140 180 200<br />
Gujarat 4,300 4,880 5,890 6,690<br />
Haryana 2,080 2,260 2,630 2,940<br />
Himachal Pradesh 280 300 370 410<br />
Jammu & Kashmir 360 400 480 530<br />
Jharkhand 4,120 4,940 6,340 7,190<br />
Karnataka 5,170 6,340 7,940 9,160<br />
Kerala 1,660 2,000 2,530 2,980<br />
Madhya Pradesh 6,790 7,970 9,700 10,940<br />
Maharashtra 11,580 13,860 16,870 19,010<br />
Manipur 180 220 280 330<br />
Meghalaya 190 230 300 350<br />
Mizoram 70 90 110 130<br />
Nagaland 130 160 200 230<br />
Odisha 6,100 7,560 9,380 10,740<br />
Punjab 1,470 1,600 1,920 2,140<br />
Rajasthan 4,340 4,860 5,800 6,510<br />
Sikkim 30 30 40 50<br />
Tamilnadu 5,080 6,110 7,650 9,020<br />
Tripura 200 240 320 370<br />
Uttar Pradesh 16,470 18,740 22,870 26,000<br />
Uttarakhand 390 440 540 610<br />
West Bengal 12,360 14,470 18,060 20,440<br />
Bengal, which also harbour the largest clusters of the power plants are listed with the most<br />
number of premature deaths associated with the emissions from coal-fired TPPs. The<br />
northeastern states experience the effects of long-range transport.<br />
20 The methodologies, a compilation of air pollution and health related studies worldwide, the dose-response functions and linked<br />
parameterisation to conduct health impact analysis, and the results of the global burden of disease assessments for 1990-2010 are<br />
presented by the Institute for Health Metrics and Evaluation (IHME) @ https://www.healthdata.org<br />
20 | <strong>Coal</strong>-fired TPPs in India
4. ROLE of FLUE GAS DESULPHURISATION<br />
Even with 55% of the installed coal-based generation capacity, there is a conspicuous lack of<br />
regulations for SO 2 emissions, which does not mandate the TPPs to operate any control<br />
equipment. Only four coal-fired TPPs in India operate flue gas desulphurization (FGD) units and<br />
among those to be commissioned through 2030, only 7 TPPs are listed to have FGD. The ones<br />
currently operating a FGD are (a) Tata power in Trombay (in Mumbai) (b) BSES/Reliance at<br />
Dahanu (western Maharashtra) (c) Jindal (JSW) TPP at Ratnagiri (southwestern Maharashtra) and<br />
(d) Udupi TPP (coastal Karnataka). At the remaining coal-fired TPPs, the emissions are dispersed<br />
from the stack.<br />
Box 3: Sulphur Emission Control Systems<br />
The sulphur emission control systems could range from in furnace control via limestone injection, wet scrubbing of flue gas,<br />
to capturing SO 2 in the flue gas through industrial processes.<br />
Limestone Injection - is an in-furnace process, where the crushed coal and limestone are passed together into the boiler as<br />
a fluidized mixture with hot air. The sulphur from combustion gases then combines with the limestone to form a solid<br />
compound, rather than being released as SO 2 in the flue gas. This is a low capital cost, low feed rate, and low operating cost<br />
technology with, co-benefits of mercury control and capture, during the coal burning process. This technology achieves<br />
emission reduction rates of 50-60%, making it an attractive option. These technologies require a high sorbent-to-sulphur<br />
ratio to achieve sufficient reduction rates and consequently, also produce large amounts of waste material (solids other than<br />
ash from the boilers), the disposal of which faces increasing difficulties.<br />
Wet Flue Gas Desulphurization - is the most commonly used process with typical sulphur removal rates of 90% at moderate<br />
costs. This method includes application of wet limestone scrubbing or a spray dryer process on the flue gas, after the<br />
combustion, to form gypsum as a by-product. A wet FGD flue gas treatment system is usually located after removal of PM via<br />
an electrostatic precipitator (ESP) and the cleaned gas is discharged to the stack for further dispersion. Gypsum can be used,<br />
for producing building material.<br />
High Efficiency Regeneration - process is a relatively expensive compared to the other two processes and produces SO 2 rich<br />
gas (~97%) which can be used as raw input in chemical industry to produce sulphuric acid or even elementary sulphur. Caustic<br />
soda (sodium hydroxide) is used as sorbent, which is regenerated to keep the sorbent losses to the minimum. Typical sulphur<br />
removal rate of more than 98% is possible, along with tons of commercial by-products.<br />
In India, only three coal-fired TPPs in Maharashtra and one in Karnataka operate FGD systems.<br />
According to the Ministry of Environments and Forests, installation of FGD is in process at NTPC<br />
Bongaigaon (Assam), NTPC Vindhyachal stage-V (Uttar Pradesh), and Adani Power Mundra Ph-III<br />
(Gujarat) (PIB, 2012).<br />
The Trombay TPP (TTPP) (in Mumbai) uses sea water’s natural alkalinity to scrub SO 2 from the<br />
flue gas. After neutralisation with sea water from the cooling water heat exchanger, the effluent<br />
is discharged into the sea. The removal efficiency is estimated at 85-90%. Because of the use of<br />
sea water for scrubbing (and no additional sorbent), the designing and operations are performed<br />
at the low cost. A disadvantage, however, is that the pollution is discharged into the sea, which<br />
in the long run leads to marine contamination.<br />
21 | <strong>Coal</strong>-fired TPPs in India
The Dahanu TPP (DTPP), started its commercial operation in 1996. As part of their consent and<br />
environmental clearance conditions, they were required to install a FGD system for<br />
environmental safety and protection and for the well-being of the people of Dahanu. However,<br />
the FGD was only installed after an order dated 12 th May 1999 was passed by the Bombay High<br />
Court. This 2x250 MW plant uses 80% local coal from the Korba mining areas (Chhattisgarh) and<br />
remaining 20% imported from Indonesia and South Africa. DTPP also utilises sea water for<br />
scrubbing and cooling in its FGD plant.<br />
The 2x600 MW Udupi TPP (UTPP) (near Mangalore, on the west coast), started its commercial<br />
operations in 2010 and operates limestone injection and gypsum production system, to control<br />
SO 2 emissions. This FGD technology is a zero discharge system utilising all wastewater in the<br />
system, thus reducing the need for fresh water and eliminating waste disposal costs.<br />
According to Prayas Energy Group 21 , only 7 plants with a total of 5448 MW capacity, or just 3.2%<br />
of the total coal-fired thermal power capacity that has been granted environmental clearance,<br />
have a provision for installing and operating a FGD. With no mandatory requirements, in all the<br />
proposed TPPs, the only condition stipulated is that space must be provided for the installation<br />
of a FGD plant, if required in the future.<br />
So, if FGDs are in fact mandated for all the future TPPs in India, what can we expect?<br />
An immediate benefit is for the human health. The share of the secondary sulphates contributing<br />
to the ambient PM 2.5 ranges up to 40% and can be as high as the 60% for the denser clusters. By<br />
controlling sulphur emissions either during the combustion, which can achieve up to 60%<br />
removal or post combustion, which can achieve up to 98% removal, the overall health impacts<br />
due to the coal-fired TPPs can be reduced accordingly.<br />
For example, for 2011, the health impacts calculated for the modeled PM 2.5 pollution from the<br />
coal fired TPPs, ranged between 80,000 and 115,000 per year. With application of FGD systems<br />
for all these TPPs, this could have been reduced by at least 26,000 (for 60% removal efficiency)<br />
or 38,000 (for 95% removal efficiency). Even a conservative value of INR 2,000,000<br />
(approximately USD 40,000) per life lost, based on the average life insurance policy’s issued in<br />
India, the estimated benefits range between INR 5,100 to 7,600 crores (approximately USD 0.9<br />
to 1.3 billion) annually, enough to justify the costs of implementing and operating a FGD at every<br />
existing coal-fired power plant. For the operational coal-fired TPPs and the proposed coal-fired<br />
TPPs, the benefits of operating a FGD are at large, and only require a mandate from the Ministry<br />
of Environment, Forests, and Climate Change, to reduce this burden.<br />
21 Prayas Energy Group (Pune, India) “Thermal TPPs on the Anvil – Implications and Need for Rationalisation” @<br />
http://www.prayaspune.org/peg/publications/item/164-thermal-power-plants-on-the-anvil-implications-and-need-forrationalisation.html<br />
22 | <strong>Coal</strong>-fired TPPs in India
Table 9: Anticipated health impacts of planned coal-fired TPPs and likely<br />
number of lives saved by operating a flue gas desulphurization unit at all<br />
the coal-fired TPPs in India<br />
Premature mortality<br />
under no FGD<br />
Lives saved under 60%-<br />
and 95%- FGD efficiency<br />
Monetary benefits<br />
under FGD (crores)<br />
Year 2017 112,500 – 126,000 39,000 – 63,000 7,800 – 12,600<br />
Year 2020 132,500 – 153,500 45,000 – 74,000 9,000 – 14,800<br />
Year 2025 164,000 – 197,500 54,500 – 90,500 10,900 – 18,100<br />
Year 2030 186,500 – 229,500 61,000 – 101,500 12,200 – 20,300<br />
Figure 11: Percentage change in the PM 2.5 concentrations upon implementation of FGD (with 95%<br />
efficiency) in all the proposed TPPs<br />
The co-benefits of a FGD system extend to other pollutants. For example, in the wet FGD process,<br />
the particulate matter is also trapped in the sorbents, resulting in further removal of the PM<br />
emissions. The FGD system is applied after the flue gas passes through an ESP, which is known to<br />
deliver up to 99% PM removal efficiency, which is further improved when the flue gas passes<br />
through a post-combustion FGD system. Given the volume of the coal consumed in India and the<br />
ash content, even a fraction of improvement in the PM removal efficiency will result in large<br />
benefits for ambient PM concentrations and health impacts.<br />
23 | <strong>Coal</strong>-fired TPPs in India
5. IN RETROSPECT<br />
To meet the growing electricity demand in India’s urban and rural regions, the expansion of the<br />
coal-fired TPPs is the most likely scenario, which also leads to an array of health impacts. There<br />
is growing evidence in the scientific community on the health impacts associated with the air<br />
pollution from the coal-fired TPPs, reviewed and published as part of the GBD assessments. The<br />
technology improvements worldwide are also showing ways to make the electricity generation<br />
cleaner and safer for the environment. Keeping that in perspective, the conclusions of this study<br />
are the following<br />
Benefits of mandating FGD for the existing and the newly commissioned coal-fired TPPs is<br />
obvious. This is not only to reduce the emission loads at the plants for SO 2 and NO x , but also to<br />
arrest the formation of the secondary sulphates and secondary nitrates at the regional level,<br />
which form due to atmospheric chemical reactions downwind of the source regions; and further<br />
add to the overall health impacts. A conservative estimate, in terms of lives saved, of operating<br />
a FGD, at all the plants through 2030 is upwards of 50%.<br />
To date, the pollution standards for SO 2 and NO x emissions exist only for ambient air quality,<br />
measured at select locations in major cities, and not for individual TPPs. The same cities also<br />
implemented interventions to reduce the SO 2 emissions, such as low-sulfur diesel and relocation<br />
of the heavy industries, which resulted in the reduction of the SO 2 ambient concentrations in the<br />
cities, as measured at the select monitoring locations. This tends to give a false impression that<br />
the SO 2 emissions and the SO 2 ambient concentrations are dropping across the country. Solution<br />
to this issue is a two step process (a) emission standards need to be regulated at the TPPs, which<br />
can lead to implementation of any form of the FGDs discussed in this report and (b) only after<br />
the standards are regulated at the plant level, can we proceed to the next steps of monitoring<br />
and enforcing, and reduce the impact of emissions from coal-fired TPPs.<br />
The environmental impact assessment procedures are archaic and need to be revised, in order<br />
to include the health and environment damages due to long-range transport of pollution from<br />
the coal-fired TPP stacks, as high as 275m. Currently, the procedure requires assessment for an<br />
area of 10km radius from the plants. Given the stack height, stack diameter, exit temperature,<br />
and exit velocity of the flue gas at most of these TPPs, these emissions tend to travel farther,<br />
more than 300km in less than 24 hours, which means that the stipulated 10km radius does not<br />
capture the true nature of the impact of the TPPs on environment and health.<br />
The newly commissioned TPPs and the proposed TPPs are expected to operate at higher<br />
performance levels, than those observed in the past, and thus reducing the coal consumption<br />
levels per MWh. The efficiency improvement of the older TPPs, irrespective of the boiler size,<br />
should become a starting point for reducing overall coal consumption and associated<br />
atmospheric emissions.<br />
24 | <strong>Coal</strong>-fired TPPs in India
The stack emissions can be monitored relatively easily as compared to non-point sources (such<br />
as vehicles, garbage burning, domestic burning, and fugitive dust). While, the larger TPPs are now<br />
required to operate continuous stack monitors, this information is not open to public, either for<br />
analysis or for scrutiny of the emission loads. This adds to the uncertainty of similar studies.<br />
Besides strengthening standards, new policies are required for dissemination of information from<br />
the coal-fired TPPs. The Central Pollution Control Board operates and maintains website to<br />
collate and disseminate the information from the continuous monitorng stations in the cities. A<br />
similar platform or the same platform should be utilised to collate and disseminate information<br />
from the coal-fired TPPs in real time.<br />
25 | <strong>Coal</strong>-fired TPPs in India
RELEVANT REFERENCES<br />
Human Health<br />
Balakrishnan, K., Ganguli, B., Ghosh, S., Sambandam, S., Roy, S., Chatterjee,<br />
A., 2013. A spatially disaggregated time-series analysis of the shortterm<br />
effects of particulate matter exposure on mortality in Chennai,<br />
India. Air Quality, Atmosphere & Health 6, 111-121.<br />
Bell, M.L., Davis, D.L., Gouveia, N., Borja-Aburto, V.H., Cifuentes, L.A., 2006.<br />
The avoidable health effects of air pollution in three Latin American<br />
cities: Santiago, São Paulo, and Mexico City. Environmental Research<br />
100, 431-440.<br />
CBHI, 2010. National Health Profile 2010, Central Bureau of Health<br />
Intelligence, Government of India, New Delhi, India.<br />
Chhabra, S.K., Chhabra, P., Rajpal, S., Gupta, R.K., 2001. Ambient air<br />
pollution and chronic respiratory morbidity in Delhi. Archives of<br />
Environmental Health 56, 8.<br />
Hart, J.E., Garshick, E., Dockery, D.W., Smith, T.J., Ryan, L., Laden, F., 2011.<br />
Long-term ambient multipollutant exposures and mortality.<br />
American journal of respiratory and critical care medicine 183, 73-78.<br />
IHME, 2013. The Global Burden of Disease 2010: Generating Evidence and<br />
Guiding Policy. Institute for Health Metrics and Evaluation, Seattle,<br />
USA.<br />
Ostro, B., 2004. Outdoor air pollution. WHO Environmental Burden of<br />
Disease Series.<br />
Pande, J.N., Bhatta, N., Biswas, D., Pandey, R.M., Ahluwalia, G.,<br />
Siddaramaiah, N.H., Khilnani, G.C., 2002. Outdoor air pollution and<br />
emergency room visits at a hospital in Delhi. Indian J Chest Dis Allied<br />
Sci 44, 9.<br />
Siddique, S., Banerjee, M., Ray, M., Lahiri, T., 2010. Air Pollution and its<br />
Impact on Lung Function of Children in Delhi, the Capital City of India.<br />
Water, Air, & Soil Pollution 212, 89-100.<br />
Wong, C.-M., Vichit-Vadakan, N., Kan, H., Qian, Z., 2008. Public Health and<br />
Air Pollution in Asia (PAPA): a multicity study of short-term effects of<br />
air pollution on mortality. Environ. Health Perspect. 116, 1195.<br />
World-Bank, 2012. An Analysis of Physical and Monetary Losses of<br />
Environmental Health and Natural Resources in India. Policy Research<br />
Working Papers, WPS-6219, The World Bank, Washington DC, USA.<br />
<strong>Coal</strong>, Energy, Emissions, and Electricity in India<br />
CEA, 2011. Review of Performance of Thermal Power Stations, Central<br />
Electricity Authority, Ministry of Power, Government of India, New<br />
Delhi, India.<br />
CEA, 2012. All India Electricity Statistics - General Review 2012, Central<br />
Electricity Authority, Ministry of Power, Government of India, New<br />
Delhi, India.Chikkatur, A.P., 2008. A resource and technology<br />
assessment of coal utilization in India. Pew Center on Global Climate<br />
Change, Arlington, VA (United States).<br />
Chikkatur, A.P., 2008. A resource and technology assessment of coal<br />
utilization in India. Pew Center on Global Climate Change, Arlington,<br />
VA (United States).<br />
Chikkatur, A., Sagar, A., 2009. Rethinking India’s <strong>Coal</strong> Power Technology<br />
Trajectory. Economic and Political Weekly 14 (46), 53-58.<br />
Chikkatur, A.P., Chaudhary, A., Sagar, A.D., 2011. <strong>Coal</strong> Power Impacts,<br />
Technology, and Policy: Connecting the Dots. Annual Review of<br />
Environment and Resources 36, 101-138.<br />
CPCB, 2009. Comprehensive Environmental Assessment of Industrial<br />
Clusters. Central Pollution Control Board, the Government of India,<br />
New Delhi, India.<br />
CPCB, 2010. Air Quality Monitoring, Emission Inventory and Source<br />
Apportionment Study for Indian cities. Central Pollution Control<br />
Board, the Government of India, New Delhi, India.<br />
Cropper, M., Gamkhar, S., Malik, K., Limonov, A., Partridge, I., 2012. The<br />
Health Effects of <strong>Coal</strong> Electricity Generation in India. Resources for<br />
the Future Discussion Paper.<br />
Finkelman, R.B., 2007. Health Impacts of <strong>Coal</strong>: Facts and Fallacies. AMBIO: A<br />
Journal of the Human Environment 36, 103-106.<br />
GAINS, 2010. Greenhouse Gas and Air Pollution Interactions and Synergies -<br />
South Asia Program. International Institute of Applied Systems<br />
Analysis, Laxenburg, Austria.<br />
Garg, A., Shukla, P.R., Kapshe, M., 2006. The sectoral trends of multigas<br />
emissions inventory of India. Atmospheric Environment 40, 4608-<br />
4620.<br />
Ghose, M.K., 2012. Climate Change and Energy Demands in India:<br />
Alternative <strong>Coal</strong> Technologies. Environmental Quality Management<br />
22, 49-67.<br />
Guttikunda, S. K., and P. Jawahar. "Atmospheric emissions and pollution<br />
from the coal-fired thermal power plants in India." Atmospheric<br />
Environment 92 (2014): 449-460.<br />
IEA, 2012. Technology Roadmap - High-Efficiency, Low-Emissions <strong>Coal</strong>-Fired<br />
Power Generation, International Energy Agency, Paris, France.<br />
Kansal, A., Khare, M., Sharma, C.S., 2009. Health benefits valuation of<br />
regulatory intervention for air pollution control in thermal power<br />
plants in Delhi, India. Journal of Environmental Planning and<br />
Management 52, 881-899.<br />
Lu, Z., Streets, D.G., 2012. Increase in NOx Emissions from Indian Thermal<br />
Power Plants during 1996–2010: Unit-Based Inventories and<br />
Multisatellite Observations. Environmental Science & Technology 46,<br />
7463-7470.<br />
MoEF, 2010. Environmental Impact Assessment Guidelines for Thermal<br />
Power Plants, Ministry of Environment and Forests, The Government<br />
of India, New Delhi, India.<br />
Prayas, 2011. Thermal Power Plants on The Anvil : Implications And Need<br />
For Rationalisation. Prayas Energy Group, Pune, India.<br />
Prayas, 2013. Black and Dirty - The Real Challenges Facing India’s <strong>Coal</strong><br />
Sector. Prayas Energy Group, Pune, India.<br />
Streets, D., Bond, T., Carmichael, G., Fernandes, S., Fu, Q., He, D., Klimont,<br />
Z., Nelson, S., Tsai, N., Wang, M.Q., 2003. An inventory of gaseous<br />
and primary aerosol emissions in Asia in the year 2000. Journal of<br />
geophysical research 108, 8809.<br />
WISE, 2012. Risks of <strong>Coal</strong> Based Electricity Generation in India. World<br />
Institute of Sustainable Energy, Pune, India.<br />
Modeling<br />
Census-India, 2012. Census of India, 2011. The Governement of India, New<br />
Delhi, India.<br />
GRUMP, 2010. Gridded Population of the World and Global Rural and<br />
Urban Mapping Project. Center for International Earth Science<br />
Information Network (CIESIN) of the Earth Institute, Columbia<br />
University, New York, U. S. A.<br />
NCEP, 2014. National Centers for Environmental Prediction. National<br />
Oceanic and Atmospheric Administration, Maryland, U. S. A.<br />
Weblinks (last accessed Dec/01/2014)<br />
http://cea.nic.in/welcome1.html<br />
https://www.coalindia.in<br />
http://www.ntpc.co.in/index.php<br />
http://www.greentribunal.gov.in<br />
http://cpcb.nic.in<br />
http://envfor.nic.in<br />
http://beeindia.in<br />
http://mospi.nic.in<br />
http://www.censusindia.gov.in<br />
http://www.tifac.org.in<br />
http://gains.iiasa.ac.at/index.php/home-page<br />
http://edgar.jrc.ec.europa.eu/overview.php?v=42<br />
http://wrf-model.org/index.php<br />
http://www.camx.com<br />
http://www.esrl.noaa.gov/psd/data/gridded/data.ncep.reanalysis.html<br />
26 | <strong>Coal</strong>-fired TPPs in India
Highlights:<br />
Between 2014 and 2030<br />
<strong>Coal</strong> generation capacity grows 300%<br />
<strong>Coal</strong> consumption grows 200-300%<br />
Air emissions at least double<br />
100% increase in the health impacts<br />
186,500 to 229,500 premature deaths in 2030<br />
Need to<br />
Set stringent emission standards<br />
Mandate FGD at all plants<br />
Practice rigorous monitoring<br />
Ensure transparency<br />
Improve EIA protocols
Conservation<br />
ACTION TRUST