Coal Kills
1TndvUf
1TndvUf

Create successful ePaper yourself
Turn your PDF publications into a flip-book with our unique Google optimized e-Paper software.
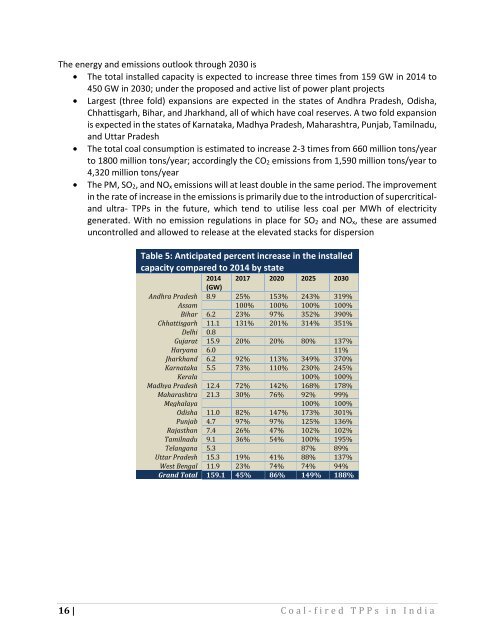
The energy and emissions outlook through 2030 is<br />
• The total installed capacity is expected to increase three times from 159 GW in 2014 to<br />
450 GW in 2030; under the proposed and active list of power plant projects<br />
• Largest (three fold) expansions are expected in the states of Andhra Pradesh, Odisha,<br />
Chhattisgarh, Bihar, and Jharkhand, all of which have coal reserves. A two fold expansion<br />
is expected in the states of Karnataka, Madhya Pradesh, Maharashtra, Punjab, Tamilnadu,<br />
and Uttar Pradesh<br />
• The total coal consumption is estimated to increase 2-3 times from 660 million tons/year<br />
to 1800 million tons/year; accordingly the CO 2 emissions from 1,590 million tons/year to<br />
4,320 million tons/year<br />
• The PM, SO 2 , and NO x emissions will at least double in the same period. The improvement<br />
in the rate of increase in the emissions is primarily due to the introduction of supercriticaland<br />
ultra- TPPs in the future, which tend to utilise less coal per MWh of electricity<br />
generated. With no emission regulations in place for SO 2 and NO x , these are assumed<br />
uncontrolled and allowed to release at the elevated stacks for dispersion<br />
Table 5: Anticipated percent increase in the installed<br />
capacity compared to 2014 by state<br />
2014 2017 2020 2025 2030<br />
(GW)<br />
Andhra Pradesh 8.9 25% 153% 243% 319%<br />
Assam 100% 100% 100% 100%<br />
Bihar 6.2 23% 97% 352% 390%<br />
Chhattisgarh 11.1 131% 201% 314% 351%<br />
Delhi 0.8<br />
Gujarat 15.9 20% 20% 80% 137%<br />
Haryana 6.0 11%<br />
Jharkhand 6.2 92% 113% 349% 370%<br />
Karnataka 5.5 73% 110% 230% 245%<br />
Kerala 100% 100%<br />
Madhya Pradesh 12.4 72% 142% 168% 178%<br />
Maharashtra 21.3 30% 76% 92% 99%<br />
Meghalaya 100% 100%<br />
Odisha 11.0 82% 147% 173% 301%<br />
Punjab 4.7 97% 97% 125% 136%<br />
Rajasthan 7.4 26% 47% 102% 102%<br />
Tamilnadu 9.1 36% 54% 100% 195%<br />
Telangana 5.3 87% 89%<br />
Uttar Pradesh 15.3 19% 41% 88% 137%<br />
West Bengal 11.9 23% 74% 74% 94%<br />
Grand Total 159.1 45% 86% 149% 188%<br />
16 | <strong>Coal</strong>-fired TPPs in India