(IEA Energy Papers 2011_05) Matthias Finkenrath-Cost and Performance of Carbon Dioxide Capture from Power Generation (IEA Energy Papers)-OECD Publishing (2011)

You also want an ePaper? Increase the reach of your titles
YUMPU automatically turns print PDFs into web optimized ePapers that Google loves.
<strong>Cost</strong> <strong>and</strong> <strong>Performance</strong> <strong>of</strong> <strong>Carbon</strong> <strong>Dioxide</strong> <strong>Capture</strong> <strong>from</strong> <strong>Power</strong> <strong>Generation</strong> ©<strong>OECD</strong>/<strong>IEA</strong> <strong>2011</strong><br />
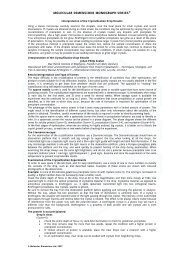
Figure 7. Post‐combustion capture <strong>from</strong> coal‐fired power generation by ammonia: CO 2 capture impact<br />
2500<br />
Increase in overnight cost (2010 USD/kW)<br />
140%<br />
Relative increase in overnight cost (%)<br />
Page | 46<br />
2000<br />
1500<br />
120%<br />
100%<br />
80%<br />
1000<br />
60%<br />
500<br />
40%<br />
20%<br />
0<br />
CMU<br />
CMU<br />
NZEC<br />
0%<br />
CMU<br />
CMU<br />
NZEC<br />
2007 2009 2007 2009<br />
70<br />
Increase in LCOE (2010 USD/MWh)<br />
140%<br />
Relative increase in LCOE (%)<br />
60<br />
120%<br />
50<br />
100%<br />
40<br />
80%<br />
30<br />
60%<br />
20<br />
40%<br />
10<br />
20%<br />
0<br />
CMU<br />
CMU<br />
NZEC<br />
0%<br />
CMU<br />
CMU<br />
NZEC<br />
2007 2009 2007 2009<br />
18<br />
16<br />
14<br />
12<br />
10<br />
8<br />
6<br />
4<br />
2<br />
0<br />
Net efficiency penalty (percentage points, LHV)<br />
CMU<br />
CMU<br />
NZEC<br />
50%<br />
40%<br />
30%<br />
20%<br />
10%<br />
0%<br />
Relative decrease in net efficiency (%)<br />
CMU<br />
CMU<br />
NZEC<br />
2007 2009 2007 2009<br />
Notes: Data cover only CO 2 capture <strong>and</strong> compression but not transportation <strong>and</strong> storage. Overnight costs include owner’s, EPC <strong>and</strong><br />
contingency costs, but not IDC. A 15% contingency based on EPC cost is added for unforeseen technical or regulatory difficulties for<br />
CCS cases, compared to a 5% contingency applied for non‐CCS cases. IDC is included in LCOE calculations. Fuel price assumptions<br />
differ between regions. CMU data include a low (left column) <strong>and</strong> high (right colum) concentration ammonia system operating w/o<br />
<strong>and</strong> w/ solids.