- Page 2 and 3:
Anuário Estatístico do Brasil vol
- Page 4 and 5:
MINISTÉRIO DO PLANEJAMENTO, ORÇAM
- Page 6 and 7:
Sumário Geral Apresentação Guia
- Page 8 and 9:
O Professor João Lyra Madeira e a
- Page 10 and 11:
Encerrando sua análise, advertia q
- Page 12 and 13:
tem definições diferenciadas, est
- Page 14 and 15:
Caracterização do Território 1Se
- Page 17 and 18:
Posição e Extensão O tema Posiç
- Page 19 and 20:
Tabela 1.1.1.2 - Localização geog
- Page 21 and 22:
Tabela 1.1.1.3 - Distância em linh
- Page 23 and 24:
Tabela 1.1.1.4 - Extensão da linha
- Page 25 and 26:
Tabela 1.1.1.4 - Extensão da linha
- Page 27 and 28:
Tabela 1.1.2.2 - Extensão da linha
- Page 30 and 31:
Divisão Territorial No tema Divis
- Page 32 and 33:
Tabela 1.2.1.1 - Evolução políti
- Page 35 and 36:
Recursos Naturais e Meio Ambiente A
- Page 37 and 38:
Tabela 1.3.1.1 - Reservas de subst
- Page 39 and 40:
Tabela 1.3.2.1 - Pontos mais altos
- Page 41 and 42:
Tabela 1.3.2.2 - Pontos mais altos
- Page 43 and 44:
Tabela 1.3.2.2 - Pontos mais altos
- Page 45 and 46:
Tabela 1.3.4.1 - Empresas que imple
- Page 47 and 48:
Tabela 1.3.4.3 - Municípios, total
- Page 49 and 50:
Tabela 1.3.4.6 - Número de unidade
- Page 51 and 52:
Tabela 1.3.4.8 - Aquisição famili
- Page 53 and 54:
É todo agregado de espaços planos
- Page 55 and 56:
vistas de pontos diferentes, result
- Page 57 and 58:
ocidental Relativo ao ocidente. oci
- Page 59 and 60:
Referências ABELHA: boletim inform
- Page 61 and 62:
DIVISÃO do Brasil em micro-regiõe
- Page 63 and 64:
Brasília, DF: Secretaria Especial
- Page 65 and 66:
Características Demográficas e So
- Page 67 and 68:
2.2.3.2 - Número de empregos forma
- Page 69 and 70:
2.3.1 - Casos notificados de Aids -
- Page 71:
Principais características das pes
- Page 74 and 75:
Tabela 2.1.1.1 - População presen
- Page 76 and 77:
Tabela 2.1.1.2 - População reside
- Page 78 and 79:
Tabela 2.1.1.3 - Projeção da popu
- Page 80 and 81:
Tabela 2.1.2.1 - Nascidos vivos, po
- Page 82 and 83:
Tabela 2.1.2.2 - Casamentos, por m
- Page 84 and 85:
Tabela 2.1.2.2 - Casamentos, por m
- Page 86 and 87:
Tabela 2.1.2.3 - Óbitos, por ano d
- Page 88 and 89:
Tabela 2.1.2.4 - Processos de separ
- Page 90 and 91:
Tabela 2.1.2.4 - Processos de separ
- Page 92 and 93:
Tabela 2.1.3.2 - População reside
- Page 94 and 95:
Tabela 2.1.4.2 - Famílias resident
- Page 96 and 97:
Tabela 2.1.6.1 - População reside
- Page 98:
Tabela 2.1.6.1 - População reside
- Page 101 and 102:
Gráfico 2.2.2 - Distribuição dos
- Page 103 and 104:
Tabela 2.2.1.1 - Pessoas de 10 anos
- Page 105 and 106:
Tabela 2.2.1.3 - Pessoas de 10 anos
- Page 107 and 108:
Tabela 2.2.2.1 - Pessoas de 10 anos
- Page 109 and 110:
Grandes Regiões e grupamentos de a
- Page 111 and 112:
Tabela 2.2.2.3 - Pessoas de 10 anos
- Page 113 and 114:
Tabela 2.2.2.3 - Pessoas de 10 anos
- Page 115 and 116:
Tabela 2.2.2.4 - Pessoas de 10 anos
- Page 117 and 118:
Tabela 2.2.3.1 - Empregados de 10 a
- Page 119 and 120:
Tabela 2.2.3.2 - Número de emprego
- Page 121 and 122:
Tabela 2.2.3.3 - Número de emprego
- Page 123 and 124:
Tabela 2.2.3.3 - Número de emprego
- Page 125 and 126:
ANUÁRIO ESTATÍSTICO DO BRASIL, v.
- Page 127 and 128:
4 000 000 3 500 000 3 000 000 2 500
- Page 129 and 130:
Tabela 2.3.1.2 - Vacinação em men
- Page 131 and 132:
Tabela 2.3.1.4 - Casos notificados
- Page 133 and 134:
Tabela - 2.3.2.2 - Quantidade de be
- Page 135:
Tabela- 2.3.2.4 - Quantidade de ben
- Page 138 and 139:
Tabela 2.4.1.1 - Taxa de analfabeti
- Page 140 and 141:
Tabela 2.4.1.3 - Taxa de analfabeti
- Page 142 and 143:
Tabela 2.4.2.2 - Número de estabel
- Page 144 and 145:
Tabela 2.4.2.4 - Instituições de
- Page 146 and 147:
Tabela 2.4.2.6 - Programas de pós-
- Page 149 and 150:
Habitação Com o objetivo de dar u
- Page 151 and 152:
Tabela 2.5.1.1 - Domicílios partic
- Page 154 and 155:
Segurança Pública Neste tema, sã
- Page 156: Tabela 2.6.1.2 - Veículos envolvid
- Page 159 and 160: Tabela 2.7.1.1 - Eleitores, por sex
- Page 161 and 162: Tabela 2.7.1.1 - Eleitores, por sex
- Page 163 and 164: Glossário No Censo Demográfico 19
- Page 165 and 166: série do superior; 16 anos de estu
- Page 167 and 168: domicílio 1. (Censo Demográfico 1
- Page 169 and 170: fabricação de produtos de metal -
- Page 171 and 172: pessoa alfabetizada (Censo Demográ
- Page 173 and 174: situação do domicílio 1. (Censo
- Page 175 and 176: Referências ANUÁRIO ESTATÍSTICO
- Page 177 and 178: Aspectos das Atividades Agropecuár
- Page 179 and 180: 3.3.1.2 - Áreas plantada e colhida
- Page 181: Principais características das pes
- Page 184 and 185: Tabela 3.1.1.1 - Unidades armazenad
- Page 187 and 188: Crédito e Assistência Rural Em Cr
- Page 190 and 191: Produção Vegetal As informações
- Page 192 and 193: Tabela 3.3.1.2 - Áreas plantada e
- Page 194 and 195: Tabela 3.3.1.3 - Área plantada, á
- Page 196 and 197: Tabela 3.3.1.3 - Área plantada, á
- Page 198 and 199: Tabela 3.3.1.3 - Área plantada, á
- Page 200 and 201: Tabela 3.3.2.2 - Produção de carv
- Page 202 and 203: Tabela 3.3.2.3 - Produção e valor
- Page 205: Produção Animal No tema Produçã
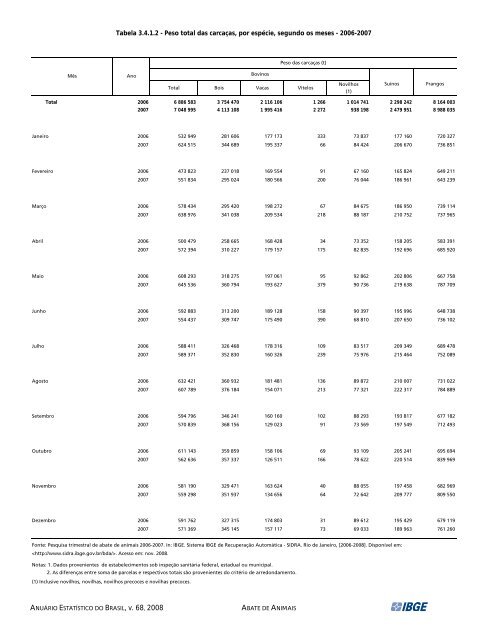
- Page 209: Tabela 3.4.2.3 - Produção de ovos
- Page 212 and 213: Tabela 3.5.1.1 - Efetivo dos rebanh
- Page 214 and 215: Tabela 3.5.1.1 - Efetivo dos rebanh
- Page 216 and 217: Glossário animais abatidos (Pesqui
- Page 218 and 219: extrativismo vegetal (Produção da
- Page 220 and 221: Referências LEVANTAMENTO SISTEMÁT
- Page 222 and 223: Aspectos da Atividade Indústria 4
- Page 224 and 225: 4.3.1.2 - Oferta interna de energia
- Page 226: Principais características das pes
- Page 229 and 230: Gráfico 4.1.2 - Distribuição do
- Page 231 and 232: Tabela 4.1.1.1 - Dados gerais refer
- Page 233 and 234: Tabela 4.1.1.1 - Dados gerais refer
- Page 235 and 236: Tabela 4.1.1.2 - Dados gerais refer
- Page 237 and 238: Tabela 4.1.1.2 - Dados gerais refer
- Page 239 and 240: Tabela 4.1.1.2 - Dados gerais refer
- Page 241 and 242: Tabela 4.1.1.4 - Produção e venda
- Page 243 and 244: Tabela 4.1.1.5 - Produção e venda
- Page 245 and 246: Tabela 4.1.1.6 - Empresas industria
- Page 247 and 248: Tabela 4.1.2.3 - Máquinas agrícol
- Page 249 and 250: Tabela 4.1.2.6 - Produção e desti
- Page 251 and 252: Tabela 4.1.2.10 - Capacidade instal
- Page 253: Tabela 4.1.2.16 - Formação do con
- Page 256 and 257:
Tabela 4.2.1.1 - Empresas, pessoal
- Page 258 and 259:
Grandes Regiões e Unidades da Fede
- Page 260:
Tabela 4.2.1.3 - Empresas da constr
- Page 263 and 264:
Gráfico 4.3.2 - Evolução da ofer
- Page 265 and 266:
Tabela 4.3.1.3 - Consumo final de e
- Page 267 and 268:
Tabela 4.3.2.2 - Reservas provadas
- Page 269 and 270:
Tabela 4.3.3.2 - Produção de petr
- Page 271 and 272:
Tabela 4.3.3.2 - Produção de petr
- Page 273:
Tabela 4.3.3.2 - Produção de petr
- Page 276 and 277:
Número-índice 190,00 180,00 170,0
- Page 278 and 279:
Tabela 4.4.1.2 - Taxas anuais de cr
- Page 280:
Tabela 4.4.2.1 - Índices anuais pa
- Page 283 and 284:
Tabela 4.5.1.1 - Pedidos depositado
- Page 285 and 286:
custos das operações industriais
- Page 287 and 288:
comercial (m 3 , t, MWh etc.) por u
- Page 289 and 290:
Aspectos da Atividade Serviços Se
- Page 291 and 292:
5.1.2.5 - Índice nominal de vendas
- Page 293:
Principais características das pes
- Page 296 and 297:
Gráfico 5.1.2 - Participação dos
- Page 298 and 299:
Tabela 5.1.1.1 - Dados gerais das e
- Page 300 and 301:
Tabela 5.1.1.3 - Empresas comerciai
- Page 302 and 303:
Tabela 5.1.2.3 - Índice de volume
- Page 304 and 305:
Tabela 5.1.2.5 - Índice nominal de
- Page 306 and 307:
Tabela 5.1.2.7 - Índice de volume
- Page 308 and 309:
Tabela 5.1.2.9 - Índice nominal de
- Page 310:
Tabela 5.1.2.11 - Indicadores de de
- Page 313 and 314:
Tabela 5.2.1.1 - Empresas de transp
- Page 315 and 316:
Tabela 5.2.1.4 - Extensão da rede
- Page 317 and 318:
Tabela 5.2.3.1 - Movimento geral de
- Page 320 and 321:
Comunicações O tema está estrutu
- Page 322 and 323:
Tabela 5.3.2.1 - Acessos do serviç
- Page 324 and 325:
Tabela 5.3.2.3 - Acessos fixos inst
- Page 326:
Tabela 5.3.2.5 - Evolução da dens
- Page 329 and 330:
Gráfico 5.4.2 - Participação dos
- Page 331 and 332:
Tabela 5.4.1.2 - Empresas de servi
- Page 333 and 334:
Tabela 5.4.2.2 - Agências de viage
- Page 335 and 336:
Glossário empresa 1. (Estatística
- Page 337 and 338:
Referências ANUÁRIO DO TRANSPORTE
- Page 339 and 340:
Índices, Preços, Custos e Salári
- Page 341:
Principais características das pes
- Page 344 and 345:
- Índices na Fonte da Produção A
- Page 346 and 347:
Tabela 6.1.1.1 - Variação geral n
- Page 348 and 349:
Tabela 6.1.1.2 - Variação geral n
- Page 350 and 351:
Tabela 6.1.1.3 - Variação geral n
- Page 352 and 353:
Tabela 6.1.2.1 - Variação mensal
- Page 354:
Tabela 6.1.3.2 - Índices de preço
- Page 357 and 358:
Quadro 6.2.1 - Sistema Nacional de
- Page 359 and 360:
Tabela 6.2.1.2 - Salário mínimo,
- Page 361 and 362:
Glossário custo médio (Sistema Na
- Page 363 and 364:
Referências INDICADORES IBGE: Sist
- Page 365 and 366:
Agregados Macroeconômicos 7Seção
- Page 367 and 368:
7.5.1.2 - Produto Interno Bruto, Pr
- Page 370 and 371:
Finanças Públicas As informaçõe
- Page 372:
Tabela 7.1.1.3 - Receitas realizada
- Page 375:
Tabela 7.2.1.1 - Despesa da União,
- Page 378 and 379:
Tabela 7.3.1.1 - Variação percent
- Page 380 and 381:
Tabela 7.3.1.5 - Cotações de vend
- Page 382 and 383:
Tabela 7.3.2.2 - Unidades operacion
- Page 384 and 385:
Tabela 7.3.2.4 - Valor dos desembol
- Page 387 and 388:
Setor Externo O tema Setor Externo
- Page 389 and 390:
Tabela 7.4.1.3 - Exportação, segu
- Page 391 and 392:
Tabela 7.4.1.4 - Importação, segu
- Page 393 and 394:
Tabela 7.4.1.5 - Importação, segu
- Page 395 and 396:
Tabela 7.4.1.6 - Exportação, segu
- Page 397 and 398:
Tabela 7.4.1.6 - Exportação, segu
- Page 399 and 400:
Tabela 7.4.1.7 - Importação, segu
- Page 401 and 402:
Tabela 7.4.1.7 - Importação, segu
- Page 403 and 404:
Tabela 7.4.2.1 - Balanço de pagame
- Page 405 and 406:
Tabela 7.4.2.3 - Saldos do endivida
- Page 408 and 409:
Contas Nacionais O IBGE divulga anu
- Page 410 and 411:
Tabela 7.5.1.1 - Composição do Pr
- Page 412 and 413:
Tabela 7.5.1.4 - Série encadeada d
- Page 414 and 415:
Glossário ajustamento CIF/FOB (Sis
- Page 416 and 417:
serviços de intermediação financ
- Page 418 and 419:
Índice de Assuntos Índice de assu
- Page 420 and 421:
Argilas reservas, 1-29 ver também
- Page 422 and 423:
Brancos ver Cor/raça da populaçã
- Page 424 and 425:
empresas, 5-13, 5-14, 5-15, 5-16 fi
- Page 426 and 427:
Diesel ver Óleo diesel Distribuiç
- Page 428 and 429:
locos econômicos, 7-33, 7-34 país
- Page 430 and 431:
idade, 2-13, 2-16, 2-17, 2-18, 2-43
- Page 432 and 433:
crescimento, 4-63, 4-64 horas pagas
- Page 434 and 435:
da transformação, 4-16, 4-20 Ind
- Page 436 and 437:
investimentos, 1-42 salários e out
- Page 438 and 439:
L Lã índices de preços, 6-19 Lac
- Page 440 and 441:
Minerais não-metálicos reservas,
- Page 442 and 443:
produção, 3-20 rendimento médio,
- Page 444 and 445:
ver também Índices de preços Pre
- Page 446 and 447:
Religião católicos, 2-14, 2-15 es
- Page 448 and 449:
ver também Comunicações ver tamb
- Page 450 and 451:
ônibus e microônibus acidentes de
- Page 452 and 453:
Tels.: (11)3179-3800; (11)3179-3990
- Page 454 and 455:
Esplanada dos Ministérios Bloco F
- Page 456 and 457:
Relevo 1.3.2.1 - Pontos mais altos
- Page 458 and 459:
Dinâmica Espacial Aglomeração Ur
- Page 460 and 461:
2.1.3.3 - Esperança de vida ao nas
- Page 462 and 463:
Educação Características de Inst
- Page 464 and 465:
Produção Vegetal Agricultura 3.3.
- Page 466 and 467:
4.1.2.19 - Vendas de gasolinas para
- Page 468 and 469:
Transportes Rodoviário 5.2.1.1 - E
- Page 470 and 471:
Preços, Custos e Salários Preços
- Page 472:
Equipe Técnica Centro de Documenta