
Create successful ePaper yourself
Turn your PDF publications into a flip-book with our unique Google optimized e-Paper software.
Attachment 1<br />
INTRODUCTION<br />
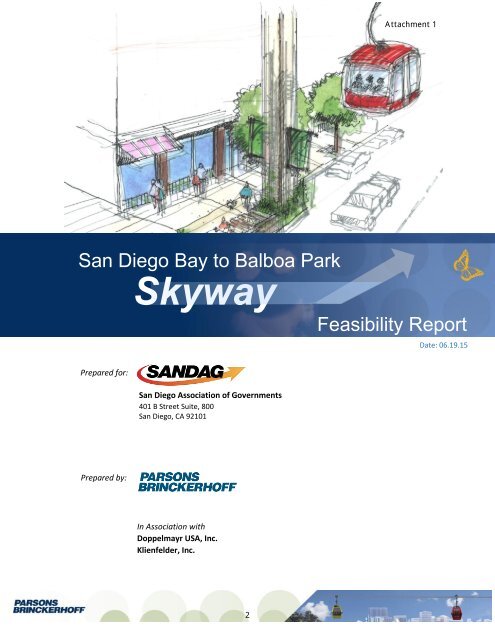
San Diego Bay to Balboa Park<br />
<strong>Skyway</strong><br />
Feasibility Report<br />
Date: 06.19.15<br />
Prepared for:<br />
San Diego Association of Governments<br />
401 B Street Suite, 800<br />
San Diego, CA 92101<br />
Prepared by:<br />
In Association with<br />
Doppelmayr USA, Inc.<br />
Klienfelder, Inc.<br />
2
San Diego Bay to Balboa Park<br />
Acknowledgements<br />
County of San Diego<br />
Ron Roberts – Supervisor<br />
<strong>Skyway</strong> <strong>Skyway</strong><br />
Metropolitan Transit System (MTS)<br />
Paul Jablonski – Chief Executive Officer<br />
Feasibility Report<br />
Parsons Brinckerhoff<br />
Rex Plummer – Principal-in-Charge<br />
Jeff Howard – Project Manager<br />
Mark Peterson – Senior Planning Manager<br />
Chris Wahl – Senior Planner<br />
Date: 04.06.15<br />
Date: 06.19.15<br />
San Diego Association of Governments (SANDAG)<br />
Gary Gallegos – Executive Director<br />
Richard Chavez – Project Manager<br />
Doppelmayr USA, Inc.<br />
Randy Woolwine<br />
Russ Oberlander<br />
Klienfelder, Inc.<br />
James Gingery<br />
3
Contents<br />
Executive Summary ....................................................................................................................... ES-1<br />
E.1 Study Overview and Purpose ................................................................................................... ES-1<br />
E.2 <strong>Skyway</strong> Advantages and Opportunities ................................................................................... ES-1<br />
E.3 Feasibility Findings and Conclusions ........................................................................................ ES-3<br />
E.4 <strong>Skyway</strong> Challenges and Next Steps .......................................................................................... ES-4<br />
1.0 INTRODUCTION ...................................................................................................................1-1<br />
1.1 Study Purpose and Objectives ................................................................................................... 1-1<br />
1.2 Report Structure ........................................................................................................................ 1-2<br />
2.0 EXISTING CONDITIONS .........................................................................................................2-1<br />
2.1 Regulatory Requirements .......................................................................................................... 2-1<br />
2.2 Potential Environmental Issues ................................................................................................. 2-3<br />
2.3 Corridor Mobility Features ......................................................................................................... 2-4<br />
2.4 Land Use ..................................................................................................................................... 2-4<br />
2.5 Right-of-Way .............................................................................................................................. 2-4<br />
2.6 Utilities ....................................................................................................................................... 2-5<br />
2.7 Topography ................................................................................................................................ 2-5<br />
2.8 Planned and Future Facilities ..................................................................................................... 2-6<br />
3.0 SYSTEM REQUIREMENTS ......................................................................................................3-1<br />
3.1 System Design ............................................................................................................................ 3-1<br />
3.2 Preliminary Operating Concept ................................................................................................. 3-2<br />
4.0 MARKET ASSESSMENT .........................................................................................................4-1<br />
4.1 Identification of Market Segments ............................................................................................ 4-1<br />
4.2 Candidate <strong>Skyway</strong> Trips ............................................................................................................. 4-4<br />
4.3 <strong>Skyway</strong> Ridership Propensity ..................................................................................................... 4-7<br />
4.4 Preliminary <strong>Skyway</strong> Ridership Forecasts .................................................................................... 4-7<br />
5.0 ALIGNMENT CONCEPT ..........................................................................................................5-1<br />
5.1 Alignment ................................................................................................................................... 5-1<br />
5.2 Station Design and Locations ..................................................................................................... 5-1<br />
5.3 Tower Types and Location ....................................................................................................... 5-12<br />
6.0 IMPLEMENTATION COSTS AND FINANCING ..........................................................................6-1<br />
6.1 System Cost Estimates ............................................................................................................... 6-1<br />
6.2 Annual Operation and Maintenance Costs ................................................................................ 6-2<br />
6.3 Farebox Revenue Potential ........................................................................................................ 6-3<br />
6.4 Project Delivery Options ............................................................................................................ 6-3<br />
6.5 Project Operational Methods .................................................................................................... 6-4<br />
6.6 Project Financing Options .......................................................................................................... 6-4<br />
7.0 <strong>Skyway</strong> – NEXT STEPS! .........................................................................................................7-1<br />
i<br />
4
Tables<br />
Table 3-1. Potential Cabin Requirements .................................................................................................. 3-3<br />
Table 4-1. Projected Activity within the Study Area .................................................................................. 4-3<br />
Table 4-2. Projected Tourist Activity within the Study Area ...................................................................... 4-3<br />
Table 4-3. Study Area Daily Trips (SANDAG, 2020) .................................................................................... 4-4<br />
Table 4-4. Candidate <strong>Skyway</strong> Trips by Market Segment and Day Type (Year 2020) ................................. 4-6<br />
Table 4-5. <strong>Skyway</strong> Propensity Factors ........................................................................................................ 4-7<br />
Table 4-6. Special Event Trips .................................................................................................................... 4-7<br />
Table 4-7. Annual Ridership Summary ....................................................................................................... 4-8<br />
Table 6-1. Order-of-Magnitude <strong>Skyway</strong> Construction Cost Estimate ........................................................ 6-2<br />
Table 6-2. Annualized <strong>Skyway</strong> Operation and Maintenance Costs ........................................................... 6-2<br />
Table 6-3. Annual Farebox Revenue: Single Fare Pricing ........................................................................... 6-3<br />
Table 6-4. Annual Farebox Revenue: Split Fare Pricing ............................................................................. 6-3<br />
Figures<br />
Figure 1-1. Balboa Park .............................................................................................................................. 1-1<br />
Figure 1-2. Downtown San Diego and San Diego Bay ................................................................................ 1-1<br />
Figure 1-3. San Diego Bay to Balboa Park <strong>Skyway</strong> Investigated Alignment and Station Locations ........... 1-3<br />
Figure 4-1. Market Assessment Process .................................................................................................... 4-1<br />
Figure 4-2. <strong>Skyway</strong> Study Area ................................................................................................................... 4-2<br />
Figure 4-3. Viable Trip Interchanges .......................................................................................................... 4-5<br />
Figure 4-4. Station Boarding Activity ......................................................................................................... 4-9<br />
Figure 5-1. Typical End Station Footprint .................................................................................................. 5-1<br />
Figure 5-2. <strong>Skyway</strong> Investigated Alignment with Station Locations .......................................................... 5-2<br />
Figure 5-3. Gaslamp Station Alternative 1 ................................................................................................. 5-3<br />
Figure 5-4. Gaslamp Station Alternative 2 ................................................................................................. 5-4<br />
Figure 5-5. Gaslamp Station Alternative 3 - North of L Street ................................................................... 5-4<br />
Figure 5-6. West Parking – End Station location in Balboa Park ................................................................ 5-5<br />
Figure 5-7. Palm Canyon in Balboa Park .................................................................................................... 5-6<br />
Figure 5-8. Site Plan of B Street Station ..................................................................................................... 5-7<br />
Figure 5-9. Looking West on the North Side of B Street ............................................................................ 5-8<br />
Figure 5-10. Looking West on the North Side of B Street .......................................................................... 5-8<br />
Figure 5-11. Elevated Station Concept at B Street ..................................................................................... 5-8<br />
Figure 5-12. Elevated Station Concept at Ivy Street .................................................................................. 5-9<br />
Figure 5-13. Profile View of Ivy Street Station ........................................................................................... 5-9<br />
Figure 5-14. Elevated Station Concept at Juniper Street ......................................................................... 5-10<br />
Figure 5-15. West Side View of Juniper Street at 6th Avenue ................................................................. 5-10<br />
ii<br />
5
Figure 5-16. Station Concept at Elm Street and 6th Avenue ................................................................... 5-11<br />
Figure 5-17. View Looking East from 6 th Avenue ..................................................................................... 5-11<br />
Figure 5-18. Tower Alternatives Reviewed .............................................................................................. 5-12<br />
Figure 5-19. Typical Tower Heights for 25-foot and 35-foot Clearance from Ground ............................ 5-13<br />
Figure 5-20. Site Plan Illustrating Typical Location of Tower Placement South of I-5 ............................. 5-14<br />
Figure 5-21. View Looking North on 6th Avenue ..................................................................................... 5-14<br />
Figure 5-22. Typical Tower Placement in Blocks South of I-5 .................................................................. 5-14<br />
Figure 5-23. Site Plan Illustrating Typical Location of Tower Placement North of I-5 ............................. 5-15<br />
Figure 5-24. 6 th Avenue – Typical “Red-Zone” Tower Placement Location ............................................. 5-15<br />
Figure 5-25. Tower Placement Crossing SR-163 ...................................................................................... 5-16<br />
Figure 5-26. View Looking North along SR-163 ....................................................................................... 5-16<br />
Figure 5-27. View Looking North along SR-163 ....................................................................................... 5-16<br />
Figure 5-28. Tower Alignment from Ivy Street to West Parking in Balboa Park ...................................... 5-17<br />
Figure 5-29. Typical Parklet Site Plan and Sketch .................................................................................... 5-18<br />
Figure 5-30. Aerial View of Parklet .......................................................................................................... 5-18<br />
Figure 6-1. Small Starts Process ................................................................................................................. 6-5<br />
Appendices<br />
Appendix A: Historic Districts and Points of Interest<br />
Appendix B: Utilities<br />
Appendix C: Typical <strong>Skyway</strong> Cabin Dimensions<br />
Appendix D: Airport Approach Overlay Zone Height Restrictions<br />
Appendix E: Soil Types<br />
Appendix F: Capital Cost Estimate<br />
Appendix G: Operation and Maintenance Cost Estimate<br />
iii<br />
6
7
Executive Summary<br />
E.1 Study Overview and Purpose<br />
The purpose of the San Diego Bay to Balboa Park <strong>Skyway</strong><br />
Feasibility Report was to determine the feasibility of<br />
implementing an aerial cableway (<strong>Skyway</strong>) as a mode of<br />
urban mobility for the San Diego region. The success of this<br />
type of system as a high-capacity transit mode can be seen<br />
in other cities around the globe, including the Metrocable<br />
in Medellín, Columbia; Rio de Janeiro’s cableway launch in<br />
2013; and the expansion of La Paz, Bolivia’s cableway<br />
system with six new urban lines. While the aerial cableway<br />
has enjoyed a high level of success in other countries, an<br />
urban cableway application in the United States has not<br />
yet been implemented.<br />
The County of San Diego, through a<br />
“Neighborhood Investment Program” grant,<br />
partnered with the San Diego Association of<br />
Governments (SANDAG) and Metropolitan Transit<br />
System (MTS) and commissioned Parsons-<br />
Brinkerhoff to prepare an initial feasibility study<br />
for constructing a <strong>Skyway</strong> between the San Diego<br />
Bay and Balboa Park. A “Bay to Park” connection<br />
has long been identified as a key and desirable<br />
linkage between these two iconic features of the<br />
San Diego landscape, with the dual objectives of<br />
re-establishing Balboa Park’s relationship to<br />
downtown and better integrating downtown with<br />
the surrounding neighborhoods.<br />
This report is limited to the issues and challenges<br />
of constructing an approximately 2-mile <strong>Skyway</strong> in 6th Avenue Corridor – South Toward San Diego Bay<br />
the 6 th Avenue corridor from the Gaslamp Quarter<br />
in Downtown San Diego to Balboa Park. The investigated alignment includes four stations—two end<br />
stations and two intermediate stations—as it travels from the Gaslamp Quarter to a terminus in Balboa<br />
Park at the parking lot immediately north and west of the Spreckels Organ Pavilion.<br />
E.2 <strong>Skyway</strong> Advantages and Opportunities<br />
Urban Cableway in Medellín, Columbia<br />
In this corridor the <strong>Skyway</strong> offers many advantages over other transit modes in urban applications, such<br />
as light rail transit or rapid bus. Aerial cableways are particularly well suited to overcoming obstacles in<br />
the built environment, such as railway lines, freeways, water bodies, or significant changes in topography<br />
(e.g., canyons, valleys). The cableway can also avoid the need to build the highly expensive infrastructure<br />
typically required for light rail transit or major dedicated rapid bus facilities. The investigated alignment<br />
for the <strong>Skyway</strong>, which follows the existing street right-of-way, is essentially barrier free because it rises<br />
above the street and the towers supporting the system require a minimal footprint. Based on the tower<br />
height the cabins would be elevated 48 feet from existing street grade at the tower and only 35 feet at<br />
mid-span of the towers. The primary design features of the cableway technology allows more direct<br />
routings, often providing the fastest route from point to point in a safe elevated environment.<br />
ES-1<br />
8
Museum of Man<br />
Alcazar Garden<br />
Station Footprint<br />
West Parking Area<br />
Palm Canyon<br />
Organ Pavilion<br />
West Parking Area Station<br />
ES-2<br />
9
The initial capacity will be able to serve 2,000 passengers per hour. However, it should be noted that the<br />
cableway systems has the potential for high-capacity ridership, capable of serving 4,000 to 5,000<br />
passengers per hour. This capacity is competitive with high-capacity bus service. It is anticipated that the<br />
travel time from end to end of the proposed Park to Bay connection would be less than 12 minutes, and<br />
with four station locations, would have the ability to serve a diverse mix of both local commuters and<br />
tourists.<br />
E.3 Feasibility Findings and Conclusions<br />
Major findings and conclusions regarding the feasibility of the proposed San Diego <strong>Skyway</strong> Project<br />
include:<br />
• System Infrastructure Requirements – The small footprint of the stations and the support towers<br />
(5-foot by 5-foot base dimension and upward to 85 feet tall) would allow the major infrastructure<br />
elements of the cableway to be integrated sensitively into the existing corridor environment without<br />
any associated “fatal-flaw” issues. The support towers can be placed within the existing public street<br />
right-of-way with minimal or no loss of on-street parking.<br />
6th Avenue Corridor – Concept Sketch of B Street Station<br />
• Market Research and Ridership Potential – Assessment of the potential market for ridership<br />
indicates that the alignment would serve a mix of daily commuters and a significant number of local<br />
and out-of-town tourists. An additional ridership boost simply due to the “novelty” nature of the<br />
system would also be expected. Conservative ridership estimates range from 3,000 to 4,000 a day,<br />
with an average of between 751,000 to 1,100,000 patrons on an annual basis. Depending on fare<br />
pricing, this level of ridership could generate annual revenues from $1.9 million to $4.9 million.<br />
• Implementation Cost – Initial rough order-of-magnitude construction costs are estimated to range<br />
from $65 million to $75 million for the two-mile alignment, or approximately $32.5 million to<br />
$37.5 million per mile. In comparison, the cost for a mile of light rail transit can range from<br />
$150 million to $200 million per mile, indicating the anticipated cost-effectiveness of the cableway<br />
technology when compared to other transit modes for this corridor.<br />
• Operations and Maintenance Cost – Preliminary annual operations and maintenance costs were<br />
estimated at $2.6 million to $2.8 million.<br />
• Energy Consumption – The all electrical system supporting the cableway would have a low energy<br />
demand, in the range of 1.8 million kilowatts per year. By providing an alternative mode of<br />
ES-3<br />
10
transportation for commuter trips, the <strong>Skyway</strong> could cause a mode shift away from automobile trips,<br />
which would result in a reduction in GHG emissions, thus supporting the regional efforts to reduce<br />
overall carbon output. As the system expands, additional emission reductions would be anticipated as<br />
commuter trips increase.<br />
• Funding Opportunities – Finding and securing funding for any public transit project is a very<br />
competitive process. There are a number of viable funding sources, ranging from local improvements<br />
districts and public-private partnerships, to federal, state, and local transit improvement programs<br />
that could be sought. The innovative feature and cost effectiveness of the <strong>Skyway</strong> makes the project<br />
a strong candidate, setting the cableway apart from other more expensive transit systems and<br />
making it more competitive for transit-project funding opportunities and investments.<br />
6th Avenue Corridor – Tower Placement at Intersection with “Parklet” Opportunity<br />
E.4 <strong>Skyway</strong> Challenges and Next Steps<br />
There will be a number of challenges when moving forward with the proposed <strong>Skyway</strong> project. The<br />
studied alignment traverses two designated historic districts (Balboa Park and Gaslamp District).<br />
Preliminary investigation indicates the <strong>Skyway</strong> could be an enhancement to both districts. Providing an<br />
aerial connection to the districts will increase access opportunity while lessening traffic and parking<br />
demands. Additional analysis and thoughtful integration will be required.<br />
The investigated <strong>Skyway</strong> alignment would cross Interstate 5 and State Route 163. SR-163 is a designated<br />
Scenic Highway. The crossing will require coordination with and easements from Caltrans. The Ivy Street<br />
Station is in close proximity to the City’s Airport Overlay Zone. Preliminary investigation indicated the<br />
airport’s glide path can be avoided but additional analysis will be required.<br />
Preliminary geotechnical investigation has determined that the load and foundation design for the towers<br />
and stations can be achieved within the space constraints. Additional analysis will be required to<br />
determined underground utility conflicts in the 6 th Avenue right-of-way and other right-of-way challenges.<br />
In conclusion, this study has determined that the <strong>Skyway</strong> would be feasible within the studied alignment.<br />
This assessment found no fatal flaws. While the study was relatively brief, the assessment focused on the<br />
key issues that would likely affect the project going forward. Additional analysis and engineering will be<br />
required to further develop this concept.<br />
ES-4<br />
11
The idea of cableway as an urban transit mode is a unique concept. The <strong>Skyway</strong> is a new transit mode that<br />
has not been implemented in California or within the United States and has the potential to be both a<br />
bold and creative solution for the region’s future mobility. In the 1980s, the San Diego region was a<br />
national leader in reintroducing light rail transit, which helped set the stage for light rail transit to again be<br />
considered a viable mode of urban transport across the county. In a similar manner, the <strong>Skyway</strong> has the<br />
potential to be the next generation of mobility, once again placing San Diego at the forefront of transit<br />
and mobility innovation.<br />
Aerial Station Concept on 6 th Avenue - Looking North on 6 th Avenue<br />
ES-5<br />
12
13
1.0 INTRODUCTION<br />
Aerial cableway (skyway) technology is gaining significant attention around the world as an efficient and<br />
affordable mode of urban transportation. The outstanding success of the Medellín Metrocable,<br />
implemented in Medellín, Columbia, over 10 years ago, has led to other cities from around the globe<br />
constructing similar systems, with many others being planned.<br />
The success of these systems coupled with the San Diego region’s long-time interest in cost efficient and<br />
sustainable forms of urban transport has led the County of San Diego—through a “Neighborhood<br />
Investment Program” grant—to commission SANDAG to conduct the current feasibility study for<br />
constructing a skyway between the San Diego Bay and Balboa Park as illustrated in Figure 1-3. The “Bay to<br />
Park” connection has long been identified as a key and desirable linkage between two iconic features of<br />
the San Diego landscape, with the dual objectives of re-establishing Balboa Park’s relationship to<br />
downtown and better integrating downtown with the surrounding neighborhoods.<br />
1.1 Study Purpose and Objectives<br />
The purpose of this San Diego Bay to<br />
Balboa Park <strong>Skyway</strong> Feasibility Study is to<br />
assess the strengths and weakness of the<br />
proposed Bay to Park <strong>Skyway</strong> project,<br />
identifying project opportunities and<br />
threats while determining the type and<br />
extent of financial resources necessary<br />
for implementation. The study process<br />
has been structured to answer a set of<br />
questions—the answers to which would<br />
collectively determine the feasibility of<br />
the Bay to Park <strong>Skyway</strong> project and the<br />
available avenues for moving forward:<br />
Figure 1-1. Balboa Park<br />
1. What would the project look like?<br />
2. How would the project operate?<br />
3. How much would the project cost<br />
to implement?<br />
4. Who would use the Bay to Park<br />
<strong>Skyway</strong>?<br />
5. What are the financing options for<br />
implementing the Bay to Park<br />
<strong>Skyway</strong>?<br />
6. What regulatory issues might<br />
influence the project<br />
7. Are there physical features needing<br />
consideration for implementation?<br />
Figure 1-2. Downtown San Diego and San Diego Bay<br />
1-1<br />
14
1.2 Report Structure<br />
Following this Introduction section, this San Diego <strong>Skyway</strong> Feasibility Report is divided into the following<br />
sections:<br />
• Section 2: Existing Conditions provides an overview of the corridor features, facilities, regulatory, and<br />
associated environmental issues that could influence the implementation and operation of the<br />
proposed <strong>Skyway</strong>.<br />
• Section 3: <strong>Skyway</strong> System Requirements identifies the various physical and operating components of<br />
the proposed <strong>Skyway</strong> project, including the guideway length, tower and station requirements, and<br />
power system. A preliminary operating concept and associated cabin requirements are also<br />
presented.<br />
• Section 4: <strong>Skyway</strong> Market Assessment identifies likely market segments (commuters, residents, and<br />
tourists), likelihood of utilization or ridership propensity, and presents a preliminary range of<br />
ridership for near-term operations.<br />
• Section 5: <strong>Skyway</strong> Alignment Concept presents preliminary drawings and conceptual specifications<br />
of the proposed <strong>Skyway</strong> alignment, the height and type of towers (including foundation<br />
requirements), and design concepts for both terminal and intermediate stations.<br />
• Section 6: <strong>Skyway</strong> Implementation Costs and Financing provides estimates of the costs to construct<br />
and operate the proposed <strong>Skyway</strong> projects and reviews options for funding and implementing the<br />
project.<br />
• Section 7: <strong>Skyway</strong> Next Steps outlines the next steps and design considerations necessary to carry<br />
the proposed <strong>Skyway</strong> project forward.<br />
The report also contains the following supplemental appendices:<br />
Appendix A: Historic Districts and Points of Interest<br />
Appendix B: Utilities<br />
Appendix C: Typical <strong>Skyway</strong> Cabin Dimensions<br />
Appendix D: Airport Approach Overlay Zone Height Restrictions<br />
Appendix E: Soil Types<br />
Appendix F: Capital Cost Estimate<br />
Appendix G: Operation and Maintenance Cost Estimate<br />
1-2<br />
15
Figure 1-3. San Diego Bay to Balboa Park <strong>Skyway</strong> Investigated Alignment and Station Locations<br />
1-3<br />
16
17
2.0 EXISTING CONDITIONS<br />
The alignment investigated with this study begins within the Gaslamp Quarter (Gaslamp Quarter Station)<br />
in downtown San Diego and runs north on 6 th Avenue and enters Balboa Park north of Interstate 5 (I-5) at<br />
the western edge of Balboa Park. The alignment crosses State Route 163 and terminates near the parking<br />
lot west of the Organ Pavilion or an alternative location at Palm Canyon.<br />
This Existing Conditions section explores the many features, facilities, and regulatory and environmental<br />
issues that could influence the implementation and operation of an aerial gondola system in this location.<br />
2.1 Regulatory Requirements<br />
The design of the <strong>Skyway</strong> would require adherence to regulations from several different governing bodies.<br />
An overview of these groups and their associated regulations is included below.<br />
2.1.1 Cal/OSHA<br />
The California Division of Occupational Safety and Health (Cal/OSHA) is the primary agency in charge of<br />
permitting aerial passenger tramways. Functions of the department include:<br />
• Reviews official plans prior to issuing permit<br />
• Oversees initial testing<br />
• Retains as-built plans<br />
• Inspects all facilities twice annually<br />
The design and operation of the <strong>Skyway</strong> would require conformance with several statues and standards,<br />
including:<br />
• California Labor Code, Sections 7340-7357: Legislative statute delegating Cal/OSHA with regulatory<br />
authority over aerial passenger tramways<br />
• California Code of Regulations, Sections 3150-3191: Design and operational regulations issued by<br />
Cal/OSHA. Largely refers to ANSI B77.1<br />
• ANSI B77.1, Aerial Tramway Standards: Large volume of specific standards, including design (height,<br />
approach path, load points, stations, electrical, etc.), operation, evacuation, personnel training, etc.<br />
Mostly written for ski areas and most recently updated in 2011.<br />
2.1.2 California Public Utilities Commission<br />
While the California Public Utilities Commission (CPUC) does not have regulatory authority over aerial<br />
passenger tramways, the CPUC does have jurisdiction over light rail transit (LRT) corridors, which includes<br />
the <strong>Skyway</strong>’s planned crossing of C Street.<br />
The clearance above trolley contact/span wires can be interpreted as a vertical clearance under signs,<br />
which is the closest comparison to a non-energized object such as gondola covered in the regulation. Per<br />
CPUC regulations, this would require 3 feet of separation between the bottom of the gondola and the top<br />
of the overhead contact/span wires.<br />
Based on this, a 22-foot minimum clearance would be required from the lowest part of the gondola to a<br />
street surface where energized trolley wires are present. This must take into consideration cable sag and<br />
dynamic motion of the gondola cabin.<br />
For the purpose of the conceptual designs of the <strong>Skyway</strong>, a minimum of 25- to 35-foot clearance was<br />
assumed.<br />
2-1<br />
18
2.1.3 California Coastal Commission<br />
In the study area, the Coastal Zone boundary extends along Harbor Drive in an east-west direction.<br />
Assuming that all construction was to remain north of Harbor Drive, a Coastal Development Permit would<br />
not be required.<br />
2.1.4 Federal Transit Administration<br />
Should the <strong>Skyway</strong> qualify as a federal funds recipient from the FTA, it would be subject to environmental<br />
review under the National Environmental Policy Act (NEPA). As such, the <strong>Skyway</strong> would have to conform<br />
to federal regulations including Section 4(f), which applies to parklands and historic properties.<br />
2.1.5 San Diego International Airport Operations<br />
Due to its proximity to San Diego International Airport (SAN), the <strong>Skyway</strong> would be subject to<br />
development restrictions issued by the Federal Aviation Administration (FAA), the City of San Diego, and<br />
the San Diego County Regional Airport Authority (SDCRAA). Each agency conducts independent<br />
evaluations of developments near SAN, with the City of San Diego issuing development permits for<br />
projects that comply with regulations.<br />
Development regulations for each agency are described in more detail below.<br />
Federal Aviation Administration<br />
Per the City of San Diego Municipal Code, the <strong>Skyway</strong> would be subject to review by the FAA. The FAA<br />
issues national regulations on airspace. The FAA does not issue development permits, but rather<br />
evaluates permit applications for compatibility with airport operations, and issues a “Determination of No<br />
Hazard to Air Navigation” for compatible projects.<br />
Compatibility is evaluated using an imaginary surface to determine whether or not developments would<br />
be considered obstructions to air navigation near airports (per Code of Federal Regulations Part 77). Near<br />
SAN, the “Part 77” surface generally follows a 20:1 slope east of the end of Runway 27 (at the eastern<br />
edge of the airport).<br />
City of San Diego Airport Approach Overlay Zone<br />
The <strong>Skyway</strong> study area is within the City of San Diego Airport Approach Overlay Zone (AAOZ) boundary. As<br />
such, City review would be required to ensure the <strong>Skyway</strong> conforms to the AAOZ restrictions. In<br />
particular, the <strong>Skyway</strong> would need to be constructed in a manner that maintains the minimum vertical<br />
buffer between the Part 77 surface established by the Federal Aviation Administration (FAA).<br />
The approach surface is similar to the Part 77 surface; however, it is considered more restrictive as it<br />
starts 50 feet west of the east end of Runway 27 at SAN. The maximum allowable height for new<br />
structures at a given point is the elevation of the FAA Part 77 surface, minus the ground elevation.<br />
It should be noted that any structure that has a maximum height of 40 feet or lower is exempt from the<br />
AAOZ regulations, provided that the FAA has issued a “Determination of No Hazard to Air Navigation” as<br />
described above.<br />
San Diego County Regional Airport Authority<br />
Per the City of San Diego Municipal Code, the <strong>Skyway</strong> would be subject to review by the SDCRAA. The<br />
SDCRAA operates the San Diego International Airport and manages the surrounding airspace. The SDCRAA<br />
serves as the Airport Land Use Commission and adopts the Airport Land Use Compatibility Plan (ALUCP). It<br />
does not issue development permits, but rather evaluates permit applications from the local<br />
municipalities for compatibility with the ALUCP.<br />
The ALUCP uses an approach surface that is similar to the FAA Part 77 surface—named the “Threshold<br />
Sighting Surface”—to determine whether or not structures would be considered an obstruction.<br />
2-2<br />
19
2.1.6 Caltrans<br />
The right-of-way along I-5 within the study area, the 6 th Avenue Bridge and the crossing of SR-163, is<br />
Caltrans’ property. Coordination with Caltrans would be necessary for clearance and permitting<br />
requirements to ensure construction of the <strong>Skyway</strong> would not cause any adverse effects within Caltrans<br />
rights-of-way.<br />
2.2 Potential Environmental Issues<br />
The following sections provide potential environmental regulations that could affect the implementation<br />
of the <strong>Skyway</strong>.<br />
2.2.1 City of San Diego Parklands Protection<br />
Article 5, Section 55 of the City of San Diego Charter prohibits takes of parklands without a city-wide<br />
public vote. However, the opinion of SANDAG legal staff is that the <strong>Skyway</strong> would qualify as a park feature<br />
and would be exempt from regulations related to Article 5, Section 55.<br />
2.2.2 Historic Districts/Landmarks<br />
Several areas and locations within the study area are within designated historic districts and/or include<br />
designated historic landmarks (see Appendix A). Implementation of the <strong>Skyway</strong> would need to consider<br />
the effects on the locations listed below:<br />
• The Gaslamp Quarter, which is included on the National Register of Historic Places (NRHP)<br />
• Balboa Park itself, as well as several locations within the park, are included as historic districts and<br />
landmarks on the NRHP<br />
• SR-163 is a designated historic parkway and NRHP eligible<br />
Additionally, consultation with Caltrans would be necessary to determine whether or not a <strong>Skyway</strong><br />
crossing over the SR-163 freeway would require federal approval.<br />
2.2.3 Visual Impacts<br />
A more detailed assessment would need to be performed to determine whether or not the <strong>Skyway</strong> would<br />
cause any adverse visual impacts. This includes:<br />
• View of the guideway, including across the SR 163 historic parkway corridor<br />
• Views of the Laurel Street Bridge<br />
• Views of stations, bulk and mass within historic districts<br />
• Various downtown view corridors, as defined by the Downtown Community Plan (Centre City<br />
Development Corporation, 2005)<br />
2.2.4 Noise Impacts<br />
While noise from aerial operation would likely be minor, noise levels at stations from the slowdown and<br />
the acceleration of the cabins are the most problematic. Noise, either created at the stations or along the<br />
cableway would need to be evaluated to ensure no adverse effects are created by the <strong>Skyway</strong> to adjacent<br />
land uses.<br />
2.2.5 Air Quality/Greenhouse Gas Emissions<br />
Greenhouse gas (GHG) emissions from the <strong>Skyway</strong> are anticipated to be minimal and could be reduced<br />
with increased <strong>Skyway</strong> utilization and a corresponding reduction in automobile travel. The all electrical<br />
system supporting the cableway would have a low energy demand, in the range of 1.8 million kilowatts<br />
per year. By providing an alternative mode of transportation for commute trips, the <strong>Skyway</strong> could cause a<br />
2-3<br />
20
mode shift away from automobile trips, which would result in a reduction in GHG emissions. This supports<br />
the regional efforts to reduce overall carbon output. As the system expands, additional emission<br />
reductions would be anticipated as commuter trips increase. Further assessment would be required to<br />
determine the extent of GHG emissions.<br />
2.3 Corridor Mobility Features<br />
2.3.1 Roadways<br />
Within the study area, 6 th Avenue operates as a one-way (southbound), three-lane Collector roadway<br />
south of Elm Street. North of Elm Street, 6 th Avenue operates as a two-way, four-lane major arterial. Onstreet<br />
parking is available on both the east and west side of the street throughout the study area.<br />
Average daily traffic (ADT) along 6 th Avenue ranges from 5,000-6,000 vehicles the Gaslamp Quarter (south<br />
of Broadway), to between 12,000-14,000 vehicles north of Broadway.<br />
2.3.2 Transit Service<br />
Balboa Park is served by several local bus routes. Both MTS Route 7 and Route 215 (Mid-City Rapid)<br />
provide daily service along Park Boulevard. MTS Route 3 and Route 120 provide daily service on 4 th<br />
Avenue and 5 th Avenue along the western edge of the park. No bus routes operate directly on 6 th Avenue.<br />
Within Balboa Park, a free tram runs daily, providing visitors with access to parking facilities, museums<br />
and attractions.<br />
The MTS Trolley Blue and Orange Lines provide service to the Core neighborhood of Downtown, while the<br />
MTS Green Line provides service near the Gaslamp, at the existing Gaslamp Quarter Trolley Station.<br />
2.3.3 Bicycles and Pedestrians<br />
Currently, “sharrow” bike lanes are located along 6 th Avenue. Buffer-separated “bikeways” run along 4 th<br />
Avenue and 5 th Avenue, just west of the park. A Class III facility runs through Balboa Park, connecting 6 th<br />
Avenue with Park Boulevard via Laurel Street and Village Place.<br />
Pedestrian sidewalks are in place on both sides of 6 th Avenue throughout the length of the study area.<br />
Pedestrian paths and walkways are abundant throughout Balboa Park.<br />
2.4 Land Use<br />
The study area for the <strong>Skyway</strong> includes some of the most densely developed land uses in the region; as<br />
well as some of the most diverse. South of I-5, land uses include higher density multi-family residential<br />
units, commercial retail and office space, and land use dedicated to tourism and entertainment. North of<br />
I-5 and west of 6 th Avenue, land uses include less-dense single- and multi-family residential units,<br />
medium-density commercial retail and office space. Areas east of 6 th Avenue include land use dedicated<br />
to parks, recreation, and tourism.<br />
2.5 Right-of-Way<br />
The existing 6 th Avenue right-of-way varies slightly throughout the study area and can be divided into two<br />
distinct segments:<br />
• North of Interstate 5 – The 6 th Avenue right-of-way north of Elm Street is typically 60 feet wide, with<br />
a total of four general-purpose lanes (two northbound and two southbound) separated by double<br />
yellow striping. Parallel, on-street parking is available on both sides. Sidewalks exist and are<br />
separated by a landscaped buffer on both sides of the roadway.<br />
2-4<br />
21
• South of Interstate 5 – The 6 th Avenue right-of-way south of Elm Street is typically 52 feet wide, with<br />
a total of three general-purpose lanes allowing for travel in the southbound direction only. Parallel,<br />
on-street parking is available, and sidewalks are located directly adjacent to the parking right-of-way<br />
on both sides of the roadway.<br />
2.6 Utilities<br />
2.6.1 Sewer<br />
2.6.2 Water<br />
Utility constraints within the <strong>Skyway</strong> study area could affect the design of the <strong>Skyway</strong> system, particularly<br />
with regards to tower location. Underground utilities within the corridor primarily include water, sewer,<br />
and electrical, as well as storm drains (see Appendix B). Additional information is included below.<br />
Sewer lines within the study area generally run directly beneath 6 th Avenue, as well as the roadways that<br />
intersect it. A major concrete conduit runs from east to west between A Street and Ash Street.<br />
Within Balboa Park, two lines could affect the design of the <strong>Skyway</strong>. The first runs between the area just<br />
east of the intersection of 6 th and Balboa Drive (just inside the park) to a line that follows the SR-163 rightof-way.<br />
The second runs from the area just north and west of Alcazar Garden to the line underneath<br />
SR-163.<br />
Water lines within the study area generally run directly beneath 6 th Avenue, as well as the roadways that<br />
intersect it.<br />
Within Balboa Park, three lines could affect the design of the <strong>Skyway</strong>. The first two run beneath Balboa<br />
Drive and 8 th Avenue, just east of 6 th Avenue. The third includes a cluster of lines directly underneath the<br />
parking lot west of the Organ Pavilion.<br />
2.6.3 Storm Water<br />
Storm water pipes intersect with 6 th Avenue at several locations within the study area, including at or<br />
adjacent to the following roads: Market Street, F Street, E Street, Broadway, C Street, B Street, as well as<br />
within the I-5 right-of-way.<br />
Within Balboa Park, a line runs along the SR-163 alignment. Another pipe exists near the eastern edge of<br />
the parking lot west of the Organ Pavilion.<br />
2.6.4 Electrical<br />
Electrical lines are located underground throughout the study area, and City of San Diego engineering<br />
staff report that these lines are typically buried on both sides of roadways, adjacent to each curb. More<br />
detailed information regarding utility locations would need to be requested from the San Diego Gas and<br />
Electric Company.<br />
2.7 Topography<br />
The topography varies throughout the study area. Ground elevation along 6 th Avenue generally increases<br />
from south to north along a moderate grade. The overall average slope along 6 th Avenue is 3 percent. The<br />
average slope is 2 percent south of I-5, and increases to an average of 5 percent north of I-5.<br />
Through Balboa Park, the ground elevation changes significantly from east to west, specifically as it<br />
approaches SR-163. The average slope between 6 th Avenue and SR-163 is about 5 percent, and increases<br />
to an average of approximately 14 percent between SR-163 and the parking lot west of the Organ<br />
Pavilion.<br />
2-5<br />
22
2.8 Planned and Future Facilities<br />
Several planning documents include plans for improvements to facilities within the study area. Specific<br />
improvements are described in more detail below.<br />
2.8.1 SANDAG 2050 RTP (San Diego Forward)<br />
Neither the <strong>Skyway</strong>, nor projects that are similar in nature, are identified as a potential mode of<br />
transportation in the SANDAG 2050 Regional Transportation Plan. However, it should be noted that<br />
construction and operation of a facility similar to the <strong>Skyway</strong> has the potential to reduce GHG emissions,<br />
as promulgated by the RTP and would likely improve the chances of meeting the GHG emissions targets<br />
that are mandated by SB 375.<br />
2.8.2 SANDAG Regional Bike Plan Early Action Program<br />
The SANDAG Regional Bike Plan Early Action Program includes plans for several bicycle facilities within the<br />
study area, primarily along roadways which would intersect the <strong>Skyway</strong> alignment, including Market<br />
Street, C Street, and B Street. Consideration would need to be taken in order to ensure that <strong>Skyway</strong><br />
towers do not cause an impact on the proposed facilities.<br />
2.8.3 City of San Diego Bicycle Master Plan<br />
The City of San Diego Bicycle Master Plan (BMP) includes plans for several new facilities within the study<br />
area, most notably a Class II facility along 6 th Avenue north of Broadway. It is not anticipated that the<br />
proposed <strong>Skyway</strong> would have an adverse impact on the planned Class II facility.<br />
Improvements to the bicycle network are included along several other roadways that would intersect the<br />
<strong>Skyway</strong> alignment at 6 th Avenue, including Broadway, C Street, and B Street. Consideration would need to<br />
be taken in order to ensure that <strong>Skyway</strong> towers do not cause an impact on the proposed facilities.<br />
2.8.4 Downtown Community Plan<br />
The Downtown Community Plan (CCDC, 2005) has designated 6 th Avenue between Harbor Drive and Date<br />
Street as a “Pedestrian Priority Zone,” meaning the concentration of pedestrian volumes is likely to be<br />
greater than areas outside these zones. Consideration would need to be taken to ensure pedestrian<br />
facilities would not be adversely affected by the construction of the <strong>Skyway</strong>.<br />
The Plan has also designated 6 th Avenue north of Grape Street as a potential “Bay to Park” shuttle route.<br />
Consideration would need to be taken to ensure the <strong>Skyway</strong> would not adversely affect the ability to<br />
operate the shuttle.<br />
2.8.5 Balboa Park Master Plan and Central Mesa Precise Plan<br />
The Balboa Park Master Plan includes a system of trails within Balboa Park, providing visitors with access<br />
to more naturalized areas within the park. Some of these trails are located on the hillside east of SR-163<br />
and south of the Laurel Street Bridge including the archery range and targets in this area. Consideration<br />
would need to be taken to ensure elements of these networks would or uses not be adversely affected by<br />
the construction of the <strong>Skyway</strong>.<br />
The Plan also identifies 8 th Drive and Balboa Drive—which run in a north-to-south direction just east of 6 th<br />
Avenue—as principal circulation routes within the park. Consideration would need to be taken to ensure<br />
these roadways would not be adversely affected by the <strong>Skyway</strong>.<br />
2-6<br />
23
The Plan identifies the surface parking lot west of the Organ Pavilion as a parking area, containing 137<br />
spaces. Any encroachment into this parking area would likely require mitigation measures to offset the<br />
taking of any parking spaces.<br />
None of the aforementioned elements were modified as part of the more-recently adopted Balboa Park<br />
Precise Plan.<br />
2.8.6 Downtown San Diego Mobility Plan<br />
The Downtown San Diego Mobility Plan, developed by Civic San Diego and projected to be adopted by the<br />
City of San Diego City Council in July 2015, is proposing to add several new facilities to facilitate safer and<br />
more efficient movement of cyclists and pedestrians throughout the Centre City. The <strong>Skyway</strong> would need<br />
to consider the effects on any facilities that run along or intersect the proposed alignment.<br />
2-7<br />
24
25
3.0 SYSTEM REQUIREMENTS<br />
The following section provides an overview of the <strong>Skyway</strong> system requirements, including operations and<br />
capacity, station sizes and cabin requirements.<br />
3.1 System Design<br />
The preliminary conceptual design specifications for the <strong>Skyway</strong> system are described in more detail<br />
below.<br />
3.1.1 System Length<br />
The overall system would run approximately 2 miles (10,486 feet) in length. It would run approximately<br />
1.53 miles along 6 th Avenue through Downtown and Banker’s Hill, and another 0.45 miles through Balboa<br />
Park.<br />
3.1.2 Operations and Capacity<br />
The typical travel speed for the <strong>Skyway</strong> system would be 1,200 feet per minute (13.6 mph). While<br />
unloading and loading passengers at each mid-station, the cabins would travel at a slower speed of<br />
60 feet per minute and take approximately one minute to pass through each station. Assuming these<br />
speeds, the overall end-to-end travel time for the 2-mile alignment would be approximately 12 minutes.<br />
Assuming a travel speed of 1,200 feet per minute, the cabins would be spaced 240 feet apart between<br />
stations. At each station, the cabins would cluster together while running at slower speeds, with as many<br />
as five cabins grouped together at any given time. At maximum operation, the <strong>Skyway</strong> could serve up to<br />
2,400 persons per hour (PPH) per direction.<br />
3.1.3 Cabins and Cable Type<br />
<strong>Skyway</strong> cabins would be about 6.5 feet by 6 feet by 7 feet in size, and would accommodate a maximum of<br />
eight (8) passengers at a time (see Appendix C). The <strong>Skyway</strong> cabins could be modified to include features<br />
designed to enhance the overall passenger experience, such as enhanced ventilation, air conditioning, and<br />
internet access (wi-fi). The <strong>Skyway</strong> cabins could also be fitted with bicycle racks on the exterior of the<br />
cabins, making them a more attractive option for cyclists and as a “first mile – last mile” option.<br />
The cabins would be connected to a cable type ropeway made of woven steel, which would run in a<br />
continuous loop throughout the system.<br />
3.1.4 Power System<br />
Assuming operations would serve 2,400 persons per hour (PPH), the <strong>Skyway</strong> would be powered by a 500<br />
horse power motor, resulting in a power usage of 360 kilowatts (KW) or about 0.15 KW/PPH.<br />
3.1.5 Tower Type and Options<br />
Between stations, the <strong>Skyway</strong> would be supported by several towers. Within the urban areas of the<br />
alignment, the towers would be spaced approximately 370–380 feet apart, dependent on block lengths.<br />
Within Balboa Park, the distance between towers could vary.<br />
The height of the <strong>Skyway</strong> towers is dependent on the following:<br />
• Minimum clearance desired between the ground level and the bottom of the cab (25 feet to 35 feet)<br />
• Spacing of the towers (370–380 feet)<br />
• Cable sag based on tower spacing (3.5 percent of horizontal distance between the towers or 13 feet)<br />
The towers would be approximately 77 feet to 87 feet in height, depending on the desired clearance.<br />
3-1<br />
26
3.1.6 Safety<br />
Within Balboa Park, it may be beneficial to follow the natural terrain to maintain the required vertical<br />
clearance without increasing the tower heights.<br />
There are a number of options for the tower designs that could be used for this alignment. A single tower,<br />
cantilevered, “whale bone” or a configuration spanning the street may be used depending on the<br />
environment and cost, among other factors. Tower options are shown in Chapter 5.3. For this study, the<br />
cantilevered tower was selected due to small footprint and lower visual impact to the streetscape in 6 th<br />
Avenue. For the towers in Balboa Park, the single tower configuration was selected. The width of each<br />
tower would be approximately 5 feet by 5 feet.<br />
<strong>Skyway</strong> operation would be possible at wind speeds of up to 100km/hr (60 m/hr), though full speed<br />
operation is only possible up to wind speeds of around 40 MPH. Should wind speeds increase to 40-60<br />
MPH, the system can operate at slow speeds, and would typically be done with the purpose of unloading<br />
the system. System evacuation measures would need to be established before operations begin, and<br />
would require coordination with local emergency services departments.<br />
During operations, an attendant would be present at each station to monitor the safety and security of<br />
<strong>Skyway</strong> passengers.<br />
3.1.7 Americans with Disabilities Act<br />
The <strong>Skyway</strong> system would by necessity be ADA compliant. Level-access boarding would enable boardings<br />
for passengers with mobility challenges. An attendant would be available at each station to assist<br />
passengers, if needed. Elevators would be present at each station, providing passengers with access to<br />
the station platform.<br />
3.1.8 Station Footprint<br />
<strong>Skyway</strong> stations would vary in size, depending on their location within the system.<br />
End Station: Overall, the end station footprint would be about 50’ by 110’ in size. This would include a<br />
traction unit that is approximately 28’ by 85’ in size and the boarding and disembarking areas. The width<br />
can increase if an end station is elevated to provide vertical access features – such as elevators and stairs.<br />
At one end station, more room would be required for cabin storage and maintenance facilities. Specific<br />
storage requirements would vary based on ridership demands. Typically, the storage area is located either<br />
adjacent to the station platform or placed under that station depending on the site constraints.<br />
Intermediate Station: The footprint for the intermediate station would be approximately 50 feet x<br />
160 feet to 180 feet, and would require more room to incorporate elevators and stairs. The longer length<br />
is due to both the boarding and disembarking occurring on one side for each direction. Whereas the end<br />
station the boarding takes place on one side and the disembarking occurs on the other side of the station<br />
platform as illustrated in Figure 5-1.<br />
3.2 Preliminary Operating Concept<br />
A preliminary operating concept was developed based upon typical requirements and utilization<br />
expectations as detailed below. With further study, refinements would occur along with actual operating<br />
experience.<br />
3.2.1 Service Period<br />
It was assumed that the <strong>Skyway</strong> would generally operate seven (7) days per week, between 12–16 hours<br />
per day, depending on the day of the week. Specific operating windows would be as follows:<br />
• Monday thru Thursday – 8:00 AM to 8:00 PM<br />
• Friday thru Sunday – 8:00 AM to 12:00 PM<br />
3-2<br />
27
3.2.2 Service Frequency and Capacity<br />
In order to avoid costly upgrades several years into operations, <strong>Skyway</strong> system infrastructure would be<br />
designed to accommodate the maximum demand of 2,400 PPH in one direction. An estimate of the<br />
number of cabins, however, can be calculated based on anticipated operational frequencies, which would<br />
consider actual passenger demands, as well as seasonal changes in demand.<br />
Table 3-1 displays relationship between service frequencies, capacity, and cabin requirements. As shown,<br />
with higher service frequencies, the more capacity is provided along with higher cabin requirements.<br />
Table 3-1. Potential Cabin Requirements<br />
Interval between Directional Capacity 1<br />
Number of Cabins Number of Intermediate<br />
Cabins (Seconds) Hourly Daily<br />
Needed 2<br />
Stops<br />
12.0 2,400 28,800 141 2<br />
20.0 1,440 17,280 99 2<br />
30.0 960 11,520 78 2<br />
45.0 640 7,680 64 2<br />
60.0 480 5,760 57 2<br />
120.0 240 2,880 47 2<br />
240.0 120 1,440 41 2<br />
Source: Doppelmayr<br />
Notes: 1) Directional capacity based on 8-person cabins;<br />
2) Assumes a spare ratio of 1.2 (170 cabins total at highest capacity)<br />
3-3<br />
28
29
4.0 MARKET ASSESSMENT<br />
Chapter 4 provides a preliminary indication of the ridership potential of the proposed <strong>Skyway</strong> project. In<br />
general, the <strong>Skyway</strong>’s ridership would be a function of two primary factors: 1) the utility of the <strong>Skyway</strong> in<br />
serving localized travel needs and patterns; and 2) the novelty or ultimate popularity of the <strong>Skyway</strong> itself<br />
to attract new and additional tourist activity.<br />
The market assessment process included a number of key steps as depicted in Figure 4-1. Including an<br />
initial identification of market segments based upon trip purpose, developing estimates of low to high<br />
propensity or likelihood of using the <strong>Skyway</strong> by market segment, leading to an annualized estimate of<br />
<strong>Skyway</strong> ridership incorporating peak seasonal utilization by locals as well as increased levels of tourist<br />
activity. The market assessment focused on the year 2020 as the near-term planning horizon.<br />
Define Market Segments and Catchment Area<br />
Identify Candidate Trips<br />
Trip Origin/Destination Patterns<br />
Accessibility<br />
Estimate <strong>Skyway</strong> Ridership Propensity (Utilization) Factors<br />
Travel Patterns/Accessibility Distance/Travel Time Cost<br />
Figure 4-1. Market Assessment Process<br />
4.1 Identification of Market Segments<br />
Market segments – or types of trips – were identified in order to provide an estimate of potential <strong>Skyway</strong><br />
ridership. The process used to identify the study areas, as well as the aforementioned market segments, is<br />
outlined in more detail below.<br />
4.1.1 Assessment Study Area<br />
Planning-level Ridership Estimates<br />
Range from “Low” to “High” Ridership<br />
The <strong>Skyway</strong> Study Area represents the functional activity area that would be served by the <strong>Skyway</strong>, and<br />
hence the area that would function as the market catchment area; e.g. the source of ridership. The<br />
identified <strong>Skyway</strong> Study Area includes the community planning areas of Centre City and Balboa Park, as<br />
well as a portion of the Uptown community. The Study Area, as shown below in Figure 4-2, was<br />
subdivided into 25 subareas to facilitate a more detailed review of activity and travel patterns.<br />
4-1<br />
30
Figure 4-2. <strong>Skyway</strong> Study Area<br />
4-2<br />
31
4.1.2 Study Area Activity<br />
The identified study area for the <strong>Skyway</strong> includes some of the most densely developed land uses in the<br />
region; as well as some of the most diverse. Land uses within the study area include higher density singleand<br />
multi-family residential units, commercial retail and office space, and land use dedicated to parks,<br />
recreation and tourism. Table 4-1 provides a quantitative summary of forecast land use and associated<br />
activity levels within the study area.<br />
Table 4-1. Projected Activity within the Study Area<br />
Activity 2020 Buildout<br />
Population 55,900 98,000<br />
Employment 78,600 92,600<br />
Dwelling Units 30,100 53,100<br />
Hotel Rooms 9,500 20,000<br />
Office (Msf) 14.5 29.8<br />
Retail (Msf) 2.8 6.1<br />
Recreation and tourism also account for a significant amount of activity within the study area. Downtown<br />
San Diego is home to several major tourist destinations within the region, including the historic Gaslamp<br />
District, Seaport Village, and the USS Midway Museum. Balboa Park is one of the largest urban parks in<br />
the country, and along with the San Diego Zoo, attracts several million visitors annually. Annual<br />
attendance information for the major visitor and tourist destinations within the study area is summarized<br />
below in Table 4-2.<br />
Table 4-2. Projected Tourist Activity within the Study Area<br />
Tourist Attraction<br />
Annual Attendance<br />
(Year)<br />
Balboa Park/Zoo 14,000,000 (2014)<br />
SD Convention Center 800,000 (2014)<br />
Petco Park 2,700,000 (2014)<br />
USS Midway Museum 1,100,000 (2012)<br />
Gaslamp District 6,800,000 (2008)<br />
Seaport Village/Embarcadero 4,100,000 (2014)<br />
4-3<br />
32
4.1.3 <strong>Skyway</strong> Market Segments<br />
Both residents and tourists alike are drawn to the study area due to a wide range of activities and<br />
attractions, providing a source of potential trip activity for the <strong>Skyway</strong>. The market for <strong>Skyway</strong> trips can be<br />
broken down into individual segments as follows:<br />
• Resident Commuter Trips: commute trips made by residents who work within the study area<br />
• Resident Non-Work Trips: trips made by residents for non-work related activities, such as shopping,<br />
personal business, and for purposes of recreation<br />
• Tourist/Visitor Trips: trips made by local residents and out-of-town visitors to attractions such as<br />
Balboa Park and the Gaslamp Quarter.<br />
Travel data for the 2020 forecast year was derived from the SANDAG Transportation Model (Series 12),<br />
including the number of daily person-trips within the study area. The study area person-trips were then<br />
aggregated and summarized based on associated trip types and market segments, including whether or<br />
not they were internal or external to the study area. A summary of daily person-trips for the <strong>Skyway</strong> study<br />
area is shown below in Table 4-3.<br />
Trip Type<br />
Table 4-3. Study Area Daily Trips (SANDAG, 2020)<br />
Resident Resident<br />
Work Non-Work Visitor Total<br />
Internal 21,700 247,200 54,600 323,500<br />
External 123,400 586,900 98,600 808,900<br />
Total 145,100 834,100 153,200 1,132,400<br />
4.2 Candidate <strong>Skyway</strong> Trips<br />
A multi-tiered screening process was undertaken to produce an estimate of candidate trips for the<br />
<strong>Skyway</strong>, e.g. trips that would potentially utilize the <strong>Skyway</strong>. The initial screening assumed any potential<br />
<strong>Skyway</strong> would be internal to the study area, with both origin and destination within the study area. As<br />
shown above, the number of internal trips in the study area is projected to be approximately 323,500.<br />
4.2.1 Viable Trip Interchanges and Candidate <strong>Skyway</strong> Trips<br />
The second-level screening involved estimating from the internal study area trips, the number of trips that<br />
are truly viable <strong>Skyway</strong> trip interchanges with origins and destinations that would logically be served by<br />
the <strong>Skyway</strong> alignment and station locations. For example, a trip from the Gaslamp Quarter to Balboa Park<br />
could logically be made via the <strong>Skyway</strong>, whereas a trip from the East Village to Little Italy would not likely<br />
use the <strong>Skyway</strong>. Figure 4-3 displays those subareas of the study area, which would logically be served by<br />
the <strong>Skyway</strong>. Trip interchanges between these subareas were identified as viable <strong>Skyway</strong> trip interchanges.<br />
The SANDAG Series 12 model data is generally used to model bus and rail transit modes, and has not<br />
previously been used to model a gondola system. In order to estimate ridership, the <strong>Skyway</strong> was modeled<br />
with similar characteristics—speed and fare price—as bus rapid transit, or BRT.<br />
4-4<br />
33
Figure 4-3. Viable Trip Interchanges<br />
4-5<br />
34
The Series 12 model data represents an average weekday condition, and does not account for fluctuations<br />
in travel activity on weekends or peak seasonal (June through August) activity. Since the objective in<br />
preparing an annualized ridership estimate is to account for all levels of trip activity during a year, a series<br />
of “day types” based upon peak and off-peak conditions were established, and candidate trip activity was<br />
estimated for each. The different day types that were used are:<br />
• Non-Peak Weekday: this is the day type that is modeled by the Series 12 model and represents an<br />
average weekday<br />
• Non-Peak Weekend: these represent weekend days during non-peak months. Resident based trips<br />
(both work and non-work) tend to be lower than weekdays, whereas visitor/tourist trips tend to<br />
increase.<br />
• Peak Weekday: represents a weekday during peak seasons. Resident work activity is similar to a nonpeak<br />
weekday, whereas resident non-work and visitor/tourist activity tend to increase.<br />
• Peak Weekend: represents a weekend day during peak seasons. Resident work and non-work activity<br />
is similar to a non-peak weekend. Visitor/tourist activity is the highest of all day types.<br />
Historic visitor attendance data from the USS Midway museum was used to estimate the variations in<br />
visitor/tourist travel activity throughout the year. Data from the Midway shows the highest attendance<br />
occurs during the months of June, July and August. Attendance increases by approximately 30 percent<br />
between May and June, and again by approximately 30 percent from June to July. Attendance decreases<br />
significantly (35 percent) between August and September.<br />
The Transit Cooperative Research Program (TCRP) Report 73: Characteristics of Urban Travel Demand<br />
(Transportation Research Board, 2002) was used to estimate the changes in resident based activity (work<br />
and non-work) for weekends versus weekdays.<br />
The resulting number of candidate trips for the <strong>Skyway</strong> (internal/viable trip interchanges), based on the<br />
SANDAG Series 12 forecast and incorporating estimates for each of the additional day types, is shown<br />
below in Table 4-4 by market segment.<br />
Table 4-4. Candidate <strong>Skyway</strong> Trips by Market Segment and Day Type (Year 2020)<br />
Non-Peak Weekday Candidate Trips<br />
Resident Work 3,400<br />
Resident Non-Work 29,800<br />
Visitor/Tourist 8,500<br />
Total Trips 41,700<br />
Non-Peak Weekend<br />
Resident Work 1,100<br />
Resident Non-Work 20,900<br />
Visitor/Tourist 12,860<br />
Total Trips 34,860<br />
Peak Weekday<br />
Resident Work 3,400<br />
Resident Non-Work 29,800<br />
Visitor/Tourist 14,239<br />
Total Trips 47,439<br />
Peak Weekend<br />
Resident Work 1,100<br />
Resident Non-Work 20,900<br />
Visitor/Tourist 18,219<br />
Total Trips 40,219<br />
4-6<br />
35
4.3 <strong>Skyway</strong> Ridership Propensity<br />
Propensity factors account for likelihood of utilization based upon such considerations as travel patterns<br />
and accessibility, distance and travel time, and cost. A range of propensities were derived for each market<br />
segment based upon knowledge of typical transit services and likely utilization, and are summarized<br />
below in Table 4-5. In general, the assumption is that, compared to the tourist/visitor trip, the resident<br />
based trips would have a lower propensity to use the <strong>Skyway</strong>.<br />
Table 4-5. <strong>Skyway</strong> Propensity Factors<br />
Market Segment Candidate Trips <strong>Skyway</strong> Propensity<br />
High Medium Low<br />
Resident Work 3,400 5–8% 3–5% 1–2%<br />
Resident Non-Work 29,800 3–5% 2–3% 1–2%<br />
Tourist/Visitor 8,500 10–15% 7–10% 5–7%<br />
Total 41,700<br />
4.4 Preliminary <strong>Skyway</strong> Ridership Forecasts<br />
Preliminary <strong>Skyway</strong> ridership forecasts were estimated using a multi-step process, which is described in<br />
more detail in the following section.<br />
4.4.1 Annualized Base Estimates<br />
As trip activity fluctuates throughout the year, it is important to view activity on an annual basis. In order<br />
to do so, the following steps were undertaken:<br />
The application of the ridership propensities (as noted above) to daily trips to estimate trips by market<br />
segment for each day type<br />
The annualization of trips by multiplying “low” and “high” propensities by the number of calendar days in<br />
a year for each corresponding day type.<br />
Calculate a “Base Ridership” range by summing “low” and “high” annualized trips for each day type, for<br />
each corresponding market segment.<br />
A summary of annualized base estimates is included below in Table 4-7. As shown, the <strong>Skyway</strong> is<br />
projected to produce between 610,000 and 910,000 annual trips.<br />
4.4.2 Special Event Trips<br />
While general visitor and tourist activity can be accounted for by the Series 12 forecast, it does not take<br />
into account special event activity. Events such as Comic Con, Padres games, and December Nights can<br />
cause a surge in visitor and tourist activity within the study area, as well as demand for <strong>Skyway</strong> use. An<br />
estimate of annual <strong>Skyway</strong> ridership from special event trips is included below in Table 4-6.<br />
Table 4-6. Special Event Trips<br />
Event Annual Attendance 1 Propensity Projected Ridership<br />
Comic Con 130,000 10% 13,000<br />
Petco Park Events 2,700,000 1% 27,000<br />
December Nights 325,000 10% 32,500<br />
Total Ridership 72,500<br />
1 Special event ridership taken from the following sources: Comic Con: San Diego Convention Center 2014<br />
Annual Report; Petco Park: http://www.baseball-reference.com (2014); December Nights:<br />
http://www.balboapark.org/decembernights (2014)<br />
4-7<br />
36
4.4.3 Novelty Effects/Induced Tourist Activity<br />
Another type of trip not accounted for in the model is that which is created based on the provision of<br />
<strong>Skyway</strong> service alone. This is often described as “induced demand” or the “novelty effect.” An additional<br />
conservative factor of 10 percent was applied to the base ridership and special events trips to account for<br />
the likely addition of attracted trips, and would generate between approximately 68,000 and 98,000<br />
additional annual trips.<br />
A summary showing the total candidate trips is included below in Table 4-7. As shown, when factoring in<br />
trips for special events and those attracted by the “novelty effect,” it is estimated that between<br />
approximately 751,000 and 1,100,000 <strong>Skyway</strong> trips (one-way) would be made on an annualized basis.<br />
4.4.4 Station Boarding Activity<br />
Table 4-7. Annual Ridership Summary<br />
<strong>Skyway</strong> Ridership<br />
Low<br />
Annual Trips<br />
High<br />
Base Annual Trips 610,000 910,000<br />
Total Special Event Trips 72,500 72,500<br />
Annual Trips with Special Events 682,500 982,500<br />
Novelty Trips (10%) 68,250 98,250<br />
Total Annual Trips 750,750 1,080,750<br />
<strong>Skyway</strong> station boarding activity from the SANDAG Series 12 model was examined. Generally, boardings<br />
by station vary depending on activity within the study area. The model data for an average weekday<br />
shows a higher percentage of boardings at each of the two mid-stations (Juniper Street and B Street)<br />
during an average day. It would an anticipated that a higher percentage of boardings at the terminal<br />
stations (Gaslamp Quarter and Balboa Park) would occur on weekends, and for special events and tourist<br />
activities. Figure 4-4 shows the variation in the estimated distribution of boardings by station under<br />
average weekday and that which would more likely occur during special events or periods of high<br />
tourist/visitor activity.<br />
4-8<br />
37
Figure 4-4. Station Boarding Activity<br />
4-9<br />
38
39
5.0 ALIGNMENT CONCEPT<br />
This section provides a review of the proposed <strong>Skyway</strong> including assumed alignment, station locations,<br />
tower types and tower locations.<br />
5.1 Alignment<br />
The proposed cableway alignment would be approximately 2-miles (10,468-ft) in length, starting in the<br />
Gaslamp Quarter and following 6th Avenue, ending in the West Parking Lot of Balboa Park. Four possible<br />
station locations would support the investigated alignment as illustrated in Figure 5-2. The distances<br />
between the stations would vary, as shown below:<br />
• Gaslamp Quarter Trolley Station to B Street: 0.80 mile (4,224 ft.)<br />
• B Street to Ivy Street: 0.73 mile (3,864 ft.)<br />
• Ivy Street to West Parking: 0.45 mile (2,380 ft.)<br />
The cableway alignment would be within the street right-of-way along east side 6th Avenue. Generally,<br />
the cabins would be overhead of the travel lanes on 6th Avenue. When the alignment reaches Ivy Street it<br />
would turn to the east and then travel within Balboa Park to the West Parking lot west of the Organ<br />
Pavilion. Where the alignment crosses SR-163 it is approximately 630 feet south of the Laurel Street<br />
Bridge.<br />
5.2 Station Design and Locations<br />
Four stations would provide access points to the cableway, including two “End Stations” (one at the south<br />
end of 6th Avenue and adjacent to the Gaslamp Quarter trolley station plaza and the other located in the<br />
parking lot west of the Organ Pavilion in Balboa Park) and two “Intermediate stations” (one at 6th Avenue<br />
and north of B Street and the other at the intersection of 6 th Avenue and Ivy Street). The following is a<br />
brief description of each station type requirements and then an overview of the station locations.<br />
5.2.1 End Stations<br />
A typical end station footprint would be approximately 120 feet x 60 feet and would accommodate all the<br />
workings of the cableway system plus the platform area for boarding and debarking. If elevated, this<br />
station would also require elevators and stairs to provide access and provisions for ADA requirements. A<br />
typical end station footprint is illustrated in Figure 5-1.<br />
Figure 5-1. Typical End Station Footprint<br />
5-1<br />
40
Figure 5-2. <strong>Skyway</strong> Investigated Alignment with Station Locations<br />
5-2<br />
41
Gaslamp Plaza Station<br />
Several alternatives for an elevated station at this location were reviewed. The primary requirement<br />
would be to line up the north end of the station with 6 th Avenue, thus enabling the cable and cars to exit<br />
the station in a direct line along the eastside of 6 th Avenue. An adequate amount of lateral clearance from<br />
the Omni Hotel would also need to be provided. The different alternatives are illustrated in Figure 5-3 and<br />
Figure 5-4.<br />
Another station option at this location would be an elevated station on the north side of L Street as<br />
illustrated in Figure 5-5. This would allow the station and the cabins to be in direct vertical and horizontal<br />
alignment with the proposed towers on 6 th Avenue and avoid any potential conflicts with the Omni Hotel.<br />
In all cases the station would be elevated in order to achieve the 25- to 35-foot clearance over the street<br />
level as the cabins exit the station.<br />
Figure 5-3. Gaslamp Station Alternative 1<br />
5-3<br />
42
Figure 5-4. Gaslamp Station Alternative 2<br />
Figure 5-5. Gaslamp Station Alternative 3 – North of L Street<br />
5-4<br />
43
Balboa Park<br />
Two options were reviewed for the end station in Balboa Park, and are described in more detail below.<br />
West Parking: To the west of the Organ Pavilion is a 137-space parking lot. For this assessment the station<br />
was placed at-grade near the southwest end of the parking lot facing toward SR-163. There would be<br />
sufficient room for the station footprint, but there could be a loss of parking spaces. This would depend<br />
on the final placement of the station and the reconfiguration of the lot to accommodate the facility.<br />
The site plan as illustrated in Figure 5-6 shows the tentative station location. The station would also<br />
provide for the cabin storage and maintenance facility necessary for the cableway to operate. This storage<br />
area would be placed under the station platform and built into the hillside. The dashed line in Figure 5-6<br />
illustrates the potential outline of the storage and maintenance area.<br />
This placement of the station in this location would require the shortest alignment distance and the least<br />
amount of effect to the surrounding hillside. This location however, would be somewhat hidden from the<br />
remainder of the park and could prove difficult for transit patrons to locate.<br />
Figure 5-6. West Parking – End Station location in Balboa Park<br />
5-5<br />
44
Palm Canyon: The Palm Canyon station would be located further east of the West Parking station location<br />
and face out toward the park near the Speckles Organ Pavilion as illustrated in Figure 5-7. This location<br />
would present a better connection to the park’s Central Mesa area and would have higher visibility to<br />
park users and potentially result in higher patron use. However, the longer distance up Palm Canyon and<br />
the placement of the storage and maintenance requirements could have more impacts to the surrounding<br />
hillsides, trails and the collection of palm trees for which the canyon is noted.<br />
Figure 5-7. Palm Canyon in Balboa Park<br />
5-6<br />
45
5.2.2 Intermediate Stations<br />
Intermediate station sizes can vary but are typically longer than end stations. This is due to access<br />
requirements of both departing and embarking of passengers happening on one side. The length of the<br />
platform tends to be longer (140 feet to 160 feet), while the width of the station remains the same as an<br />
end station. Two intermediate station locations were reviewed, and are described in more detail below.<br />
B Street and 6 th Avenue<br />
This station is in the heart of downtown business district and would primarily serve commuter patrons.<br />
The elevated station is illustrated in Figure 5-8 and Figure 5-11. As shown, the station would be located<br />
north of B Street with fewer potential effects on the surrounding land uses. On the west side of the street<br />
there is vehicle access to a parking garage, a service area, and small commercial store front facing 6 th<br />
Avenue but taking it access from B Street. On the east side there is a large plaza and ingress and egress to<br />
the parking garage serving the Bridgeport building at 600 B Street.<br />
There would be challenges fitting an elevated station in at this location. However, of all the blocks serving<br />
the business district, this has perhaps the fewest constraints and issues associated with the adjacent land<br />
uses. Street level retail is limited and pedestrian entrances to buildings would not be located under the<br />
footprint of the station. Minimizing the impacts to vehicular access and placement of the necessary<br />
columns/foundations to support the elevated station would be among the key issues that would need to<br />
be addressed.<br />
Figure 5-8. Site Plan of B Street Station<br />
5-7<br />
46
Figure 5-9. Looking West on the North Side of B Street<br />
Figure 5-10. Looking West on the North Side of B Street<br />
Figure 5-11. Elevated Station Concept at B Street<br />
5-8<br />
47
Ivy Street and 6 th Avenue<br />
The Ivy Street Station would be an elevated station wherein the cableway would turn east into Balboa<br />
Park and toward the end station proposed at either West Parking or Palm Canyon. This station location<br />
(and the tower height at Hawthorne) would fit within the height restriction imposed by the City’s Airport<br />
Approach Overlay Zone (AAOZ) as shown in Appendix D). To adequately provide for the length of the<br />
station platform, the station would have to be extended to the centerline of 6 th Avenue as illustrated in<br />
Figure 5-12. A concept sketch of a station elevation is provided in Figure 5-13.<br />
Careful placement would be needed to avoid the existing Chess Club building to the north of the station<br />
as well as to minimize the impact to the small canyon located just to the east.<br />
A “Turn-Station” without a station boarding area was also considered at this location. However, it was<br />
determined based upon the ridership assessment that a full intermediate station at this location would be<br />
important to linking with the adjacent neighborhoods and capturing a larger share of commuter trips.<br />
Figure 5-12. Elevated Station Concept at Ivy Street<br />
Figure 5-13. Profile View of Ivy Street Station<br />
5-9<br />
48
5.2.3 Other Stations Studied<br />
Several other station locations were studied to determine if alternative locations would improve the<br />
alignment or provide better access to Balboa Park. These stations are described in more detail below.<br />
Juniper Street Station<br />
A station was studied at 6 th Avenue and Juniper Street as illustrated in Figure 5-14. This station was<br />
eliminated from consideration due to the AAOZ restrictions as illustrated in Appendix D. The station and<br />
the support tower at Ivy Street would conflict with allowable height at this location. However, in future<br />
studies, consideration to revisiting this location and confirming the height restrictions is recommended.<br />
This station is closer and more accessible to the more intensive land uses north of the station and could<br />
potentially serve the commuter patrons better than the Ivy Street Station.<br />
Figure 5-14. Elevated Station Concept at Juniper Street<br />
Figure 5-15. West Side View of Juniper Street at 6th Avenue<br />
5-10<br />
49
Elm Street Station<br />
An Elm Street Station was reviewed in order to facilitate a modified alignment with a terminal cableway<br />
station at the Air and Space Museum. The station would be located in Caltrans right-of-way just south of<br />
the 6 th Avenue exit ramp from I-5 as illustrated in Figure 5-16. The elevated station at this location would<br />
fit based upon spacing requirements; however, it would only be applicable if the cableway alignment<br />
were to terminate at the Air and Space Museum.<br />
This station, if pursued, could also become part of the broader vision for the bridge improvement plans at<br />
6th Avenue proposed by Civic San Diego. It should be noted that having the turn-station at this location<br />
would lose the commuter patron and potential significantly reduce the ridership.<br />
Figure 5-16. Station Concept at Elm Street and 6th Avenue<br />
Figure 5-17. View Looking East from 6 th Avenue<br />
5-11<br />
50
Air and Space Museum Station<br />
A station located at or near the Air and Space Museum was investigated as another alternative location<br />
for the terminus station within Balboa Park. This location appears to be problematic as expansion plans<br />
for both the Air and Space Museum and the Automobile Museum would be located in the same area.<br />
5.3 Tower Types and Location<br />
5.3.1 Cantilever Towers<br />
While a number of tower types were reviewed for 6 th Avenue, it was determined that a cantilevered<br />
tower would have the least impact when placed within the street right-of-way. A single tower would have<br />
to been placed within the roadway travel lanes requiring the street section to be modified. With the<br />
cantilevered tower, it could be placed on the eastside of 6 th Avenue with the arm extending over the<br />
travel lanes as illustrated on the left side of Figure 5-18.<br />
Figure 5-18. Tower Alternatives Reviewed<br />
The height of the tower is determined by the clearance needed from the bottom of the cabin and the<br />
travel way below. Also, the “sag” of the cable between the towers needs to be considered. The “sag” is<br />
calculated at 3.5 percent of the distance between adjacent towers. For this initial feasibility study,<br />
clearances of both 25 feet and 35 feet above the travel ways were studied. Placing one tower per block<br />
would require a spacing of approximately 380 feet, resulting in a “sag” of approximately 13 feet.<br />
Based on this clearance the tower heights of 77 feet to 87 feet would be necessary to achieve the desired<br />
clearances of 25 feet and 35 feet, respectively. Both towers are illustrated in Figure 5-19.<br />
5-12<br />
51
Figure 5-19. Typical Tower Heights for 25-foot and 35-foot Clearance from Ground<br />
5-13<br />
52
Cantilever Tower Location South of I-5<br />
Along 6 th Avenue, the towers would be located on the southeast corner of each intersection from L Street<br />
to Cedar Street. A new “pop-out” could be installed to capture the placement of the towers as illustrated<br />
in Figure 5-20. A typical placement of towers in a three-block span is illustrated in Figure 5-22. Placing the<br />
towers in this location accomplishes several things:<br />
• Setback of the tower from the intersection reduces the visual interference for motorist<br />
• Creates a shorter distance for pedestrians crossing 6 th Avenue<br />
• Does not remove on-street parking<br />
• Provides an opportunity to create urban “parklets” to enhance the urban texture in this corridor as<br />
described in Section 5.3.3.<br />
Figure 5-20. Site Plan Illustrating Typical<br />
Location of Tower Placement South of I-5<br />
Figure 5-21. View Looking North on 6th Avenue<br />
North<br />
Figure 5-22. Typical Tower Placement in Blocks South of I-5<br />
5-14<br />
53
Cantilever Tower Location North of Interstate 5<br />
The placement of towers along this portion of the corridor would be at the various intersections in the<br />
“red curb” no parking zone on the east side of 6 th Avenue as illustrated in Figure 5-23.<br />
Due to the influence of the AAOZ (see Appendix A-4) on the height of structures in the corridor, the last<br />
tower along 6 th Avenue would be located at Hawthorne Street. This would allow the intermediate station<br />
to be at Ivy Street, which would also turn the cableway east toward the end station in Balboa Park.<br />
Figure 5-23. Site Plan Illustrating Typical Location of Tower Placement North of I-5<br />
Figure 5-24. 6 th Avenue – Typical “Red-Zone” Tower Placement Location<br />
5-15<br />
54
5.3.2 Single Towers<br />
Single towers or “T” type towers, typically used by most cableways, would be used in the park. The same<br />
clearance and tower spacing as on 6 th Avenue was considered, thus keeping the tower heights the same.<br />
However, when the cableway crosses SR-163, it is suggested that the towers be placed outside the<br />
envelope of the Laurel Street Bridge when viewed from the freeway below. This would require a tower<br />
span of approximately 550 feet when crossing the freeway s illustrated in Figure 5-25. The alignment is<br />
approximately 630 feet south of the bridge as illustrated in Figure 5-28. The towers on either side of the<br />
bridge would be approximately 83 feet high on the west side and 60 feet high on the east side. The cabins,<br />
at the lowest point, are 60 feet above the travel lanes. The intent is to place the towers so as to reduce<br />
the visual effect of the cableway on the bridges profile.<br />
Figure 5-25. Tower Placement Crossing SR-163<br />
Figure 5-26. View Looking North along SR-<br />
163<br />
Figure 5-27. View Looking North along SR-<br />
163<br />
5-16<br />
55
Figure 5-28. Tower Alignment from Ivy Street to West Parking in Balboa Park<br />
5-17<br />
56
5.3.3 Urban Enhancement<br />
There is the potential to enhance the urban streetscape as part of the corridor improvements on 6 th<br />
Avenue where the towers are placed. In the proposed tower “pop-outs” there could be areas where<br />
“Parklets” are created. Parklets are small spaces serving as an extension of a sidewalk allowing for<br />
amenities or green space for people to use. Parklets are best served when located near activity street<br />
level uses, such as restaurants or other retail services. These are shown in more detail in Figure 5-29 and<br />
Figure 5-30.<br />
Figure 5-29. Typical Parklet Site Plan and Sketch<br />
Figure 5-30. Aerial View of Parklet<br />
5-18<br />
57
5.3.4 Tower Foundations<br />
An analysis and assessment was undertaken to determine the type and size of foundations needed to<br />
support the cableway towers. The alignment was divided into three zones as shown in Appendix E with<br />
each zone being of a different soil type. Zone 3 is made up primarily of bay fill, which provides lowcarrying<br />
capacity for foundations.<br />
Based on these soil types, the height of the towers, and the tower loading factors, it was determined that<br />
the required width of foundation would be 6 feet in diameter with a depth of:<br />
• 35 feet for Zone 1: Sandstone/siltstone with high bearing capacity<br />
• 41 feet for Zone 2: Sandstone/siltstone with moderate bearing capacity<br />
• 51 feet for Zone 3: Fill with low bearing capacity<br />
It should be noted that in Zone 3, no support towers for the cableway would be provided. Only the<br />
columns associated with elevated Gaslamp Station would be placed in this zone.<br />
5-19<br />
58
59
6.0 IMPLEMENTATION COSTS AND FINANCING<br />
This section provides estimates of the costs to construct and operate the proposed <strong>Skyway</strong> projects and<br />
reviews options for funding and implementing the project.<br />
6.1 System Cost Estimates<br />
The <strong>Skyway</strong> system costs include both the capital costs to construct the <strong>Skyway</strong> and the annual operation<br />
and maintenance costs to support the on-going operation of the <strong>Skyway</strong>.<br />
6.1.1 Capital Costs<br />
The capital costs of the <strong>Skyway</strong> project would be driven by two primary components: construction costs<br />
for the guideway elements and construction costs for the associated stations. Each of these components<br />
were analyzed to create an order-of-magnitude capital cost estimate for the proposed <strong>Skyway</strong> project as a<br />
whole.<br />
Construction costs for the <strong>Skyway</strong> project have been prepared on a conceptual level using the Federal<br />
Transit Administration’s (FTA) Standard Cost Category format, which breaks costs down into seven broad<br />
categories corresponding with the following:<br />
• Aerial Guideway & Elements<br />
• Stations Infrastructure<br />
• Site Work and Special Conditions<br />
• Systems<br />
• Right-of-way, Land and Existing Improvements<br />
• Professional Services<br />
The constructions costs associated with each of the above components are itemized in Table 6-1. The cost<br />
estimate as developed was based on the proposed study <strong>Skyway</strong> alignment on 6 th Avenue starting at the<br />
Gaslamp Quarter Trolley Station and terminating at the parking lot west of the Organ Pavilion in Balboa<br />
Park. There would be four stations (two end stations and two intermediate stations) serving the<br />
alignment. While the system at full capacity could operate a maximum of 170 cabins as noted in Table 3-<br />
1, only 80 cabins were included in the initial cost of the overall system. This is the number of cabins<br />
needed to serve the system based on initial ridership levels. As shown in Table 6-1, the preliminary<br />
“Rough Order-of-Magnitude” cost estimates for construction of the approximately 2.0 miles (10,468 feet)<br />
<strong>Skyway</strong> alignment is approximately $65 million, with the station guide way infrastructure being the<br />
highest cost component. A more detailed cost breakdown is provided in Appendix F.<br />
While it is difficult to provide a direct and comparable comparison of costs from other gondola system of<br />
a similar type to what is being proposed with this project, there are, however, several examples both<br />
within and outside of the US:<br />
• Whistler’s Peak2Peak Gondola: $51 million (2008), 14,000 feet long, 10,000-foot span over land<br />
already owned by the resort, with only one stop at each end. Carries 4,100 passengers each hour<br />
• OHSU Tram Portland: $57 million (2006), fixed two-car tram, 3,300 feet long, 1,500 passengers each<br />
day, 5,000 predicted in future<br />
• London 2012 Olympics Gondola: $95 million (estimated), 3,280 feet long<br />
• Koblenz Rheinseilbahn Gondola, Germany: $20 million (2011), 3,200 feet long<br />
Footnote: Citytank - Ideas for the City (February 21, 2012)<br />
6-1<br />
60
Table 6-1. Order-of-Magnitude <strong>Skyway</strong> Construction Cost Estimate<br />
Item Description<br />
Cost<br />
Aerial Guideway and Elements $14,412,652<br />
Station Guideway Infrastructure $19,000,000<br />
Support Facilities: Yards, Shops, Admin Buildings $0<br />
Site Work and Special Conditions $1,980,000<br />
Systems $525,004<br />
Construction Subtotal $35,917,656<br />
R.O.W., Land, and Existing Improvements $0<br />
Professional Services (39%) $14,007,886<br />
Construction, Right-of-Way, & Professional Services Subtotal $49,925,542<br />
Unallocated Contingency (30%) $14,977,663<br />
TOTAL PROJECT COST $64,903,205<br />
6.2 Annual Operation and Maintenance Costs<br />
Based upon the preliminary operating concept presented in Section 3, an estimate of annual operation<br />
and maintenance costs was developed utilizing typical staffing and associated labor hours, along with<br />
assumptions related to on-going maintenance and service requirements.<br />
Table 6-2 provides a breakdown of the various components that comprised the estimated annualized<br />
costs of operating and maintaining the <strong>Skyway</strong> project. As shown, annualized operating and maintenance<br />
costs are estimated at approximately $2.7 million, with staffing and associated labor costs being the<br />
highest component. It should be noted that expanding the <strong>Skyway</strong> in the future has the potential of<br />
reducing the marginal O & M costs. A detailed O&M cost is provided in Appendix G.<br />
Table 6-2. Annualized <strong>Skyway</strong> Operation and Maintenance Costs<br />
Item Description<br />
Amount<br />
Operating Hours per Year 5,040<br />
Non-Operating Hours per Year 1,512<br />
Staffing During Operation 12<br />
Staffing During Shutdown 2<br />
Hours Worked per Employee 1,880<br />
Total Staffing 34<br />
Total Labor Cost $ $1,841,632<br />
Total Energy Cost $ $146,258<br />
Total Miscellaneous Cost $512,250<br />
Total Annualized Cost for Major Repairs $246,500<br />
Total Project O&M Cost $2,746,640<br />
6-2<br />
61
6.3 Farebox Revenue Potential<br />
The annual revenue generated from the fare box would depend on the fare charged and ridership levels<br />
for the <strong>Skyway</strong>. Several concepts were reviewed, including a single fare option for all riders at two<br />
different price points. Additionally, a split fare option was evaluated which charges a different rate for<br />
residents (commute and non-commute trips), and another fare for tourists. The low fare is assumed at<br />
$2.50 per trip and the high fare $5.00 per trip. The calculations assume 100 percent of the riders pay full<br />
fare. This would not be the case if discounted fares are provided for the elderly, disabled, and children.<br />
It should be noted that the SANDAG Series 12 ridership forecasts are based on a fare of $2.50 for all<br />
riders, and do not reflect a $5.00 fare. Transit ridership demand—particularly for residents—is elastic, and<br />
tends to decrease as transit fares increase. In order to estimate fare revenue generated by a $5.00 fare,<br />
resident work and non-work trips were reduced by 30 percent, per TCRP Report 95, Transit Pricing and<br />
Fares: Traveler Response to Transportation System Changes. Visitor and special event trips were held<br />
constant, as they are less sensitive to increases in fare price.<br />
Table 6-3 and Table 6-4 present a summary of the initial fare revenues that could be generated by the<br />
<strong>Skyway</strong>. Estimated revenue ranges from $1.9 million to $ 4.9 million, depending on fare structure.<br />
Table 6-3. Annual Farebox Revenue: Single Fare Pricing<br />
<strong>Skyway</strong> Annual Estimated Farebox<br />
Revenue - Single Fare Pricing<br />
Low<br />
High<br />
Projected Ridership ($2.50 Fare) 750,750 1,080,750<br />
Estimated Fare Revenue ($2.50 Fare) $1.9 million $2.7 million<br />
Projected Ridership ($5.00 Fare) 1 681,450 978,450<br />
Estimated Fare Revenue ($5.00 Fare) $3.4 million $4.9 million<br />
1 Assumes a ridership reduction of 30 percent for resident trips; based on elasticity factors<br />
presented in TCRP Report 95, Transit Pricing and Fares: Traveler Response to Transportation<br />
System Changes<br />
Table 6-4. Annual Farebox Revenue: Split Fare Pricing<br />
<strong>Skyway</strong> Annual Estimated Farebox<br />
Revenue - Split Fare Pricing<br />
Low<br />
High<br />
Projected Resident Ridership ($2.50 Fare) 231,000 341,000<br />
Estimated Fare Revenue $0.6 million $0.9 million<br />
Projected Visitor Ridership ($5.00 Fare) 1 519,750 739,750<br />
Estimated Fare Revenue $2.6 million $3.7 million<br />
Total for Split Fare Pricing $3.2 million $4.6 million<br />
6.4 Project Delivery Options<br />
There are several types of project delivery methods feasible for implementing the <strong>Skyway</strong>. An important<br />
decision in the case of any large complicated transit projects is to select an appropriate process that will<br />
best secure the project and minimize the initial investment and future operation and maintenance cost.<br />
The following are examples of possible delivery methods for the <strong>Skyway</strong>:<br />
6-3<br />
62
• CMGC – A hybrid model is to separately compete the design and construction phases, called<br />
Construction Manager/General Contractor (CMGC) or Construction Manager at Risk (CMAR).<br />
• Design/Bid/Build – The traditional Design/Bid/Build method, where the design and the construction<br />
phases are separately and sequentially bid.<br />
• Design/Build – the <strong>Skyway</strong> could also implement the project through a Design/Build method whereby<br />
a consultant team would have one contract to design and build the project.<br />
• Design/Build/Finance – Another variation is to add financing to the contractor, which would allow<br />
the contractor to front the funding for the project in exchange for later payment by SANDAG as the<br />
owner. Under this method, the contractor would add a profit margin to the financing, which might<br />
make it more expensive than the financing that SANDAG could do itself.<br />
• Design/Build/Operate/Maintain – Finally, a Design/Build contract could include both operations and<br />
maintenance. Alternatively, SANDAG could separately contract out the operations and maintenance<br />
of the system. This option could have an impact on the union agreements that MTS has with regards<br />
to new service.<br />
The method chosen would depend on how well defined the project is at the time of procurement and<br />
how much flexibility the public sector would tolerate as the design and construction progresses.<br />
6.5 Project Operational Methods<br />
At the completion of the project there would be several methods the <strong>Skyway</strong> project could be turned over<br />
for operations and maintenance. The following examples include:<br />
• SANDAG / MTS - The <strong>Skyway</strong> project could be 100 percent implemented by SANDAG and delivered to<br />
San Diego MTS for operations and maintenance. The project would become a part of the overall San<br />
Diego MTS transit system. MTS would collect the fare and hold the revenue risk.<br />
• Public /Private – The <strong>Skyway</strong> would be completed, turned over to San Diego MTS, and then be<br />
operated under contract by a private vendor for a select period of time. MTS would collect the fare<br />
and hold the revenue risk.<br />
• Private Owner/Operator – The entire <strong>Skyway</strong> project would be franchised out for both construction<br />
and then for operations to a private entity. The private entity could collect the revenues and hold the<br />
revenue risk. Alternatively, MTS could collect the fare revenue and hold the revenue risk and then<br />
pay the private entity an “availability payment.” An availability payment is a type of performancebased<br />
payment method and is paid to the private entity based on the availability of the system in<br />
operation.<br />
6.6 Project Financing Options<br />
One of the primary challenges for the implementation and maintaining of any transit project is finding and<br />
securing funding. This section provides a description for some of the possible funding opportunities<br />
available for the San Diego Bay to Balboa Park <strong>Skyway</strong> project. As with all projects of this type, a<br />
combination of creative leveraging from multiple funding sources would most likely be required. These<br />
sources include federal, state, local, and even private sources that may be necessary to make the project a<br />
reality. There is a wide array of potential funding options for the <strong>Skyway</strong> project as discussed in the<br />
following sections.<br />
6.6.1 Federal Funding Sources<br />
Small Starts funding through the Federal Transit Administration (FTA) also offers a potential source to help<br />
pay for the capital costs of the <strong>Skyway</strong>. The project would meet the basic eligibility requirements as a<br />
fixed guideway, with an anticipated capital cost less than $250 million. The Small Starts program could<br />
provide up to 80 percent of the capital funding, with a maximum of $75 million.<br />
6-4<br />
63
Small Starts is a discretionary program with a unique set of procedures, FTA approval steps, and project<br />
evaluation criteria. Figure 6-1 illustrates the process.<br />
Figure 6-1. Small Starts Process<br />
Challenges and issues associated with this funding source are:<br />
• The procedural steps shown in Table 6-4 need to be followed, with FTA engagement at critical<br />
approval steps.<br />
• There is no certainty of receiving a grant until the grant is actually awarded; all of the pre-grant steps<br />
are carried out “at risk.” Federal funding also brings with it other federal requirements, such as the<br />
National Environmental Policy Act, that are overlaid on the Small Starts process.<br />
• The project would need to get at least a medium rating on FTA’s project justification and local<br />
financial commitment criteria. The justification criteria are mobility improvements, environmental<br />
benefits, congestion relief, land use, economic development, and cost effectiveness. At this stage of<br />
project planning it is unclear how well the project would rate on these criteria.<br />
• The <strong>Skyway</strong> would also be eligible for other federal funding as well. The following are some options:<br />
• The TIGER program offers another discretionary program where SANDAG might compete for funds.<br />
TIGER might be a good fit for the <strong>Skyway</strong>, as the program seeks to help projects that do not naturally<br />
fit into the regular funding programs. Grants tend to be no more than $20 million.<br />
• The FTA formula program (Section 5307) and the flexible funding programs under the Federal-Aid<br />
Highway Program (Surface Transportation Program, CMAQ) are other potential sources of federal<br />
funding for the <strong>Skyway</strong>. As formula programs, they do not have the benefit of bringing new money to<br />
the San Diego region. Although eligible for these funds, the <strong>Skyway</strong> would compete with other San<br />
Diego MTS and SANDAG priorities.<br />
6.6.2 State Funding Sources<br />
The following public and private sources could be used for implementation of the <strong>Skyway</strong> or for annual<br />
O&M:<br />
• California Cap and Trade Sustainable Communities Grants: This is a new program whose deadline<br />
has already passed for this year. This program should continue in 2016. Some facts are:<br />
– The State has allocated 20 percent of auction proceeds under the State Cap & Trade program<br />
– $120M in FY 2015, $200M in FY 2016<br />
– Two eligible Project Area Types<br />
– Transit Oriented Development (TOD)<br />
– Integrated Connectivity Projects (ICP)<br />
– Eligible projects are TOD Neighborhoods, Districts or Corridors<br />
– This program ties together transit, affordable housing and infrastructure<br />
– TOD Area loans/grants are $1M to $15M<br />
– ICP Area loans/grants are $500K to $8M<br />
6-5<br />
64
• California Cap and Trade Transit and Intercity Rail Capital Program: This is also a new program this<br />
year and should continue in future years. The deadline for the 2015 grant applications is April 11,<br />
2015, which is premature for the <strong>Skyway</strong> program. However future year’s programs would be good<br />
targets for the project. Some details are:<br />
– Allocated 10 percent of auction proceeds under the State Cap & Trade program<br />
– $25M in FY 2015, $100M in FY 2016<br />
– Competitive process run by CalSTA<br />
– Projects would improve/expand rail service/ridership, focus on integrating with other rail and<br />
transit (including high-speed rail), improve rail safety, and prioritize disadvantaged communities<br />
– Eligible applicants are public agencies (including Joint Powers Authorities) that operate existing<br />
or planned intercity rail, commuter passenger rail, urban rail transit service, bus services<br />
6.6.3 Local Funding Sources<br />
SANDAG Funds: The <strong>Skyway</strong> project could be eligible for the discretionary SANDAG grant, the Smart<br />
Growth Incentive Program, a part of the SANDAG TransNet sales tax measure program.<br />
Parking Revenues: There are several parking districts in the area of the <strong>Skyway</strong> project alignment. This<br />
revenue type could be collected via a formal agreement or commitment from parking districts within the<br />
project area. A multiyear commitment by the districts would be preferred to aid in future maintenance of<br />
the project.<br />
Foundation Donations: SANDAG could form a non-profit/private partnership group that could advocate<br />
for private donations to the <strong>Skyway</strong> project. As an example, the San Francisco Planning and Urban<br />
Research Association in their 9/2011 report, “SPUR Seeking Green – Funding public parks in a challenging<br />
financial climate” advocates philanthropy as a way of raising funds for parks. They also support leveraging<br />
the work of the San Francisco Parks Trust and the Neighborhood Parks Council. In SPUR’s 2011 publication<br />
“Beyond the Tracks,” it laid out a roadmap for how the state and local authorities could make the stations<br />
something much more than just a transfer point.<br />
A successful example of innovative donations is the High Line Park in New York City. The Friends of the<br />
High Line (FHL) was able to raise 25 percent of the cost of the park improvements through private<br />
donations. The FHL also partnered with the Design Trust for Public Spaces, which provided a fellowship to<br />
conduct research and outreach for the park. The Campaign for the High Line raised money for<br />
construction of the new park and an endowment for the parks future maintenance and operations.<br />
SANDAG could potentially form a partnership with the following groups to assess this option:<br />
• Balboa Park Plaza de Panama Committee<br />
• San Diego Zoological Society<br />
• Legler Benbough Foundation<br />
• Balboa Park Conservancy<br />
• Balboa Park Committee of 100<br />
• Balboa Park Cultural Partnership<br />
• Balboa Park Central<br />
• Downtown San Diego Partnership<br />
• Civic San Diego<br />
• City of San Diego Parks and Recreation Department<br />
Transportation Infrastructure Finance and Innovation Act (TIFIA) Direct Loan Program: Administered by<br />
USDOT, a TIFIA loan typically finances up to 33 percent of project cost for projects valued at $50 million or<br />
6-6<br />
65
more. The project also has to be eligible for federal funding. Preliminary indicators are that the <strong>Skyway</strong><br />
project would exceed $60 million in costs and if this were to require financing that is not available or<br />
preferred from SANDAG or private sector, then this might be an option.<br />
Other Revenues: Other revenues to support the operations and maintenance of the <strong>Skyway</strong> system<br />
would include:<br />
• Fare Revenues: Based upon ridership, the system would generate fares that would, in part, fund the<br />
operations of the system. A two-tiered fare structure—one for commuters and the other for<br />
tourists—would likely maximize this source. Alternatively, the fare system could mirror MTS’s fare<br />
policies.<br />
• Advertisement Revenues: This revenue type could be established by SANDAG through an RFP<br />
procurement process to hire a transit advertisement management company. The advertisement<br />
management company would be responsible for generating sales on the project and share gains with<br />
SANDAG on an agreed upon annual percentage.<br />
• Transient Occupancy Tax (TOT): Share of existing TOT fees or an increase allocation to the <strong>Skyway</strong>.<br />
• Naming Rights at Station Sites: Naming rights could be auctioned for each station location.<br />
6.6.4 P-3 and Joint Development Opportunities<br />
There are a variety of potential public/private partnership and value capture opportunities that would be<br />
available for the <strong>Skyway</strong> project. Options are described in more detail below.<br />
Public/Private Partnership Opportunities: In addition to this public sector model, there potentially could<br />
be an opportunity for a private sector model, also known as a Public/Private Partnership, or P3. If the<br />
currently proposed <strong>Skyway</strong> project is envisioned as the initial link of a larger, connected regional<br />
guideway system, then it would follow that it would be important for SANDAG/MTS to be the owner of<br />
this project.<br />
Value Capture Opportunities: Value capture includes a variety of techniques to extract value or fees due<br />
to the value a transit project brings to the community. These techniques include joint development at<br />
station sites, assessment districts and tax increment financing.<br />
With the demise of redevelopment agencies in California, there is a new approach to tax increment<br />
financing. Incremental property taxes can now be captured through a Joint Powers Authority (JPA). Details<br />
include:<br />
• JPA participants would include cities, counties, and possibly school districts<br />
• Powers would be limited to tax sharing only for the transit activities (either to fund the system or to<br />
support TOD development for designated transit areas)<br />
• Percentage of shared taxes negotiated among the JPA participants<br />
Another financing technique is a Community Facilities District or other assessment district. A new<br />
assessment district for the <strong>Skyway</strong> project could be formed or the project could be funded through<br />
expanding an existing assessment district or districts. In order to implement these financing techniques,<br />
SANDAG could:<br />
• Work with the City and other stakeholders to develop support for a corridor based Community<br />
Facilities District or other assessment district<br />
• Determine an assessment rate that would not place a particular burden on the property owners<br />
• Use its own land and resources to create better land uses around stations<br />
• Capitalize on joint development opportunities<br />
• Evaluate air rights sale or long-term lease<br />
6-7<br />
66
67
7.0 <strong>Skyway</strong> – NEXT STEPS!<br />
With a growing reputation as a highly versatile mode of transportation, urban gondolas are gaining<br />
significant interest both nationally and globally. The dynamics of the technology allow enhanced abilities<br />
to integrate within an urban environment while providing a conveyance of people at a rate comparable to<br />
many urban transit systems. Additionally, with the ability to traverse and serve a wide variety of urban<br />
conditions, the cableway can offer distinct advantages for particular applications, such as steep<br />
topography, the crossing of major freeways or other natural obstacles such as rivers, canyons, and the<br />
potential of extending transit service areas by providing last/first mile connections, thus filling gaps in<br />
local transit networks.<br />
The purpose of the San Diego Bay to Balboa Park <strong>Skyway</strong> Feasibility Report was to determine the<br />
feasibility of implementing an aerial cableway (<strong>Skyway</strong>) as a mode of urban mobility for the San Diego<br />
region. The evaluations and assessments completed thus far indicate that the <strong>Skyway</strong> project as proposed<br />
is feasible and could be implemented successfully. However, a number of issues will need to be addressed<br />
and resolved to move the <strong>Skyway</strong> project forward. Next steps will have to focus, not only on the<br />
engineering/design considerations, but also a number of environmental challenges and regulatory issues,<br />
including:<br />
• ACLUP Glide Path Clearance<br />
• Balboa Park – Parkland Protection<br />
• Caltrans – Interface with Interstate 5 and SR-163<br />
• Historic Districts and Properties - Gaslamp District and Balboa Park<br />
• Visual issues with nearby communities<br />
• Permitting - CAL/OSHA<br />
• California Public Utility Commission - Crossing of the C Street Trolley corridor.<br />
With success of the <strong>Skyway</strong> project between Balboa Park and downtown San Diego would likely come<br />
additional interests in expanding this initial line or implementing a similar <strong>Skyway</strong> application elsewhere in<br />
the region. Other potential applications within the region could include one or more of the following<br />
areas:<br />
• Hillcrest<br />
• Mission Valley<br />
• Beach communities<br />
• Sorrento Valley COASTER connections<br />
In the search for mobility solutions, the <strong>Skyway</strong> may be an application that suits the region’s needs to<br />
provide a cost effective mode of transport that can readily be integrated into the existing urban<br />
environments. Expanding the <strong>Skyway</strong> in future would also reduce the marginal O & M costs and generate<br />
additional ridership while increasing fare revenue as more trip origins and destinations are served.<br />
The idea of cableway as a transit mode is a unique concept. The cableway has the potential to be both a<br />
bold and creative solution for the region’s future mobility. In the 1980s, the San Diego region was a<br />
national leader in reintroducing light rail transit, which helped set the stage for light rail transit to again be<br />
considered a viable mode of urban transport across the county. In a similar manner, the <strong>Skyway</strong> has the<br />
potential to be the next generation of mobility, once again placing San Diego at the forefront of transit<br />
and mobility innovation.<br />
7-1<br />
68
69
Appendix A: Historic Districts and Points of Interest<br />
70
71
Historic Districts - Properties<br />
72
73
Appendix B: Utilities<br />
74
75
!<br />
!<br />
ELM<br />
B<br />
!<br />
Legend<br />
! Station Location<br />
L<br />
StudyCorridor<br />
!<br />
Sewer Main 76 0 500 1,000 2,000 3,000 4,000<br />
Feet
!<br />
!<br />
ELM<br />
B<br />
!<br />
Legend<br />
! Station Location<br />
L<br />
StudyCorridor<br />
!<br />
Storm Drain 77 0 500 1,000 2,000 3,000 4,000<br />
Feet
!<br />
!<br />
ELM<br />
B<br />
!<br />
Legend<br />
! Station Location<br />
L<br />
StudyCorridor<br />
!<br />
Water Main 78 0 500 1,000 2,000 3,000 4,000<br />
Feet
79
Appendix C: Typical <strong>Skyway</strong> Cabin Dimensions<br />
80
81
Typical 8-person Cabin – Elevation and Plan View<br />
82
83
Appendix D: Airport Approach Overlay Zone Height Restrictions<br />
84
85
Airport Approach Overlay Zone and Ground Elevation: Grape Street<br />
Maximum Allowable<br />
Height: 105 feet<br />
86
Airport Approach Overlay Zone and Ground Elevation: I-5 Crossing<br />
Maximum Allowable<br />
Height: 168 feet<br />
87
Airport Approach Overlay Zone and Ground Elevation: Ivy Street<br />
Maximum Allowable<br />
Height: 56 feet<br />
IVY Street<br />
Station Location<br />
88
Airport Approach Overlay Zone and Ground Elevation: Juniper Street<br />
Maximum Allowable<br />
Height: 37 feet<br />
89
Appendix E: Soil Types<br />
90
91
Zone 1 (Qlv, Tsd):<br />
Sandstone/ siltstone with<br />
high bearing capacity<br />
Zone 2 (Qbp): Sandstone/<br />
siltstone with moderate<br />
bearing capacity<br />
Zone 3 (Qaf): Fill with low<br />
bearing capacity<br />
Preliminary<br />
N<br />
Library file: L:\2008\library\projects\94237\*.ppt<br />
PROJECT NO:<br />
DRAWN:<br />
DRAWN BY:<br />
CHECKED BY:<br />
FILE NAME:<br />
NA<br />
J. GINGERY<br />
PENDING<br />
0<br />
750 1500<br />
Approximate Scale (feet)<br />
GEOLOGY MAP<br />
BAY TO BALBOA SKYWAY<br />
FEASIBILITY STUDY<br />
SAN DIEGO, CALIFORNIA<br />
3000<br />
FIGURE<br />
1<br />
92<br />
PLOTTED:25 March 2015, 10:27 AM
93
Appendix F: Capital Cost Estimate<br />
94
95
Item Description<br />
Unit of<br />
Measure* Quantity Unit Price (US $) Total Price (US $)<br />
AERIAL GUIDEWAY & ELEMENTS $ 14,412,652.00<br />
Guideway: Aerial Cable RM 1 $ 400,000.00 $<br />
400,000.00<br />
6th Avenue Tower: Cantilever includes sheaves and concrete EA 22 $ 150,000.00 $ 3,300,000.00<br />
Park Tower: Single includes sheaves and concrete EA 8 $ 60,000.00 $<br />
480,000.00<br />
Zone 1 Foundation EA 16 $ 66,940.00 $ 1,071,040.00<br />
Zone 2 Foundation EA 14 $ 53,158.00 $<br />
744,212.00<br />
Station Piles Foundations -Zone 1 EA 2 $ 66,800.00 $<br />
133,600.00<br />
Station Piles Foundations -Zone 2 EA 4 $ 53,000.00 $<br />
212,000.00<br />
Station Piles Foundations -Zone 3 EA 6 $ 45,300.00 $<br />
271,800.00<br />
Cabins: 8 passenger EA 80 $ 35,000.00 $ 2,800,000.00<br />
Electric controls, comm line, conduits, etc EA 1 $ 500,000.00 $<br />
500,000.00<br />
Installation: Job site supervision, etc (this is estimated for all the mechanical components) EA 1 $ 4,500,000.00 $ 4,500,000.00<br />
STATION GUIDEWAY INFRASTRUCTURE: $ 19,000,000.00<br />
Gaslamp - End Station EA 1 $ 1,750,000.00 $ 1,750,000.00<br />
B Street - Intermediate Station EA 1 $ 2,750,000.00 $ 2,750,000.00<br />
Ivy Street - Intermediate Stations - pass through terminal only EA 1 $ 1,750,000.00 $ 1,750,000.00<br />
Balboa Park - End Station w/Cabin Storage EA 1 $ 3,750,000.00 $ 3,750,000.00<br />
Station Platforms:, cabin guidage, access ways, elevators, etc - average for the 4 terminals EA 4 $ 2,250,000.00 $ 9,000,000.00<br />
SUPPORT FACILITIES: YARDS, SHOPS, ADMIN BLDGS $<br />
-<br />
SITE WORK & SPECIAL CONDITIONS $ 1,980,000.00<br />
Demolition, clearing, earthwork LS 1 $ 250,000.00 $<br />
250,000.00<br />
Site utilities, utility relocation RM 20 $ 30,000.00 $<br />
600,000.00<br />
HAZMAT, contamination mitigation, water treatments LS 1 $ 250,000.00 $<br />
250,000.00<br />
Environmental mitigation RM 1 $ 150,000.00 $<br />
150,000.00<br />
Site furniture, paving treatment - parklets EA 5 $ 30,000.00 $<br />
150,000.00<br />
Curbs and gutters LF 3,000 $ 20.00 $<br />
60,000.00<br />
Pedestrian facilities (sidewalks - public r.o.w.) SF 15,000 $ 8.00 $<br />
120,000.00<br />
Bicycle facilities -Class 2 (pavement and striping) SF 1 $ - $<br />
-<br />
Bicycle facilities -Class 1 (12' section / Balboa Park) SF 1 $ - $<br />
-<br />
Landscaping (planting and irrigation) LS 1 $ 250,000.00 $<br />
250,000.00<br />
Temporary facilities and other indirect costs - staging areas LS 1 $ 150,000.00 $<br />
150,000.00<br />
SYSTEMS $<br />
525,005.00<br />
Traffic signals and crossing protection RM 7 $ 75,000.00 $<br />
525,000.00<br />
Communications EA 1 $ 1.00 $<br />
1.00<br />
Fare collection equipment (included in station costs) RM 1 $ 1.00 $<br />
1.00<br />
Central control RM 1 $ 1.00 $<br />
1.00<br />
RM 1 $ 1.00 $<br />
1.00<br />
RM 1 $ 1.00 $<br />
1.00<br />
CONSTRUCTION SUBTOTAL $ 35,917,657.00<br />
R.O.W, LAND, & EXISTING IMPROVEMENTS $<br />
-<br />
Purchase or lease of real estate NA $<br />
-<br />
Relocation of existing households and businesses NA $<br />
-<br />
PROFESSIONAL SERVICES (39%) $ 14,007,886.23<br />
Preliminary engineering (5.0%) LS 5% $ 1,795,882.85<br />
Final design (10.0%) LS 10% $ 3,591,765.70<br />
Project management for design & construction (7.0%) LS 7% $ 2,514,235.99<br />
Construction administration & management (10.0%) LS 10% $ 3,591,765.70<br />
Professional liability and other non-construction insurance (2.5%) LS 3% $<br />
897,941.43<br />
Legal: Permits, review fees, etc. (1.0%) LS 1% $<br />
359,176.57<br />
Surveys, testing, investigation, & inspection (2.0%) LS 2% $<br />
718,353.14<br />
Start up (1.5%) LS 2% $<br />
538,764.86<br />
CONSTRUCTION, R.O.W., & PROFESSIONAL SERVICES SUBTOTAL $ 49,925,543.23<br />
UNALLOCATED CONTINGENCY (30%) LS 30% $ 14,977,662.97<br />
TOTAL PROJECT COST $ 64,903,206.20<br />
*Unit of Measure Legend: RM = Route Mile SF = Square Foot EA = Each LS = Lump Sum<br />
96
97
Appendix G: Operation and Maintenance Cost Estimate<br />
98
San Diego Bay to Balboa Gondola<br />
Operating Cost Analysis - cash flow<br />
Operation Schedule<br />
Days per year ** 360<br />
Hours per day (open to public) 14<br />
Operating hours per year 5,040<br />
Non-Operating hours per year 1,260<br />
Staffing During Operation<br />
Manager 2<br />
Mechanic 2<br />
Operator 4<br />
Attendant 4<br />
Staffing During Shutdown<br />
Mechanic 2<br />
Hours Worked per Employee<br />
Total Hours 2080<br />
Holiday 80<br />
Vacation 40<br />
Sick 80<br />
Hours available for work 1880<br />
Required Staffing Level<br />
Labor Cost<br />
Man-Hours Number<br />
Manager 10,080 5.0 5.4<br />
Mechanics 12,600 7.0 6.7<br />
Operators 20,160 11.0 10.72<br />
Attendants 20,160 11.0 10.72<br />
Total Staffing 34<br />
Number<br />
Base<br />
Wage<br />
Hours/<br />
Year Total Wages Burden Total Cost<br />
Manager 5 30.00 2080 $ 312,000<br />
30% $ 405,600<br />
Mechanics 7 28.00 2080 $ 407,680<br />
30% $ 529,984<br />
Operators 11 23.00 2080 $ 526,240<br />
20% $ 631,488<br />
Attendants 11 10.00 2080 $ 228,800<br />
20% $ 274,560<br />
Total Labor Cost $ 1,841,632<br />
99
Energy Cost<br />
400 hp<br />
298.4 kW<br />
1,503,936 kWh<br />
$0.09725 /kWh<br />
Total Energy Cost $ 146,258<br />
Miscellaneous Annual Cost<br />
No. of employees<br />
Uniforms (cost per employee) = 125 34 4,250<br />
Recruitment and training (% of expected employee turnover) 0.25 8,500<br />
Rope Inspection 5,000<br />
Lubricants and other disposable maintenance items 35,000<br />
Consumable parts (elastomeric components) 50,000<br />
Carrier repair parts 55,000<br />
NDT Services 20,000<br />
Insurance & Indemnity 125,000<br />
Annual Lift Inspection 22,000<br />
Tools and vehicle cost 150,000<br />
Office Supplies 2,500<br />
Accounting and payroll services 35,000<br />
Total Miscellaneous Cost 512,250<br />
Annualized Cost for Major Repairs/Replacement - Reserve<br />
Summary<br />
Cost Interval (years) Annualized Cost<br />
Rope Change 250,000 15 16,667<br />
Replacement Grips 450,000 15 30,000<br />
General re-furbishment 2,000,000 20 100,000<br />
Gearbox Replacement 400,000 15 26,667<br />
Motor Replacement 85,000 15 5,667<br />
Office equipment and startup supplies 20,000 8 2,500<br />
Facilities Maintenance 65,000 1 65,000<br />
Total Annualized Cost for Major Repairs 246,500<br />
Labor Cost $ 1,841,632 67%<br />
Energy Cost $ 146,258 5%<br />
Annualized Reserve for Major Repairs/Replacement (not included above) $ 246,500<br />
Miscellaneous Annual Cost $ 512,250 19%<br />
Total Operating Cost $ 2,746,640<br />
Cost per Hour of Operation $<br />
545<br />
100