SEF

Create successful ePaper yourself
Turn your PDF publications into a flip-book with our unique Google optimized e-Paper software.
Summary<br />
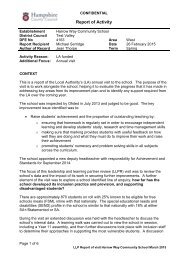
Harrow Way Community School<br />
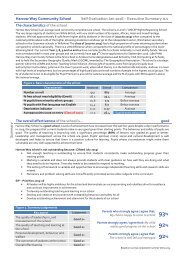
Harrow Way School is an average sized community comprehensive school. The school is a Level 2 ‘UNICEF Rights Respecting School’.<br />
The very large majority of students are White British, with very small numbers of European, African, Asian and mixed heritage<br />
students. We had approximately 8-10% fewer higher ability students in the class of (2010 to 2015) when compared to the<br />
national profile (about 10% of the higher attaining students in Andover go to the independent sector, Winchester secondary<br />
schools or the Grammar schools in Wiltshire)<br />
The class of (2010 to 2015) had a high proportion of lower attaining student when compared to schools nationally. There is a<br />
10% difference when compared to the national profile of percentages in the lower attaining band. Our current Year 7, 8, 9 and<br />
10 and 11 have a similar profile to schools nationally in most ability bands. We are now oversubscribed in most year groups and<br />
we currently have 230 1 st Choice applications for September 2016. (180 PAN) Harrow Way Community School is the first school<br />
in Andover to be designated a Lead School by CAS (Computing at School), and to hold the Secondary Geography Quality Mark<br />
(SGQM), awarded by The Geographical Association. The school is a strategic partner within the LEARN and Anton Teaching School<br />
Alliance. Almost 35% of students come from large principally local authority/GLC built estates; 30% live in the town’s poorest ward,<br />
where adult literacy is in the bottom 6% nationally. Andover is a town with high levels of employment, but low percentages of highly<br />
paid jobs and small numbers of people in the highest social groups. The % of students known to be eligible for Pupil Premium is<br />
around the national average and the % of pupils with SEN support is above the national average.<br />
Figure 1. Basic characteristics of the school<br />
Characteristic National School Comparison<br />
Number on roll 957 867 Average<br />
% free school meal eligibility (Ever6) 28.2 25.4 Average<br />
% pupils from minority ethnic groups 25.6 7.9 Below average<br />
% pupils with first language not English 14.4 6.0 Below average<br />
Deprivation indicator 0.22 0.17 Average<br />
Average points score on entry (Class of 2015) 27.9 26.4 Significantly below NA<br />
The overall effectiveness of the school is…<br />
Self-Evaluation – Executive Summary MJS<br />
SLT Draft December 2014<br />
good<br />
Harrow Way School is a good school. Levels of achievement have increased over the last few years despite a dip in performance<br />
in 2015; the progress that current students make is very good given their starting points. The behaviour and safety of pupils are<br />
good. The quality of teaching is improving with a significant percentage (88%) of lessons now graded as good or better.<br />
Leadership and management across the school are good. Pupils’ spiritual, moral, social and cultural development is well<br />
developed and helps to ensure that there is a positive culture for learning. Pupils whose circumstances might make them<br />
vulnerable are very well supported to achieve their best.<br />
Harrow Way school is not outstanding because: (Ofsted July 2013)<br />
• Not enough teaching is outstanding to ensure that students consistently make outstanding progress given their<br />
starting points.<br />
• Marking is variable and does not always provide students with clear guidance on how well they are doing and what<br />
they need to do to improve. Time also needs to be created to respond to marking.<br />
• The setting of homework is variable and opportunities to encourage independent learning skills and research skills are<br />
missed.<br />
• Numeracy and problem solving skills are not sufficiently promoted across other subjects in the curriculum.<br />
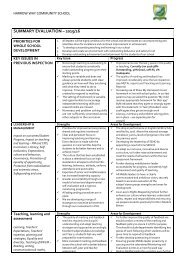
SIP – Priorities 2015-16<br />
• All leaders will be highly ambitious for the school and demonstrate an uncompromising and relentless drive for excellence<br />
and continual improvement in achievement<br />
• To develop outstanding teaching and learning in our school<br />
• Develop and create an environment with outstanding behaviour and safety for all<br />
• Develop outstanding achievement and attainment for the students of our school<br />
Figure 2. Summary judgements<br />
Key aspect<br />
Judgement<br />
The quality of leadership in, and<br />
management of, the school<br />
Good 2=<br />
The quality of teaching and learning at<br />
the school<br />
Good 2=<br />
Personal development, behaviour and<br />
welfare<br />
Good 2=<br />
The outcomes of students at the school Good 2=<br />
Overall effectiveness Good 2=<br />
Parents who strongly agree / agree that:<br />
My child is happy to come to school 93%<br />
Parents strongly agree / agree that: My child<br />
makes good progress at this school 92%<br />
Parents strongly agree / agree that:<br />
The school is well led and managed 92%<br />
Based on surveys conducted in summer term,2015.
The outcomes for learners is…<br />
good<br />
Summary<br />
Levels of attainment are now good. Despite a dip in performance in 2015 academic standards have risen year on year and are now in<br />
line or above compared with national averages. We were affected by the grade boundary movements of our Year 11 students in the<br />
iGCSE English paper and a 3-mark movement in their coursework marks. This resulted in 20 students achieving a D rather than a<br />
grade C. Conversion of these students would have resulted in 5ACEM of 66% in 2015. Girls attained relatively more strongly than boys.<br />
Students who completed their examinations in 2014 and 2015 joined the school with attainment which is well below the national<br />
average. From their starting points, in 2014 most students make at least good progress with some making outstanding progress in<br />
some key subjects. In 2014 we were identified as one of the Top 50 most improved schools in the country. We are aware of the below<br />
average APS and Value added in 2015 and this has now been addressed (See SIP 4.1-3 and Achievement File 2016). The progress that<br />
current students make is at least good - strong outcomes are currently predicted in 2016 and 2017 (Above the NA). English were<br />
significantly above expectation at A*-C and APS and the expected and above expected levels of progress in 2014 and below in 2015.<br />
Maths results were in line with national averages in 2014 and these improved again in 2015 with APS and levels of progress above the<br />
national average. Students thrive in an environment that is highly conducive to learning and most groups of students, regardless of<br />
their background or level of ability, make good progress.<br />
Outcomes are not yet outstanding because:<br />
• Progress and attainment in some subjects, notably (English, Graphics and Resistant Materials and PE), is not yet<br />
secure. Particular weaknesses in 2014/15 were noted in Design and Technology, PE and History. Stronger performance<br />
is predicted in 2016. (See LA Reports and METAL reports, High Impact Case Studies, Achievement File)<br />
• Following an upward trend over the last 3 years there was a DIP in performance in 2015. KS4 Value added and average<br />
points score was significantly below the national average.) Value added was significantly below average for the group(s):<br />
disadvantaged, boys, SENwith EHC/statement, SEN without EHC/statement. (see SIP 4.1-4.4)<br />
• There is a need to reduce further in school variation in results and deal with any underachievement. (see SIP 4.3)<br />
Figure 3. Major attainment indicators – 2014 (School data)<br />
%5AC %5ACEM %5AG %A*/A %A*-C<br />
English<br />
%A*-C<br />
Maths<br />
%A*-C<br />
Science<br />
%A*-C<br />
EBacc<br />
Attainment<br />
Gap (5ACEM)<br />
Figure 3. Major attainment indicators – 2015 (School data)<br />
%5AC %5ACEM %5AG %A*/A %A*-C<br />
English<br />
%A*-C<br />
Maths<br />
%A*-C<br />
Science<br />
%A*-C<br />
EBacc<br />
Attainment<br />
Gap (5ACEM)<br />
6 1 50 87 59 75 64 12 15<br />
Overall standards of attainment are good (Figure 3 & Figure 4). Pupils achieve well in Mathematics, Science (Additional and Core),<br />
French, Spanish, Media Studies and Performing Arts (Drama, Dance and Music) Art, Geography with A*-C figures in each of these<br />
subjects high compared with national figures. In all other subjects, pupils achieve above or close to national figures with the exception<br />
of Design and Technology, English in (2015) and PE. In all key performance measures, standards of attainment have shown a yearon-year<br />
improvement with 5ACEM rising from 43% in 2011 to 61% in 2014. The 5ACEM improvement in attainment over the last 3<br />
years places us in Top 50 most improved school in the England. Although this dipped in 2015 it is expected to go back over 60% in<br />
2016. (Standards of attainment in English have risen from 58% A*-C in 2011 to 81% in 2014 – there was dip in 2015 for those students<br />
who were entered for the iGCSE English paper (N.B Our more able students who entered the home board were in line with national<br />
average at A*-C and levels of progress) which has been addressed and current predictions for Year 11 look strong with 74% A*-C.<br />
Maths results have risen from 54% A*-C in 2011 to 75% in 2015. In 2015 of pupils achieved 75% A*-C grades in additional Science<br />
compared to the NA of 63%. In Core Science we achieved 71% compared the NA of 59%. This is compared to a school figure of 37% in<br />
2011. 11% achieved the English Baccalaureate in 2014. (See Achievement File)<br />
RAISEonline data for 2014 and GCSE results for 2014 indicate that the standards of attainment of significant groups of pupils,<br />
including those with special educational needs and/or a disability are broadly in line with the overall school figures (using Capped point<br />
scores). The attainment of students in English (APS) is significantly above national average and broadly in line in Maths. The<br />
difference in attainment between boys and girls is 10% with boys achieving 56% (44% in 2013) 5ACEM in 2014 against a figure of 65%<br />
(65% in 2013) for girls.<br />
RAISEonline data for 2015 and GCSE results for 2015 indicate that the standards of attainment of significant groups of pupils,<br />
including those with special educational needs and/or a disability were below average (using Capped point scores). The attainment of<br />
students in English (APS) is significantly below national average and above in Maths. The difference in attainment between boys and<br />
girls is 20% with boys achieving 38% (NA 51%) 5ACEM in 2015 against a figure of 58% for girls.<br />
The attainment gap between disadvantaged and all other pupils is -11% (-18% in 2014 -30% in 2013) using the 5ACEM attainment<br />
measure. The gap between levels of attainment (A*-C) in Maths for disadvantaged students in 2015 dropped to -16% (-18% in 2014 -<br />
27% in 2013). The proportion of more able pupils in the class of 2014 is significantly below average. These students achieved above the<br />
national averages in English and Maths. Value added for disadvantaged students in 2015 was in line with NA and other pupils in<br />
English, Mathematics, Science and languages. The overall value added was significantly below average for disadvantaged students in<br />
2015. There are 37 students from service families whose attendance is good and who are relatively well settled. There are 8 pupils who<br />
are in local authority care who are achieving well. (See LA report 2014)<br />
The attainment and progress of a small number of pupils, either educated off-site, or with particular special educational needs, is at
Figure 4. Major attainment indicators – 2015<br />
(RAISEonline)<br />
Attainment in 2015<br />
(National figure in brackets)<br />
Sig + + Av. - Sig<br />
-<br />
3 year trend<br />
% 5AC (65) 61% Improving<br />
% 5ACEM (56) 50% Improving<br />
% 5AG (95) 86% Declining<br />
% 5+A*/A 10%<br />
% EBacc (16) 12% N/A<br />
% A*-C English (67%) 59% Fluctuates<br />
% A*-C Maths (70%) 75% Improving<br />
APS Capped (Best 8) 279 Fluctuates<br />
APS - Total<br />
Static<br />
Attainment Gap (28) -11 Improving<br />
Average is taken as +/- 5% of the national average figure<br />
Figure 5. School comparisons<br />
(Ofsted Data Dashboard) 2015 To follow<br />
Similar schools<br />
% 5ACEM<br />
% A*-C English<br />
% A*-C Maths<br />
% A*-C Science<br />
All schools<br />
% 5ACEM<br />
% A*-C English<br />
% A*-C Maths<br />
% A*-C Science<br />
Quintile<br />
1 2 3 4 5<br />
Quintile<br />
1 2 3 4 5<br />
Historic Progress<br />
Attainment on entry for the class of 2014 and 2015 was<br />
significantly below average. In 2015 pupils go onto achieve<br />
levels of attainment that are in line or above with the national<br />
average (5ACEM and APS in English and Maths and<br />
expected/above levels of Progress) In 2015 overall KS4 value<br />
added and APS was below the national average.<br />
Expected/above levels of progress were below the national<br />
average in English.<br />
Figure 6. Major KS4 progress indicators – 2015<br />
(School data) National in Brackets<br />
Progress in English<br />
Progress in Maths<br />
3+ Level 4+ Level 3+ Level 4+ Level<br />
59%(70) 15% (32) 72%(65) 33%(29)<br />
Therefore in 2014, given their starting points, the progress that almost all pupils make is good with elements of outstanding<br />
progress. The performance of girls is significantly above the national average. RAISEonline 2015 shows that there is a significant<br />
difference in the value-added scores for boys, disadvantaged students, SEN with support and SEN with EHCP/Statement (28). The<br />
2015 RAISEonline analysis (Figure 6/7) show that the proportions of pupils making expected progress was above the national<br />
averages in Maths and below the national figure in English. The proportions of pupils making more than expected progress, is below<br />
the national figures in English, and in line with the national figures in Maths.<br />
An analysis of progress by subject shows that in all subjects pupils make expected and greater than expected progress at least in line<br />
with national averages. There was underperformance, D&T Resistant Materials/Graphics, PE, in 2014 and 2015 and English in 2015.<br />
Predictions for 2016 are looking far more positive. (See Achievement File - Levels of Progress SISRA data 2016, LA Reports and<br />
METAL Reports)<br />
Figure 6. Closing the All 2015 Disadvantaged 2015 Non Disadvantaged 2015 Gap 2014 Gap 2015<br />
Gap 2014<br />
5+A*-C In En/Ma 50% 38% 50% -20% -11<br />
3 Levels of progress En 58% 58% 58% -23 -0<br />
4 Levels of progress En 15% 11% 16% -24 -4<br />
3 Levels of progress Ma 72% 59% 75% -16 -11<br />
4 Levels of progress Ma 33% 24% 38% -15 -14<br />
VA 976 933 984 -54 -51<br />
Figure 7. Major progress indicators – 2015<br />
(RAISEonline)<br />
Progress in 2013<br />
(National fig. in brackets)<br />
Sig + + Av. - Sig - 3 year trend<br />
VA Score 976<br />
% 3L English (69) 59<br />
Fluctuates<br />
Fluctuates<br />
% 3L Maths (68) 72 Improving<br />
4+ Levels English<br />
(32)<br />
15% Fluctuates<br />
Figure 8. School comparisons 2014<br />
(Ofsted Data Dashboard) 2015 – To follow<br />
Similar schools<br />
3 level English<br />
3 level Maths<br />
All schools<br />
3 level English<br />
3 level Maths<br />
Quintile<br />
1 2 3 4 5<br />
Quintile<br />
1 2 3 4 5
Progress and learning of current pupils<br />
There are rigorous systems in place to ensure that<br />
students are making good progress. The latest tracking<br />
reports of December 2015 indicate that the majority of<br />
Year 11 pupils (73% - English; 62% - Mathematics- are on<br />
track to achieve their 3 levels of progress and (18% -<br />
English; 25% mathematics) percentage of pupils are on<br />
track to achieve 4 levels of progress) (Figure 9).<br />
Figure 9. Year 11 Predictions December 2015 (School data)<br />
Measure – percentage of<br />
pupils<br />
All<br />
Pupils<br />
Disadvan<br />
taged<br />
Non<br />
Disadvan<br />
taged<br />
% 5ACEM 53 38 57<br />
% 5+A*/A 9 0 11<br />
3L progress English 73 50 79<br />
4L progress English 18 6 22<br />
3L progress mathematics 62 57 64<br />
4L progress mathematics 25 8 29<br />
APS 317 286 326<br />
An analysis of the progress of pupils across the school (Figure 10) demonstrates that the vast majority of pupils are currently on track to<br />
achieve 3 Levels progress in English and mathematics. The progress that pupils make in a wide range of subjects is at least good;<br />
progress is outstanding in Mathematics, French, Spanish, Drama, Dance, Catering, Core and Additional Science, Physics and<br />
Chemistry) (See Achievement File)<br />
The extent to which pupils develop and apply a range of skills in reading, writing communication and mathematics is improving and<br />
is now at least good. The appointment of an AHT who has an overview of Literacy, alongside the introduction of a new feedback policy,<br />
is having a marked impact. There is growing consistency in how literacy is promoted and assessed across subjects. Strategies to<br />
encourage reading for enjoyment are been put into place.<br />
The Pupil Premium is providing support for pupils through an extensive range of additional support and provision including reduction<br />
in group sizes, 1-to-1 support, and a rigorous mentoring programme.<br />
Y9<br />
Y8<br />
Y7<br />
Figure 10. Progress of current pupils – December 2015<br />
Disadvantaged to follow<br />
(% of pupils - School data)<br />
Progress<br />
English<br />
On Target<br />
Maths<br />
On<br />
Target<br />
Att PA Fixed term<br />
Exclusions<br />
Disadvantaged 86.8 70.8 42.9<br />
Non<br />
Disadvantaged<br />
76.6 81.5 2.4<br />
Disadvantaged 60.8 90.2 7.1<br />
Non<br />
Disadvantaged<br />
64.0 79.2 2.4<br />
Disadvantaged 61.9 76.2 16.7<br />
Non<br />
Disadvantaged<br />
Key<br />
English/ Maths on or above target –<br />
Attendance - %<br />
PA – % Persistent absence – below 85% to December 2015<br />
Fixed Term exclusions – % of fixed term exclusions<br />
81.0 83.9 4.8<br />
The progress of those pupils in Year 10 and<br />
11 supported by the Pupil Premium is strong<br />
and current tracking data indicates that the<br />
attainment gap will be reduced further<br />
(5ACEM) with the gaps for 3L and 4L<br />
progress also closing (Figures 9 & 10). Figure<br />
10 shows that the attainment gap is closing<br />
throughout the school.<br />
The Catch-up Premium is used to good<br />
effect to support pupils who enter the<br />
school below L4 in reading/writing and/or<br />
mathematics. (See use of Year 7 catch up<br />
and impact on the school website)<br />
There is a very strong culture of learning and achievement throughout the school. The<br />
quality of learning for all groups of pupils is high and in over 88% of lessons progress is<br />
judged to be good or outstanding. (Termly Teaching and Learning reports and<br />
METAL reports)<br />
CEIAG is a strength of the school and pupils are well prepared for the next stage in<br />
their education, training or employment - as evidenced by the low NEET figure (2015<br />
- less than 2%).<br />
Pupil progress as judged in lesson<br />
observations – progress over time<br />
outstanding 38%<br />
good 50%<br />
requires improvement 10%<br />
inadequate 1%<br />
Based on 153 lesson observations 2014/15?
Summary<br />
The quality of teaching, learning and assessment…..<br />
Good<br />
The overall quality of teaching in the school is good with examples of outstanding teaching. An analysis of lesson observations<br />
(see below) and a consideration of other evidence, including work scrutiny, student feedback and parental surveys, indicate that<br />
teaching is often good and only rarely ‘requires improvement’. Improving the quality of teaching has been and is the school’s highest<br />
priority; teaching is better now than it was last year. The quality of learning from our most recent reviews and lesson observations,<br />
aimed at securing ‘typicality’: 38% Outstanding, 50% Good, 10% RI, 1% Inadequate. (Lesson Observation file).<br />
Teaching in July 2013 was judged not yet to be outstanding because:<br />
• Ofsted 2013 -There is a need to increase the proportion of outstanding teaching, to ensure that students consistently<br />
make outstanding progress given their starting points. (SIP Priority 4&2) See Milestones and actions (Teaching and<br />
Learning reports and METAL reports)<br />
• Ofsted 2013 -Marking is variable and does not always provide students with clear guidance on how well students are<br />
doing and what they need to do to improve. Opportunities need to be created for students to respond to marking.<br />
(SIP Priority 2) See Milestones and actions (Teaching and Learning reports and METAL reports)<br />
• Ofsted 2013 -The setting of homework is variable and opportunities to encourage independent learning skills and<br />
develop research skills are missed. (SIP Priority 2) See Milestones and actions (Teaching and Learning reports and<br />
METAL reports)<br />
Since the last inspection there has been a sustained focus within the school on improving the quality of teaching and learning. This has<br />
resulted in a higher percentage of lessons now judged as good (88%) or outstanding (38%).<br />
Features of the best teaching within the school include: (Teaching and Learning and METAL Reports 2014/15)<br />
The quality of marking and feedback- teachers regularly check pupils’ understanding and adapt teaching strategies and approaches<br />
accordingly. Excellent subject/syllabus knowledge and Year 11 students feel very well prepared for examinations. More consistent<br />
marking and feedback across the school with a better balance between self, peer and teacher assessment. Students are able to<br />
articulate how they have become better learners in most subjects. An improvement in the standard of presentation across the school.<br />
Many examples of ‘teaching to the top’ to ensure challenge for the most able. Very positive feedback about the warhorse project<br />
ensuring new year 7 students move on and do not repeat primary work. Increasing use of SMH to set homework in line with school<br />
policy. All departments have developed a series of ‘I can’ statements in line with the school guidance for assessment without levels.<br />
Figure 11. Lesson observations by subject<br />
Lessons are often<br />
outstanding in<br />
Geography, History,<br />
French, Dance, Drama<br />
Lessons are consistently<br />
good in<br />
English,<br />
Mathematics, Science,<br />
PE, ICT, Drama, PSHE,<br />
H&SC, Film & Media<br />
Religious Education<br />
Lessons occasionally require<br />
improvement in<br />
Design & Technology<br />
Music.<br />
Quality of teaching as judged in<br />
lesson observations<br />
outstanding 38%<br />
good 50%<br />
requires<br />
improvement<br />
10%<br />
inadequate 1%<br />
Personal development, behaviour and welfare ……<br />
Good<br />
Summary<br />
The behaviour and safety of pupils are good. Pupils’ behaviour around school and within lessons is good. Feedback from lesson<br />
observations, pupil, parental and staff surveys, as well as the many positive comments we receive from visitors, all support our<br />
judgement that the behaviour and safety of pupils are good.<br />
The current priorities are:<br />
• To develop the rewards system, further strengthening the strong school ethos. (SIP 3.4)<br />
• Reduction in the number of days lost through exclusion to a figure that matches or is less than the average<br />
number of days for schools with a similar profile. (SIP 3.3)<br />
Attendance has improved over the last three years and currently stands at 95.6%. The proportion of persistent non-attenders has also<br />
fallen as a direct result of the school’s determination to improve attendance through home visits and legal action. Punctuality across<br />
the school is good and carefully monitored. We have a new Bullying Charter that is now in place. Incidents of bullying are extremely<br />
rare and always dealt with seriously. Student Voice is strong and students consistently express the opinion that they ‘feel safe in<br />
school’. The number of days lost to permanent and fixed term exclusions has fallen over the past three years but increased in 2012/13<br />
following the arrival of the new headteacher in September 2012. These have been reduced by 30% during 2014/15 and we are<br />
confident these will go below the NA over the next 18 months. (See Bullying Log, Student Voice survey and Exclusion File)<br />
Figure 12. Absence data<br />
(RAISEonline) Last year in brackets<br />
Absence 2014/1 School National<br />
% Persistent<br />
absentees (15%+) 6.5 5.8<br />
% of sessions missed 5.4 5.2<br />
Figure 13. Exclusion data Latest<br />
(RAISEonline)<br />
Exclusions 2013 School National<br />
Permanent exclusions<br />
(% of pupil group)<br />
0.0 0.14<br />
% of pupils with 1 or more<br />
fixed term exclusion<br />
5.5% 3.7%<br />
Fixed term% of pupil group 10% 7%<br />
Percentage of<br />
pupils who<br />
strongly agree /<br />
agree that:<br />
I feel safe when I am at<br />
school 90%
Summary<br />
The Effectiveness of leadership and management of, the school are…<br />
Good<br />
The leadership in, and management of, the school are good. Rigorous self-evaluation, feedback from parents, pupils, staff and the<br />
LA adviser all support our judgement that leadership and management are at least good. There is clear evidence of outstanding<br />
leadership of some key aspects of school life.<br />
Leadership and management are not yet outstanding because:<br />
• Following a dip in performance in 2015 there is a need to build on our excellent success from 2012-2014 for KS4 even<br />
further in terms of expected/above expected levels of progress in English, 5ACEM, VA and narrowing the gap between<br />
our students who are SEN with support, disadvantaged and non-disadvantaged students to ensure we are consistently<br />
broadly in line or above when compared to national averages. We also need to further reduce the in-school variation in<br />
subject performance.<br />
• Further development of the autonomy of Middle Leaders to secure further improvements in their year groups/<br />
departments.<br />
Particular strengths of the leadership and management of the school include:<br />
• The sense of direction and clear moral purpose provided by the leadership team. The culture and ethos of the school are very<br />
good and help to ensure the good behaviour of pupils in lessons and around school.<br />
• There is a continual pursuit of excellence and improvement. The quality of self-evaluation and the determination to improve<br />
the quality of teaching and learning is leading to a significant reduction of the within-school variation at GCSE. (See LLP<br />
Report 2014)<br />
• Safeguarding arrangements are secure, thorough, and ensure that pupils are safe at all times. All statutory requirements are<br />
met. The school’s curriculum is carefully tailored to meet the needs of all students with a range of academic and vocational<br />
pathways on offer.<br />
Since the last inspection report (July, 2013) there have been further improvements in the quality of teaching, attendance and<br />
punctuality, standards of behaviour and in the spiritual, moral, social and cultural development of all pupils (Figure 14).<br />
Figure 14. Impact of leadership and management<br />
Focus Key strategic developments since last inspection Impact<br />
Attainment<br />
& Progress<br />
Quality of<br />
Teaching<br />
Attendance<br />
&<br />
Punctuality<br />
Behaviour &<br />
Safety<br />
• Greater accountability through a new model of school and<br />
departmental self-evaluation<br />
• Member of PIXL and Deputy Head for Achievement and<br />
Standards and AHT for Intervention<br />
• Progress driven fortnightly line management meetings<br />
• Greater use of data by middle leaders to support<br />
monitoring and evaluation<br />
• SLT/Governors have a clear understanding of the schools<br />
strengths and areas for development<br />
• Leadership of Teaching and learning. AHT for Teaching<br />
and Learning and CPD<br />
• Appointment of 3 Lead Practitioners<br />
• Quality of professional development<br />
• Whole school rewards system<br />
• Development of the role of the attendance/welfare officer.<br />
Now an SLE (Specialist Leader of Education)<br />
• Development in role of Year Leaders<br />
• New Behaviour for Learning policy/ Bullying Charter<br />
AHT for Inclusion and 2 Behaviour Support workers<br />
SMSC • Level 2 Rights Respecting School<br />
• Greater student leadership through year councils and<br />
School Council<br />
Top 50 Most Improved School in Country in 2014<br />
2011- 43% 2012-47% 2013 -54% 2014 -61% 2015 (50%)<br />
2016 -65%<br />
A*-C in English 81% 2014<br />
A*-C in Maths 67% 2014 and 75% A*-C in 2015<br />
Disadvantaged gap reducing in a number of key measures<br />
Significant improvement in Core and Additional Science<br />
(now above NA)<br />
Further reduction in in school variation<br />
Improvement in lesson observation grades:<br />
Outstanding lessons up from 20% to 31%<br />
Good & better lessons up from 79% to 88%<br />
Leaning walks indicate significant improvements in the<br />
quality of feedback<br />
Attendance risen from 93.6% to 94.7%<br />
Persistent Absence reduced by half<br />
Year 11 Attendance 2015/16 (Autumn) – 94%<br />
Fixed-term exclusions reduced by 30% since 2012/13<br />
Permanent exclusions remain at 0%<br />
Very positive, caring, supportive ethos.<br />
Now oversubscribed in Year 7 despite falling rolls locally.<br />
Performance management within the school is rigorous and highly robust and is used to develop, support and challenge the professional practice of all staff.<br />
Although good and outstanding teaching exists throughout the school, there is a direct correlation between salary progression and teacher effectiveness.<br />
Performance Management Outcomes 2014/15<br />
Quality of Teaching code: 1 = Outstanding; 2 = Good; 3 = Requiring Improvement; 4 – Inadequate. Schools have historically graded individual lesson observations<br />
and reported on these for the quality of teaching. However, schools are now advised to use a triangulated evidence base to judge the quality of teaching.<br />
Such judgements are still likely to take place at specific points over the period of the year. Performance management objectives code: F = Fully met; P = Partially met;<br />
N = Not met. Judgement: 1 = Exceeded Expectations; 2 = Achieved Expectations; 3 = Meets minimum expectations with some development required; 4 = Inadequate.<br />
Performance Management Outcomes 2014/15<br />
• 20 out of 53 teachers were judged exceptional, 8 of these are eligible for pay progression the remainder are at the top of their pay scale.<br />
• 29 out of 53 achieved expectations, 18 of these are eligible for pay progression the remainder are at the top of their pay scale<br />
• 2 (4 in 2013/14) out of 53 met minimum expectations with some development required<br />
• 0 (1 in 2013/14) out of 53 was deemed inadequate and is on a management support programme.<br />
The quality of governance is good, as evidenced by governors’ minutes. The governors provide a high level of support and challenge<br />
and help to set the strategic direction for the school. Through rigorous planning and monitoring, governors ensure the financial<br />
stability of the school. (Governors Minutes)