

STRENGTH & STABILITY
6014Bw7MC
6014Bw7MC

You also want an ePaper? Increase the reach of your titles
YUMPU automatically turns print PDFs into web optimized ePapers that Google loves.
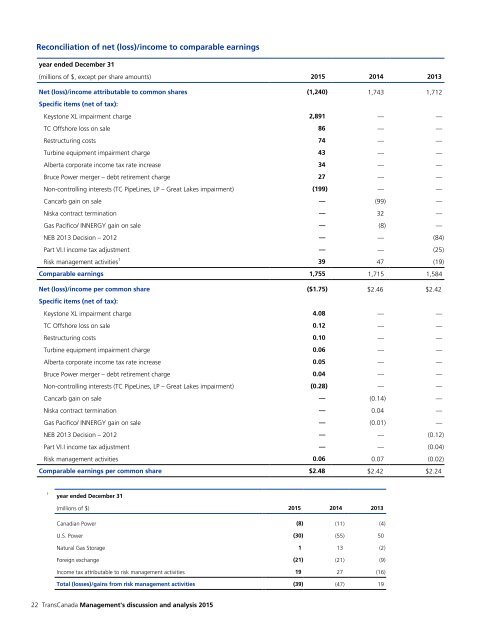
Reconciliation of net (loss)/income to comparable earnings<br />
year ended December 31<br />
(millions of $, except per share amounts) 2015 2014 2013<br />
Net (loss)/income attributable to common shares (1,240) 1,743 1,712<br />
Specific items (net of tax):<br />
Keystone XL impairment charge 2,891 — —<br />
TC Offshore loss on sale 86 — —<br />
Restructuring costs 74 — —<br />
Turbine equipment impairment charge 43 — —<br />
Alberta corporate income tax rate increase 34 — —<br />
Bruce Power merger – debt retirement charge 27 — —<br />
Non-controlling interests (TC PipeLines, LP – Great Lakes impairment) (199) — —<br />
Cancarb gain on sale — (99) —<br />
Niska contract termination — 32 —<br />
Gas Pacifico/ INNERGY gain on sale — (8) —<br />
NEB 2013 Decision – 2012 — — (84)<br />
Part VI.I income tax adjustment — — (25)<br />
Risk management activities 1 39 47 (19)<br />
Comparable earnings 1,755 1,715 1,584<br />
Net (loss)/income per common share ($1.75) $2.46 $2.42<br />
Specific items (net of tax):<br />
Keystone XL impairment charge 4.08 — —<br />
TC Offshore loss on sale 0.12 — —<br />
Restructuring costs 0.10 — —<br />
Turbine equipment impairment charge 0.06 — —<br />
Alberta corporate income tax rate increase 0.05 — —<br />
Bruce Power merger – debt retirement charge 0.04 — —<br />
Non-controlling interests (TC PipeLines, LP – Great Lakes impairment) (0.28) — —<br />
Cancarb gain on sale — (0.14) —<br />
Niska contract termination — 0.04 —<br />
Gas Pacifico/ INNERGY gain on sale — (0.01) —<br />
NEB 2013 Decision – 2012 — — (0.12)<br />
Part VI.I income tax adjustment — — (0.04)<br />
Risk management activities 0.06 0.07 (0.02)<br />
Comparable earnings per common share $2.48 $2.42 $2.24<br />
1<br />
year ended December 31<br />
(millions of $) 2015 2014 2013<br />
Canadian Power (8) (11) (4)<br />
U.S. Power (30) (55) 50<br />
Natural Gas Storage 1 13 (2)<br />
Foreign exchange (21) (21) (9)<br />
Income tax attributable to risk management activities 19 27 (16)<br />
Total (losses)/gains from risk management activities (39) (47) 19<br />
22 TransCanada Management's discussion and analysis 2015