

STRENGTH & STABILITY
6014Bw7MC
6014Bw7MC

You also want an ePaper? Increase the reach of your titles
YUMPU automatically turns print PDFs into web optimized ePapers that Google loves.
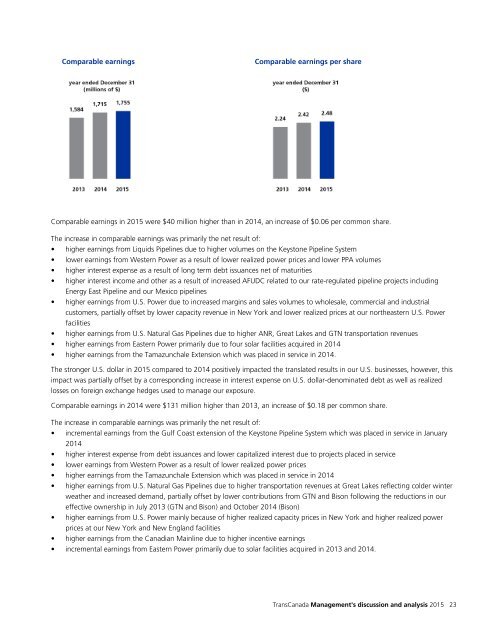
Comparable earnings<br />
Comparable earnings per share<br />
Comparable earnings in 2015 were $40 million higher than in 2014, an increase of $0.06 per common share.<br />
The increase in comparable earnings was primarily the net result of:<br />
• higher earnings from Liquids Pipelines due to higher volumes on the Keystone Pipeline System<br />
• lower earnings from Western Power as a result of lower realized power prices and lower PPA volumes<br />
• higher interest expense as a result of long term debt issuances net of maturities<br />
• higher interest income and other as a result of increased AFUDC related to our rate-regulated pipeline projects including<br />
Energy East Pipeline and our Mexico pipelines<br />
• higher earnings from U.S. Power due to increased margins and sales volumes to wholesale, commercial and industrial<br />
customers, partially offset by lower capacity revenue in New York and lower realized prices at our northeastern U.S. Power<br />
facilities<br />
• higher earnings from U.S. Natural Gas Pipelines due to higher ANR, Great Lakes and GTN transportation revenues<br />
• higher earnings from Eastern Power primarily due to four solar facilities acquired in 2014<br />
• higher earnings from the Tamazunchale Extension which was placed in service in 2014.<br />
The stronger U.S. dollar in 2015 compared to 2014 positively impacted the translated results in our U.S. businesses, however, this<br />
impact was partially offset by a corresponding increase in interest expense on U.S. dollar-denominated debt as well as realized<br />
losses on foreign exchange hedges used to manage our exposure.<br />
Comparable earnings in 2014 were $131 million higher than 2013, an increase of $0.18 per common share.<br />
The increase in comparable earnings was primarily the net result of:<br />
• incremental earnings from the Gulf Coast extension of the Keystone Pipeline System which was placed in service in January<br />
2014<br />
• higher interest expense from debt issuances and lower capitalized interest due to projects placed in service<br />
• lower earnings from Western Power as a result of lower realized power prices<br />
• higher earnings from the Tamazunchale Extension which was placed in service in 2014<br />
• higher earnings from U.S. Natural Gas Pipelines due to higher transportation revenues at Great Lakes reflecting colder winter<br />
weather and increased demand, partially offset by lower contributions from GTN and Bison following the reductions in our<br />
effective ownership in July 2013 (GTN and Bison) and October 2014 (Bison)<br />
• higher earnings from U.S. Power mainly because of higher realized capacity prices in New York and higher realized power<br />
prices at our New York and New England facilities<br />
• higher earnings from the Canadian Mainline due to higher incentive earnings<br />
• incremental earnings from Eastern Power primarily due to solar facilities acquired in 2013 and 2014.<br />
TransCanada Management's discussion and analysis 2015 23