European Aviation Environmental Report 2016
1nTl7nR
1nTl7nR

You also want an ePaper? Increase the reach of your titles
YUMPU automatically turns print PDFs into web optimized ePapers that Google loves.
18 <strong>European</strong> <strong>Aviation</strong> <strong>Environmental</strong> <strong>Report</strong> <strong>2016</strong><br />
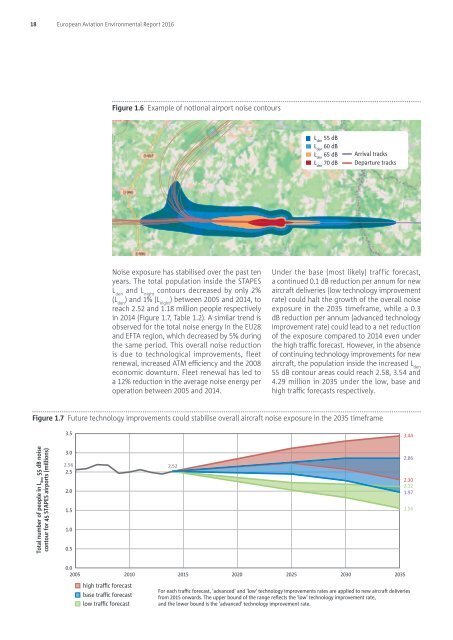
Figure 1.6 Example of notional airport noise contours<br />
L den<br />
55 dB<br />
L den<br />
60 dB<br />
L den<br />
65 dB<br />
L den<br />
70 dB<br />
Arrival tracks<br />
Departure tracks<br />
Noise exposure has stabilised over the past ten<br />
years. The total population inside the STAPES<br />
L den<br />
and L night<br />
contours decreased by only 2%<br />
(L den<br />
) and 1% (L night<br />
) between 2005 and 2014, to<br />
reach 2.52 and 1.18 million people respectively<br />
in 2014 (Figure 1.7, Table 1.2). A similar trend is<br />
observed for the total noise energy in the EU28<br />
and EFTA region, which decreased by 5% during<br />
the same period. This overall noise reduction<br />
is due to technological improvements, fleet<br />
renewal, increased ATM efficiency and the 2008<br />
economic downturn. Fleet renewal has led to<br />
a 12% reduction in the average noise energy per<br />
operation between 2005 and 2014.<br />
Under the base (most likely) traffic forecast,<br />
a continued 0.1 dB reduction per annum for new<br />
aircraft deliveries (low technology improvement<br />
rate) could halt the growth of the overall noise<br />
exposure in the 2035 timeframe, while a 0.3<br />
dB reduction per annum (advanced technology<br />
improvement rate) could lead to a net reduction<br />
of the exposure compared to 2014 even under<br />
the high traffic forecast. However, in the absence<br />
of continuing technology improvements for new<br />
aircraft, the population inside the increased L den<br />
55 dB contour areas could reach 2.58, 3.54 and<br />
4.29 million in 2035 under the low, base and<br />
high traffic forecasts respectively.<br />
Figure 1.7 Future technology improvements could stabilise overall aircraft noise exposure in the 2035 timeframe<br />
3.5<br />
3.44<br />
Total number of people in L den<br />
55 dB noise<br />
contour for 45 STAPES airports (millions)<br />
3.0<br />
2.56<br />
2.5<br />
2.0<br />
1.5<br />
1.0<br />
0.5<br />
2.52<br />
2.86<br />
2.30<br />
2.12<br />
1.97<br />
1.56<br />
0.0<br />
2005 2010 2015 2020 2025 2030 2035<br />
high traffic forecast<br />
base traffic forecast<br />
low traffic forecast<br />
For each traffic forecast, 'advanced' and 'low' technology improvements rates are applied to new aircraft deliveries<br />
from 2015 onwards. The upper bound of the range reflects the 'low' technology improvement rate,<br />
and the lower bound is the 'advanced' technology improvement rate.