

ionkey/MS
1TDCbKs
1TDCbKs

Create successful ePaper yourself
Turn your PDF publications into a flip-book with our unique Google optimized e-Paper software.
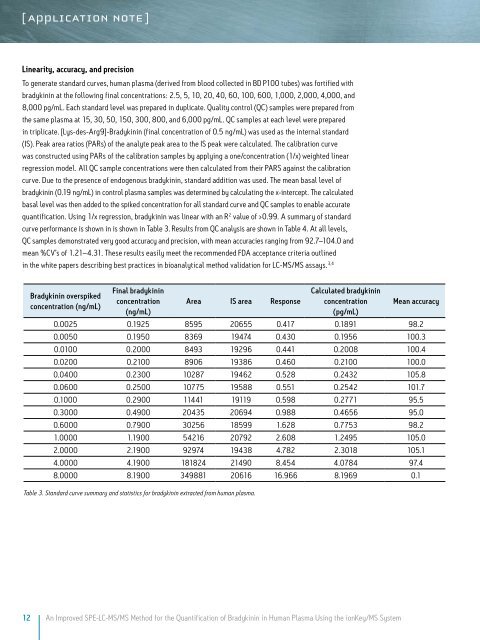
Linearity, accuracy, and precision<br />
To generate standard curves, human plasma (derived from blood collected in BD P100 tubes) was fortified with<br />
bradykinin at the following final concentrations: 2.5, 5, 10, 20, 40, 60, 100, 600, 1,000, 2,000, 4,000, and<br />
8,000 pg/mL. Each standard level was prepared in duplicate. Quality control (QC) samples were prepared from<br />
the same plasma at 15, 30, 50, 150, 300, 800, and 6,000 pg/mL. QC samples at each level were prepared<br />
in triplicate. [Lys-des-Arg9]-Bradykinin (final concentration of 0.5 ng/mL) was used as the internal standard<br />
(IS). Peak area ratios (PARs) of the analyte peak area to the IS peak were calculated. The calibration curve<br />
was constructed using PARs of the calibration samples by applying a one/concentration (1/x) weighted linear<br />
regression model. All QC sample concentrations were then calculated from their PARS against the calibration<br />
curve. Due to the presence of endogenous bradykinin, standard addition was used. The mean basal level of<br />
bradykinin (0.19 ng/mL) in control plasma samples was determined by calculating the x-intercept. The calculated<br />
basal level was then added to the spiked concentration for all standard curve and QC samples to enable accurate<br />
quantification. Using 1/x regression, bradykinin was linear with an R 2 value of >0.99. A summary of standard<br />
curve performance is shown in is shown in Table 3. Results from QC analysis are shown in Table 4. At all levels,<br />
QC samples demonstrated very good accuracy and precision, with mean accuracies ranging from 92.7–104.0 and<br />
mean %CV’s of 1.21–4.31. These results easily meet the recommended FDA acceptance criteria outlined<br />
in the white papers describing best practices in bioanalytical method validation for LC-<strong>MS</strong>/<strong>MS</strong> assays. 3,4<br />
Bradykinin overspiked<br />
concentration (ng/mL)<br />
Final bradykinin<br />
concentration<br />
(ng/mL)<br />
Area IS area Response<br />
Calculated bradykinin<br />
concentration<br />
(pg/mL)<br />
Mean accuracy<br />
0.0025 0.1925 8595 20655 0.417 0.1891 98.2<br />
0.0050 0.1950 8369 19474 0.430 0.1956 100.3<br />
0.0100 0.2000 8493 19296 0.441 0.2008 100.4<br />
0.0200 0.2100 8906 19386 0.460 0.2100 100.0<br />
0.0400 0.2300 10287 19462 0.528 0.2432 105.8<br />
0.0600 0.2500 10775 19588 0.551 0.2542 101.7<br />
0.1000 0.2900 11441 19119 0.598 0.2771 95.5<br />
0.3000 0.4900 20435 20694 0.988 0.4656 95.0<br />
0.6000 0.7900 30256 18599 1.628 0.7753 98.2<br />
1.0000 1.1900 54216 20792 2.608 1.2495 105.0<br />
2.0000 2.1900 92974 19438 4.782 2.3018 105.1<br />
4.0000 4.1900 181824 21490 8.454 4.0784 97.4<br />
8.0000 8.1900 349881 20616 16.966 8.1969 0.1<br />
Table 3. Standard curve summary and statistics for bradykinin extracted from human plasma.<br />
12 An Improved SPE-LC-<strong>MS</strong>/<strong>MS</strong> Method for the Quantification of Bradykinin in Human Plasma Using the ionKey/<strong>MS</strong> System