

ionkey/MS
1TDCbKs
1TDCbKs

You also want an ePaper? Increase the reach of your titles
YUMPU automatically turns print PDFs into web optimized ePapers that Google loves.
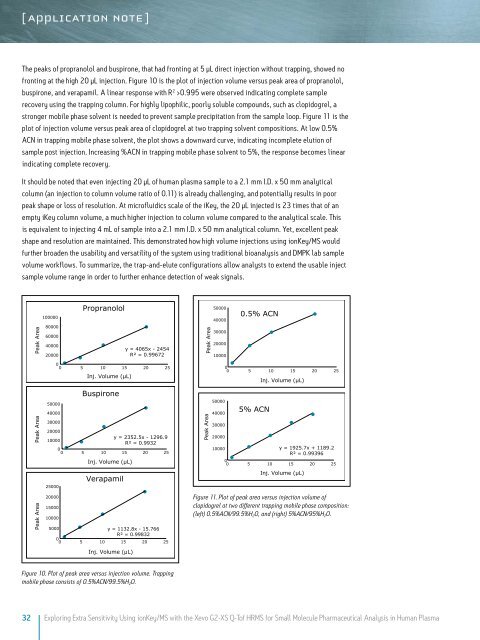
The peaks of propranolol and buspirone, that had fronting at 5 µL direct injection without trapping, showed no<br />
fronting at the high 20 µL injection. Figure 10 is the plot of injection volume versus peak area of propranolol,<br />
buspirone, and verapamil. A linear response with R 2 >0.995 were observed indicating complete sample<br />
recovery using the trapping column. For highly lipophilic, poorly soluble compounds, such as clopidogrel, a<br />
stronger mobile phase solvent is needed to prevent sample precipitation from the sample loop. Figure 11 is the<br />
plot of injection volume versus peak area of clopidogrel at two trapping solvent compositions. At low 0.5%<br />
ACN in trapping mobile phase solvent, the plot shows a downward curve, indicating incomplete elution of<br />
sample post injection. Increasing %ACN in trapping mobile phase solvent to 5%, the response becomes linear<br />
indicating complete recovery.<br />
It should be noted that even injecting 20 µL of human plasma sample to a 2.1 mm I.D. x 50 mm analytical<br />
column (an injection to column volume ratio of 0.11) is already challenging, and potentially results in poor<br />
peak shape or loss of resolution. At microfluidics scale of the iKey, the 20 µL injected is 23 times that of an<br />
empty iKey column volume, a much higher injection to column volume compared to the analytical scale. This<br />
is equivalent to injecting 4 mL of sample into a 2.1 mm I.D. x 50 mm analytical column. Yet, excellent peak<br />
shape and resolution are maintained. This demonstrated how high volume injections using ionKey/<strong>MS</strong> would<br />
further broaden the usability and versatility of the system using traditional bioanalysis and DMPK lab sample<br />
volume workflows. To summarize, the trap-and-elute configurations allow analysts to extend the usable inject<br />
sample volume range in order to further enhance detection of weak signals.<br />
Peak Area<br />
100000<br />
80000<br />
60000<br />
40000<br />
20000<br />
Propranolol<br />
y = 4065x - 2454<br />
R = 0.99672<br />
Peak Area<br />
50000<br />
40000<br />
30000<br />
20000<br />
10000<br />
0.5% ACN<br />
Peak Area<br />
Peak Area<br />
50000<br />
40000<br />
30000<br />
0<br />
0 5 10 15 20 25<br />
Inj. Volume (µL)<br />
Buspirone<br />
20000<br />
y = 2352.5x - 1296.9<br />
10000<br />
R = 0.9932<br />
0<br />
0 5 10 15 20 25<br />
25000<br />
20000<br />
15000<br />
10000<br />
Inj. Volume (µL)<br />
Verapamil<br />
5000<br />
y = 1132.8x - 15.766<br />
R = 0.99832<br />
0<br />
0 5 10 15 20 25<br />
Inj. Volume (µL)<br />
Peak Area<br />
50000<br />
40000<br />
30000<br />
20000<br />
10000<br />
0<br />
0 5 10 15 20 25<br />
5% ACN<br />
Inj. Volume (µL)<br />
y = 1925.7x + 1189.2<br />
R = 0.99396<br />
0<br />
0 5 10 15 20 25<br />
Inj. Volume (µL)<br />
Figure 11. Plot of peak area versus injection volume of<br />
clopidogrel at two different trapping mobile phase composition:<br />
(left) 0.5%ACN/99.5%H 2 O, and (right) 5%ACN/95%H 2 O.<br />
Figure 10. Plot of peak area versus injection volume. Trapping<br />
mobile phase consists of 0.5%ACN/99.5%H 2 O.<br />
32 Exploring Extra Sensitivity Using ionKey/<strong>MS</strong> with the Xevo G2-XS Q-Tof HR<strong>MS</strong> for Small Molecule Pharmaceutical Analysis in Human Plasma