1 |
april2016
april2016

You also want an ePaper? Increase the reach of your titles
YUMPU automatically turns print PDFs into web optimized ePapers that Google loves.
of 0.50%. All other information about the security is being ignored – information that might help the investor to refine<br />
their expectation of the signal’s return.<br />
Now let’s consider another investor who follows the same low-PE strategy but who is using a performance boosting model<br />
customized for the low-PE strategy. For ease of illustration, we will assume that its predictions are based on only two<br />
predictor variables (indicators): #1, the RSI indicator and #2 is VOL_CHG, the recent rate of change in the stock’s trading<br />
volume.<br />
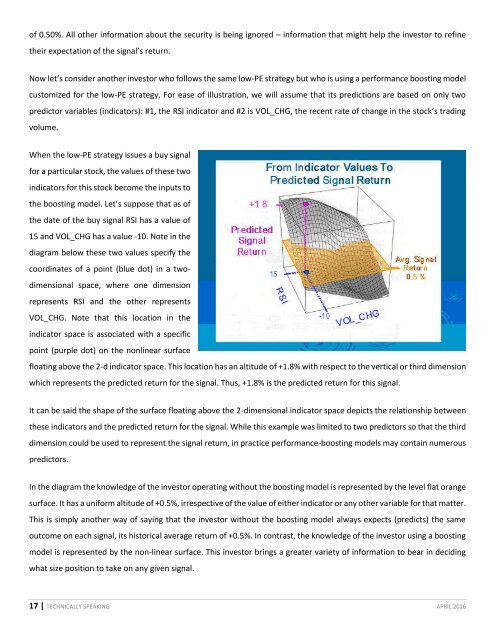
When the low-PE strategy issues a buy signal<br />
for a particular stock, the values of these two<br />
indicators for this stock become the inputs to<br />
the boosting model. Let’s suppose that as of<br />
the date of the buy signal RSI has a value of<br />
15 and VOL_CHG has a value -10. Note in the<br />
diagram below these two values specify the<br />
coordinates of a point (blue dot) in a twodimensional<br />
space, where one dimension<br />
represents RSI and the other represents<br />
VOL_CHG. Note that this location in the<br />
indicator space is associated with a specific<br />
point (purple dot) on the nonlinear surface<br />
floating above the 2-d indicator space. This location has an altitude of +1.8% with respect to the vertical or third dimension<br />
which represents the predicted return for the signal. Thus, +1.8% is the predicted return for this signal.<br />
It can be said the shape of the surface floating above the 2-dimensional indicator space depicts the relationship between<br />
these indicators and the predicted return for the signal. While this example was limited to two predictors so that the third<br />
dimension could be used to represent the signal return, in practice performance-boosting models may contain numerous<br />
predictors.<br />
In the diagram the knowledge of the investor operating without the boosting model is represented by the level flat orange<br />
surface. It has a uniform altitude of +0.5%, irrespective of the value of either indicator or any other variable for that matter.<br />
This is simply another way of saying that the investor without the boosting model always expects (predicts) the same<br />
outcome on each signal, its historical average return of +0.5%. In contrast, the knowledge of the investor using a boosting<br />
model is represented by the non-linear surface. This investor brings a greater variety of information to bear in deciding<br />
what size position to take on any given signal.<br />
17 | TECHNICALLY SPEAKING APRIL 2016