PREDICTION OF DISEASE OUTBREAKS AIlen Kerr and Philip Keane
PREDICTION OF DISEASE OUTBREAKS AIlen Kerr and Philip Keane
PREDICTION OF DISEASE OUTBREAKS AIlen Kerr and Philip Keane

You also want an ePaper? Increase the reach of your titles
YUMPU automatically turns print PDFs into web optimized ePapers that Google loves.
Gontents<br />
19<br />
<strong>PREDICTION</strong> <strong>OF</strong> <strong>DISEASE</strong> <strong>OUTBREAKS</strong><br />
<strong>AIlen</strong> <strong>Kerr</strong> <strong>and</strong> <strong>Philip</strong> <strong>Keane</strong><br />
19.7 Introduction ........ 299<br />
19.2 Which diseases are norrndttgforecast?............. .. 3OO<br />
The disease shouLd be economtcaLLg tmportant. ................ 3OO<br />
Routine control measures are expensiue <strong>and</strong> wastefuL. .... 3OO<br />
Elficient controt measures are auaiLable........... . 3OO<br />
Dtsease incidence mustfluctuateJrom season to season. 3Ol<br />
19.3 What do tue hope to achieue bg diseaseJorecasttng?......... 301<br />
19.4 Methods oJ diseaseJorecasttng........ .. 3O2<br />
Computer modeLLing. ........... 3O2<br />
Empirical correlations.............. ......... 3O3<br />
19.5 Examptes oJdiseaseJorecasting........ ,3O3<br />
Monitoring weather... ........... 3O3<br />
Monitoring inocuLum ......... 306<br />
Trap or testplots.. ............... 3O8<br />
Crop <strong>and</strong> siteJactors ......... 3Og<br />
C ommunic ation of p re dictions <strong>and</strong> w arning s to Jarmer s .. . 3 O I<br />
1 9.6 DeueLopment oJ a mettnd for forecasting<br />
teabLister blight rn Sn Lanka ......... 3Og<br />
19.7 Ffurther reading . 313<br />
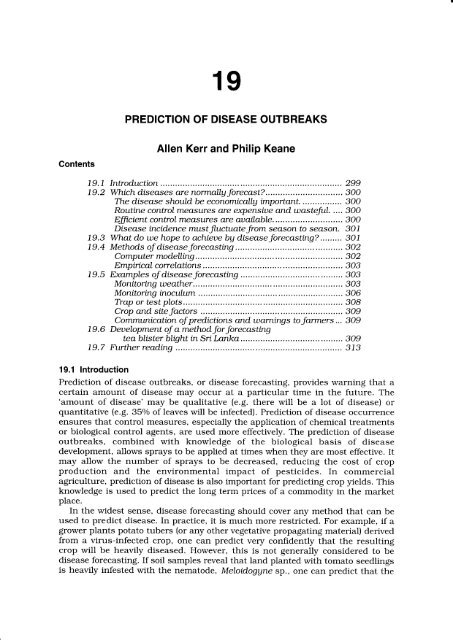
19.1 lntroduction<br />
Prediction of disease outbreaks, or disease forecasting, provides warning that a<br />
certain amount of disease may occur at a particular time in the future. The<br />
'amount of disease' may be qualitative (e.g. there will be a lot of disease) or<br />
quantitative (e.9. 35o/o of leaves will be infected). Prediction of disease occurrence<br />
ensures that control measures, especially the application of chemical treatments<br />
or biological control agents, are used more effectively. The prediction of disease<br />
outbreaks, combined with knowledge of the biological basis of disease<br />
development, allows sprays to be applied at times when they are most effective. It<br />
may allow the number of sprays to be decreased, reducing the cost of crop<br />
production <strong>and</strong> the environmental impact of pesticides. In commercial<br />
agriculture, prediction of disease is also important for predicting crop yields. This<br />
knowledge is used to predict the long term prices of a commodity in the market<br />
place.<br />
In the widest sense, disease forecasting should cover any method that can be<br />
used to predict disease. In practice, it is much more restricted. For example, if a<br />
grower plants potato tubers (or any other vegetative propagating material) derived<br />
from a virus-infected crop, one can predict very confidently that the resulting<br />
crop will be heavily diseased. However, this is not generally considered to be<br />
disease forecasting. If soil samples reveal that l<strong>and</strong> planted with tomato seedlings<br />
is heavily infested with the nematode, Meloidogune sp., one can predict that the
300 Allen <strong>Kerr</strong> <strong>and</strong> PhIIip <strong>Keane</strong><br />
resulting crop will suffer heavy root-knot damage. Again, this is not disease<br />
forecasting in the strict sense.<br />
So what is disease forecasting? In practice, it is the use of weather data,<br />
frequently combined with biological data, to predict disease incidence. It involves<br />
using the factors affecting disease discussed in Chapter 1B to predict disease<br />
outbreaks. Most growers are aware that there is a relationship between weather<br />
<strong>and</strong> disease. However, they would probably not be aware of, say, the relative<br />
importance of one day of weather favourable for disease development as compared<br />
with two or three days. Another way of viewing disease forecasting is to<br />
consider it as an extension of disease monitoring (the monitoring of the lows <strong>and</strong><br />
highs of an annual disease cycle). Once the monitoring becomes precise enough,<br />
it can be extrapolated to enable prediction of disease outbreaks.<br />
19.2 Which diseases are normally forecast?<br />
The vast majority of studies on disease forecasting are done because it is hoped<br />
that practical disease control methods will be improved as a result of accurate<br />
forecasting. If we consider disease forecasting from this very practical viewpoint,<br />
it should be possible to define the sorts of plant disease that could be profitably<br />
studied. Four criteria are usuallv considered.<br />
The disease should be economically important.<br />
Usually disease incidence <strong>and</strong>/or severity has to be above a certain level (the<br />
'threshold level') to cause significant yield loss. If a disease rarely reaches this<br />
level, it may not be worth forecasting. Often disease forecasting involves<br />
predicting when the disease is likely to exceed this threshold level. For example,<br />
in Sri Lanka significant economic damage to tea was caused when 35o/o or more<br />
of the leaves of tea had blisters caused by the blister blight fungus (Exobasidium<br />
uexans). This formed the basis of disease control measures after disease<br />
forecasting was introduced <strong>and</strong> will be described in more detail later. Wheat stem<br />
rust is expected to cause economic loss in Victorian wheat crops in an average of<br />
one year in every sixteen. It is possible to predict the years of economic loss based<br />
on the weather in the summer preceding the crop <strong>and</strong> the following late winter<br />
<strong>and</strong> early spring. Wet summers favour the survival of the pathogen on volunteer<br />
wheat plants which are more abundant in wetter than drier summers.<br />
Routine control measures are expensive <strong>and</strong> wasteful.<br />
If a disease can be controlled by an inexpensive fungicidal seed dressing or<br />
management practice, for example, there is little practical benefit from developing<br />
methods of forecasting. It may be worthwhile treating the seeds routinely,<br />
regardless of whether the disease is likely to occur in any particular year. This is<br />
what is done with the routine fungicide treatment ('pickling') of wheat seed to<br />
control bunt. Similarly, if resistant cultivars are available, it would be more<br />
sensible to promote these, rather than to rely on disease prediction <strong>and</strong><br />
fungicides. However if control relies on the expensive application of a fungicide<br />
spray, then the correctly timed application of this spray, based on prediction of<br />
disease outbreaks, will be important in improving the effectiveness of the<br />
treatment <strong>and</strong> in reducing its cost.<br />
Efficient control measures are available.<br />
It is usually pointless forecasting disease incidence if there are no control<br />
measures available. There are situations, however, where this argument does not
19. Predictton oJ disease outbreaks 301<br />
apply. An example from Engl<strong>and</strong> illustrates this clearly <strong>and</strong> there are probably<br />
many tropical plant diseases where the same situation applies. The incidence of<br />
beet yellows virus in sugar beet can be predicted very accurately but the disease<br />
is difficult to control. However, high disease incidence means low yields of sugar.<br />
Predicting the amount of disease enables sugar factories to plan ahead. For<br />
example, they can estimate how much labour will be required, what orders can<br />
be accepted <strong>and</strong> so on. This also applies to any situation where prior knowledge<br />
of crop yield is important in the selling <strong>and</strong> trading of that crop. For example,<br />
every year specialist crop forecasters travel through the major cocoa producing<br />
countries of the world to estimate the likely yield of cocoa for that year. This<br />
involves assessing many factors relating to the growth <strong>and</strong> productivity of the<br />
trees (e.g. the number of productive trees, the flowering of the trees <strong>and</strong> the<br />
proportion of flowers setting pods). It also includes some prediction of the likely<br />
disease severity, especially of pod rot caused by Phgtophthora paLmiuora. which<br />
commonly destroys up to a third of the mature pods.<br />
Another form of prediction of disease occurrence is useful for diseases such as<br />
eucalypt dieback which are not uniformly distributed throughout a forest.<br />
Knowledge of the biology of the pathogen, the environment <strong>and</strong> the pattern of<br />
spread of the disease enables predictions to be made about the likelihood of<br />
disease occurring in certain areas. This information can be used to decide which<br />
areas of a forest should be quarantined <strong>and</strong> which areas can be made available<br />
for logging without the risk of further spreading the disease.<br />
Disease incidence must fluctuate from season to season.<br />
There are very few diseases that do not vary considerably in incidence from<br />
season to season. Table 19.1 illustrates the sporadic occurrence of disease<br />
epidemics within an area <strong>and</strong> in different areas in the same state. Exceptions<br />
might be found in diseases of perennial crops such as those caused by the cocoa<br />
swollen shoot virus <strong>and</strong> the cadang-cadang viroid of coconut or in some soilborne<br />
diseases (e.g. nematodes) where disease incidence builds up slowly over<br />
manv vears.<br />
Table 19.1 Incidence of grapevine downy mildew in New South Wales over a 3O-year period<br />
(Severity: 0 - none, 1 - slight, 2 - moderate, 3 - severe). (From Kable, Magarey<br />
<strong>and</strong> Emmett. 1990.)<br />
Season Hunter Else- Season Hunter Else-<br />
Valley where Valley where<br />
1960-61<br />
196r-62<br />
r962-63<br />
1963-64<br />
1964-65<br />
1965-66<br />
r966-67<br />
1967-68<br />
1968-69<br />
1969-70<br />
I<br />
3<br />
I<br />
I<br />
o<br />
I<br />
2<br />
2<br />
3<br />
3<br />
I<br />
I<br />
I<br />
I<br />
0<br />
I<br />
I<br />
I<br />
3<br />
2<br />
1970-71<br />
t97t-72<br />
r972-73<br />
r973-74<br />
r974-75<br />
1975-76<br />
r976-77<br />
r977-78<br />
t978-79<br />
r979-80<br />
3 I<br />
3<br />
2<br />
3<br />
I<br />
I<br />
3<br />
3<br />
I<br />
3<br />
I<br />
I<br />
I<br />
3 I<br />
o<br />
Season Hunter Else-<br />
Vallev where<br />
1980-81 o<br />
1981-82 I<br />
1982-83 0<br />
1983-84 r<br />
1984-85 I<br />
1985-86 l<br />
1986-87 0<br />
1987-88 0<br />
1988-89 I<br />
1989-90 2<br />
19.3 What do we hope to achieve by disease forecasting?<br />
Apart from exceptional cases such as beet yellows virus, the ultimate aim of<br />
disease forecasting is to reduce disease incidence <strong>and</strong> to reduce the cost of<br />
disease control measures. The immediate aim is to determine in advance of an<br />
I<br />
3<br />
o<br />
3<br />
I<br />
3<br />
U
302 Allen <strong>Kerr</strong> <strong>and</strong> Philtp <strong>Keane</strong><br />
outbreak of disease the biological (commonly the infection periods) <strong>and</strong><br />
environmental factors that will lead to the outbreak, so that measures can be<br />
taken to combat the infection before it actually occurs, using protectant rather<br />
than eradicant fungicides.<br />
With an accurate disease forecasting system growers can be warned to take<br />
appropriate control measures to protect their crops. These measures usually<br />
involve spraying to control either pathogens or vectors. In other words, growers<br />
may be advised to apply a spray when otherwise they would not have done so.<br />
Routine spraying is used to control many diseases. At certain stages of crop<br />
development, sprays might be applied every 5,7 or l0 days. This does not mean<br />
that every spray is necessary. It means that from previous experience it is known<br />
that disease will develop in some years if these routine sprays are not applied.<br />
Accurate disease forecasting can reduce the number of sprays applied, perhaps<br />
not every year but at least in some years. In other words, disease forecasting can<br />
give growers the confidence not to apply sprays, when otherwise they would have<br />
done so.<br />
19.4 Methods of disease forecasting<br />
In all cases, it is necessary to establish a correlation between (a) disease<br />
incidence <strong>and</strong> (b) weather <strong>and</strong>/or some biological factor. The procedures adopted<br />
for tea blister blight in Sri Lanka will be described in detail as an example of the<br />
development of a practical disease forecasting system. If the weather conditions<br />
promoting disease can be forecast, this is a great advantage. It enables growers to<br />
apply protectant sprays before infection occurs <strong>and</strong> when the ground is not too<br />
wet for mechanical equipment. So weather prediction, based on slmoptic weather<br />
charts, is becoming increasingly important for disease forecasting.<br />
Computer modelling<br />
A relatively recent development has been the use of systems analysis to produce<br />
simulation models of some plant diseases. Systems analysis attempts to<br />
accumulate into a computer-based model all the factors that affect the<br />
development of a certain disease (Chapter 18). It also attempts to model the<br />
complexity of the many interactions between these factors to allow accurate<br />
prediction of disease based on environmental variables. Analysis of the many<br />
complex interactions involved in disease requires the use of a computer.<br />
Simulation models depend on basic biological information <strong>and</strong>, of course, this<br />
information has to be obtained before a model can be developed. For a fungal<br />
disease, the necessary information will include the effects of rainfall, temperature,<br />
humidity, wind, light, sunshine <strong>and</strong> cloud cover on sporangiophore or<br />
conidiophore development, spore development, duration of spore production,<br />
number of spores produced, dissemination of spores, spore germination <strong>and</strong><br />
infection. Very few diseases are understood to this extent <strong>and</strong> there is still<br />
considerable doubt as to the accuracy of the models currently available. It<br />
appears to be a vain hope that such models, as with similar models for weather<br />
prediction, will ever accurately mimic real disease situations. There are too many<br />
poorly understood interactions between the biological <strong>and</strong> meteorological factors<br />
to allow accurate predictions. The new mathematical theory of chaos indicates<br />
how in such a situation the most minor, unpredictable factors can cause huge<br />
perturbations in ultimate weather or disease outcomes. However, attempting to<br />
develop such a model is useful in guiding research in disease epidemiologr. The<br />
model can highlight deficiencies in our knowledge about a disease. With<br />
increasing knowledge, the predictive value of a model can be improved. An
19. Predictton of dtsease outbreaks 303<br />
accurate model would have many benefits, allowing many important questions to<br />
be answered by the computer. For example, the weather data from different parts<br />
of the world could be used to indicate where certain diseases could become<br />
serious problems. Such a model could be used to predict the impact of global<br />
warming on the occurrence of disease in particular localities. More efficient<br />
quarantine regulations could be based on such data. For example, the Australian<br />
Quarantine <strong>and</strong> Inspection Service (AQIS) is using a program called CLIMEX to<br />
assess the risk of introducing specific diseases.<br />
E m pi ri cal co rre I ati o n s<br />
The greatest success in disease forecasting has relied on the more straightforward<br />
approach of developing empirical correlations between certain weather factors<br />
<strong>and</strong> disease. Several factors can be combined in a predictive model using<br />
techniques of multiple regression, as in the example with tea blister blight<br />
explained later. While these simple models have always relied on a degree of<br />
underst<strong>and</strong>ing of the biologr <strong>and</strong> epidemiologr of the disease, they do not attempt<br />
a complete modelling of all factors involved in the disease, but use only the most<br />
important factors affecting the disease. They rely on accumulation of just<br />
sufficient data to enable reasonable <strong>and</strong> economically useful prediction of<br />
disease. Of course some diseases <strong>and</strong> environments are more amenable to this<br />
approach than others, but there are many examples of success using this more<br />
direct approach.<br />
Once a predictive model has been developed, it has to be thoroughly tested by<br />
statistically comparing its predictions with what actually happens. A statistical<br />
figure can be put on the accuracy of a model.<br />
19.5 Examples of disease forecasting<br />
There have been many successful disease forecasting systems, usually based on<br />
monitoring <strong>and</strong> forecasting of weather <strong>and</strong> pathogen inoculum loads.<br />
Monitoring weather<br />
As discussed in Chapter 18, aspects of the weather have an overriding effect on<br />
disease development, given the presence of a susceptible crop <strong>and</strong> a virulent<br />
pathotype of the pathogen. Thus weather has been the most important<br />
consideration in disease monitoring <strong>and</strong> forecasting. Weather is routinely<br />
recorded by government agencies <strong>and</strong> used, along with satellite photos <strong>and</strong> other<br />
data sources, for broad scale weather forecasting. Some disease forecasting<br />
systems have been based on these broad scale weather forecasts, but it has long<br />
been known that the weather within the crop (the 'microclimate') has a more<br />
direct impact on disease than broad scale weather. A variety of devices has been<br />
developed for monitoring microclimatic factors such as duration of leaf wetness<br />
<strong>and</strong> temperature that are important in plant pathology. In recent times the<br />
development of electronic monitors for many aspects of microclimate, along with<br />
compact <strong>and</strong> reliable electronic data recorders, has opened up greater<br />
possibilities of monitoring the microclimatic factors that are important for<br />
particular diseases (see Chapter 18). With further development, these devices will<br />
become sufficiently cheap <strong>and</strong> compact for widespread use on individual farms,<br />
allowing very accurate monitoring of particular fields.<br />
Temperature is an important microclimatic variable affecting plant disease in<br />
temperate regions, where seasonal <strong>and</strong> day-to-day temperature fluctuations are<br />
great. It is not likely to be so important in the tropics, where day-to-day variation
304 ALLen Ken <strong>and</strong> PhIIio <strong>Keane</strong><br />
in temperature is slight. An early <strong>and</strong> successful forecasting system for bacterial<br />
wilt or Stewart's disease of corn caused by Enuinia stetuartii in the north-eastern<br />
USA was based on monitoring temperature during three critical months. The<br />
temperature affected overwintering of the vector of the bacterium which in turn<br />
controlled the amount of initial infection. This method has since been developed<br />
into a local, computer based forecasting system.<br />
Many disease forecasting systems involve monitoring moisture in the form of<br />
leaf wetness, or the more commonly measured factors such as rainfall, dew <strong>and</strong><br />
relative humidity that affect leaf wetness. Sometimes these factors are combined<br />
with measurements of temperature. A long-st<strong>and</strong>ing forecasting system for apple<br />
scab caused by Venturia inaequaLis involved predictions of 'Mills periods' (see<br />
Chapter 18) favourable for infection, based on continuous monitoring of hours of<br />
leaf wetness <strong>and</strong> temperature. The method has been successfully used to time<br />
the application of preventative sprays. A potato late blight forecasting system in<br />
Maine, USA, predicted a blight epidemic I or 2 weeks after a period of 1O<br />
consecutive days of temperatures <strong>and</strong> rainfall favourable for infection <strong>and</strong> with<br />
continued favourable conditions forecast. It was considered that this forecasting<br />
system would have been more accurate if it had included an allowance for the<br />
amount of initial inoculum.<br />
An early forecasting system for late blight of potato in the Netherl<strong>and</strong>s relied<br />
upon the so-called 'Four Dutch Rules'which combined the following criteria for<br />
temperature, leaf wetness, cloudiness <strong>and</strong> rainfall:<br />
. Night temperatures must be no lower than lO'C.<br />
. Leaves must remain wet for at least 4 hours on a day following night dew.<br />
. The day following a night dew must remain cloudy with no less than BOo/o of<br />
the sky covered by cloud.<br />
. During periods of the above weather patterns there must be at least O.1 mm of<br />
rain.<br />
Forecasting schemes developed from this early Dutch system relied on the<br />
more detailed prediction of a 'critical period' of weather conducive to sporulation,<br />
dispersal <strong>and</strong> infection by the pathogen. The following weather variables were<br />
monitored:<br />
. the saturation deficit between 3 <strong>and</strong> 6 a.m., which influences the likelihood of<br />
dew, which in turn determines the amount of sporulation;<br />
. the duration of bright sunshine before noon, which determines the maturation<br />
of the newly formed spores;<br />
. the amount of precipitation (including rainfall, dnzzle <strong>and</strong> fog) between 9 a.m.<br />
<strong>and</strong> 6 p.m., which determines the amount of infection of the crop.<br />
Thus the weather pattern leading to infection was a leaf wetness period of at least<br />
13 hours with a total duration of daily sunshine of less than 2 hours. Symptoms<br />
appeared 3 or 4 days after such a weather pattern. If several such days occurred<br />
in succession, a major blight epidemic was predicted. Synoptic weather<br />
forecasting charts were used to predict the occurrence of such weather patterns<br />
<strong>and</strong> issue warnings of the occurrence of 'critical periods' 8-f B hours in advance,<br />
enabling farmers to spray with fungicides to negate the predicted infections. A<br />
similar warning system based on prediction of the meteorological conditions<br />
necessary for sporulation, spore germination <strong>and</strong> infection has been applied<br />
successfully to downy mildew of grapes <strong>and</strong> tobacco in several countries,<br />
enabling a reduction in the number of sprays necessary for disease control.<br />
A similar concept of 'critical periods' ('Beaumont periods' or 'Smith periods')<br />
based on relative humidity <strong>and</strong> temperature was developed for forecasting potato<br />
late blight in the United Kingdom. A 'Beaumont period' is a period of 2 days with<br />
a temperature not less than lO'C <strong>and</strong> a relative humidity of 75o/o or above. BliSht
19. Prediction oJ di.sease outbreaks<br />
305<br />
is predicted to occur lO days after such a period. Alternatively, predictions are<br />
based on 'Smith periods' in which a relative humidity of at least 9Oo/o for at least<br />
I I hours on two consecutive days, with a temperature not less than lO'C, is used<br />
to predict disease outbreak. There are variations of these predictors in different<br />
countries, but the common element is their attempt to predict weather conditions<br />
which give a leaf wetness period of about 15 hours, sufficient to allow the spores<br />
to germinate <strong>and</strong> infect the plant. The secondary spread of infection from spores<br />
formed within the crop requires less free water because the spores are more<br />
turgid (they have not become desiccated while being carried long distances in the<br />
atmosphere). With growth of the crop, the relative humidity within the foliage is<br />
often higher than that above the crop, where monitoring is often conducted. The<br />
susceptibility of potato plants also varies with their growth stage <strong>and</strong> this must<br />
be taken into account in forecasting systems. Potato plants are not as susceptible<br />
to infection early in their development as later <strong>and</strong> so 'Beaumont periods'predict<br />
infection only after a certain date or stage of plant development. Meteorological<br />
data useful for disease forecasting is collected at weather monitoring stations<br />
throughout the country <strong>and</strong> collated by the government meteorological office. To<br />
this has been added local monitoring equipment in important potato growing<br />
areas.<br />
A useful mechanical, self-calculating blight forecaster (the 'Auchincruive'<br />
potato blight forecast recorder) was developed in Scotl<strong>and</strong>. It consists of wet <strong>and</strong><br />
dry bulb thermometers that record temperature via inked pens on paper on a<br />
revolving drum, as in the traditional thermohygrograph. The dry bulb recorder<br />
operates in the normal way, but the wet bulb recorder is adjusted to record above<br />
the dry bulb recorder only at relative humidities of 75o/o or above. The instrument<br />
is set in a normal Stephenson screen as used at weather stations. A'Beaumont<br />
period' has occurred when the dry bulb temperature is above lO'C <strong>and</strong> the<br />
recorded wet bulb temperature is higher than the dry bulb temperature for 48<br />
hours or more. The use of methods involving prediction of critical periods have<br />
resulted in accurate forecasting of blight in most years, but the use of the<br />
'Auchincruive'<br />
recorder demonstrated the greater accuracy of disease predictions<br />
based on weather observations made as close as possible to the cropping area.<br />
Protective spraying in response to these forecasts gave better blight control than<br />
spraying at any other time.<br />
It is now possible to develop self-calculating disease forecasting equipment<br />
based on electronic weather monitoring devices, electronic data loggers <strong>and</strong><br />
computers, <strong>and</strong> several of these are available commercially for particular<br />
diseases. A system called 'BLITECAST', based on data collected by electronic<br />
weather monitors in farmers' fields, is now widely used for predicting late blight<br />
in the United States.<br />
Much effort has been put into monitoring <strong>and</strong> forecasting leaf <strong>and</strong> stem rust of<br />
wheat in North America. Current schemes use both weather <strong>and</strong> inoculum data<br />
for computer based calculations of multiple regressions. Spraying to control<br />
cereal rusts is economic only in severe rust years <strong>and</strong> so prediction of these in<br />
time to allow effective protective spraying is critical. A similar scheme has been<br />
developed in Brazil for coffee rust, which can be economically controlled with<br />
welltimed sprays.<br />
In Australia, forecasting systems for apple scab have been operating since the<br />
195Os. In the early l97Os, a system for managing brown rot of stone fruit was<br />
introduced in New South Wales. Brown rot warnings are issued during the<br />
harvest period of canning peaches when fruit remains wet for 1O hours or more.<br />
During the 198Os, a computerised system was introduced in New South Wales for<br />
the control of rrst (TranzscheLia discoLor) of French prunes. A forecasting system
306 ALLen <strong>Kerr</strong> <strong>and</strong> <strong>Philip</strong> <strong>Keane</strong><br />
has also been developed for downy mildew (Ptasmopara uiticoLa) on grapes based<br />
on the lO: lO:24 rule. In other words, a temperature of at least lO'C while at least<br />
lO mm of rain falls in a 24 hour period on wet, chemically unprotected foliage will<br />
result in disease development. Another forecasting system has been developed for<br />
downy mildew (Peronospora destructor) on onions in the Lockyer Valley to the<br />
west of Brisbane, Queensl<strong>and</strong> based on a Canadian downy mildew forecast model<br />
'DOWNCAST.' Outbreaks of the disease are likely from July to mid-September<br />
(winter to early spring) when pre-dawn relative humidity is greater than 95olo <strong>and</strong>,<br />
most critically, dew remains on plants until 10 a.m.<br />
Monitoring inoculum<br />
Some disease forecasting methods are based solely on monitoring the level of<br />
inoculum, often in the form of the amount of disease already present. This<br />
approach is unlikely to be effective for diseases such as potato late blight <strong>and</strong><br />
grape downy mildew that can develop explosively under favourable weather<br />
conditions. By the time predictions based on disease progress are made, it is<br />
likely to be too late to act effectively. However, methods based on inoculum<br />
monitoring can be effective when disease is developing steadily under relatively<br />
uniform or predictable weather conditions <strong>and</strong> the aim is to predict whether the<br />
disease is likely to progress above a certain threshold at which control measures<br />
become economic. For example, outbreaks of rice panicle blast caused by<br />
Pgricutaria oryzde are predicted by monitoring the numbers of spikelets infected<br />
throughout inflorescence development. With powdery mildew (UncinuLa necator)<br />
on grapevines, potential yield loss is related to when the disease first appears in<br />
vineyards. Where there is a high risk of disease carryring over from the previous<br />
season, three sprays early in the season (2, 4 <strong>and</strong> 6 weeks after budburst) are<br />
recommended, followed by further checks for disease <strong>and</strong> the application of<br />
additional fungicide sprays if necessary (Fig. 28.6). If there is low risk of carryover<br />
of inoculum from the previous season, early sprays are unnecessary.<br />
Trapping urediniospores of wheat stem rust on Vaseline-coated slides or glass<br />
rods has long been used to monitor the amount of inoculum in a locality for<br />
prediction of epidemics. Much effort has been put into the development of<br />
mechanical methods of continuously recording spore concentrations in the<br />
atmosphere. The 'Burkard' spore trap (Fig. t9.I) has a small electrically operated<br />
vacuum pump that draws air through a narrow slit onto a clear sticky tape<br />
around a drum which rotates once a week. A wind vane ensures that the slit is<br />
always facing up wind. Spores impact onto the tape, which is removed weekly,<br />
cut into day-long sections <strong>and</strong> examined under a microscope for the presence of<br />
spores. Rotary rod spore samplers consist of a U-shaped metal rod that is rotated<br />
by a small electric motor (Fig. I9.2). The leading edges of the rod are covered with<br />
a thin strip of clear tape coated with an adhesive. Spores impact on the strips of<br />
tape, which can be removed for counting of spores under a microscope. These<br />
spore samplers are smaller <strong>and</strong> much cheaper than the'Burkard'trap <strong>and</strong> can be<br />
made from readily available components such as small electric motors.<br />
To monitor the spore load in the air a spore sampler has been constructed with<br />
sticlqy slides placed behind a slit in a chamber placed on the roof of a car. The car<br />
is driven through the area of interest. For some diseases it is important to<br />
monitor the proportion of particular pathotypes in the atmosphere as a means of<br />
predicting the breakdown of resistance <strong>and</strong> the likelihood of a disease outbreak.<br />
In Europe this was done for powdery mildew of wheat (Btumeria gramtnis) by<br />
exposing leaves of a range of differential cultivars in a Petri dish placed behind<br />
the slit in a spore collector attached to a car roof. The car was driven for a certain
19. Prediction of disease outbreaks 307<br />
distance through the region of interest before the Petri dishes containing the<br />
leaves were removed <strong>and</strong> incubated to determine which cultivars became<br />
infected.<br />
Figure 19.1 Photograph of a Burkard spore trap showing air pump in the base, wind<br />
vane that keeps air inlet facing into the wind, air inlet, <strong>and</strong> rotating drum<br />
bearing sticky tape partly removed from its chamber.<br />
Trapping vectors of viruses can be useful in predicting the occurrence of virrs<br />
diseases. For example, yellow painted pans have been used to trap aphids to<br />
provide early warning of outbreaks of aphid-borne virus diseases.<br />
Estimation of populations of soil-borne pathogens is often important in<br />
predicting the likelihood of outbreaks of soil-borne diseases. For macroscopic<br />
propagules such as sclerotia of Sclerotinia scLerotiorum, S. minor or Sclerotium<br />
roLJstt, this involves sieving weighed samples of soils using sieves with particular<br />
mesh sizes <strong>and</strong> counting the recovered sclerotia. Techniques have been developed<br />
for isolating <strong>and</strong> counting nematodes from soil samples. The st<strong>and</strong>ard method<br />
involves placing the sample in a tissue paper in a funnel (a Baermann funnel)<br />
with a stoppered plastic tube attached to the outlet. The sample is covered with<br />
water <strong>and</strong> any active nematodes will eventually work their way to the base of the<br />
funnel, from where they can be drained off into a Petri dish for counting under a<br />
stereomicroscope. For microscopic propagules, soil samples are sequentially<br />
diluted with soil or water to give a dilution series that can be plated onto a<br />
medium selective for the pathogen of interest. Usually various antibiotics,<br />
fungicides <strong>and</strong> dyes are added to the medium to suppress growth of saprophytic<br />
bacteria <strong>and</strong> fungi, while allowing growth of the pathogen. Most of these methods<br />
are tedious <strong>and</strong> time consuming. Immunological <strong>and</strong> DNA hybridisation assays
ALLen <strong>Kerr</strong> <strong>and</strong> <strong>Philip</strong> <strong>Keane</strong><br />
specific for certain pathogens are being developed to facilitate the detection <strong>and</strong><br />
quantification of soil-borne pathogens (see Chapter I1).<br />
Figure 19.2 Photograph of a rotary rod spore trap showing brass rods attached to an<br />
electric motor in a plastic housing, with a cap to protect the trap from rain.<br />
(Equipment courtesy of Dr T. V. Price, School of Agriculture, La Trobe<br />
Universitv.)<br />
Trap or test plots<br />
Test or trap plots of crops, particularly of susceptible cultivars, planted<br />
throughout a cropping area have been used to give early warning of the arrival in<br />
an area of vectors of virus diseases or inoculum of fungal diseases. In some<br />
cases, inoculation of test plots with the pathogen has been used to give early<br />
warning of the occurrence of environmental conditions favourable for disease.<br />
Test plots have been used for many years in the wheat belt of North America to<br />
predict the severity of rust epidemics. Sowing selected resistant cultivars has also<br />
enabled monitoring of changes in the pathotype composition of the rust<br />
population that could lead to breakdown of resistance. Test plots have also<br />
proved invaluable for monitoring the occurrence of minor diseases on new<br />
cultivars. Regional wheat test plots of the International Wheat <strong>and</strong> Maize<br />
Improvement Centre (CIMMYT) have been used to monitor <strong>and</strong> predict disease<br />
occurrence, as well as to test new cultivars.
Crop <strong>and</strong> site factors<br />
19. Predtctton oJ disease outbreaks 309<br />
Some systems of disease forecasting combine weather <strong>and</strong> disease (inoculum)<br />
monitoring with other factors with a bearing on disease such as the susceptibility<br />
of the crop, soil type <strong>and</strong> fertility, topography, crop rotation, planting date <strong>and</strong><br />
amount of irrigation. Many of these factors are taken into consideration in<br />
warning systems for eyespot lodging of wheat caused by PseudocercosporetLa<br />
herpotrichoide s in Europe.<br />
Communication of predictions <strong>and</strong> warnings to farmers<br />
Predictions of disease outbreaks <strong>and</strong> the need for spraying have to be<br />
communicated rapidly to farmers. The means of doing so have changed with<br />
communication technologr. An early form of warning was the ringing of church<br />
bells, as once practised in northern Italy to warn farmers to spray their vines<br />
against downy mildew. Commonly, general warnings have been broadcast on the<br />
radio. More specific warnings can be transmitted to a group of farmers by<br />
telephone or, more recently, by modem from a central computer. Other warning<br />
systems involve monitoring <strong>and</strong> calculations by the individual farmers or groups<br />
of farmers themselves, thus eliminating the communication problem. In some<br />
forecasting systems, the farmer allocates a certain number of points for site, crop,<br />
initial disease <strong>and</strong> weather factors. Accumulation of a critical number of points<br />
by a certain date or stage of crop development indicates the need for control<br />
measures.<br />
A recent advance is the development of monitoring <strong>and</strong> predictive systems for<br />
all the major pests <strong>and</strong> diseases of a particular crop. A system called 'EPIPRE',<br />
based on monitoring by farmers of their local site, crop <strong>and</strong> disease factors, has<br />
been developed for six fungal diseases <strong>and</strong> all aphid pests of wheat in Europe.<br />
Grape researchers are developing a computerised decision support system,<br />
AusVit, for managing pests, diseases, irrigation <strong>and</strong> nutrition of plants in<br />
Australian vineyards. An advantage of schemes like this is their capacity to<br />
educate <strong>and</strong> empower farmers to make decisions.<br />
19.6 Development<br />
of a method for forecasting<br />
tea blister blight in Sri Lanka<br />
The process of developing a successful practical method of disease forecasting,<br />
based on an empirical approach using available weather data, knowledge of the<br />
biology of the disease <strong>and</strong> monitoring equipment can be illustrated using tea<br />
blister blight in Sri Lanka. Tea blister blight caused by the fungus Exobasidtum<br />
Dexans is a major disease of tea in Sri Lanka <strong>and</strong> elsewhere. The four practical<br />
criteria for successful disease forecasting discussed above are satisfied, as<br />
follows:<br />
. The disease is economically important. In fact when it was first found in Sri<br />
Lanka in 1946, there were fears that it might destroy the tea industry, as<br />
coffee rust had wiped out the coffee industry at the end of the previous<br />
century. Also, it was established that 350/o infection or higher caused<br />
significant economic loss.<br />
o Routine control measures are wasteful. The only method of controlling the<br />
disease is by regularly applying expensive fungicidal sprays.<br />
o Efficient control measures are available. Although expensive, spraying with<br />
copper- or nickel-based fungicides is an efficient method of disease control if<br />
correctly timed.<br />
o Disease incidence varies considerably from season to season <strong>and</strong> from year to<br />
year. Sri Lanka experiences two monsoons, the south-west monsoon from May<br />
to July <strong>and</strong> the north-east monsoon from September to November. Blister
310 ALLen <strong>Kerr</strong> <strong>and</strong> <strong>Philip</strong> <strong>Keane</strong><br />
blight is important during these periods, but the monsoons vary considerably<br />
from year to year <strong>and</strong> so does the incidence of blister blight.<br />
The next step in developing a disease forecasting method was to decide which<br />
meteorological <strong>and</strong> biological factors could be used to predict disease incidence.<br />
Tea is an evergreen perennial crop maintained in the vegetative state <strong>and</strong> pruned<br />
once every four years or so. This means that there is no marked change in<br />
susceptibility from season to season as occurs with most crops. Only young<br />
leaves are susceptible to blister blight <strong>and</strong> tea is pruned <strong>and</strong> trained in such a<br />
way that all the young leaves are confined to the top of the bush where they are<br />
exposed to the atmosphere. As a result, there is no complication of a<br />
micro-environment. Normal, atmospheric weather data is directly relevant to<br />
disease development. As temperature is relatively uniform throughout the year, it<br />
did not seem likely that this would be an important factor. By far the most<br />
important meteorological factor seemed to be moisture. In fact, previous work<br />
both in Sri Lanka <strong>and</strong> Indonesia had shown this to be so. What form of<br />
moisture-rainfall, relative humidity, duration of leaf wetness? Duration of leaf<br />
wetness seemed the most likely because this determines the ability of fungal<br />
spores to germinate <strong>and</strong> infect a leaf. However, the correlation between duration<br />
of leaf wetness <strong>and</strong> disease incidence 3 weeks later (it takes 3 weeks for blisters<br />
to develop) was not good (Fig. I9.3). This indicates that some other factor(s) must<br />
be important. The most likely factor seemed to be the number of spores of<br />
E. uexans.<br />
Disease<br />
incidence<br />
Duration of leaf wetness<br />
Figure 19.3 Graph showing relationship between disease incidence <strong>and</strong> duration of leaf<br />
wetness (diagrammatic).<br />
Fortunately, records of spore numbers in the air had been kept at the Tea<br />
Research Institute, Sri Lanka for several years. When these data were examined,<br />
it was noticed that when disease incidence was much higher than expected (Fig.<br />
19. 3), spore numbers were also very high. When disease incidence was much<br />
lower than expected, spore numbers were very low. To predict disease, the<br />
following multiple regression equation was developed.<br />
! = a+b1xr+b2x2<br />
whereY = disease incidence,<br />
X1 = duration of leaf wetness,<br />
x2 = number of spores per litre of air<br />
a, b' <strong>and</strong> b2 are constants.<br />
This equation gave a very accurate prediction of disease incidence. However, it<br />
was of little practical value because tea estates do not have equipment to
19. Predictton oJ disease outbreaks 3ll<br />
measure the duration of leaf wetness or numbers of spores. Furthermore, disease<br />
forecasts issued by the Tea Research Institute would be of little value because in<br />
Sri Lanka weather varies considerably over relatively short distances. So an<br />
attempt was made to develop a forecasting system that could be used by<br />
individual tea estates.<br />
Measuring the duration of leaf wetness was not a serious problem because leaf<br />
wetness has a strong negative correlation with duration of sunshine. As all tea<br />
estates have sunshine recorders, sunshine data could be used instead of leaf<br />
wetness data.<br />
Spore numbers caused some problems. It had been assumed that they would<br />
be simply <strong>and</strong> directly related to the number of blisters per unit area of crop.<br />
Surprisingly, this was not the case. Figure 19.4 shows that the peak in spore<br />
production occurs ahead of the peak in disease incidence. The reason for this was<br />
not understood at the time of the investigation but is almost certainly related to<br />
the age distribution of the pustules. When a population, even a human<br />
population, is increasing rapidly there is a high proportion of young actively<br />
reproducing individuals in the population. When a population is declining, it<br />
contains a high proportion of older, non-reproductive individuals. With blister<br />
blight, young pustules sporulate much more profusely than old pustules. This<br />
almost certainly explains the data in Figure 19.4. If the rate of disease increase is<br />
measured, it can be used as another variable in a multiple regression equation.<br />
p 500<br />
'E .too<br />
=<br />
7<br />
! loo<br />
Er*<br />
100<br />
H Blistersiunit<br />
H Spores<br />
Apr. M.I Junc<br />
July Aug. Sepr. Oct.<br />
r96+<br />
Nov. Dcc.<br />
Figure 19.4 The relationship betweeir the number of spores in the atmosphere <strong>and</strong> the<br />
number of blisters per unit area of tea leaves. (From <strong>Kerr</strong> <strong>and</strong><br />
Shanmuganathan, 1966.)<br />
How can a tea estate measure disease incidence <strong>and</strong> rate of increase of<br />
disease? As mentioned previously, blister blight affects only young leaves <strong>and</strong> the<br />
young leaves are harvested every week. Growers can easily obtain an estimate of<br />
disease incidence by taking a sample of harvested leaves <strong>and</strong> calculating the<br />
percentage of leaves which have biisters. The rate of increase can be obtained by<br />
comparing disease incidence today (t2) with what it was previously (tr). Thus all<br />
the factors needed to forecast disease incidence can be readily measured on any<br />
tea estate. The final multiple regression equation developed for disease<br />
forecasting was<br />
20<br />
16 -c<br />
x<br />
12-<br />
R :<br />
ag<br />
o<br />
4o
312 Allen <strong>Kerr</strong> <strong>and</strong> Philtp <strong>Keane</strong><br />
Y=3+b1x1 +b2x2-b#.<br />
where Y = pr.diJteg itsg3se incidence at time t, + 3 weeks,<br />
Xr = log r/ (o/o infection) at time t2,<br />
x2 -<br />
Ilog.l(oZo infection) at time t2l - fiog ./(%fficfion]-at time t1l,<br />
tz-tt=3weeks,<br />
X3 = mean daily sunshine,<br />
a, b 1, b2 <strong>and</strong> b3 are constants.<br />
Values were calculated for all the constants <strong>and</strong> the equation was used to predict<br />
the degree of infection over 3 years. Both predicted <strong>and</strong> measured infection are<br />
shown for these 3 years in Figure I9.5.<br />
c7o<br />
o<br />
Eoo<br />
c<br />
.5 s0<br />
1,<br />
B'to<br />
E,o<br />
dzo<br />
F-. l"leasured infecrion<br />
o< Predicred infecrion<br />
l'1.)r June July Aut. Sept. Ocr. Nov. Dec.<br />
Figue 19.5 Predicted <strong>and</strong> measured incidence of tea blister blight on tea estates, 1964-<br />
1966 (3-week running means). (From <strong>Kerr</strong> <strong>and</strong> Rodrigo, 1967.)<br />
To simplify arithmetic calculations, a simple calculating device was<br />
constructed (Fig. 19.6) which represents the multiple regression equation above.<br />
To forecast disease incidence 2-3 weeks later, the current level of infection on tea<br />
leaves brought to the factory is measured <strong>and</strong> the mean daily sunshine for the<br />
previous 7 days calculated. The inner disk is moved until O.3o/o infection on it<br />
coincides ttnth 22o/o infection on the outer disc. The pointer is then moved until it<br />
points to the current level of infection on the inner disk. The corresponding<br />
infection on the outside is noted, <strong>and</strong> the inner disk <strong>and</strong> pointer moved until
19. Prediction oJ disease outbreaks 313<br />
percentage infection measured 3 weeks previously coincides with this point (this<br />
procedure measures rate of increase of disease). The pointer is held steady <strong>and</strong><br />
the inner disk moved until nil hours of sunshine coincides with the pointer. If the<br />
pointer is now moved to coincide with the mean daily sunshine over the previous<br />
week, it will indicate the disease forecast on the outside.<br />
Figure 19.6 Calculating device for forecasting tea blister blight. For details of its<br />
operation, see text. (From <strong>Kerr</strong> <strong>and</strong> Rodrigo, 1967.)<br />
What does one do when the forecast has been made? If the predicted disease<br />
incidence is less than 35o/o, nothing need be done because no significant<br />
economic damage will result. If the predicted disease incidence is more than 35%,<br />
then sprays are needed. As infection has already occurred, an eradicant spray<br />
such as nickel chloride is necessary.<br />
The method of forecasting for blister blight is given in detail to explain how to<br />
develop a disease forecasting system. Detaiis willvary with different diseases, but<br />
the principles will be the same. Nowadays, the calculations could be done easily<br />
on a programmable calculator or computer. One basic requirement is that data<br />
must be available to work with. In other words, extensive data on disease<br />
incidence <strong>and</strong> weather is needed before disease forecasting can be contemplated.<br />
19.7 Further reading<br />
'ffi'"':<br />
'\a<br />
a'<br />
Coakley, S.M. (1988). Variation in climate <strong>and</strong> prediction of disease in plants. Annuc.|<br />
Reuietu oJPhgtopathologg 26, 163-f 8f .<br />
Grainger, J. (1955). The'Auchincruive'potato blight forecast recorder. Weather 10, 213-<br />
222.<br />
Hau, B. (1990). Analy'tic models of plant disease in a changing environment. Annual<br />
Reuiew oJ Phgtopathologg<br />
2a, 22 L-245.
314 Allen <strong>Kerr</strong> <strong>and</strong> Philto <strong>Keane</strong><br />
Kable, P.F., Magarey, P.A. <strong>and</strong> Emmett, R.W. (1990). Computerised disease management<br />
systems in viticulture. The Australian <strong>and</strong> Netu kal.<strong>and</strong> Wine Industry Journal 5,<br />
22t-223.<br />
<strong>Kerr</strong>, A. <strong>and</strong> Rodrigo, W.R.F. (1967). Epidemiology of tea blister blight (Exobasidium<br />
uexans) IV. Disease forecasting. Transacttons oJ the Brttish MgcoLogtcal Soctetg 50,<br />
609-614.<br />
<strong>Kerr</strong>, A. <strong>and</strong> Shanmuganathan, N. (1966). Epidemiologr of tea blister blight (Exobasidium<br />
uexans) I. Sporulation. Transacttons oJ the Brttish Mgcologicat Societg 49, 139-145.<br />
Ilranz, J. (ed.) (1974). Eptdemics oJplant diseases: mathematicalanalgsis <strong>and</strong>modelltng.<br />
Ecological. studres 13 Chapman <strong>and</strong> Hall, London.<br />
Kranz, J. <strong>and</strong> Hau, B. (1980). Systems analysis in epidemiology. Annuo.l Reuieu oJ<br />
Phgtopathologg 18, 67-83.<br />
Krause, R.A. <strong>and</strong> Massie, L.B. (1975). Predictive systems: modern approaches to disease<br />
control. Annual. Reuiew oJ Phgtopathologg 13, 3l-47.<br />
Kushalappa, A.C., Akutsu, M. <strong>and</strong> Ludwig, A. (1983). Application of survival ratio for<br />
monocyclic process of Hemtteia uastatrix in predicting coffee rust infection rates.<br />
Phgtopathologg 73, 96- I 03.<br />
Madden, L.V. <strong>and</strong> Ellis, M.A. (1988). How to develop disease forecasters, in J. Kranz <strong>and</strong><br />
J. Rotem (eds), ^O;qrertmental. techniques in plant disease epidemiologu, pp. 191-208.<br />
Springer-Verlag, Berlin.<br />
Miller, P.R. <strong>and</strong> O'Brien, M. (1952). Plant disease forecasting. BotanicalReuieu.rc 18,547-<br />
601.<br />
Sasaki, T. <strong>and</strong> Kato, H. (1972). A statistical method of predicting outbreaks of rice panicle<br />
blast. Phgtopathologg 62, 1126-1132.<br />
Sutton, J.C., Gillespie, T.J. <strong>and</strong> James, T.D.W. (1988). Electronic monitoring <strong>and</strong> use of<br />
microprocessors in the field, in J.Ii.lranz <strong>and</strong> J. Rotem (eds), E-rqrerimentaltechniques<br />
tn plant disease epidemiologu, pp. 99-1f 3. Springer-Verlag, Berlin.<br />
Teng, P.S. (1985). A comparison of simulation approaches to epidemic.modelling. Annual<br />
Reuietu of Phytopathologg 23, 351-379.<br />
Van der Plank, J.E. (1963). Ptant diseases: epidemics <strong>and</strong>control. Academic Press, New<br />
York.<br />
Waggoner, P.E. (1981). Models of plant disease. Bioscience 31, 315-319.<br />
Waggoner, P.E. <strong>and</strong> Horsfall, J.G. (1969). EPIDEM A simulator of plant disease written for<br />
a computer. Bultetin oJ the Connecticut Agrtcultural Experiment Statton No. 698.<br />
Waggoner, P.8., Horsfall, J.G. <strong>and</strong> Lukens, R.J. (1972). EPIMAY A simulator of southern<br />
corn leaf blight. Bulletin oJ the Connecticut Agrtcultural Expertment Station No. 729.<br />
84 pp.<br />
Wheeler, B.E.J. (1969). An tntroductton to plant di-seases. John Wiley <strong>and</strong> Sons, London<br />
<strong>and</strong> New York.<br />
Young, H.C., Prescott, J.M. <strong>and</strong> Saari, E.E. (1978). Role of disease monitoring in<br />
preventing epidemics. Annual Reuietu oJPhgtopathotogg L6, 263-285.<br />
Zadoks, J C. <strong>and</strong> Schein, R.D. (1979). Epid.emiologg <strong>and</strong> plant disease management.<br />
Oxford University Press, Oxford <strong>and</strong> New York.<br />
Zadoks, J.C. (1984). A quarter century of disease warning, 1958-1983. Plant Disease 68,<br />
352-355.


![[Compatibility Mode].pdf](https://img.yumpu.com/27318716/1/190x135/compatibility-modepdf.jpg?quality=85)