ACKNOWLEDGEMENTS
erau-suas-consumer-guide-june-2016-release
erau-suas-consumer-guide-june-2016-release

Create successful ePaper yourself
Turn your PDF publications into a flip-book with our unique Google optimized e-Paper software.
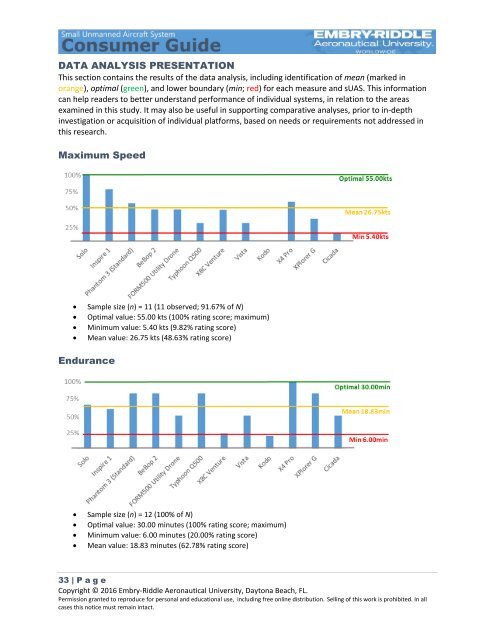
DATA ANALYSIS PRESENTATION<br />
This section contains the results of the data analysis, including identification of mean (marked in<br />
orange), optimal (green), and lower boundary (min; red) for each measure and sUAS. This information<br />
can help readers to better understand performance of individual systems, in relation to the areas<br />
examined in this study. It may also be useful in supporting comparative analyses, prior to in-depth<br />
investigation or acquisition of individual platforms, based on needs or requirements not addressed in<br />
this research.<br />
Maximum Speed<br />
Sample size (n) = 11 (11 observed; 91.67% of N)<br />
Optimal value: 55.00 kts (100% rating score; maximum)<br />
Minimum value: 5.40 kts (9.82% rating score)<br />
Mean value: 26.75 kts (48.63% rating score)<br />
Endurance<br />
Sample size (n) = 12 (100% of N)<br />
Optimal value: 30.00 minutes (100% rating score; maximum)<br />
Minimum value: 6.00 minutes (20.00% rating score)<br />
Mean value: 18.83 minutes (62.78% rating score)<br />
33 | P a g e<br />
Copyright © 2016 Embry-Riddle Aeronautical University, Daytona Beach, FL.<br />
Permission granted to reproduce for personal and educational use, including free online distribution. Selling of this work is prohibited. In all<br />
cases this notice must remain intact.