FINE Distributor Report
“Getting it There: The Role of New England Food Distributors in Providing Local Food to Institutions” presents in-depth findings and makes specific, data-based recommendations for food distributors (including food hubs) as well as government officials, funders and institutions. The report is based on an original survey answered by over 60 food distributors across New England in the spring of 2015.
“Getting it There: The Role of New England Food Distributors in Providing Local Food to Institutions” presents in-depth findings and makes specific, data-based recommendations for food distributors (including food hubs) as well as government officials, funders and institutions. The report is based on an original survey answered by over 60 food distributors across New England in the spring of 2015.

You also want an ePaper? Increase the reach of your titles
YUMPU automatically turns print PDFs into web optimized ePapers that Google loves.
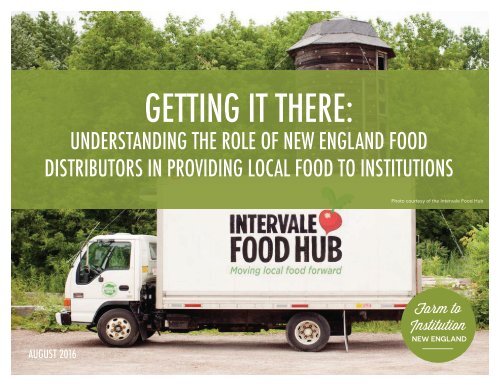
GETTING IT THERE:<br />
UNDERSTANDING THE ROLE OF NEW ENGLAND FOOD<br />
DISTRIBUTORS IN PROVIDING LOCAL FOOD TO INSTITUTIONS<br />
Photo courtesy of the Intervale Food Hub<br />
AUGUST 2016<br />
Farm to<br />
Institution<br />
NEW ENGLAND
ACKNOWLEDGEMENTS<br />
ABOUT THE NEW ENGLAND FARM TO<br />
INSTITUTION METRICS PROJECT<br />
Farm to Institution New England is a six-state network of<br />
nonprofit, public, and private entities working collaboratively<br />
to achieve a mission of strengthening the food system by<br />
increasing the amount of New England-grown and processed<br />
food served in our region’s institutions.<br />
Since its inception, <strong>FINE</strong> has focused on developing crosssector<br />
connections between K-12 schools, colleges and<br />
universities, hospitals, and other institutions. Today, <strong>FINE</strong><br />
serves those at the forefront of the farm to institution<br />
movement in the region, providing a forum to connect and<br />
share ideas, models, resources, and support. <strong>FINE</strong> leads<br />
projects related to key issues identified by farm to institution<br />
leaders and acts as the backbone organization for farm to<br />
institution work in the region: we build the network, convene<br />
stakeholders, develop and disseminate tools and resources,<br />
and communicate with key external audiences.<br />
Additional information on the New England Farm to Institution<br />
Metrics Project can be found online at<br />
www.farmtoinstitution.org/metrics.<br />
The New England Farm to Institution Metrics Project is funded<br />
by the Henry P. Kendall Foundation and The John Merck Fund.<br />
ADVISORS<br />
Molly Anderson, Middlebury College<br />
Courtney Bourns, Henry P. Kendall Foundation<br />
Cris Coffin, Land for Good<br />
Jillann Fitzsimmons, UMass Amherst<br />
Gemma Gorham, Brown University<br />
Christine James, John Merck Fund<br />
Dawn King, Brown University<br />
Jiff Martin, University of Connecticut Extension<br />
Riley Neugebauer, Farm to Institution New England<br />
Jeff Piestrak, Cornell University<br />
PROJECT TEAM<br />
Nessa Richman, Metrics Project Coordinator<br />
Thai Ha-Ngoc, Metrics Project Researcher (Author)<br />
Lydia Oberholtzer, Metrics Project Research Consultant<br />
Jennifer Obadia, Metrics Project Special Research Advisor<br />
Kaitlin Haskins, <strong>FINE</strong> Communications Coordinator<br />
▪Peter Allison, <strong>FINE</strong> Network Director<br />
To learn more about Farm to Institution New England, visit<br />
www.farmtoinstitution.org<br />
FUNDERS<br />
GETTING IT THERE: UNDERSTANDING THE ROLE OF NEW ENGLAND FOOD DISTRIBUTORS IN PROVIDING LOCAL FOOD TO INSTITUTIONS PAGE 2
EXECUTIVE SUMMARY<br />
Bringing healthy, locally produced<br />
food into institutions is an effective<br />
strategy to address social, economic,<br />
and environmental issues. Existing<br />
research suggests that farm to<br />
institution strategies may improve<br />
nutrition for students and patients,<br />
while also supporting local food<br />
producers. However, not much work<br />
is being done to track the progress of<br />
farm to institution strategies on local,<br />
state, or regional levels. This report<br />
summarizes the results of a 2015<br />
New England-wide survey of food<br />
distributors designed to explore their<br />
perspectives on institutional demand<br />
for local products and identify the<br />
challenges and opportunities they face<br />
in serving this segment of the food<br />
market.<br />
The results of this survey show<br />
that responding New England food<br />
distributors play a significant role in<br />
how people eat both in and outside<br />
of institutional dining facilities. These<br />
respondents moved over a billion<br />
dollars worth of food in 2014. While the<br />
proportion of institutional sales to total<br />
sales varies widely between individual<br />
distributors, larger food distributors<br />
generally see institutions as a more<br />
integral part of their businesses.<br />
All survey respondents who serve<br />
institutions offer local products, but<br />
vary in their definition of local. Local<br />
product sales usually represent a high<br />
proportion of gross sales in smaller<br />
food distributors. Local sales in relation<br />
to gross sales declined as gross sales<br />
increased.<br />
New England food distributors<br />
generally serve a large number and<br />
variety of institutional clients, while<br />
procuring local products from many<br />
sources including individual producers,<br />
producer cooperatives, and local<br />
value-added processors.<br />
Overall, survey respondents have<br />
an overwhelmingly positive outlook<br />
on future sales of local products to<br />
institutions, suggesting that institutions<br />
will continue to grow and strengthen<br />
their farm to institution strategies<br />
in the coming years. However, the<br />
distributors reported several key<br />
challenges and barriers to selling local<br />
products to institutions, including the<br />
lack of consistent, year-round supply of<br />
local products and the high price point<br />
of local products for their customers.<br />
The report concludes with<br />
recommendations for food distributors,<br />
government officials, funders and<br />
non-profits, and institutions to further<br />
farm to institution strategies in New<br />
England.<br />
Photo by A. Perry Heller at Black River Produce<br />
GETTING IT THERE: UNDERSTANDING THE ROLE OF NEW ENGLAND FOOD DISTRIBUTORS IN PROVIDING LOCAL FOOD TO INSTITUTIONS PAGE 3
INTRODUCTION<br />
K-12 schools, colleges, and hospitals<br />
play a central role in the well-being<br />
of their communities, providing jobs,<br />
promoting learning, and delivering<br />
critical health services. Institutions<br />
also represent an important venue in<br />
the discussion of local food systems,<br />
as they serve as an aggregation point<br />
of many consumers –where students,<br />
employees, patients, and other<br />
community members purchase and<br />
consume food.<br />
Bringing healthy, locally produced<br />
food into institutions has been<br />
recommended by many as an<br />
effective strategy to address the<br />
social, economic, and environmental<br />
challenges posed by the current food<br />
system (Joshi, Azuma, & Feenstra,<br />
2008; Harris, et al., 2012; Clinton,<br />
et al., 2014). Policies and programs<br />
supporting the procurement of locally<br />
produced food by institutions, known<br />
as farm to institution, have grown<br />
significantly over the past decade,<br />
particularly at K-12 schools (USDA<br />
FNS, 2013; National Farm to School<br />
Network, Vermont Law School, 2015).<br />
While this existing research suggests<br />
that farm to institution strategies<br />
may improve nutrition for students<br />
and patients and support local food<br />
producers, little work is being done to<br />
track the progress of farm to institution<br />
strategies on local, state, or regional<br />
levels.<br />
The growth of the farm to institution<br />
market in New England depends<br />
on the hard work of hundreds<br />
of dedicated and skilled people,<br />
institutions, businesses, networks,<br />
and organizations. All stakeholders –<br />
from policymakers, to dining service<br />
managers and schoolteachers – can<br />
utilize data demonstrating the level<br />
and impact of local food procurement<br />
by institutions across the supply<br />
chain. Led by Farm to Institution New<br />
England (<strong>FINE</strong>) in collaboration with<br />
key partners, the New England Farm<br />
to Institution Metrics Project has been<br />
established to collect and provide<br />
access to that data for all stakeholders.<br />
In March 2015, <strong>FINE</strong> partnered<br />
with Health Care Without Harm<br />
(HCWH) to develop a survey of New<br />
England distributors to explore the<br />
demand for local products from food<br />
distributors and identify challenges<br />
and opportunities in the institutional<br />
food market. Given that institutions<br />
often serve large quantities of food<br />
– for instance, the University of<br />
Massachusetts Amherst Dining Service<br />
provides 45,000 meals a day (UMass<br />
Amherst, 2015) – it can be challenging<br />
for individual producers to supply large<br />
enough quantities to meet institutions’<br />
needs. <strong>Distributor</strong>s thus play a vital role<br />
in aggregating products from individual<br />
local producers, providing institutions<br />
with the high volume they need to<br />
operate their dining programs (Brayley,<br />
Clark, & Anand, 2012).<br />
This report summarizes the results<br />
of the survey of New England food<br />
distributors. It is the first in a series of<br />
reports to be published by the <strong>FINE</strong><br />
Metrics Project. The following data will<br />
be helpful in establishing a baseline of<br />
institutional procurement of food for<br />
2014 and allowing for measurement of<br />
progress over time. By providing this<br />
information, the report seeks to identify<br />
ways for practitioners, policymakers,<br />
funders, and other stakeholders to<br />
further farm to institution strategies in<br />
New England.<br />
GETTING IT THERE: UNDERSTANDING THE ROLE OF NEW ENGLAND FOOD DISTRIBUTORS IN PROVIDING LOCAL FOOD TO INSTITUTIONS PAGE 4
KEY FINDINGS<br />
• Half of the 56 survey respondents<br />
reported that they currently sell to<br />
institutional food service operations.<br />
• The 25 respondents who provided<br />
gross sales figures accounted for $1.12<br />
billion in sales in 2014. Of these 25<br />
distributors, 23 provided institutional<br />
sales figures, totaling $366 million in<br />
institutional sales, which equaled 47%<br />
of their gross sales.<br />
Photo by A. Perry Heller at Black River Produce<br />
• Respondents with gross sales greater<br />
than $10 million made a greater portion<br />
of their sales to institutions (58%) than<br />
respondents with gross sales under<br />
$1 million (28%) or respondents with<br />
gross sales between $1 million and $10<br />
million (11%).<br />
• For the purposes of procuring and<br />
marketing their products, the most<br />
common definitions of “local” from<br />
respondents were products that were<br />
“produced within the state” (31%) or<br />
“produced within the region” (27%).<br />
• Overall, respondents made an<br />
estimated $59 million in local product<br />
sales to institutions in 2014.<br />
• Nearly 90% of respondents believe<br />
sales of local products to institutions<br />
will increase some or significantly over<br />
the next three years.<br />
• There is a highly negative association<br />
between gross sales and percent of<br />
local sales. As the total sales amount<br />
increases for a distributor, the percent<br />
of local sales decreases. Respondents<br />
with less than $1 million in gross sales<br />
reported that their local product sales<br />
accounted for nearly all (97%) of their<br />
gross sales, while for respondents<br />
with gross sales greater than $10<br />
million, local product sales accounted<br />
for 19% of gross sales.<br />
• In 2014, respondents served an<br />
average of 81 individual public<br />
schools, 45 colleges and universities,<br />
and 54 hospitals and health centers.<br />
Respondents procured local products<br />
from an average of 46 producers, two<br />
farmer cooperatives, and eight local<br />
value-added processors.<br />
• When asked to list the top local<br />
products where institutional<br />
customer demand was greater than<br />
supply, the most common response<br />
was that this was not an issue (33%).<br />
The second most common response<br />
was a lack of sufficient meat products<br />
(24%).<br />
• The two biggest obstacles for<br />
respondents in selling and procuring<br />
local products are the lack of<br />
consistent, year-round supply of<br />
local products (50%) and the high<br />
price point of local products for their<br />
customers (42%).<br />
GETTING IT THERE: UNDERSTANDING THE ROLE OF NEW ENGLAND FOOD DISTRIBUTORS IN PROVIDING LOCAL FOOD TO INSTITUTIONS PAGE 5
SURVEY METHODS & PROCEDURES<br />
In developing a survey list of food<br />
distributors, the project team used<br />
several sources of information,<br />
including a previous report on<br />
distribution by <strong>FINE</strong>, the National<br />
Good Food Network’s Food Hub list<br />
(National Good Food Network, n.d.),<br />
a distribution and processing report<br />
from Farm Fresh Rhode Island (Pucetti<br />
& Clark, 2015), and input from a <strong>FINE</strong><br />
advisory committee. <strong>Distributor</strong>s from<br />
the New England Produce Center<br />
were also included on the survey<br />
list. Given the scope of the <strong>FINE</strong><br />
Metrics Project, contact information<br />
was sought only for businesses with<br />
distribution centers located within<br />
New England. The survey list included<br />
regional distribution centers for large<br />
national corporations. These regional<br />
distribution centers were only asked<br />
to provide responses representing<br />
their own regional operations. In total,<br />
86 distributors were contacted for the<br />
survey.<br />
The survey’s 21 questions were<br />
designed to collect data regarding<br />
sales, client demographics, supply and<br />
demand issues, and perceived trends<br />
and challenges in the institutional<br />
market. As some distributors did<br />
not serve the institutional market<br />
or source locally produced food,<br />
the survey employed skip logic to<br />
collect relevant information from<br />
them. An advisory team, consisting<br />
of academic, philanthropic, nonprofit,<br />
and other stakeholders, provided<br />
input and feedback during the<br />
development of the survey. Prior to<br />
implementation, the survey was tested<br />
with three distributors with whom the<br />
project partners had prior working<br />
relationships.<br />
The survey was implemented online<br />
through SurveyMonkey. Potential<br />
respondents were sent an invitation<br />
over email and given two ways to<br />
complete the survey: (1) self-administer<br />
the survey through the link provided<br />
in the invitation, or (2) complete the<br />
survey over the phone with the <strong>FINE</strong><br />
researcher entering responses into<br />
SurveyMonkey. After receiving the<br />
initial survey invitation, distributors<br />
received a total of two follow-up phone<br />
calls and two follow-up emails before<br />
being marked as non-responsive. As<br />
an incentive, all respondents were<br />
entered into a drawing for one of two<br />
gift cards worth $50.<br />
Regarding survey limitations, the<br />
responding distributors are a selfselected<br />
sample of New England<br />
food distributors serving institutions<br />
and thus may not be representative<br />
of the population in terms of size,<br />
client base, procurement and sales<br />
strategies. This is important to keep<br />
in mind when extrapolating from the<br />
report’s analysis. In particular, only two<br />
of the survey respondents operate<br />
as regional distribution centers for<br />
broadline distributors, which account<br />
for the majority of food service sales<br />
in the country (see Table 4 for details<br />
on respondent operations) (The Hale<br />
Group, 2013). Also, the responses are<br />
self-reported numbers and, in several<br />
cases, estimates; thus individual<br />
responses may not be exact.<br />
GETTING IT THERE: UNDERSTANDING THE ROLE OF NEW ENGLAND FOOD DISTRIBUTORS IN PROVIDING LOCAL FOOD TO INSTITUTIONS PAGE 6
SURVEY RESPONDENT CHARACTERISTICS<br />
Of the 86 distributors contacted, 56 responded to the<br />
survey, a 65% response rate. Respondents were asked<br />
to confirm the city, state, and zip code of their company<br />
headquarters (Table 1). Over half of the respondents<br />
were based in Massachusetts. This was expected given<br />
the density of distributors (19 respondents) at the New<br />
England Produce Center, the second largest produce<br />
market in the country (Refrigerated Transporter, 2010)<br />
and the fact that half of the New England population<br />
resides in Massachusetts. Of the 30 distributors who were<br />
contacted but did not complete the survey, 11 were based<br />
in Massachusetts, several of which were located in the New<br />
England Produce Center.<br />
<strong>Distributor</strong>s were asked about which states they served.<br />
Massachusetts was served by the largest number of<br />
distributors, followed by New Hampshire and Connecticut.<br />
A significant number of the distributors also provided<br />
service beyond New England (Table 2). Notably,<br />
respondents typically served just one state or all six<br />
New England states, suggesting that the respondent<br />
group consists mainly of larger, regional distributors and<br />
smaller, local distributors (Table 3), with few medium-sized<br />
distributors. The vast majority of distributors who serve all<br />
six New England states also provide their services beyond<br />
the region, indicating that larger distributors do not limit<br />
themselves by the geographic bounds of New England.<br />
Table 1: Number of New England <strong>Distributor</strong>s’ Headquarters<br />
Surveyed by State, 2015<br />
Table 2: Number of Surveyed New England <strong>Distributor</strong>s Serving<br />
Each New England State, 2015<br />
GETTING IT THERE: UNDERSTANDING THE ROLE OF NEW ENGLAND FOOD DISTRIBUTORS IN PROVIDING LOCAL FOOD TO INSTITUTIONS PAGE 7
Table 3: Number of States Served by Surveyed New England<br />
<strong>Distributor</strong>s, 2015<br />
Survey respondents were not asked to categorize<br />
themselves as a broadline distributor or specialty<br />
distributor 1 . However, analysis of respondents’ websites<br />
and survey responses suggests that only two of the<br />
respondents operate as broadline distributors, while the<br />
other 54 operate as specialty distributors. The majority of<br />
those surveyed specialized in produce distribution (Table<br />
4).<br />
Of the 56 respondents, exactly half (28) stated that they<br />
currently serve institutions.<br />
Table 4: Types of Surveyed New England <strong>Distributor</strong>s, 2015<br />
Photo courtesy of the Intervale Food Hub<br />
1<br />
Broadline foodservice distributors traditionally purchase a wide range of products from manufacturers and stock these goods in one of their distribution centers. Specialty<br />
foodservice distributors typically do not stock a wide range of products; instead, they operate in niche markets where it is often necessary to have specialized knowledge<br />
about product sourcing, handling, and/or service. (USDA ERS, n.d.)<br />
GETTING IT THERE: UNDERSTANDING THE ROLE OF NEW ENGLAND FOOD DISTRIBUTORS IN PROVIDING LOCAL FOOD TO INSTITUTIONS PAGE 8
SELLING TO INSTITUTIONS<br />
Food distributors vary in terms of<br />
markets served. Institutional clients,<br />
such as K-12 schools, colleges, and<br />
hospitals, represent one customer<br />
segment for these distributors. This<br />
section of the report summarizes<br />
key characteristics of the 28 New<br />
England distributors who responded<br />
to the survey and reported selling to<br />
institutional clients.<br />
In this survey of New England<br />
distributors, respondents selling to<br />
institutions reported an average of<br />
$45 million in 2014 total sales for<br />
all customer segments (i.e., gross<br />
sales), including institutions (Table 5).<br />
Aggregated across all respondents,<br />
New England distributors reported<br />
over $1.12 billion in gross sales in 2014.<br />
It is important to note that two of the<br />
responding distributors represented<br />
over half of the aggregated gross<br />
sales.<br />
Institutional sales for respondents<br />
ranged significantly, from $1,590 to<br />
$296 million. Nearly half (47.8%) of<br />
the respondents reported less than<br />
$100,000 in institutional sales, while<br />
over a quarter (26.1%) reported over<br />
$1 million in institutional sales. Sales<br />
to institutions averaged approximately<br />
$16 million per distributor in 2014,<br />
for an aggregated amount of $366<br />
million. Of those providing institutional<br />
sales figures (N=23), institutional sales<br />
represented 47% of their gross sales<br />
(Table 5).<br />
<strong>Distributor</strong>s with over $10 million in<br />
gross sales reported that institutional<br />
sales represented nearly half (48%) of<br />
their gross sales. This contrasted with<br />
institutional sales proportions from<br />
respondents with gross sales between<br />
$1 and $10 million (11%) and less than $1<br />
million (28%) 2 . This suggests that larger<br />
distributors count institutional sales<br />
more as a core part of their services<br />
than smaller distributors (Figure 1 on<br />
following page).<br />
2<br />
<strong>Distributor</strong> size was categorized based on the<br />
distribution of the data.<br />
Table 5: Gross and Institutional Sales for Surveyed New England <strong>Distributor</strong>s, 2014<br />
GETTING IT THERE: UNDERSTANDING THE ROLE OF NEW ENGLAND FOOD DISTRIBUTORS IN PROVIDING LOCAL FOOD TO INSTITUTIONS PAGE 9
Figure 1: Profiles of Surveyed New England Food <strong>Distributor</strong>s<br />
Categorized by Gross Sales, 2014<br />
Respondents served a variety of institutional clients,<br />
averaging 81 individual public schools, 45 colleges and<br />
universities, and 54 hospitals and health centers in 2014.<br />
Respondents also reported serving a number of other<br />
institutions, such as correctional facilities, assisted living<br />
facilities, and corporate cafeterias. In total, respondents<br />
serve 4,471 institutions in New England (Table 6).<br />
Table 6: Number of Institutional Clients Served by<br />
Surveyed New England <strong>Distributor</strong>s, 2014<br />
Photo courtesy of Red Tomato<br />
GETTING IT THERE: UNDERSTANDING THE ROLE OF NEW ENGLAND FOOD DISTRIBUTORS IN PROVIDING LOCAL FOOD TO INSTITUTIONS PAGE 10
SELLING LOCAL FOOD TO INSTITUTIONS<br />
The availability and product mix of food<br />
items varies widely among distributors.<br />
Local foods, including fresh, frozen,<br />
or otherwise processed products,<br />
represent one category of products<br />
that distributors can provide. Some<br />
distributors focus primarily or entirely<br />
on local products. The following<br />
information summarizes how the<br />
responding New England distributors<br />
are procuring and marketing local food<br />
to institutions, including their definition<br />
of “local,” how much of it they are<br />
currently selling, and how much they<br />
anticipate selling in the future.<br />
marketing their products, the most<br />
common definitions of “local” were<br />
products that were “produced within<br />
the state” or “produced within the<br />
region” 3 . In several cases, a distributor<br />
markets their products with multiple<br />
definitions of “local,” in response to<br />
customer needs (e.g., “local” defined<br />
as “produced within a state” and<br />
“produced within a region”) (Figure 2).<br />
3<br />
Note that distributors were free to interpret the word<br />
“produced”. <strong>Distributor</strong>s were not asked in the survey<br />
to distinguish between locally grown and locally<br />
processed products. For example, all of the ingredients<br />
of a distributor’s particular product may have been<br />
grown outside of their local definition’s geographic<br />
bounds, but the product was produced within the<br />
local definition’s geographic bounds and has been<br />
categorized as local by that distributor.<br />
Figure 2: Definition of "Local" by<br />
Surveyed New England <strong>Distributor</strong>s Selling to Institutions, 2015<br />
As noted in the introduction, there<br />
is no consensus on the definition<br />
of local food. However, there are<br />
commonly used definitions, such as<br />
those used by the federal government.<br />
The 2008 Food, Conservation, and<br />
Energy Act (2008 Farm Act) defined<br />
local as less than 400 miles from a<br />
product’s origin, or within the state<br />
in which it is produced (Martinez<br />
et al., 2010). All respondents who<br />
sell to institutions reported that<br />
they promote at least some of their<br />
products as “local,” though the<br />
definition of local varied significantly.<br />
For the purposes of procuring and<br />
GETTING IT THERE: UNDERSTANDING THE ROLE OF NEW ENGLAND FOOD DISTRIBUTORS IN PROVIDING LOCAL FOOD TO INSTITUTIONS PAGE 11
Using their own definitions of “local,”<br />
respondents reported they had an average<br />
of $7.3 million in local product sales,<br />
representing an average of 21% of their<br />
gross sales (including institutional and all<br />
other sales) (Figure 3). When divided into<br />
ranges based on gross sales, distributors<br />
with less than $1 million in sales reported that<br />
their local product sales accounted for nearly<br />
all of their gross sales. <strong>Distributor</strong>s with gross<br />
sales between $1 million and $10 million also<br />
reported a high proportion of local product<br />
sales.<br />
Figure 3: Local Product Sales as a Percentage of Gross Sales for Surveyed<br />
New England <strong>Distributor</strong>s, 2014<br />
However, for distributors with gross sales<br />
greater than $10 million, local product sales<br />
accounted for significantly less of their gross<br />
sales. In fact, a correlation analysis revealed<br />
a highly negative association, r(22) = -0.852,<br />
p < .001, between gross sales and percent<br />
of local sales, so that as total sales increases<br />
for a distributor, the percent of local sales<br />
decreases.<br />
This suggests that smaller New England<br />
distributors have a greater emphasis<br />
on selling local products, while larger<br />
companies are likely serving as full-service<br />
providers with a mix of local and non-local<br />
products. In total, $176 million dollars of<br />
local products were sold (to all clients, not<br />
just institutions) in 2014 by New England<br />
distributors that sell products to institutions.<br />
GETTING IT THERE: UNDERSTANDING THE ROLE OF NEW ENGLAND FOOD DISTRIBUTORS IN PROVIDING LOCAL FOOD TO INSTITUTIONS PAGE 12
The survey did not specifically ask<br />
distributors for their sales of local<br />
products to institutions, as this<br />
information was unlikely to be readily<br />
accessible and would increase<br />
response burden. However, using data<br />
from the 2015 <strong>FINE</strong> Farm to College<br />
Survey (to be published), HCWH’s 2015<br />
Healthy Food in Health Care Survey<br />
(to be published), and the United<br />
States Department of Agriculture’s<br />
Farm to School Census (USDA FNS,<br />
2013), we estimate that approximately<br />
16% of all New England institutional<br />
food purchases are local products,<br />
resulting in $59 million in sales of local<br />
product to institutions for the surveyed<br />
distributors.<br />
All of the distributors selling to<br />
institutions in the sample were<br />
implementing measures of product<br />
transparency in their order guides.<br />
Over 70% of distributors listed farm<br />
name, and town and/or state of origin.<br />
In addition, half of the distributors<br />
identified specific products as “local” in<br />
order guides; 12 of the 13 respondents<br />
who did this also provided more<br />
detailed product origin information,<br />
e.g., farm or town name (Table 7).<br />
Table 7: Product Transparency in Order Guides for Surveyed New England<br />
<strong>Distributor</strong>s Selling to Institutions, 2015<br />
Surveyed New England<br />
distributors made an<br />
estimated $59 million<br />
in local product sales to<br />
institutions in 2014.<br />
GETTING IT THERE: UNDERSTANDING THE ROLE OF NEW ENGLAND FOOD DISTRIBUTORS IN PROVIDING LOCAL FOOD TO INSTITUTIONS PAGE 13
In terms of the top local food items<br />
sold to institutions, distributors ranged<br />
widely in their responses. The products<br />
listed most frequently are displayed<br />
in Table 8. Respondents were<br />
encouraged to provide as much detail<br />
as possible, for example specifying<br />
whether their top local product was<br />
sliced apples or whole apples.<br />
Table 8: Top Local Products Sold to Institutions by Surveyed New England<br />
<strong>Distributor</strong>s, 2014<br />
When asked to list the top local<br />
products where institutional customer<br />
demand was greater than supply,<br />
one-third of the surveyed distributors<br />
responded that this was not an issue.<br />
One particular distributor expanded on<br />
this response, saying that they work<br />
with a large number of producers of<br />
each local product to avoid running<br />
out of supply. The products listed most<br />
frequently where institutional demand<br />
was greater than supply are displayed<br />
in Table 9.<br />
It is worth noting that year-round<br />
supply of lower-cost local meat,<br />
fruit, and vegetables is a challenge<br />
for several distributors. An analysis<br />
of key challenges and limitations<br />
for distributors, which focuses in on<br />
issues related to price of products,<br />
is provided in a later section of the<br />
report.<br />
Photo by A. Perry Heller at Black River Produce<br />
GETTING IT THERE: UNDERSTANDING THE ROLE OF NEW ENGLAND FOOD DISTRIBUTORS IN PROVIDING LOCAL FOOD TO INSTITUTIONS PAGE 14
<strong>Distributor</strong>s selling to institutions have<br />
a positive outlook on future sales of<br />
local foods to institutions, with nearly<br />
90% reporting that they believe these<br />
would increase some or increase<br />
significantly over the next three years.<br />
None of the 26 respondents believed<br />
that their local sales to institutions<br />
would decrease (Figure 4).<br />
Table 9: Top Local Products Where Institutional Demand is Greater Than Supply<br />
for Surveyed New England <strong>Distributor</strong>s, 2014<br />
Figure 4: Surveyed New England<br />
<strong>Distributor</strong> Perceptions on Their Sales<br />
of Local Food to Institutions, 2015<br />
Photo courtesy of Red Tomato<br />
GETTING IT THERE: UNDERSTANDING THE ROLE OF NEW ENGLAND FOOD DISTRIBUTORS IN PROVIDING LOCAL FOOD TO INSTITUTIONS PAGE 15
SALES OF & DEMAND FOR SPECIALTY PRODUCTS IN INSTITUTIONS<br />
Our survey asked questions regarding<br />
the demand and supply of specific<br />
specialty products: (1) organic products,<br />
(2) New England wild caught fish, and<br />
(3) meat certified as raised without the<br />
routine use of antibiotics (e.g., certified<br />
organic or humanely raised). These<br />
specialty product categories represent<br />
potential areas for growth in New<br />
England institutional procurement, as<br />
there are producers in the region who<br />
are already supplying these products<br />
to other markets. Aside from the<br />
three specialty products highlighted<br />
in the survey, there are certainly<br />
other product categories that also<br />
represent potential areas of growth,<br />
and further research is needed to help<br />
provide more insight as to the best<br />
opportunities and areas of focus.<br />
Surveyed distributors were asked<br />
how often they were contacted by<br />
their institutional clients about the<br />
three specialty products (Figure 5). In<br />
general, they reported being contacted<br />
rarely by their clients for organic<br />
products, New England wild caught<br />
fish, or meat certified as raised without<br />
the routine use of antibiotics.<br />
Figure 5. Institutional Demand for Specialty Products <strong>Report</strong>ed by Surveyed New<br />
England <strong>Distributor</strong>s, 2015<br />
<strong>Distributor</strong>s were also asked whether they sold these specialty products to<br />
institutions. The majority of respondents sell at least some organic products, while<br />
distributors selling meat certified as raised without the routine use of antibiotics<br />
and New England wild caught fish were less common (Table 10). Of the thirteen<br />
distributors selling meat certified as raised without the routine use of antibiotics, six<br />
respondents stated that it represents a significant portion their total sales of meat<br />
products (over 75%), indicating that this specialty product is an area of focus for<br />
them.<br />
Table 10: Availability of Specialty Products by Surveyed New England <strong>Distributor</strong>s, 2015<br />
GETTING IT THERE: UNDERSTANDING THE ROLE OF NEW ENGLAND FOOD DISTRIBUTORS IN PROVIDING LOCAL FOOD TO INSTITUTIONS PAGE 16
WORKING WITH LOCAL VENDORS<br />
New England distributors who sell to institutions are procuring their local product in<br />
different ways and have varied what requirements for local producers and suppliers.<br />
Local food sales and procurement information can be used to highlight specific<br />
areas of greatest potential, such as types of distributors whose local food sales have<br />
room for growth.<br />
When categorized by sales, distributors with gross sales less than $1 million<br />
procured their entire inventory from New England-based farm and food businesses<br />
(Table 11). There was a highly negative association, r(22) = -0.862, p < .001, between<br />
gross sales and percent of New England procurement. As total sales increases for a<br />
distributor, the percent of New England procurement decreases. Respondents with<br />
gross sales greater than $10 million procure an average of less than one-fifth of their<br />
products from the region.<br />
Table 11: New England Products as a Percentage of Total Procurement for<br />
Surveyed New England <strong>Distributor</strong>s, 2015<br />
Photo courtesy of Mass Farm to School<br />
Table 12: Number of Local Producers, Farmer Cooperatives, and Processors<br />
Used by Surveyed New England <strong>Distributor</strong>s to Procure Local Foods, 2014<br />
Vendors usually sell their products to<br />
more than one distributor. Taking this<br />
into account, our respondents reported<br />
that they procured their local products<br />
from an average of 46 producers,<br />
two local farmer cooperatives (which<br />
represent multiple farmers), and<br />
eight local processors (Table 12).<br />
In total, respondents sourced from<br />
over 1,100 producers, 40 local farmer<br />
cooperatives, and 186 processors.<br />
GETTING IT THERE: UNDERSTANDING THE ROLE OF NEW ENGLAND FOOD DISTRIBUTORS IN PROVIDING LOCAL FOOD TO INSTITUTIONS PAGE 17
When asked about levels of liability<br />
insurance, at least half of respondents<br />
required no more than $1 million for<br />
suppliers and producers of produce<br />
(57.9%), meat (53.8%), and grocery<br />
items (58.8%) (Figure 6).<br />
Figure 6: Required Level of Liability Insurance for Suppliers and Producers<br />
Working with Surveyed New England <strong>Distributor</strong>s Selling to Institutions, 2015<br />
None Covered by <strong>Distributor</strong> $1 Million Over $2 Million<br />
Photo courtesy of Red Tomato<br />
GETTING IT THERE: UNDERSTANDING THE ROLE OF NEW ENGLAND FOOD DISTRIBUTORS IN PROVIDING LOCAL FOOD TO INSTITUTIONS PAGE 18
In terms of required certifications for suppliers and producers, less than a quarter of respondents<br />
required USDA’s Good Agricultural Practices (GAP) or USDA/FDA’s Hazard Analysis and Critical Control<br />
Points (HACCP) certifications. A more common response from respondents was that certifications<br />
required for suppliers and producers depended on specifications of the distributors’ customers,<br />
whether it was GAP, HACCP, or another certification (Figure 7). Among some of the other certifications<br />
required by distributors were “certified organic” and “rGBH hormone-free”.<br />
Figure 7: Supplier and Producer Certifications Required by Surveyed New<br />
England <strong>Distributor</strong>s, 2015<br />
In terms of<br />
challenges:<br />
“Customers,<br />
particularly<br />
institutions,<br />
feel that our<br />
prices for<br />
local products<br />
are too high<br />
despite the<br />
fact that they<br />
want to feature<br />
local in their<br />
offerings” – a<br />
New England<br />
food distributor<br />
GETTING IT THERE: UNDERSTANDING THE ROLE OF NEW ENGLAND FOOD DISTRIBUTORS IN PROVIDING LOCAL FOOD TO INSTITUTIONS PAGE 19
KEY CHALLENGES & LIMITATIONS<br />
Institutions often face challenges<br />
when they seek to procure local foods.<br />
These barriers have been highlighted<br />
frequently by stakeholders at <strong>FINE</strong> and<br />
HCWH events, and have been welldocumented<br />
from the perspectives of<br />
farmers and institutional food service<br />
departments (Huff, 2015; Matts, et al.,<br />
2015; Oberholtzer, 2010). However,<br />
additional information is needed from<br />
the perspectives of distributors to<br />
understand the challenges across the<br />
farm to institution supply chain.<br />
This survey provided an opportunity<br />
for respondents to comment on<br />
key challenges and limitations with<br />
procuring and/or selling local products,<br />
both in reference to institutional<br />
sales, as well as across all customer<br />
Figure 8: Key Challenges and Limitations for Surveyed New England <strong>Distributor</strong>s<br />
in Procuring/Selling Local Products, 2015<br />
segments. This was an open-ended<br />
question, which was coded for analysis.<br />
The two biggest obstacles reported by<br />
distributors were the lack of consistent,<br />
year-round supply of local products and<br />
the high price point of local products<br />
for their customers (Figure 8). As for<br />
the challenge of local products having<br />
a higher price point than non-local<br />
products, one particular distributor<br />
stated, “Institutions are not willing to<br />
pay what it costs to grow local food.”<br />
Another common response relates to<br />
the distribution challenges of working<br />
with small, local producers and large<br />
institutional customers. One respondent<br />
noted “there are many challenges<br />
with selling local food, specifically with<br />
institutional accounts. They are used to<br />
a system where they order today and<br />
receive tomorrow, and that is difficult<br />
for local food systems to manage.”<br />
GETTING IT THERE: UNDERSTANDING THE ROLE OF NEW ENGLAND FOOD DISTRIBUTORS IN PROVIDING LOCAL FOOD TO INSTITUTIONS PAGE 20
RECOMMENDATIONS<br />
As demonstrated in this report, interest in<br />
local food is strong across all institutional<br />
sectors. However, distributors still face<br />
significant barriers to meeting the<br />
growing institutional demand for local<br />
food. The following recommendations<br />
were collaboratively developed using<br />
the findings of the New England Farm<br />
to Institution Metrics Project, and are<br />
designed to strengthen the distribution<br />
link of the farm to institution marketing<br />
chain.<br />
FOOD DISTRIBUTORS<br />
• Small and medium-sized<br />
distributors: Promote available local<br />
food products to nearby schools,<br />
colleges, hospitals, and other<br />
institutions<br />
• Large distributors: Promote the<br />
local food options you have<br />
available to your clients<br />
• Large distributors: Invest in<br />
local food logistics, tracking,<br />
and marketing systems and<br />
communicate clearly about local<br />
purchases with institutional clients<br />
• All distributors: Cultivate multi-year<br />
contracts, seasonal agreements,<br />
and other buying commitments<br />
for local food from institutions and<br />
regional agricultural producers/<br />
producer cooperatives<br />
• All distributors: Consider lowering<br />
insurance requirements for small<br />
and medium-sized food producers<br />
to make them more affordable<br />
• All distributors: Gather information<br />
about what area institutions require<br />
from distributors regarding food<br />
packing, shipping, invoicing, and<br />
safety certifications<br />
GOVERNMENT OFFICIALS<br />
• Prioritize implementation of farm to<br />
institution elements of state food<br />
plans and create farm to institution<br />
working groups in state food policy<br />
councils<br />
• Allocate a portion of your public<br />
grant programs to farm to institution<br />
and season extension projects and<br />
research<br />
• Invest in a regional tracking system<br />
for state agency and institution<br />
local/regional food procurement<br />
• Measure the baseline and set<br />
percentage goals for local/regional<br />
food procurement at state agencies<br />
and institutions<br />
• Support producer wholesale<br />
readiness workshops, and ensure<br />
that workshops are informed by<br />
distributor input<br />
• Promote increased production and<br />
create opportunities for producers,<br />
distributors, and institutional buyers<br />
of specific food products found to<br />
be in high demand and low supply<br />
(e.g., meat, poultry, and eggs) to<br />
meet and make plans to increase<br />
supply<br />
GETTING IT THERE: UNDERSTANDING THE ROLE OF NEW ENGLAND FOOD DISTRIBUTORS IN PROVIDING LOCAL FOOD TO INSTITUTIONS PAGE 21
FUNDERS & NONPROFITS<br />
• Support and promote innovation in<br />
institutional local food procurement<br />
programs<br />
• Assist small and medium-sized<br />
distributors in expanding to serve<br />
institutional markets<br />
• Promote training and technical<br />
assistance for institutional food<br />
buyers to effectively develop and<br />
use contracts with producers to<br />
support more local procurement<br />
• Help producers get “wholesale<br />
ready” so they can serve<br />
institutional markets<br />
• Fund additional research on the<br />
economic feasibility of institutional<br />
markets for food producers<br />
• Connect retiring producers with<br />
new producers to keep farmland<br />
in production and increase the<br />
amount of local food being<br />
produced<br />
• Fund more training and<br />
professional development for food<br />
service staff to ensure that they are<br />
equipped with the skills needed to<br />
prepare local food from scratch<br />
INSTITUTIONS<br />
• Ask your distributor how they define<br />
local products and communicate to<br />
your distributor how your institution<br />
defines local products<br />
• Before selecting your distributor,<br />
ask them about their capacity to<br />
track and report local purchases<br />
• Track your local food purchases.<br />
You may be able to use data from<br />
your distributors to do this<br />
• Communicate with your distributor<br />
regarding preferences related<br />
to delivery schedules, invoicing,<br />
packaging, and or certifications that<br />
support your local food goals<br />
• Consider working with small<br />
distributors like food hubs, as they<br />
carry a much higher percentage of<br />
local foods than larger distributors<br />
• Include local food purchasing goals<br />
and values in RFPs and contracts<br />
with distributors<br />
Photo courtesy of Red Tomato<br />
GETTING IT THERE: UNDERSTANDING THE ROLE OF NEW ENGLAND FOOD DISTRIBUTORS IN PROVIDING LOCAL FOOD TO INSTITUTIONS PAGE 22
REFERENCES<br />
Brayley, D., Clark, K. & Anand, M.<br />
(2012). Produce Distribution Practices:<br />
Incorporating Locally Grown Produce into<br />
New England’s Institutional Food System.<br />
Kids First.<br />
Clinton, S., Stoddard, J., Perkins, K., Peats,<br />
B., & Collins, A. (2014). New England<br />
Healthy Food in Health Care: Leading the<br />
Charge to a Healthy, Sustainable Food<br />
System. Health Care Without Harm.<br />
Harris, D., Lott, M., Lakins, V., Bowden, B.,<br />
& Kimmons, J. (2012). Farm to Institution:<br />
Creating Access to Healthy Local and<br />
Regional Foods. Advances in Nutrition: An<br />
International Review Journal, 3(3), 343-<br />
349.<br />
Huff, P. (2015). Building Minnesota’s Farm<br />
to Institution Markets: A Producer Survey.<br />
Institute for Agriculture and Trade Policy.<br />
Joshi, A., Azuma, A., & Feenstra, G. (2008).<br />
Do Farm-to-School Programs Make a<br />
Difference? Findings and Future Research<br />
Needs. Journal of Hunger & Environmental<br />
Nutrition, 3(2-3), 229-246.<br />
Matts, C., Conner, D., Fisher, C., Tyler, S.,<br />
& Hamma, M. (2015). Farmer perspectives<br />
of Farm to Institution in Michigan: 2012<br />
survey results of vegetable farmers.<br />
Renewable Agriculture and Food Systems,<br />
1-12.<br />
Martinez, S., Hand, M. S., Da Pra, M.,<br />
Pollack, S., Ralston, K., Smith, T. A., et al.<br />
(2010). Local food systems: Concepts,<br />
impacts, and issues. ERR 97. U.S.<br />
Department of Agriculture, Economic<br />
Research Service.<br />
National Farm to School Network, Vermont<br />
Law School. (2015). State Farm to School<br />
Legislative Survey 2002-2014.<br />
National Good Food Network. (n.d.). Food<br />
Hub Center. Retrieved September 24,<br />
2015, from http://www.ngfn.org/resources/<br />
food-hubs.<br />
Oberholtzer, L. (2010). The use of local<br />
foods in Maryland schools: Findings<br />
from a survey of food service directors.<br />
College Park, MD: University of Maryland,<br />
Department of Agricultural and<br />
Resource Economics.<br />
Pucetti, C., Clark, K. (2015). Rhode Island<br />
Farm to Institution: A look at the capacity<br />
of Rhode Island institutions, processors<br />
and growers to increase processed and<br />
frozen produce in supply chains. Farm<br />
Fresh Rhode Island.<br />
Refrigerated Transporter. (2010). New<br />
England Produce Center Uses Vector<br />
Technology. Retrieved from http://<br />
refrigeratedtransporter.com/emissions/<br />
new-england-produce-center-uses-vectortechnology<br />
The Hale Group. (2013). Foodservice<br />
<strong>Distributor</strong>s of the Future - The Evolution<br />
of the Foodservice <strong>Distributor</strong> Sector.<br />
United States Department of Agriculture,<br />
Economic Research Service (USDA ERS).<br />
(n.d.). Retailing & Wholesaling: Overview.<br />
Retrieved from www.ers.usda.gov/topics/<br />
food-markets-prices/retailing-wholesaling.<br />
aspx.<br />
United States Department of Agriculture,<br />
Food and Nutrition Service (USDA FNS).<br />
(2013). The Farm to School Census.<br />
Available online at http://www.fns.usda.<br />
gov/farmtoschool/census#/.<br />
University of Massachusetts-Amherst.<br />
(2015). UMass Amherst Dining Services<br />
Pledges to Serve 100-Percent, No-<br />
Antibiotic-Ever Chicken. University of<br />
Massachusetts-Amherst, News and Media<br />
Relations.<br />
GETTING IT THERE: UNDERSTANDING THE ROLE OF NEW ENGLAND FOOD DISTRIBUTORS IN PROVIDING LOCAL FOOD TO INSTITUTIONS PAGE 23
FOR MORE INFORMATION<br />
Please visit our online dashboard at dashboard.farmtoinstitution.org (preview<br />
below) for even more farm to institution metrics and related resources.<br />
www.farmtoinstitution.org<br />
GETTING IT THERE: UNDERSTANDING THE ROLE OF NEW ENGLAND FOOD DISTRIBUTORS IN PROVIDING LOCAL FOOD TO INSTITUTIONS PAGE 24