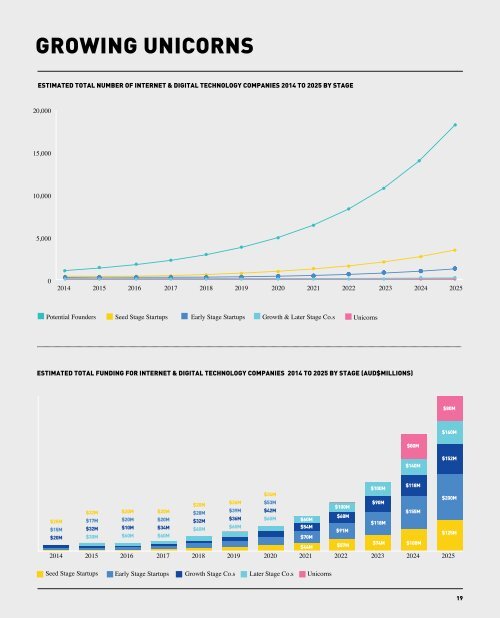
CAPTURING DISRUPTION DISRUPTIVE TECHNOLOGIES Within Australia the software and internet technology sector is still relatively youthful. However as information technology is increasingly deployed throughout industries the composition of the national economy will change. The question is, will this wave of economic and social disruption be driven by companies imagined and built on Australian soil, or will it be driven by foreign technology companies? In order to understand the potential impact of digital disruption on the Australian economy in 2025 we looked at a range of estimates. McKinsey’s 2013 report “Disruptive Technologies: Advances That Will Transform Life, Business, And The Global Economy”, identified the top 12 disruptive technologies that have the greatest potential for economic impact by 2025. 11 McKinsey estimated the potential economic impact that these 12 technologies alone had: “the potential to drive direct economic impact on the order of $14 trillion to $33 trillion per year in 2025.” 11 Approximately 11% to 26% (or a mid range of 19%) of total world GDP, with higher disruption in developed world economies. Seven of the twelve disruptive technologies McKinsey identified fall within our definition of digital technology: Mobile Internet, Automation of Knowledge Work, The Internet of things, Cloud Technology, Advanced Robotics, Autonomous Vehicles and 3D Printing. IMPACT OF DISRUPTIVE TECH ON WA Deloitte’s 2012 report “Digital Disruption: Short fuse, big bang?” analyses the impact of digital technology on Australian industries. It is more bullish and estimates 33% of the economy facing disruption from all digital technologies. Approximately $732 billion of economic impact in 2025 on the Australian GDP (assuming Australian GDP is approximately $3 trillion). 1 “One-third of the Australian economy faces imminent and substantial disruption by digital technologies and business models — what we call a ‘short fuse, big bang’ opportunities, for both business and government.” Deloitte: Digital Disruption: Short fuse, big bang? Using these two reports as a guide we estimate an upper and lower range for the impact of digital technology on the Western Australian economy in 2025 of between 18% to 33% of Gross State Product (GSP), or $55 billion to $101 billion of economic impact per year in 2025. Our mid range estimate is that 25% of the Western Australian economy is impacted by digital and internet technology in 2025, equating to approximately $76 billion of GSP. Based on our mid range we estimate between $5 billion to $25 billion of the ‘disrupted GSP’, could be directly captured by digital technology companies in 2025. 13 GROWING UNICORNS With these estimates in mind we examined what the digital technology sector could look like in 2025, assuming that all this ‘disrupted GDP’ was captured solely by local tech companies. Using our startup formation model and current formation & failure rates at each stage of growth we estimate the total number of technology companies required to capture the disruption in economic value in 2025 ranges between 4,846 to 6,000 companies, across all stages of development, from potential founders to mature unicorns. With over 20,000 people directly employed by high-tech companies and an additional 100,000 that provide or extract value from the industry. 14 Our modelling estimates that startup formation in 2025 would be 788 companies, or 292 startups formed in 2025 per million people in WA. By way of comparison US technology hubs such as Boulder, San Jose, Cambridge and San Francisco had yearly startup formation rates per million people ranging between 97 to 256 in 2010 (the last recorded data we could find on the US). Given the age of US figures and the methodology the Kaufmann Foundation used to come to these figures we think that actual formation rates in the US are currently higher and are almost certainly set to increase substantially by 2025. And if tech startup formation rates approach normal business formation rates we still have along way to go, with the formation rate across all business types in the USA at 1,342 per million people. 15 With this in mind a formation rate of 292 per million people is not unreasonable given substantive support to grow the WA sector. ESTIMATED TOTAL FUNDING REQUIRED 2014-2015 BY STAGE Stage Stage ($50K per company) $535M Early Stage ($300K) $909M Growth Stage ($2M) $792M Later Stage ($20M) $1,000M Unicorn ($80M)* $240M ESTIMATED TOTAL FUNDING REQUIRED Based on these company numbers we estimated the total required funding to seed and develop this number of technology companies by 2025. Assuming average total lifetime investments per company ranging from $50,000 for seed stage to $80 million for unicorns, we estimate the total funding required to develop the industry over the coming ten year period is approximately $3 to $3.5 billion. 16,17,18 With per year funding levels, across all sources, increasing from an average of ~$17 million on the trailing six year period to between $700 million to $1.5 billion in 2025. Average funding per capita over the ten year period of $106 to $129 per person, and as high as $266 per person in 2025. By way of comparison average per capita VC investment across the USA is $81, in Israel it is $183 and in Silicon Valley estimates have it as high as $4,241 per person (note these numbers exclude angel investment, public markets and government grants). 18,20,21 Compared to traditional industries all these numbers pale in comparison with $47 billion invested in Mining & Resource projects in WA in 2014FY: $18,319 per capita of investment. WA RESOURCES VS TECH FUNDING Investment in Resources - 2014FY ($47B) Investment in all Tech - 2025 ($1B) Investment in all Tech - 2014 (
GROWING UNICORNS ESTIMATED TOTAL NUMBER OF INTERNET & DIGITAL TECHNOLOGY COMPANIES 2014 TO 2025 BY STAGE 20,000 15,000 10,000 5,000 0 2014 2015 2016 2017 2018 2019 2020 2021 2022 2023 2024 2025 Potential Founders Seed Stage Startups Early Stage Startups Growth & Later Stage Co.s Unicorns ESTIMATED TOTAL FUNDING FOR INTERNET & DIGITAL TECHNOLOGY COMPANIES 2014 TO 2025 BY STAGE (AUD$MILLIONS) $80M $160M $80M $140M $152M $100M $118M $34M $200M $20M $26M $53M $90M $100M $32M $20M $20M $28M $39M $42M $155M $25M $17M $20M $20M $32M $36M $60M $68M $60M $118M $15M $32M $10M $34M $60M $60M $54M $91M $125M $20M $30M $60M $60M $70M $44M $57M $74M $100M 2014 2015 2016 2017 2018 2019 2020 2021 2022 2023 2024 2025 Seed Stage Startups Early Stage Startups Growth Stage Co.s Later Stage Co.s Unicorns 19