

STARTUP ECOSYSTEM PRELIMINARY REPORT
wobLBF
wobLBF

Create successful ePaper yourself
Turn your PDF publications into a flip-book with our unique Google optimized e-Paper software.
STAGE 5 - ASX*<br />
AUSTRALIAN STOCK EXCHANGE<br />
Australian has the world’s 3rd largest investment<br />
fund asset pool with over $1.6 trillion of funds<br />
and over 2,100 listed companies spread over<br />
a range of geographies and sectors. By freefloat<br />
market capitalisation the Australian Stock<br />
Exchange (ASX) ranks 2nd in Asia and 5th in the<br />
world, and consistently ranking in the world’s top<br />
5 exchanges for capital raising. It is a gateway to<br />
global capital given that 45% of investors on the<br />
ASX are international. 52,53<br />
TECH STOCKS<br />
In foreign developed markets technology is seen<br />
as a good investment option and an important<br />
hedge against disruptions to traditional sectors.<br />
In the US public market technology companies<br />
are very well established, with the ICT sector<br />
now making up 20% of the S&P 500 index - a<br />
larger sector than financials or healthcare. The<br />
NASDAQ Internet Index has returned 17.9% per<br />
annum over the past four years and is one of only<br />
two sectors rated Outperform by Schwab. 53<br />
In comparison the market capitalisation of<br />
Information technology companies listed on<br />
ASX represents only 0.8% of the ASX 200, and<br />
Telecommunications slightly more at 5.4%. This<br />
compares to financials comprising 47.7% of the<br />
ASX 200 (Aug 2015). 54<br />
However, investor interest in tech stocks, both<br />
small and large cap, is increasing with over 141<br />
technology and telecommunications companies<br />
listed on the ASX. Many Australian investors<br />
are looking to gain exposure to the technology<br />
sector, recognising that the industry breakdown<br />
in Australia is likely to trend towards other<br />
developed markets over time. The S&P/ASX 200<br />
Info Tech Indices has outperformed the S&P/<br />
ASX 200, with price returns over the last 10yrs<br />
of 8.53% compared to the benchmark S&P/ASX<br />
SMALL CAP FUNDING<br />
The ASX has a long history of funding and<br />
listing early stage companies, particularly those<br />
in the resource & energy sectors. But recently<br />
technology, media and telecommunications have<br />
been leading new listings with 47% of listings<br />
and 27% of all IPOs leading the listings by sector<br />
in the first half of 2015. Tech companies are also<br />
taking advantage of failing resources companies<br />
using these shell companies to facilitate Reverse<br />
Takeovers (RTO). 56<br />
WA <strong>STARTUP</strong> ASX LISTINGS<br />
This report identified 10 listings by early stage<br />
digital and internet technology companies based<br />
in Western Australia – all within the past 2 years.<br />
Raising a total of $49 million and an average of<br />
$4.9 million per company. Six of the ten have seen<br />
share prices increase since listing with 1-Page<br />
radically growing its share price over the 3 years<br />
since listing. Many are still in the research and<br />
development stage with almost all having revenue<br />
under $1 million per year in the 2015FY with<br />
the exception of Rewardle which recently began<br />
to monetise its merchant loyalty network. While<br />
it appears early for these startups to raise the<br />
challenges involved with raising within public<br />
markets and the downturn in resources conspire<br />
to create a situation where Reverse Listings are<br />
an attractive option for early stage technology<br />
companies.<br />
*Please note while we have included information<br />
about startups listing on the ASX as Stage 5 in<br />
the report, the current data shows these startups<br />
listing on the ASX at an earlier stage, especially<br />
in terms of revenue, than those in Stage 4 that are<br />
rasing money from Venture Capital firms. As far<br />
as we could identify those that raised money from<br />
Venture Capital firms had average revenue above<br />
the average revenue for listed startups.<br />
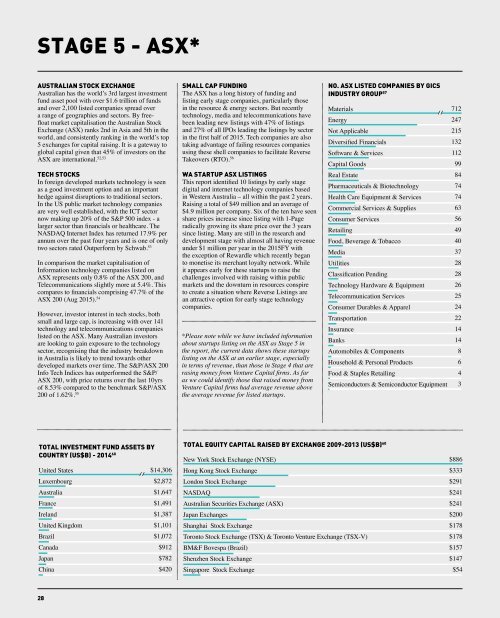
NO. ASX LISTED COMPANIES BY GICS<br />
INDUSTRY GROUP 57<br />
Materials<br />
712<br />
Energy<br />
247<br />
Not Applicable<br />
215<br />
Diversified Financials<br />
132<br />
Software & Services<br />
112<br />
Capital Goods<br />
99<br />
Real Estate<br />
84<br />
Pharmaceuticals & Biotechnology<br />
74<br />
Health Care Equipment & Services<br />
74<br />
Commercial Services & Supplies<br />
63<br />
Consumer Services<br />
56<br />
Retailing<br />
49<br />
Food, Beverage & Tobacco<br />
40<br />
Media<br />
37<br />
Utilities<br />
28<br />
Classification Pending<br />
28<br />
Technology Hardware & Equipment 26<br />
Telecommunication Services<br />
25<br />
Consumer Durables & Apparel<br />
24<br />
Transportation<br />
22<br />
Insurance<br />
14<br />
Banks<br />
14<br />
Automobiles & Components<br />
8<br />
Household & Personal Products<br />
6<br />
Food & Staples Retailing<br />
4<br />
Semiconductors & Semiconductor Equipment 3<br />
200 of 1.62%. 55 TOTAL EQUITY CAPITAL RAISED BY EXCHANGE 2009-2013 (US$B) 60 $886<br />
TOTAL INVESTMENT FUND ASSETS BY<br />
COUNTRY (US$B) - 2014 60<br />
United States<br />
$14,306<br />
Luxembourg<br />
$2,872<br />
Australia<br />
$1,647<br />
France<br />
$1,491<br />
Ireland<br />
$1,387<br />
United Kingdom<br />
$1,101<br />
Brazil<br />
$1,072<br />
Canada<br />
$912<br />
Japan<br />
$782<br />
China<br />
$420<br />
New York Stock Exchange (NYSE)<br />
Hong Kong Stock Exchange<br />
London Stock Exchange<br />
NASDAQ<br />
Australian Securities Exchange (ASX)<br />
Japan Exchanges<br />
Shanghai Stock Exchange<br />
Toronto Stock Exchange (TSX) & Toronto Venture Exchange (TSX-V)<br />
BM&F Bovespa (Brazil)<br />
Shenzhen Stock Exchange<br />
Singapore Stock Exchange<br />
$333<br />
$291<br />
$241<br />
$241<br />
$200<br />
$178<br />
$178<br />
$157<br />
$147<br />
$54<br />
28