Low-Carbon-Finance-for-the-State-of-Tamil-Nadu-Investments-Gaps-and-Barriers - Shakti Foundation

You also want an ePaper? Increase the reach of your titles
YUMPU automatically turns print PDFs into web optimized ePapers that Google loves.
<strong>Low</strong> <strong>Carbon</strong> <strong>Finance</strong> <strong>for</strong> <strong>the</strong> <strong>State</strong> <strong>of</strong> <strong>Tamil</strong> <strong>Nadu</strong>: <strong>Investments</strong>, <strong>Gaps</strong>, <strong>and</strong> <strong>Barriers</strong><br />
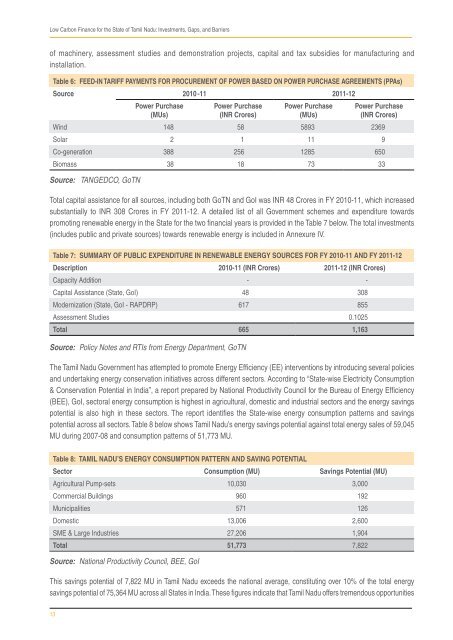
<strong>of</strong> machinery, assessment studies <strong>and</strong> demonstration projects, capital <strong>and</strong> tax subsidies <strong>for</strong> manufacturing <strong>and</strong><br />
installation.<br />
Table 6: Feed-in Tariff Payments <strong>for</strong> Procurement <strong>of</strong> Power based on Power Purchase Agreements (PPAs)<br />
Source 2010 -11 2011-12<br />
Power Purchase<br />
(MUs)<br />
Power Purchase<br />
(INR Crores)<br />
Power Purchase<br />
(MUs)<br />
Power Purchase<br />
(INR Crores)<br />
Wind 148 58 5893 2369<br />
Solar 2 1 11 9<br />
Co-generation 388 256 1285 650<br />
Biomass 38 18 73 33<br />
Source: TANGEDCO, GoTN<br />
Total capital assistance <strong>for</strong> all sources, including both GoTN <strong>and</strong> GoI was INR 48 Crores in FY 2010-11, which increased<br />
substantially to INR 308 Crores in FY 2011-12. A detailed list <strong>of</strong> all Government schemes <strong>and</strong> expenditure towards<br />
promoting renewable energy in <strong>the</strong> <strong>State</strong> <strong>for</strong> <strong>the</strong> two financial years is provided in <strong>the</strong> Table 7 below. The total investments<br />
(includes public <strong>and</strong> private sources) towards renewable energy is included in Annexure IV.<br />
Table 7: Summary <strong>of</strong> Public Expenditure in Renewable Energy Sources <strong>for</strong> FY 2010-11 <strong>and</strong> FY 2011-12<br />
Description 2010-11 (INR Crores) 2011-12 (INR Crores)<br />
Capacity Addition - -<br />
Capital Assistance (<strong>State</strong>, GoI) 48 308<br />
Modernization (<strong>State</strong>, GoI - RAPDRP) 617 855<br />
Assessment Studies 0.1025<br />
Total 665 1,163<br />
Source: Policy Notes <strong>and</strong> RTIs from Energy Department, GoTN<br />
The <strong>Tamil</strong> <strong>Nadu</strong> Government has attempted to promote Energy Efficiency (EE) interventions by introducing several policies<br />
<strong>and</strong> undertaking energy conservation initiatives across different sectors. According to “<strong>State</strong>-wise Electricity Consumption<br />
& Conservation Potential in India”, a report prepared by National Productivity Council <strong>for</strong> <strong>the</strong> Bureau <strong>of</strong> Energy Efficiency<br />
(BEE), GoI, sectoral energy consumption is highest in agricultural, domestic <strong>and</strong> industrial sectors <strong>and</strong> <strong>the</strong> energy savings<br />
potential is also high in <strong>the</strong>se sectors. The report identifies <strong>the</strong> <strong>State</strong>-wise energy consumption patterns <strong>and</strong> savings<br />
potential across all sectors. Table 8 below shows <strong>Tamil</strong> <strong>Nadu</strong>’s energy savings potential against total energy sales <strong>of</strong> 59,045<br />
MU during 2007-08 <strong>and</strong> consumption patterns <strong>of</strong> 51,773 MU.<br />
Table 8: <strong>Tamil</strong> <strong>Nadu</strong>’s Energy Consumption Pattern And Saving Potential<br />
Sector Consumption (MU) Savings Potential (MU)<br />
Agricultural Pump-sets 10,030 3,000<br />
Commercial Buildings 960 192<br />
Municipalities 571 126<br />
Domestic 13,006 2,600<br />
SME & Large Industries 27,206 1,904<br />
Total 51,773 7,822<br />
Source: National Productivity Council, BEE, GoI<br />
This savings potential <strong>of</strong> 7,822 MU in <strong>Tamil</strong> <strong>Nadu</strong> exceeds <strong>the</strong> national average, constituting over 10% <strong>of</strong> <strong>the</strong> total energy<br />
savings potential <strong>of</strong> 75,364 MU across all <strong>State</strong>s in India. These figures indicate that <strong>Tamil</strong> <strong>Nadu</strong> <strong>of</strong>fers tremendous opportunities<br />
13