Hydrofluorocarbon Emissions-Shakti Sustainable Energy Foundation
One such critically important category of gases is hydrofl uorocarbon (HFC). HFCs are potent greenhouse gases and are expected to contribute signifi cantly to global warming by 2050 (IPCC/TEAP, 2006; Velders et al., 2009; Gschrey et al., 2011; Miller & Kuijpers, 2011; Höglund-Isaksson et al., 2013). Read more information visit: http://shaktifoundation.in/report/indias-long-term-hydrofluorocarbon-hfc-emissions-detailed-cross-sectoral-analysis/
One such critically important category of gases is hydrofl uorocarbon (HFC). HFCs are potent greenhouse gases and are expected to contribute signifi cantly to global warming by 2050 (IPCC/TEAP, 2006; Velders et al., 2009; Gschrey et al., 2011; Miller & Kuijpers, 2011; Höglund-Isaksson et al., 2013). Read more information visit: http://shaktifoundation.in/report/indias-long-term-hydrofluorocarbon-hfc-emissions-detailed-cross-sectoral-analysis/

Create successful ePaper yourself
Turn your PDF publications into a flip-book with our unique Google optimized e-Paper software.
HFC
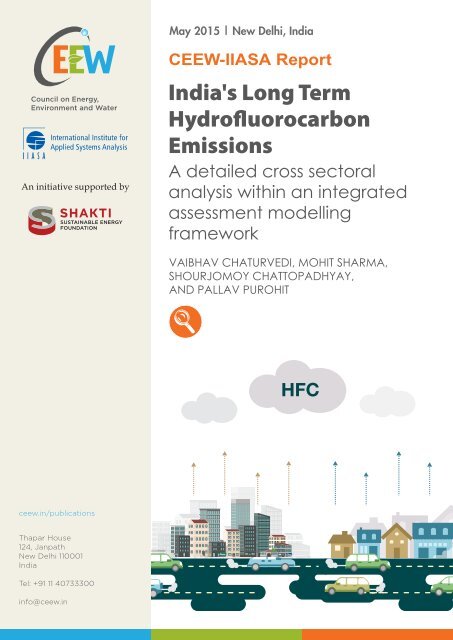
India's Long Term<br />
<strong>Hydrofluorocarbon</strong><br />
<strong>Emissions</strong><br />
A detailed cross sectoral analysis within an<br />
integrated assessment modelling framework<br />
VAIBHAV CHATURVEDI, MOHIT SHARMA,<br />
SHOURJOMOY CHATTOPADHYAY,<br />
AND PALLAV PUROHIT<br />
CEEW–IIASA Report<br />
May 2015<br />
ceew.in
Disclaimer<br />
Copyright © 2015 Council on <strong>Energy</strong>, Environment and Water (CEEW) and International Institute for Applied<br />
Systems Analysis (IIASA)<br />
All rights reserved. No part of this publication may be reproduced, stored in a retrieval system or transmitted, in<br />
any form or by any means, electronic, mechanical, photocopying, recording or otherwise, without prior permission.<br />
A report on ‘India’s Long Term <strong>Hydrofluorocarbon</strong> <strong>Emissions</strong>: A detailed cross sector analysis within an integrated<br />
assessment modelling framework’. This report is for private circulation only.<br />
The views expressed in this report are those of the authors and do not necessarily reflect the views and policies of<br />
CEEW and IIASA.<br />
The views/analysis expressed in this report/document do not necessarily reflect the views of <strong>Shakti</strong> <strong>Sustainable</strong><br />
<strong>Energy</strong> <strong>Foundation</strong>. The <strong>Foundation</strong> also does not guarantee the accuracy of any data included in this publication<br />
nor does it accept any responsibility for the consequences of its use.<br />
Editor: Vaibhav Chaturvedi<br />
<strong>Shakti</strong> <strong>Sustainable</strong> <strong>Energy</strong> <strong>Foundation</strong> works to strengthen the energy security of India by aiding the design and<br />
implementation of policies that support energy efficiency and renewable energy.<br />
The Council on <strong>Energy</strong>, Environment and Water (http://ceew.in/) is an independent, not-for-profit policy research<br />
institution. CEEW addresses pressing global challenges through an integrated and internationally focused approach.<br />
It does so through high quality research, partnerships with public and private institutions, and engagement with<br />
and outreach to the wider public. CEEW has been ranked as India’s top climate change think-tank two years in<br />
a row (ICCG Climate Think Tank Ranking). CEEW has been ranked best in India (and South Asia) in several<br />
categories two years running in the Global Go To Think Tank Index.<br />
The International Institute for Applied Systems Analysis (IIASA) is a non-governmental, multi-national, independent<br />
organization devoted to interdisciplinary, policy-oriented research focusing on selected aspects of environmental,<br />
economic, technological and social issues in the context of global change. IIASA’s research is organized around<br />
fields of policy importance rather than academic disciplines. IIASA investigators perform interdisciplinary research<br />
that combines methods and models from the natural and social sciences in addressing areas of concern for all<br />
societies. IIASA is well-known for energy, forestry, population, climate change, risk and vulnerability, adaptation<br />
and mitigation, technology, air pollution, land-use, and mathematical modelling. In this contract, IIASA will<br />
participate with its Mitigation of Air Pollutants and Greenhouse Gases (MAG) Programme.<br />
Council on <strong>Energy</strong>, Environment and Water<br />
Thapar House, 124, Janpath<br />
New Delhi 110001, India<br />
International Institute for Applied Systems Analysis<br />
Schlossplatz 1 - A-2361 Laxenburg, Austria
Acknowledgments<br />
We acknowledge the financial support provided by the <strong>Shakti</strong> <strong>Sustainable</strong> <strong>Energy</strong> <strong>Foundation</strong>, India to the Council<br />
on <strong>Energy</strong>, Environment and Water, India for leading this phase of research. We also thank Prof. P R Shukla (IIM<br />
Ahmedabad, India), Dr Sukumar Devotta (Former Director, NEERI, India), Prof. Amit Garg (IIM Ahmedabad,<br />
India) and Dr Arunabha Ghosh (CEEW, India) for agreeing to be a part of the steering committee to make our<br />
research policy relevant and give an overarching direction to the follow up steps. We thank Dr. Duraiswami (Ozone<br />
Cell, MoEFCC, India) and Prof. Radhey Aggarwal (Ozone Cell, MoEFCC) for commenting on our research through<br />
discussions and for highlighting critical issues for Indian policy as well as technical challenges faced by the Indian<br />
industry. We thank all the panellists who were a part of the HFC session at the CEEW conference “Negotiating<br />
the Climate Cliff: India’s Climate Policy and Intended Nationally Determined Contributions” organised on 3rd<br />
February 2015 for their useful comments.<br />
We express our sincere gratitude towards the representatives from Indian industry, residential and commercial<br />
air-conditioning manufacturers, auto industry, industry bodies, chemical manufacturers as well as other industry<br />
representatives for continuously engaging with us on the technical issues around India’s HFC consumption as well<br />
as providing us regular feedback on our methodological approach as well as technical assumptions. This study<br />
would not have been possible without their inputs and expertise. Various industry representatives from Association<br />
for Ammonia Refrigeration (AAR), Blue Star, Carrier, Daikin, Danfoss, DuPont, Honeywell, Ingersoll-Rand Trane,<br />
Indian Society of Heating, Refrigeration and Air-Conditioning Engineers (ISHRAE), Maruti, Refrigeration and<br />
Air-Conditioning Manufacturers’ Association (RAMA), Subros, SRF Chemicals, Society of Indian Automobile<br />
Manufacturers (SIAM), Tata Motors, Torro Cooling, Voltas, and Whirlpool have shared their useful insights<br />
with us at various industry roundtables. We also thank civil society organisations, especially CSE, CLASP, Fair<br />
Conditioning, TERI, TERRE Policy Centre, and WWF-India for participating in our HFC focused discussions.<br />
Finally, we thank Indian and international civil society experts, particularly Dr Stephen Anderson (IGSD, USA),<br />
Ms Anjali Jaiswal (NRDC, USA), Mr Bhaskar Deol and Ms Nehmat Kaur (NRDC, India), for providing their<br />
perspectives on policy and technical issues relevant to the HFC debate in India through regular discussions.
About CEEW<br />
The Council on <strong>Energy</strong>, Environment and Water (http://ceew.in/) is an independent, not-for-profit policy research<br />
institution. CEEW addresses pressing global challenges through an integrated and internationally focused approach.<br />
It does so through high quality research, partnerships with public and private institutions, and engagement<br />
with and outreach to the wider public.<br />
CEEW has been ranked as India’s top climate change think-tank two years in a row (ICCG Climate Think Tank<br />
Ranking). The Global Go To Think Tank Index has ranked CEEW as<br />
1 st in India among ‘Top Think Tanks with Annual Operating Budgets of Less Than $ 5 Million USD’ (2013,<br />
2014 also first in South Asia; 14 th globally)<br />
<br />
Ist in India for ‘Best Institutional Collaboration’ involving two or more think tanks (2013, 2014 also first in<br />
South Asia)<br />
Ist in India for ‘Best Policy Study/Report’ for its study on India’s National Water Resources Framework (2013)<br />
In four years of operations, CEEW has engaged in more than 70 research projects, published more than 40 peerreviewed<br />
policy reports and papers, advised governments around the world over 80 times, engaged with industry<br />
to encourage investments in clean technologies and improve efficiency in resource use, promoted bilateral and<br />
multilateral initiatives between governments on more than 30 occasions, helped state governments with water and<br />
irrigation reforms, and organised more than 80 seminars and conferences.<br />
CEEW’s major completed projects: 584-page National Water Resources Framework Study for India’s 12th Five<br />
Year Plan; India’s first report on global governance, submitted to the National Security Adviser; foreign policy<br />
implications for resource security; India’s power sector reforms; first independent assessment of India’s solar mission;<br />
India’s green industrial policy; resource nexus, and strategic industries and technologies for India’s National<br />
Security Advisory Board; $125 million India-U.S. Joint Clean <strong>Energy</strong> R&D Centers; business case for phasing<br />
down HFCs; geoengineering governance (with UK’s Royal Society and the IPCC); decentralised energy in India;<br />
energy storage technologies; Maharashtra-Guangdong partnership on sustainability; clean energy subsidies (for<br />
the Rio+20 Summit); reports on climate finance; financial instruments for energy access for the World Bank; irrigation<br />
reform for Bihar; multi-stakeholder initiative for urban water management; Swachh Bharat; environmental<br />
clearances; nuclear power and low-carbon pathways; and electric rail transport.<br />
CEEW’s current projects include: the Clean <strong>Energy</strong> Access Network (CLEAN) of hundreds of decentralised clean<br />
energy firms; the Indian Alliance on Health and Pollution; low-carbon rural development; modelling long-term<br />
energy scenarios; modelling energy-water nexus; coal power technology upgradation; India’s 2030 renewable energy<br />
roadmap; energy access surveys; energy subsidies reform; supporting India’s National Water Mission; collective<br />
action for water security; business case for energy efficiency and emissions reductions; assessing climate risk;<br />
modelling HFC emissions; advising in the run up to climate negotiations (COP-21) in Paris.
About IIASA<br />
The International Institute for Applied Systems Analysis (IIASA) is a non-governmental, multi-national, independent<br />
organization devoted to interdisciplinary, policy-oriented research focusing on selected aspects of environmental,<br />
economic, technological and social issues in the context of global change. IIASA’s research is organized<br />
around fields of policy importance rather than academic disciplines. IIASA investigators perform interdisciplinary<br />
research that combines methods and models from the natural and social sciences in addressing areas of concern<br />
for all societies. IIASA is well-known for energy, forestry, population, climate change, risk and vulnerability, adaptation<br />
and mitigation, technology, air pollution, land-use, and mathematical modelling. In this contract, IIASA will<br />
participate with its Mitigation of Air Pollutants and Greenhouse Gases (MAG) Programme.<br />
The MAG programme employs IIASA’s expertise in applied interdisciplinary research to develop innovative modelling<br />
tools to identify strategies to protect the local, regional and global atmosphere while imposing least burden<br />
on economic development. MAG’s work brings together geo-physical and economic aspects of pollution control<br />
into one assessment framework and implements it – together with a network of collaborators - for practical policy<br />
analyses in different regions of the world. MAG’s systems approach is framing new policies that maximize cobenefits<br />
between air quality management, greenhouse gas mitigation and other policy priorities.<br />
IIASA, with its GAINS model, hosts the Centre for Integrated Assessment Modelling (CIAM) of the European<br />
Monitoring and Evaluation Programme (EMEP) under the Convention on Long-range Transboundary Air Pollution.<br />
It conducted the integrated assessment modelling analyses that supported numerous protocols under the<br />
Convention. For the European Commission, IIASA provided key integrated modelling capacity for the National<br />
<strong>Emissions</strong> Ceilings Directive in 1999, the Clean Air For Europe (CAFÉ) programme (2000-2004), the Thematic<br />
Strategy and Air Pollution (2005) and the revision of the National Emission Ceilings Directive (up to 2011). Since<br />
2005, IIASA coordinates the ‘European Consortium for Air Pollution and Climate Strategies’ (EC4MACS), a<br />
LIFE+ funded project which brought together and integrated modelling expertise from key sectors into a coherent<br />
assessment framework. Furthermore, IIASA staff is routinely involved in numerous Task Forces under the Convention<br />
on Long-range Transboundary Air Pollution, inter alia in the Task Force on Integrated Assessment Modelling,<br />
the Task Force on Hemispheric Transport, the Task Force on Emission Inventories and Projections, the Task Force<br />
on Reactive Nitrogen, the Task Force on Health, the Task Force on Modelling and Monitoring, and the Working<br />
Group on Effects and the Expert Group on Techno-Economic Issues (EGTEI).<br />
In the 1990s, the Air Pollution Program developed RAINS-Asia to address the scope and cost-effectiveness of SO2<br />
reductions in 23 Asian countries. The GAINS-Asia project extended this work to greenhouse gases. Scientists in<br />
many nations use GAINS as a tool to assess emission reduction potentials in their regions. For the negotiations<br />
under the United Nations Framework Convention on Climate Change (UNFCCC), a special version of GAINS<br />
has been developed to compare greenhouse gas mitigation efforts among the Annex-I countries. GAINS is now<br />
implemented for the whole world, distinguishing 165 regions including 48 European countries, 33 provinces in<br />
China and 23 states/regions in India. The GAINS model is also available at http://gains.iiasa.ac.at.<br />
IIASA has vast experience in the coordination of consortia and demonstrably implemented those projects successfully.
About the Authors<br />
DR VAIBHAV CHATURVEDI<br />
MOHIT SHARMA<br />
Dr Vaibhav Chaturvedi is a Research Fellow<br />
at Council on <strong>Energy</strong>, Environment and Water<br />
(CEEW). Prior to CEEW, Vaibhav worked as a Post<br />
Doctoral Research Associate at the Joint Global<br />
Change Research Institute (JGCRI), collaboration<br />
between the Pacific Northwest National Laboratory,<br />
USA and the University of Maryland, College<br />
Park, USA. He holds a PhD in Economics from the<br />
Indian Institute of Management Ahmedabad, India<br />
and Masters in Forest Management from the Indian<br />
Institute of Forest Management Bhopal, India.<br />
His research is focused on Indian and global energy<br />
and climate change mitigation policy issues- carbon<br />
dioxide emission stabilization pathways, low<br />
carbon and sustainable energy policies, modelling<br />
energy demand, and water-energy nexus within the<br />
integrated assessment modelling framework of the<br />
Global Change Assessment Model (GCAM). Vaibhav’s<br />
recent work includes analyzing nuclear energy<br />
scenarios for India, Indian HFC emission scenarios,<br />
climate policy-agriculture water interactions,<br />
transportation energy scenarios, model evaluation,<br />
investment implications for the global electricity<br />
sector, and modelling the building sector energy demand<br />
scenarios for India. Vaibhav has been actively<br />
involved in global model comparison exercises like<br />
Asian Modelling Exercise (AME) and <strong>Energy</strong> Modelling<br />
Forum (EMF).<br />
At CEEW, Vaibhav’s research focuses on India within<br />
the domain of energy and climate policy, midrange<br />
and long-range energy scenarios, HFC emission<br />
scenarios, urban energy demand pathways,<br />
and energy-water inter relationship. He has been<br />
actively publishing in leading international energy<br />
and climate policy journals.<br />
Mohit Sharma is a Junior Research Associate at<br />
the Council on <strong>Energy</strong>, Environment and Water<br />
(CEEW). His research interests include sustainable<br />
energy, climate research and improvements in urban<br />
ecosystem. He has developed the bottom up <strong>Hydrofluorocarbon</strong>-HFC<br />
emissions module for modelling<br />
long term HFC emissions. His focus area of work<br />
at CEEW is urban sustainability and addressing the<br />
urban challenges through an integrated approach.<br />
He also shares his knowledge on energy systems’<br />
modelling and optimisation for developing energy<br />
modelling capabilities at CEEW.<br />
Mohit graduated from Technical University of Denmark-DTU<br />
with two years’ Master in <strong>Sustainable</strong><br />
<strong>Energy</strong>. A major part of his master’s programme,<br />
he spent learning and solving practical problems,<br />
at DTU-Risø National Laboratory for <strong>Sustainable</strong><br />
<strong>Energy</strong>. He has worked as Research Assistant with<br />
DTU and on other short-term research projects with<br />
Danish industry. During this period, he worked on<br />
thermodynamic modelling of transcritical CO 2<br />
system<br />
for cooling applications, life cycle assessment<br />
of products and feasibility of solar-thermal driven<br />
cooling cycle for residential applications.<br />
Prior to his post graduation, he has close to two<br />
years of work experience in process industry including<br />
project management for new process plants and<br />
operational optimisation for industrial processes.<br />
Mohit holds a degree in Chemical Engineering from<br />
National Institute of Technology. Before joining<br />
CEEW, Mohit briefly volunteered with CSE to prepare<br />
framework for national energy modelling.
SHOURJOMOY CHATTOPADHYAY<br />
DR PALLAV PUROHIT<br />
Shourjomoy Chattopadhyay is a Research Analyst<br />
at the Council on <strong>Energy</strong>, Environment and Water<br />
(CEEW). His current research focus is on long term<br />
HFC emission scenarios for mitigation policies as well<br />
as on challenges related to businesses and manufacturers.<br />
He also works on issues related to water and<br />
urban sustainability<br />
He holds a Master’s degree in Environmental Studies<br />
and Resources Management from The <strong>Energy</strong> and<br />
Resources Institute (TERI) University, Delhi and a<br />
Bachelor’s degree in Physics from Kirori Mal College,<br />
University of Delhi. He did his major dissertation with<br />
Massachusetts Institute of Technology (MIT), USA.<br />
The project was titled “Assessment of Industrial Symbiosis<br />
in Muzaffarnagar”. The work was concentrated<br />
over an industrial cluster of brick, paper, steel and sugar<br />
industries. The focus of the study was to highlight<br />
the contribution of Small and Medium Enterprises<br />
(SMEs) in the path towards industrial sustainability.<br />
The research is presently being elaborated for a publication<br />
in a relevant journal.<br />
Before joining CEEW he was associated with an effort<br />
to train engineering students for innovation and entrepreneurship<br />
across small towns of India. In the past he<br />
has been actively involved with the National Service<br />
Scheme (NSS) in community upliftment, awareness,<br />
health and education work in the National Capital<br />
Region (NCR).<br />
Dr Pallav Purohit joined the Mitigation of Air Pollution<br />
and Greenhouse Gases (MAG) Program as a Research<br />
Scholar in September 2007. He has developed<br />
and implemented the global F-gas (HFC, PFC and SF6<br />
emissions) module in the Greenhouse Gas and Air Pollution<br />
Interactions and Synergies (GAINS) model and<br />
coordinating various policy applications involving<br />
GAINS model in developing countries. Before joining<br />
IIASA, Dr. Purohit worked as a Postdoctoral Research<br />
Fellow at the Research Program on International Climate<br />
Policy, Hamburg Institute of International Economics<br />
(HWWI), Germany where his focus was on a<br />
detailed technical evaluation of renewable energy options<br />
towards a more policy oriented analysis of the<br />
chances and risks of such technologies under the Clean<br />
Development Mechanism of the Kyoto Protocol. He<br />
was also a visiting faculty member to the Institute of<br />
Political Science at the University of Zurich, Switzerland<br />
and visiting fellow at the School of International<br />
Development, University of East Anglia, UK.<br />
He is an Associate Editor for the International Journal<br />
of Global <strong>Energy</strong> Issues (IJGEI) and editorial board<br />
member of Sustainability, Innovative <strong>Energy</strong> Policies,<br />
Journal of Environment & Agricultural Studies, Journal<br />
of Renewable <strong>Energy</strong>, American Journal of Electrical<br />
Power & <strong>Energy</strong> Systems (EPES), International<br />
Journal of <strong>Sustainable</strong> and Green <strong>Energy</strong>, and The<br />
Open Renewable <strong>Energy</strong> Journal (TOREJ).<br />
Dr. Purohit received his MSc in Physics from the<br />
H.N.B. Garhwal University, India in 1998 and his PhD<br />
in <strong>Energy</strong> Policy and Planning from the Indian Institute<br />
of Technology (IIT) Delhi in 2005. Between 1999<br />
and 2005, Dr. Purohit worked at several institutions<br />
in India with a particular focus on energy, economic<br />
and environmental interactions. In 2005, he received<br />
the two year e8 Postdoctoral Research Fellowship on<br />
<strong>Sustainable</strong> <strong>Energy</strong> Development from the Global <strong>Sustainable</strong><br />
Electricity Partnership.
Contents<br />
Executive Summary<br />
i<br />
1. Introduction 1<br />
2. Methodological Approach 3<br />
2.1 Modelling <strong>Energy</strong> Service Demands Across Sectors 3<br />
2.2 Methodology for Estimating Direct <strong>Emissions</strong> across Sectors 5<br />
2.2.1 HFC Demand for Manufacturing and Operational <strong>Emissions</strong> 7<br />
2.2.2 Servicing <strong>Emissions</strong> and Demand for HFCs 9<br />
2.2.3 End-of-Life <strong>Emissions</strong> and Recovery 10<br />
2.3 Data and Assumptions for <strong>Emissions</strong> calculations 11<br />
2.3.1 Residential Air-conditioning 11<br />
2.3.2 Domestic Refrigeration 12<br />
2.3.3 Commercial Air-Conditioning 13<br />
2.3.4 Commercial Refrigeration 15<br />
2.3.5 Passenger Transportation 17<br />
2.3.6 Freight Transportation 19<br />
2.3.7 Refrigerated goods 19<br />
2.3.8 Industrial Sectors 20<br />
3. Results at the Sectoral Level 24<br />
3.1 <strong>Emissions</strong> from Residential Sector: Air-Conditioners and Refrigerators 24<br />
3.2 <strong>Emissions</strong> from Commercial Sector: Air-Conditioners and Refrigerators 26<br />
3.3 <strong>Emissions</strong> from Mobile Air-Conditioning: Passenger Cars, Buses and Railways 28<br />
3.4 Freight Transport <strong>Emissions</strong> 30<br />
3.5 <strong>Emissions</strong> from Industrial Sectors and Refrigerated Transport 31<br />
4. Overall HFC <strong>Emissions</strong> and Carbon Dioxide <strong>Emissions</strong> 33<br />
5. Sensitivity Analysis: Economic Growth and Leakage Rates 35<br />
6. Estimates of Consumption of HFCs 37<br />
7. Implications of the Indian Amendment Proposal 39<br />
8. Limitations and Future Research 41<br />
8.1 Limitations 41<br />
8.2 Future Research 42<br />
References 44<br />
CEEW Publications 49
i<br />
Executive Summary<br />
India is following the Hydrochlorofluorocarbon Phaseout Management Plan (HPMP) as part of its international<br />
commitment under the Montreal Protocol to mitigate consumption of ozone depleting substances. This transition<br />
is almost complete in developed countries. However, the phaseout of Hydrochlorofluorocarbons (HCFCs)<br />
has largely resulted in a transition towards <strong>Hydrofluorocarbon</strong>s (HFCs), which are potent greenhouse gases.<br />
Within India, almost all refrigeration and air-conditioning systems produced and marketed use HCFC-22. The<br />
impending transition away from HCFCs would in all probability lead to higher consumption and emission of<br />
HFCs in India.<br />
If India moves towards HFCs across sectors, there will be significant increase in the emissions of HFCs. However,<br />
the pace and magnitude of these emissions is not well understood. The Council on <strong>Energy</strong>, Environment and<br />
Water (CEEW, India) along with the International Institute for Applied Systems Analysis (IIASA, Austria) has<br />
initiated joint research to address this research gap. The research aims at understanding the following research<br />
questions:<br />
a) What will be the global warming impact of high GWP HFC emissions from the residential, commercial,<br />
transportation and industrial sectors in India under the business-as-usual (BAU) or reference scenario?<br />
b) What is the techno-economic feasibility of India adopting aggressive domestic policy measures to transition<br />
away from HFC emissions across sectors, given India’s current development context?<br />
c) What is the maximum feasible reduction possible across HFC emission sectors based on the advanced control<br />
technologies/options (ACT) available globally and what is the cost optimal strategy for the same? Can<br />
India leapfrog high-GWP HFCs immediately?<br />
d) What are the implications of a global deal on HFCs as per proposed MP amendments?<br />
This report focuses on the first research question, that is establishing the ‘Business as Usual’ or ‘Reference’ scenario<br />
for understanding the magnitude of HFC emissions across sectors until 2050. We undertake this analysis<br />
within the integrated assessment modelling framework of Global Change Assessment Model (GCAM). GCAM<br />
models key energy service demands like cooling energy, refrigeration, as well as transportation. GCAM output<br />
informs us about the penetration of residential air-conditioning and refrigeration, commercial air-conditioning<br />
and refrigeration, and transportation modes like cars, buses, etc. We then develop a bottom up HFC calculation<br />
module to estimate long term HFC emissions based on output from GCAM. Our estimation process ensures<br />
that we meet the HPMP phase out targets in our reference scenario. We also model emissions for three key<br />
industrial sectors: foams, aerosols and solvents. The second phase of this research will focus on the next set of<br />
questions and aims at understanding the mitigation potential across sectors and potential cost of a transition<br />
away from HFCs. This analysis will be undertaken with the framework of Greenhouse Gas and Air Pollution<br />
Interaction and Synergies (GAINS) model, IIASA’s in-house model. One important element in our research has<br />
been continuous engagement with industry and civil society stakeholders. The industry experts have informed<br />
our technical assumptions as well as given feedback on the initial findings from our research. The civil society<br />
experts have given feedback on our modelling approach as well as key policy issues and challenges relevant for<br />
the HFC debate within India.<br />
We find that with economic growth and increasing per-capita incomes, more and more people will buy air-conditioners,<br />
refrigerators, as well as personal vehicles. Higher penetration of all these technologies in the residential
ii<br />
and commercial sectors forms the key driver of higher consumption and emission of HFCs. If HFC’s consumption<br />
is not phased down, total HFC emissions will increase to 500 MtCO 2<br />
-eq in 2050. This is based on the assumption<br />
that HFCs used as alternatives in developed countries will replace HCFCs in India as well. The biggest share of<br />
HFC emissions will be taken up by the residential and commercial cooling sectors (~35 % and ~28% respectively<br />
in 2050), followed by mobile air-conditioning in cars (~15%), and then commercial refrigeration (14%). All other<br />
sectors put together will have a low share in India’s total HFC emissions, which is consistent with findings from<br />
other international assessments.<br />
Figure ES1: India’s long term HFC emissions across sectors<br />
600<br />
HFC emissions across sectors<br />
Solvents<br />
Foams<br />
<strong>Emissions</strong> in MtCO2-eq<br />
500<br />
400<br />
300<br />
200<br />
Aerosols<br />
Transport Refrigeration<br />
Freight Trucks<br />
Mobile AC- Railways<br />
Mobile AC- Buses<br />
Mobile AC- Cars<br />
Commercial Refrigeration<br />
100<br />
Residential Refrigeration<br />
Commercial Cooling<br />
Source: CEEW analysis<br />
0<br />
2010 2015 2020 2025 2030 2035 2040 2045 2050<br />
Residential Cooling<br />
The HFC debate is part of a wider climate policy debate, and hence it becomes important to place India’s potential<br />
future HFC emissions in the context of India’s long term carbon dioxide emissions. We compare HFC and carbon<br />
dioxide emissions sector by sector and also present overall country level comparisons. At the sector level this<br />
means that we compare the indirect emissions from energy use in respective sectors with direct HFC emissions. We<br />
find that the share of global warming impact of HFC emissions compared to carbon dioxide emissions in 2050 is<br />
highest for the commercial refrigeration sector, at 50%, which is mainly due to the high leakage rates experienced<br />
in this sector. This is followed by the commercial cooling sector and then residential cooling sector, and the share of<br />
HFC’s global warming impact is over one-third for both these sectors in 2050. For mobile air-conditioning in cars,<br />
this figure stands at 22%. For all other sectors this share is fairly low. In terms of HFC’s contribution to India’s<br />
overall greenhouse gas emissions, HFCs contribute 5.4% of India’s combined carbon dioxide and HFC emission<br />
related global warming impact in 2050. The cumulative global warming impact of HFC emissions in India’s total<br />
carbon dioxide and HFC emissions between 2015 and 2050 is 3.9%.<br />
Figure ES 2: Share of global warming impact of HFC emission in sectoral GHG emissions in 2050<br />
Source: CEEW analysis
India’s Long Term Hydrofl uorocarbon <strong>Emissions</strong><br />
iii<br />
We also undertake sensitivity analysis on economic growth as well as leakage rates, which are the key variables<br />
determining our results. We find that for a lower economic growth scenario, India’s HFC emissions will be 324<br />
MtCO 2<br />
-eq in 2050, and this figure is 35% lower compared to our Reference scenario HFC emissions. However,<br />
the share of India’s HFC emissions in the combined global warming impact of carbon dioxide and HFC emissions<br />
will still be 5.5% in 2050, which is similar to our reference case results. When we do sensitivity analysis on leakage<br />
rates, we find that relative to the reference leakage rate scenario, total HFC emissions in 2050 increase by 29% in<br />
the high leakage rate scenario, and decrease by 39% in the low leakage rate scenario and total emissions vary from<br />
307 MtCO 2<br />
-eq to 645 MtCO 2<br />
-eq in 2050 depending on the assumptions around leakage rate.<br />
With the help of our modelling based estimates of India’s long term HFC emissions, and the targets of phasing<br />
down India’s HFC consumption as expressed in India’s amendment proposal to the Montreal Protocol, we can<br />
estimate the potential of HFC emissions avoided if the Indian amendment proposal is accepted. Looking at emissions<br />
only until 2050 and assuming a linear phase-down schedule post the freeze in HFC consumption in 2030-31,<br />
the authors find that 4.2 GtCO 2<br />
-eq. is avoided between 2010 and 2050, which is 64% of the total HFCs that will<br />
be emitted between 2010 and 2050 if consumption is not frozen. Between 2050 and 2100, however, avoided HFC<br />
emissions amount to almost 41 GtCO 2<br />
-eq. We also discuss consumption of HFCs across some important sectors,<br />
and conclude our discussions by noting the limitations of our research as well as key issues for future research.<br />
Since detailed sector-by-sector analysis of India’s long-term HFC emissions has not been conducted so far, our research<br />
is an important contribution to the literature. In the next steps of our research, we seek to have a deeper understanding<br />
of potential cost effective ways and strategies for mitigating HFC emissions in India and the maximum<br />
feasible reduction potential across sectors. Through our research, we hope to contribute to India’s HFC emission<br />
mitigation policy, as well as larger GHG policy choices amid international climate negotiations.
India’s Long Term Hydrofl uorocarbon <strong>Emissions</strong><br />
1<br />
1. Introduction<br />
Policies for mitigating greenhouse gas (GHG) emissions for addressing global warming and climate change<br />
impact concerns are an important agenda in the current international discourse. Proposed policies range<br />
from supply side fuel switching options, to demand side management, to technology interventions related<br />
to geo-engineering strategies. A large part of action happening on the emission mitigation front is focused<br />
on mitigating carbon dioxide (CO 2<br />
). Non-CO 2<br />
gases however are also important, and this importance will<br />
keep on growing as the low cost carbon mitigation options start getting exhausted (Höglund-Isaksson et<br />
al., 2012). One such critically important category of gases is hydrofluorocarbon (HFC). HFCs are potent<br />
greenhouse gases and are expected to contribute significantly to global warming by 2050 (IPCC/TEAP,<br />
2006; Velders et al., 2009; Gschrey et al., 2011; Miller & Kuijpers, 2011; Höglund-Isaksson et al., 2013).<br />
The key underlying activity drivers for increased usage of HFCs is their use as refrigerants in air-conditioners<br />
and refrigerators, and in industrial processes as solvents and foaming agents. Cleaner alternatives for HFCs<br />
with much lower GWPs are already in the market though with limited penetration due to a variety of issues.<br />
With the right mitigation strategy and policy incentives, HFC emissions can be decoupled from the growth<br />
in underlying activities, and different sectors can move towards low global warming potential (GWP) alternatives.<br />
India is expected to be a big contributor to future global GHG emissions. The proposed high impact policies<br />
for GHG emission mitigation are primarily on the supply side and focus either on increasing share of renewable<br />
energy, or increased reliance on nuclear energy. All the energy supply side strategies are by their nature<br />
focused on carbon dioxide, rather than HFCs, which are emitted mainly in the end use sectors- residential<br />
and commercial, transportation, and industrial sectors. With more and more people buying residential and<br />
commercial air conditioners (ACs) and air-conditioned vehicles, and a growing industry, the rate of HFC<br />
emissions will further increase in absence of any focused abatement policies. With continued strong increase<br />
in demand the release of HFCs is expected to increase manifold until 2050 (Akpinar-Ferrand & Singh,<br />
2010).<br />
Majority of refrigeration and air-conditioning systems produced and marketed in India today use HCFC-22,<br />
which is an ozone-depleting substance scheduled for phase-out under the Montreal Protocol. The current<br />
HCFC schedule for developing countries requires a freeze in consumption by January 2013 at 2009-10 average<br />
and cutting national consumption (domestic HCFC production, plus imports and minus exports) 10<br />
percent by 2015, 35 percent by 2020, 67.5 percent by 2025, and 97.5 percent by 2030, with consumption<br />
after 2030 restricted to the servicing of refrigeration and air-conditioning equipment. By 2040, HCFC production<br />
and consumption for refrigerant uses will completely cease. Most Indian companies have reported<br />
that they are planning to change from HCFC-22 refrigerant to R-410a (a blend of HFC-125 and HFC-32),<br />
which has a GWP of 2088 (NRDC et al., 2013). Substitution of HCFC-22 by HFCs with high GWPs (e.g.,<br />
R-410a or HFC-134a) will significantly increase the overall contribution of HFCs in India’s national GHG<br />
emissions. In contrast, replacement with existing alternatives to HFCs could reduce the global warming potential<br />
by up to 80-90 percent until 2050 (Purohit & Höglund-Isaksson, 2012). Therefore, policies and cost<br />
effective strategies for mitigation of HFCs are important issues for deliberation for India.<br />
At present, India is in the early stages of phasing out HCFCs as per the revised Montreal Protocol. Due to the<br />
significantly high GWP of conventional alternatives like HFCs, it is critically important to understand the
2<br />
Introduction<br />
growth in HFC emissions if no actions are taken to replace these in the different activities, and find the potential<br />
and associated costs for HFC reduction from different sectors. India has raised some concerns at multilateral<br />
forums regarding the availability of techno-economically feasible alternatives to HFCs for any action aimed at<br />
reducing HFC emissions in India. The final outcome of this research is to model alternative HFC mitigation<br />
scenarios to understand the transition cost and cost effective mitigation pathway. This report sets up the detailed<br />
reference (or business as usual- BAU) scenario for emissions across various HFC emission sectors as the initial<br />
step for moving towards the final outcome of this research. Throughout the report, BAU and Reference scenario<br />
have been used interchangeably.<br />
Understanding growth of underlying service demands and technologies is the basis for understanding of growth<br />
in HFC emissions. HFCs are expected to be emitted across a variety of sectors. This document focuses on the<br />
sectors that are expected to be large contributors to Indian HFC emissions if HCFCs are replaced by HFCs. The<br />
methodological formulation and key assumptions are discussed in Section 2. The analysis has been undertaken<br />
within the framework of Global Change Assessment Model (GCAM). The next section on result discusses energy<br />
consumption, HFC emissions, and carbon dioxide emissions across various sectors. Section 4 then compiles all<br />
this information and gives the larger country level perspective on future long term HFC emissions for India and<br />
compares this with India’s carbon dioxide emissions. Section 5 discusses our results of sensitivity analysis on<br />
economic growth and leakage rates. Section 6 presents our estimates of future demand of HFCs across different<br />
sectors. This is followed by our analysis on the implications of India’s amendment proposal to the Montreal<br />
Protocol presented in Section 7. We then present some limitations of our study as well as key issues for future<br />
research.
India’s Long Term Hydrofl uorocarbon <strong>Emissions</strong><br />
3<br />
2. Methodological Approach<br />
2.1 Modelling <strong>Energy</strong> Service Demands Across Sectors<br />
The reference scenario emissions are developed within the integrated assessment modelling framework of Global<br />
Change Assessment Model (GCAM, IIM Ahmedabad version) developed at the Joint Global Change Research<br />
Institute, USA. For the next leg of this research, alternative HFC emissions mitigation scenarios will be analysed<br />
within the framework of the Greenhouse Gas and Air Pollution Interaction and Synergies (GAINS) model, developed<br />
at the International Institute for Applied Systems Analysis (IIASA), Austria.<br />
GCAM is an energy sector focused integrated assessment model incorporating complex interactions between the<br />
energy, land use, and climate systems. The model is global in scale and GCAM-IIM version used in this study comprises<br />
of 14 aggregate world regions with India as a separate region, and models energy and emissions in 5 year<br />
time steps from 2005 to 2095. GCAM has been extensively used for scenarios regarding long term energy consumption<br />
and emissions, energy technology strategy analysis, land-use change and emissions, bio-energy, etc. The<br />
top down modelling framework of GCAM includes modelling of end use services in the building, transportation<br />
and industrial sectors. For details and model structure of GCAM and specific research applications, please refer<br />
Edmond & Reilly, 1983; Clarke & Edmonds, 1993; Clarke, et al., 2007; Clarke, et al., 2008; Krey, et al., 2012;<br />
Shukla & Chaturvedi, 2012; Shukla & Chaturvedi, 2013; Chaturvedi, et al., 2013; Hejazi, et al., 2013; Zhou, et<br />
al., 2013; Chaturvedi & Shukla, 2014; Chaturvedi, et al., 2015.<br />
Figure 1: Coupling of top down modelling framework with bottom up HFC calculation module<br />
Source: CEEW analysis
4<br />
Methodological Approach<br />
Details of the residential and commercial building sector module of GCAM can be found in Eom, et al., 2012 and<br />
Chaturvedi, et al., 2014. Details of the transportation sector module of GCAM can be found in Kyle & Kim, 2011<br />
and Mishra, et al., 2013. For the freight transportation sector, we have taken the estimates of total freight demand<br />
from GCAM, and divided that between rail and road freight transport based on NTPDC (2013). The current<br />
share of road based freight transport is 70%, and we have used this share for up to 2050. Thus in absolute terms<br />
both rail and road freight increase, though their share remains constant.<br />
GCAM estimates service demand for residential and commercial cooling, residential and commercial refrigeration,<br />
and for different travel modes in the transportation sector. On the basis of other technology level assumptions,<br />
we first derive the actual number of units of different technologies for the base year as well as the future. We then<br />
apply information on HFC charge rates and leakage rates to estimate HFC emissions from different sectors. Figure<br />
1 provides an overview of the selected methodology.<br />
India’s GDP is expected to grow significantly owing to a low base. Our assumptions of India’s GDP growth are<br />
based on India’s integrated energy policy report (GoI, 2006), which assumes an average growth rate of 8% between<br />
2007 and 2032, as well as the current expectations of India’s near term GDP growth. Beyond this period,<br />
the GDP growth keeps on decreasing. India’s GDP increases to 3.6 Trillion USD in 2025 and 18.3 Trillion USD in<br />
2050 (in 2010 prices). Population grows from 1.13 billion in 2005 to 1.53 billion in 2050. In terms of per capita<br />
income, India’s income grows from less than 1,100 USD in 2010 to 1,900 USD in 2020 and 12,000 USD in 2050<br />
(all prices are in 2010 USD), which is very low compared to current per capita incomes in the developed countries.<br />
Table 1: GDP growth and population assumptions<br />
GDP Growth Rate (%/annum)<br />
Population (Billions)<br />
Year Reference Growth Scenario Low Growth Scenario Year<br />
2010-20 7.22 6.11 2020 1.309<br />
2020-30 7.28 5.77 2030 1.403<br />
2030-40 6.84 5.32 2040 1.477<br />
2040-50 6.26 4.75 2050 1.531<br />
Source: CEEW assumptions<br />
Along with the growth assumptions that we include for our Reference case, we also explore the implications of<br />
a low economic growth scenario for India’s HFC emissions. The GDP assumptions for both scenarios have been<br />
summarised in Table 1.<br />
The GAINS model, developed by the International Institute for Applied Systems Analysis (IIASA) will be used for estimating<br />
state level HFC emission pathways and HFC mitigation policy scenario and strategies in the next phase of this<br />
research. GAINS describes the pathways of atmospheric pollution from anthropogenic driving forces to the most relevant<br />
environmental impacts. It brings together information on future economic, energy and agricultural development,<br />
emission control potentials and costs, atmospheric dispersion and environmental sensitivities toward air pollution. The<br />
model addresses threats to human health posed by fine particulates and ground-level ozone, risk of ecosystems damage<br />
from acidification, excess nitrogen deposition (eutrophication) and exposure to elevated levels of ozone, as well as longterm<br />
radiative forcing. These impacts are considered in a multi-pollutant context, quantifying the contributions of sulfur<br />
dioxide (SO 2<br />
), nitrogen oxides (NO x<br />
), ammonia (NH 3<br />
), non-methane volatile organic compounds (VOC), and primary<br />
emissions of fine (PM 2.5<br />
) and coarse (PM 2.5<br />
-PM 10<br />
) particles. GAINS also accounts for emissions of the six greenhouse<br />
gases that are included in the Kyoto protocol, i.e., carbon dioxide (CO 2<br />
), methane (CH 4<br />
), nitrous oxide (N 2<br />
O) and the<br />
three F-gases (HFC, PFC and SF 6<br />
). The Indian version of the model - GAINS India has a disaggregated representation of<br />
India in 23 sub-regions. Detailed bottom up estimates of HFC emissions under various scenarios and the optimal HFC<br />
emission mitigation strategies across different sectors would be analysed using GAINS model for India (Capros et al.,<br />
2013). For details on GAINS model structure and specific applications, please refer Amann et al. (2008a), Amann et al.<br />
(2008b), Klimont et al. (2009), Purohit et al. (2010), Amann et al. (2011), Hoglund-Isaksson et al., 2012, Wagner et al.<br />
(2012), Amann et al. (2013), Rafaj et al. (2013), Sanderson et al. (2013).
India’s Long Term Hydrofl uorocarbon <strong>Emissions</strong><br />
5<br />
As mentioned, the next leg of research will be undertaken within the modelling framework of GAINS, where in<br />
energy service demand estimates at the state level based on GCAM analysis will be used within GAINS. This report<br />
focuses only on establishing the reference scenario.<br />
2.2 Methodology for Estimating Direct <strong>Emissions</strong> across Sectors<br />
HFC emissions occur at various stages of gas use and include both fugitive emissions and inadvertent release of<br />
these gases into atmosphere. Fugitive emissions occur during lifetime of equipment when HFCs leak from equipment<br />
during their operation. Inadvertent releases may occur when equipment is serviced during its operational life.<br />
Servicing emissions are especially high for the informal servicing sector which constitutes a large part of servicing<br />
market in developing countries. This is the reason for high leakage rate assumptions for many of the sectors. Additionally,<br />
equipment is not disposed through the manufacturer or certified e-waste handler at end of their life.<br />
The HFC emissions are calculated using the general methodology described in this section and applies for major<br />
sectors under the analysis. Wherever any deviations from this standard methodology may occur, they are dealt in<br />
relevant sections that follow.<br />
Table 2: <strong>Emissions</strong> during various stages of HFC life<br />
Production Transport & Distribution Use End of Life<br />
Leakages at production site Leakages from handling gas Leakages at charging site End of life emissions<br />
containers<br />
<strong>Emissions</strong> from energy use<br />
for manufacturing<br />
Source: CEEW analysis<br />
<strong>Energy</strong> use for transportation <strong>Emissions</strong> during equipment <strong>Energy</strong> use for gas recovery<br />
operation<br />
Atmospheric dispersion Servicing emissions Atmospheric dispersion<br />
Indirect emissions from energy<br />
use in equipment<br />
Atmospheric dispersion<br />
HFC emissions from different sectors are calculated by emission factors approach where-in generalised assumptions<br />
for leakage rates, at different stages for gas-use and disposal at end of appliance and equipment life are<br />
used. In absence of national guidelines that exist for calculation of sectoral emissions from HFC end-use, IPCC<br />
guidelines for emissions of fluorinated substitutes for ozone depleting substances (IPCC, 2006) have largely been<br />
adapted for recent advancements and country specific information. They are further validated though interactions<br />
with various stakeholders and sector experts. These sector specific assumptions are summarised under the Section<br />
2.3. Table 2 gives an overview of various stages of HFC emissions. Scope of emissions calculation for this study<br />
is restricted to the italicised elements in the table, during use phase and end of life phase for HFC gases. It should<br />
be noted that emissions during production, transportation and further distribution of chemicals, are not under<br />
the scope of this emissions analysis. Additionally, leakages during equipment charging (including initial charges at<br />
factory and subsequent servicing recharges) are ignored as their magnitude is understood to be relatively very low<br />
(IPCC, 2006) compared to other emissions during the use and disposal of equipment utilising HFC gases.<br />
Under the reference or business as usual (BAU) scenario, BAU replacement options to ozone depleting substances,<br />
listed in Table 3, are applied to the sectors so that markets gradually transition towards these options to meet the<br />
HCFC Phase Out Management Plan (HPMP) targets. Key parameters important for HFC emissions are operational<br />
leakage rates, servicing and end of life recovery. End of life recovery is especially important for the applications<br />
like supermarkets and very large size chillers where HFC uptakes are very high and therefore even at the end<br />
of life the refrigerant banks are quite substantial.<br />
Currently, there is no regulation and action on limiting gas releases during operation and servicing, and there is no<br />
recovery at the end of equipment life. But efforts to encourage servicing recovery in air–conditioning equipment
6<br />
Methodological Approach<br />
are underway (Ozone Cell, 2013). Emission factors used at different stages of HFC use (for instance, Table 6 and<br />
Table 8) for reference case are indicative of this business-as-usual scenario. It is observed that while aligning the<br />
aggregate HCFC consumption (from equipment, appliances and industrial applications) to reduction targets under<br />
HPMP, servicing recovery in commercial AC sector is required to attain a recovery rate of 60% on average in order<br />
to meet the HPMP targets. Another implicit assumption here is that 80% of the recovered chemical is available for<br />
reuse in HCFC applications. Figure 2 shows our estimates of future HCFC consumption, based on sector specific<br />
strategies and chemical level calibration while calculating HFC emissions, in comparison to HPMP targets. HFC<br />
consumption grows significantly across sectors following HPMP targets and is summarised under Section 6.<br />
F igure 2: Projection for HCFC consumption under HPMP<br />
Source: CEEW analysis<br />
Various assumptions on different factors used for emission calculations are tabulated for various sectors under the<br />
Section 2.3.<br />
Table 3 lists out the various HFCs considered under BAU with their corresponding Global Warming Potentials<br />
(GWP) and applications.<br />
Table 3: HFCs considered under BAU and their applications<br />
HFCs as ODS Substitutes under BAU AR4 GWP (100 years) Application<br />
R-410a 2087.5 Stationary Air-conditioning units, Transport Refrigeration<br />
HFC-134a 1430<br />
Domestic Refrigeration units, Commercial Refrigeration<br />
Stand-alone units, Transport Refrigeration, Aerosol,<br />
Foam, Mobile Air-conditioning, HVAC Chillers,<br />
R-404a 3921.6<br />
Transport refrigeration, Centralised systems for Commercial<br />
refrigeration<br />
HFC-152a 124 Aerosol, Foam<br />
R-407c 1773.85 Transport Refrigeration<br />
HFC-227ea 3220 Aerosol<br />
HFC-245fa 1030 Foam<br />
HFC-43-10mee 1640 Solvent<br />
HFC-365mfc 794 Solvent<br />
Source: IPCC (2007) & CEEW analysis
India’s Long Term Hydrofl uorocarbon <strong>Emissions</strong><br />
7<br />
2.2.1 HFC Demand for Manufacturing and Operational <strong>Emissions</strong><br />
The initial charge in new equipment largely determines the yearly market demand of refrigerant for the manufacturing<br />
sector. <strong>Emissions</strong> during the initial charging of equipment (at the factory) are assumed to be very low (see<br />
Section 2.2), to significantly affect the overall HFC emissions from the sector. Segment of refrigerant market that<br />
meets the chemical demand of new equipment is calculated as given in Equation 1.<br />
<br />
Equation 1<br />
<br />
<br />
<br />
<br />
<br />
Refrigerant demand for manufacturing sector in year ‘t’ [tonnes of HFC]<br />
Technology specific charge rate (or HFC uptake of equipment) per unit cooling capacity [g/ kW]<br />
Cooling capacity of equipment [kW]<br />
Equipment sales (or newly installed equipment) in year ‘t’ [million units]<br />
The operational emissions originate from total stock of equipment in a year and include both new and vintage<br />
equipment. These emissions occur for each year of equipment’s life–time and are thus labelled as life-time emissions.<br />
They are calculated applying the annual average operational leakage rates as percentage of initial charge, for<br />
total stock of particular equipment in a year. Stock information for various equipment and appliances is validated<br />
from literature review (for instance, Table 5). The availability of literature and data, in order to deduce the required<br />
macro-level information, is very poor for the commercial refrigeration sector. This sector’s electricity consumption<br />
in the year 2005, therefore, is considered as a basis of base year calibration sector and the calibration process is<br />
detailed through the Section 2.3.4. The detailed process of base year validations for different sectors is described<br />
under relevant sections.<br />
Equipment sales’ time-series and lifetime information (‘L’ years) form the most basic inputs for equipment vintage<br />
model that generates information on equipment stock, equipment under servicing and equipment at the end of<br />
its life in a particular year ‘t’. Individually validated or calibrated stock of an equipment, i.e. <br />
, grows with<br />
the demand growth in a sector that is determined within the GCAM framework as described in Section 2.1. Once<br />
the stock information for base year is validated or calibrated, the newly determined stock in each subsequent year<br />
gives the equipment sales in the same year as a result of integration of top-down and bottom-up information for<br />
different sectors.<br />
F igure 3: Operation leakages of key HFC applications<br />
Source: CEEW analysis based on IPCC/TEAP (2006); IPCC (2006); RTOC/UNEP (2010); RTOC/UNEP (2014) and stakeholder<br />
interactions
8<br />
Methodological Approach<br />
Figure 3 shows a range of operational leakages for key technologies under the reference scenario. Operational leakages<br />
are estimated from average information on developing countries from various sources (IPCC/TEAP, 2006;<br />
IPCC, 2006; RTOC/UNEP, 2010; TEAP/UNEP, 2014), manufacturers’ brochures and interaction with different<br />
stakeholders. As operational leakage is an important parameter for estimating emissions and chemical consumption,<br />
sensitivities on reference case operational leakages are performed to in order to analyse effect of operational<br />
leakages on overall emissions for a particular sector. Various operational leakages considered are summarised in<br />
Table 4, the medium scenario forms our reference case. Operational leakage rates have further repercussions for<br />
the servicing emissions and subsequently the chemical demand for servicing sector (see Section 2.2.2).<br />
<br />
<br />
<br />
Equation 2<br />
<br />
<br />
<br />
<br />
Operational emissions in year ‘t’ [tonnes of HFC]<br />
Operation leakage rate for equipment [percentage of initial charge per year]<br />
As defined under equation 1 [g/kW]<br />
<br />
<br />
As defined under equation 1 [kW]<br />
L<br />
<br />
Equipment lifetime [years]<br />
Equipment stock (or equipment installed base) in year ‘t’ [million units]<br />
<br />
Table 4: Operation leakage for all sectors under low, medium and high leakage scenario<br />
Sector Application Technology Operational Leakage Rate Scenarios (%)<br />
Low Medium High<br />
Residential<br />
Buildings<br />
Commercial<br />
Buildings<br />
Transport<br />
Refrigeration<br />
Passenger<br />
Transport<br />
Freight Transport<br />
Air-conditioning Residential Window/ split AC 5% 10% 15%<br />
Refrigeration Domestic Refrigerator 0.5% 1% 3%<br />
Air-conditioning<br />
Refrigeration<br />
Refrigeration<br />
Air-conditioning<br />
Air-conditioning<br />
HVAC Chiller 5% 15% 20%<br />
Medium- Large DX 5% 10% 15%<br />
Commercial Window/split AC 5% 10% 15%<br />
Standalone Refrigeration Units 1% 5% 10%<br />
Vending Machines 3% 5% 10%<br />
Remote Condensing Units 7% 10% 20%<br />
Centralised Systems 20% 30% 35%<br />
Trucks and Marine Vessels for<br />
Refrigerated Goods<br />
Mobile Air-conditioning Units in<br />
Cars, Buses and Rail<br />
Mobile Air-conditioning Units in<br />
Light Duty and Heavy Duty Trucks<br />
15% 32.5% 50%<br />
15% 20% 25%<br />
15% 20% 25%<br />
Source: CEEW analysis based on IPCC/TEAP (2006); IPCC (2006); RTOC/UNEP (2010); RTOC/UNEP (2014) and stakeholder<br />
interactions
India’s Long Term Hydrofl uorocarbon <strong>Emissions</strong><br />
9<br />
2.2.2 Servicing <strong>Emissions</strong> and Demand for HFCs<br />
Leak tightness of a technology for specific application and servicing sector practices at large determine the servicing<br />
demand and servicing related emissions. As the charge level drops below a certain threshold (due to slow leakage<br />
over time), equipment is not able to deliver the service to required level and has to undergo servicing. We assume<br />
that all equipment types undergo recharging whenever the refrigerant charge declines to lower than 60% of initial<br />
charge levels. With higher operational leakages, requirement for servicing over the equipment life is even more frequent.<br />
Remaining charge at the time of servicing is slightly different for various equipment types depending upon<br />
their leakage rate assumptions. Key assumption for estimating servicing emissions is that, the units, whose residual<br />
charge is lower than threshold limit in a given year, emit all the residual refrigerant charge at the time of servicing<br />
unless the recovery practices are in place. Commercial air-conditioning is the only sector where servicing recovery is<br />
enabled and is set at 60%, minimum required in order to meet the HPMP reduction targets. It is therefore assumed<br />
that same servicing practices will prevail even after the transition from HCFCs to HFCs is complete.<br />
While servicing, refrigerants are released during procedures for leak detection and at times, refrigerants are also<br />
used to rinse out any moisture, contaminants or air in the refrigerant loop (IPCC/TEAP, 2006). In wake of this<br />
additional use of refrigerant for servicing, our assumptions on servicing emissions bring forth only a conservative<br />
estimate of servicing sector’s emissions.<br />
<br />
<br />
<br />
<br />
<br />
Equation 3<br />
<br />
<br />
<br />
<br />
<br />
<br />
Servicing emissions in year ‘t’ [tonnes of HFC]<br />
Remaining charge at the time of servicing<br />
[percentage of initial charge]<br />
Servicing recovery efficiency<br />
[percentage of residual charge at the time of servicing]<br />
As defined under equation 1 [g/kW]<br />
As defined under equation 1 [kW]<br />
<br />
<br />
<br />
<br />
<br />
Units under servicing (residual charge below the 60% threshold) in the year ‘t’ [million<br />
units]<br />
The yearly demand from servicing of equipment comes from recharging of equipment in a year ‘t’. Total refrigerant<br />
demand for this segment of market is calculated as in Equation 4.
10<br />
Methodological Approach<br />
<br />
<br />
<br />
<br />
<br />
<br />
Equation 4<br />
<br />
<br />
<br />
<br />
<br />
<br />
<br />
L<br />
<br />
<br />
<br />
<br />
<br />
Refrigerant demand from servicing sector in year ‘t’<br />
[tonnes of HFC]<br />
Reuse efficiency for recovered HFC gas during servicing<br />
[percentage of HFC recovered during servicing]<br />
As defined under Equation 3<br />
[percentage of initial charge]<br />
As defined under Equation 3<br />
[percentage of residual charge at the time of servicing]<br />
As defined under equation 1 [g/kW]<br />
As defined under equation 1 [kW]<br />
As defined under equation 2 [years]<br />
As defined under Equation 3 [million units]<br />
2.2.3 End-of-Life <strong>Emissions</strong> and Recovery<br />
For most of the equipment, there is no recovery at the end of equipment’s life and all the remaining charge gets<br />
released into the atmosphere. This is the case with no regulation on limiting HFC emissions at end of life. The e-<br />
waste regulations in India address majority of these air-conditioning and refrigeration appliances but implementation<br />
has so far been very poor and there is no incentive for the customers to get the products recycled through an<br />
authorised e-waste handler. The supermarket systems are an exception as the HFC uptake for this application is<br />
very high and there is an economic incentive to recover the refrigerant even in absence of regulation. Recovery rate<br />
for supermarket systems is assumed to be 20% but due to lack of reliable information on fate of recovered gas,<br />
it is assumed that recovered gas does not feed back into the value chain of chemical. In a simple vintage model,<br />
considered for emissions calculations across various equipment types, equipment sales in year ‘t-L’ enter the end<br />
of life in year ‘t’. Equation 5 represents the end of life emissions in a year that result from the retired equipment.
India’s Long Term Hydrofl uorocarbon <strong>Emissions</strong><br />
11<br />
<br />
Equation 5<br />
<br />
<br />
<br />
<br />
<br />
<br />
<br />
End-of-life emissions in year ‘t’ [tonnes of HFC]<br />
Remaining chargeat end of life<br />
[percentage of Equipment’s initial charge]<br />
End-of-life recovery efficiency<br />
[percentage of remaining charge]<br />
As defined under equation 1 [g/kW]<br />
As defined under equation 1 [kW]<br />
Equipment at end of life in year ‘t’ [million units]<br />
2.3 Data and Assumptions for <strong>Emissions</strong> calculations<br />
2.3.1 Residential Air-conditioning<br />
The room AC stock in the base year i.e. 2010 was estimated from room AC sales’ time-series from PwC (2012).<br />
Further factors for share of residential sector in total window and split AC sales are applied on total sales. These<br />
factors are estimated from PwC and LBNL reports (PwC, 2012; Phadke et al., 2013). There are approximately 1.9<br />
million residential AC units sold in 2010 with an average capacity of 5.07 kW and the stock, for the same year,<br />
amounts to 9.2 million units. Life time of an average room AC unit is assumed to be 10 years. Table 5 shows our<br />
detailed calculation for estimating the 2010 stock figures from market data:<br />
Table 5: Residential AC sales in base year<br />
2003 2004 2005 2006 2007 2008 2009 2010 Units<br />
Total room AC sales (A) 1.00 1.25 1.5 1.85 2.2 2.75 3.44 3.2<br />
Share of split AC in room AC<br />
sales § (B)<br />
Share of residential ACs in<br />
split AC sales (C)<br />
Share of residential ACs in<br />
window AC sales (D)<br />
Residential split AC sales<br />
(A*B*C)<br />
Residential window AC sales<br />
[ A*(1-B)*D]<br />
55 55 55 55 59 62 65 68 %<br />
50 50 50 50 50 50 50 50 %<br />
80 80 80 80 80 80 80 80 %<br />
0.27 0.34 0.41 0.51 0.65 0.85 1.12 1.08<br />
0.36 0.45 0.54 0.66 0.72 0.84 0.96 0.82<br />
Total residential AC sales 0.63 0.79 0.95 1.17 1.37 1.69 2.08 1.9<br />
Million<br />
units<br />
Million<br />
units<br />
Million<br />
units<br />
Million<br />
units<br />
§<br />
PwC (2012) gives 2009 and 2010 shares, shares for other years are assumed<br />
Source: CEEW analysis based on PwC (2012) and Phadke et al. (2013)
12<br />
Methodological Approach<br />
The key information required for emission calculation is charge rates for room AC units. From the specification<br />
sheets of existing equipment (Rajadhyaksha, 2014), typical charge for HCFC-22 is found to be 0.75 kg for a 5.2<br />
kW unit which means a charge rate of 144 g/ kW. For cooling performance of refrigerants equivalent to HCFC-<br />
22, it is found that nominal charge rate for R-410a is found to be 97% of that of HCFC-22 (Virmani, 2014)<br />
amounting to 140.2 g/kW. For reference scenario (R-410a), 10% operational leakage rate demands recharging<br />
twice during unit’s lifetime. Based on this set of assumption for reference scenario, it is 4 years- and 8 years- old<br />
equipment that require recharging and add to the servicing- emissions and demand in that year. In case of low<br />
leakage scenario (5% leakage rate), servicing recharge only occurs once, when equipment is 7 years- old and<br />
remaining charge is around 65% in the 10th year. Technical assumptions under BAU have been summarised in<br />
Table 6. Residential AC stock <strong>Energy</strong> Efficiency Ratio (EER) is assumed to grow from 2.6 to 3.5 in 2050. The<br />
EER for new equipment might be significantly higher in 2050 but assumed EER of 3.5 is a stock average number.<br />
There will be a distribution around this value with some equipments being more efficient and some being<br />
less efficient, with 3.5 EER being the mean value as per our assumption.<br />
Table 6: Summary of BAU assumptions for residential AC<br />
Residential-Window<br />
and Split AC<br />
Refrigerant<br />
under BAU<br />
Charge rate Operational leakage Servicing Recovery End of life Recovery<br />
r charge<br />
[kg/ KW]<br />
k operational<br />
[Percentage of r charge<br />
]<br />
e servicing<br />
[Percentage of r charge<br />
]<br />
R-410a 0.1402 10% 0% 0%<br />
e end_of_life<br />
[Percentage of r charge<br />
]<br />
Source: CEEW compilation based on Rajadhyaksha (2014), Virmani (2014), IPCC/TEAP (2006), RTOC/UNEP (2010) and<br />
stakeholder interactions<br />
2.3.2 Domestic Refrigeration<br />
The Euro monitor 2011 sales’ time-series for domestic refrigerators from ICF (2012) report was referred for base<br />
year calibration in 2010 which gives 7.9 million units sold in 2010 and domestic refrigerator stock of 48.5 million<br />
units. Domestic refrigerator lifetime is assumed to be 10 years.<br />
<strong>Energy</strong> efficiency for domestic refrigerator in 2010 is calculated as given in Table 7. This is based on the efficiency<br />
levels (Prayas, 2011) for newly sold direct-cool and frost-free refrigerators, and their respective market shares (ICF,<br />
2012). These values for efficiency of newly sold equipment were further included in the vintage model to calculate<br />
efficiency for the stock, taking into consideration the efficiency improvements in future. When compared to efficiency<br />
of domestic refrigerator in 2005, there is 66.67% improvement in the stock efficiency in 2050.<br />
Table 7: Calibration of weighted average Unit <strong>Energy</strong> Consumption (UEC) for domestic refrigerator<br />
Direct cool<br />
Frost free<br />
Unlabelled 3 star 4 star 5 star Weighted Average UEC<br />
UEC [kWh] 748 383 306 272 394.1<br />
Market share 20% 19% 25% 35% 79.4%<br />
UEC [kWh] 0 579 463 411 454.4<br />
Market share 0% 11% 48% 41% 20.6%<br />
Weighted Average Domestic Refrigerator UEC [kWh] 406.5<br />
Source: CEEW analysis based on Prayas (2011) and ICF (2012)<br />
Due to lack of reliable information on share of refrigerators based on hydrocarbon (HC) and hydrocarbon blends,<br />
it is assumed that along the model time horizon, 50% of refrigerators are based on HC while the rest are based on<br />
HFC-134a. TEAP report notes that the penetration of low-GWP HC based refrigerators in domestic refrigerators<br />
is growing at significant rate and could be 50-75% in 2050 for developing countries, which is the basis for our<br />
assumption. The sector switched to non-ODS options HFC-134a, HC and HC blends as early as 2008 (RTOC/
India’s Long Term Hydrofl uorocarbon <strong>Emissions</strong><br />
13<br />
UNEP, 2010). Domestic refrigerators are leak-tight and operational leakages are very low compared to other enduse<br />
sectors. Our assumption of leakage rate for domestic refrigerators is 1%. Charge rate for an average domestic<br />
refrigerator based on HFC-134a is assumed to be 150 g HFC-134a per unit (TEAP/UNEP, 2014). Charge rate<br />
for HC based equipment is found to be as low as 46 gram HC blend for a 250 litre unit (Godrej & Boyce). Both<br />
servicing and end-of-life recovery for this unit is assumed to be zero under the BAU scenario. Assumptions under<br />
BAU have been summarised in Table 8.<br />
Table 8: Summary of BAU assumptions for domestic refrigerator<br />
Domestic refrigerator<br />
Refrigerant<br />
under BAU<br />
Charge rate Operational leakage Servicing Recovery End of life Recovery<br />
r charge<br />
[g/unit]<br />
k operational<br />
[Percentage of r charge<br />
]<br />
e servicing<br />
[Percentage of r charge<br />
]<br />
e end_of_life<br />
[Percentage of r charge<br />
]<br />
HFC-134a 150 1% 0% 0%<br />
Source: CEEW compilation based on RTOC/UNEP (2010), TEAP/UNEP (2014) and stakeholder interactions<br />
2.3.3 Commercial Air-Conditioning<br />
The installed capacity of commercial air-conditioning in India in base year 2010 is validated from PACE-D, 2014<br />
report (USAID & BEE, 2014) on HVAC. Estimated capacity of total commercial cooling capacity installed in the<br />
country is approximately 52 TW in the year 2010, of which 85% is concentrated in seven big cities. Our base<br />
year calibration in 2010 shows that 9.3 TW of cooling capacity was added in 2010 and 1,342 hours of full load<br />
operation. The information available on commercial floor space in India is very limited, partly because it is largely<br />
unorganised. Total commercial floor space for the base year was taken from ECO-III 2010 report wherein it is estimated<br />
to be 520 million square meters in 2005 (Kumar et al., 2010). Commercial AC equipment has been classified<br />
broadly into three different types: medium to large DX, commercial sector room ac and chillers. The classification<br />
is based on size classes and equipment configuration. Hence it also relates to HFC uptake and emission characteristics<br />
respectively. Lifetime assumption is 10 years for commercial room AC and 20 years for chillers and medium<br />
to large DX equipment. The stock average EER for this sector is assumed to grow from 2.6 to 5.2 by 2050. This is<br />
based upon typical EER of various equipment in the base year and evolving market share of competing technologies<br />
as described in subsequent paragraphs.<br />
Commercial Window and split AC<br />
These are non-ducted type DX or essentially the split or window AC units. Although residential sector is a dominant<br />
user of this type of equipment, a comparatively smaller pool of equipment finds its use in office buildings.<br />
Room AC sales for commercial sector are estimated as shown in Table 9. The estimation approach is same as that<br />
used for estimating residential AC stock (see Section 2.3.1 and Table 5). The room AC share in total stock in 2010<br />
is 70% (although in terms of sale it is much lower). It is assumed that the share of room AC will decline in future.<br />
It is estimated to decline to 30% of the total stock in 2050. Market for room AC is speculated to shrink in the<br />
future (for commercial applications) for two reasons:<br />
1. Room AC has lowest typical EER of all other technologies, approx. EER 2.4 compared to EER 6 for centrifugal<br />
chillers<br />
2. Its application is limited to small office spaces. Market is already shifting towards centralised systems driven<br />
by expansion in large and organised commercial spaces.<br />
The base year estimation for commercial room AC is calculated, as shown in Table 9. There were approximately<br />
1.3 million units sold in the market in 2010. BAU replacement option for this application is same as residential<br />
room ac i.e. R-410a, and similar approach and emission factors have been applied for this sector in our study.
14<br />
Methodological Approach<br />
Table 9: Estimate on commercial room AC sales<br />
2003 2004 2005 2006 2007 2008 2009 2010 Units<br />
Total Room AC Sales (A) 1 1.25 1.5 1.85 2.2 2.75 3.44 3.2<br />
Million<br />
units<br />
Split AC Share § (B) 55 55 55 55 59 62 65 68 %<br />
Commercial Sector Share of<br />
Split AC Sales (C)<br />
50 50 50 50 50 50 50 50 %<br />
Commercial Sector Share of<br />
Window AC Sales (D)<br />
20 20 20 20 20 20 20 20 %<br />
Commercial Split AC<br />
(A*B*C)<br />
Commercial Window AC<br />
[A*(1-B)*D]<br />
Total Commercial Sector<br />
Window and Split AC Sales<br />
0.275 0.344 0.412 0.509 0.649 0.852 1.118 1.088<br />
0.09 0.112 0.135 0.166 0.268 0.209 0.240 0.205<br />
0.365 0.456 0.547 0.675 0.917 1.062 1.358 1.293<br />
§<br />
PwC (2012) gives 2009 and 2010 shares, shares for other years are assumed.<br />
Million<br />
units<br />
Million<br />
units<br />
Million<br />
units<br />
Source: CEEW analysis based on PwC (2012) and Phadke et al. (2013)<br />
Medium to Large DX and VRF Equipment<br />
This type constitutes packaged units and ducted type DX equipment. This kind of installation is typical for offices.<br />
Typical configuration is one installation per floor. Market trend, as seen in Table 10, is that the medium or<br />
large DX equipment are being replaced by more efficient variable refrigerant flow (VRF) or variable refrigerant<br />
volume (VRV) equipment. VRV/VRF equipment are categorised under same category for estimation purposes as<br />
HFC uptake and average cooling capacity across equipment population, are found to be similar, and as both VRV/<br />
VRF installations are essentially designed for similar applications. The information on population of equipment is<br />
estimated from market sales data of various equipment types in PACE-D program’s report on HVAC (USAID &<br />
BEE, 2014) and the future market trends are projected based on this sales’ time-series. It is assumed that, in 2050,<br />
all medium or large DX equipment will be replaced by VRF equipment.<br />
Chillers for HVAC<br />
Chillers are used for very large sized commercial buildings and utilise an additional cooling media for circulating<br />
cooling energy within the air-conditioned space. Share of water cooled chillers is increasing (Table 10) and these<br />
chillers are more efficient than air chillers although they are not a suitable option for water stressed regions. It is<br />
assumed that, applying the best possible EERs that are available in market today (through industry brochures) in<br />
different product categories, correspondingly stock EER will also double to 5.2 in 2050 relative to 2005. Relative<br />
share of VRF and Chillers is assumed to be same in 2050 and the market trends dictate the same.
India’s Long Term Hydrofl uorocarbon <strong>Emissions</strong><br />
15<br />
Table 10: Market trends of different commercial AC segments<br />
Market sales by type UNITS 2010 2011 2012 2013 2014 2015<br />
Total medium or large DX TW 1.13 1.42 1.66 1.91 2.20 2.53<br />
VRF systems Percentage of med- large DX 61% 70% 76% 81% 84% 87%<br />
100 kW TW 0.10 0.12 0.10 0.11 0.12 0.12<br />
Chillers<br />
100-350 kW TW 0.34 0.29 0.27 0.29 0.30 0.34<br />
350-700 kW TW 0.26 0.39 0.33 0.34 0.37 0.39<br />
>700 kW TW 0.94 0.71 0.59 0.71 0.82 0.88<br />
Water cooled chillers Percentage of total chillers 43% 48% 47% 47% 48% 50%<br />
Source: CEEW estimation based on USAID & BEE (2014)<br />
R-410a is dominant alternative to HCFCs, in room ACs and medium to large DX type equipment. HFC-134a is<br />
considered as an option for replacement of HCFC-123 and HCFC-22. Assumptions under BAU have been summarised<br />
in Table 11.<br />
Table 11: Summary of BAU assumptions for commercial AC<br />
Equipment type<br />
Refrigerants<br />
under BAU<br />
Charge rate Operational leakage Servicing Recovery End of life Recovery<br />
[kg/ kW] [Percentage of r charge<br />
] [Percentage of r charge<br />
] [Percentage of r charge<br />
]<br />
Commercial window/<br />
split AC<br />
R-410a 0.14 10% 60% 0%<br />
Medium to large DX R-410a 0.26 10% 60% 0%<br />
Chiller HFC-134a 0.38 15% 60% 0%<br />
Source: CEEW compilation based on IPCC/TEAP (2006), RTOC/UNEP (2010), manufacturers’ brochures and own<br />
analysis<br />
2.3.4 Commercial Refrigeration<br />
The energy consumption for commercial refrigeration in 2005 (0.01 EJ electricity) was taken from TERI energy<br />
roadmap (TERI, 2006). There is partial information on number of standalone display cabinets and remote condensers<br />
utilised by the sector from the Weide et al. (2014) report on mapping and benchmarking of the sector.<br />
Rest was determined by calibrating with TERI energy consumption figure, in addition to estimating number of<br />
supermarkets with floor space estimates. As per Weide et al. (2014) there are 445 thousand standalone units and<br />
124 thousand vending machines. Based on Weide et al. (2014) and our assumptions as explained below, there were<br />
442 thousand remote condensing units and 120 centralised systems in 2010 in India.<br />
Vending machines are modelled separately from stand-alone units as refrigerant use/ options and uptakes are<br />
different from other stand-alone units. HFC-134a has long been adopted as the most favoured option for small/<br />
medium -sized commercial refrigeration equipment in India and this includes stand-alone equipment, vending<br />
machines and remote condensing units. Centralised systems are not very prevalent in India at the moment but it<br />
will not be the same in the future and in subsequent text we present the estimates on evolution of market for these<br />
systems.<br />
Stand Alone Units<br />
Stand alone units include display cabinets, deep freezers, chest coolers, visi-coolers, bottle coolers and integral<br />
reach-in coolers, which are sold as stand-alone or plug-in units. Deep freezers can either be glass top or hard top.
16<br />
Methodological Approach<br />
These units have cooling capacity less than 1 kW. Data on stocks and market sales of equipment is largely absent.<br />
We have relied on CLASP mapping and benchmarking of commercial and refrigeration equipment (Weide et al.,<br />
2014) estimates of existing equipment in the base year. According to the source, there were 53 million plug-in<br />
display cabinet units in India in 2009. Due to lack of any data or labelling of equipment for HFC charges, average<br />
HFC uptake of 260 grams per units for the stand alone equipment is assumed, based on UNEP’s RTOC report<br />
(RTOC/UNEP, 2006). This is validated from the fact that charges rate is in similar range as domestic refrigerator<br />
because of the fact that the cooling capacities are very similar.<br />
Vending Machines<br />
Base year data for the vending machines is also taken from CLASP report (Weide et al., 2014). The higher range<br />
of HFC uptake for stand-alone units is taken from UNEP report (RTOC/UNEP, 2006) and represents as average<br />
charge (300 grams per unit) in absence of data from manufacturers.<br />
Remote Condenser Units<br />
Remote condenser units could either be display type employed by large retails shops or it could as well be for storage<br />
of additional refrigerated goods. The display type units are based on data from Weide et al., 2014. Non display<br />
units have racks of condensing units placed in a small machinery room away from the display area. Estimation of<br />
the total number of non-display units is based on our estimates of total electricity consumption for these units and<br />
their unit energy consumption. Refrigerant charges for this equipment type are assumed to be 3 kg -HFC based on<br />
information from latest UNEP report on refrigerant options (RTOC/UNEP, 2010). It is assumed that HFC-134a is<br />
being used in India for all remote condensing units as opposed to R-404a as a result of HFC-134a’s better performance<br />
at ambient temperatures (RTOC/UNEP, 2010).<br />
Centralised or Supermarket Systems<br />
Supermarkets use centralised refrigeration systems where compressors racks are installed in a machine room. As<br />
a result, length of piping, containing liquid refrigerant from the machinery room and vapour phase refrigerant<br />
back from the sales area, increases significantly and could be up to several kilometres (RTOC/UNEP, 2010). This<br />
explains the high leakages that are prevalent in the supermarket systems. This coupled with the only refrigerant<br />
choice: R-404a, for the kind of systems, which has highest GWP among all end-use replacement options, exacerbates<br />
the direct HFC emissions.<br />
Figure 4: Supermarkets and hyper-markets per million population (2003)<br />
Supermarkets<br />
Hypermarkets<br />
SUPERMARKETS/HYPERMARKETS PER MILLION<br />
POPULATION<br />
92<br />
8<br />
139<br />
9<br />
79<br />
0.07<br />
EUROPE USA CHINA JAPAN AFRICA,<br />
OCEANIA<br />
115<br />
12<br />
6<br />
0.04<br />
37<br />
0.63<br />
ASIA<br />
53<br />
3<br />
GLOBAL<br />
Source: CEEW compilation based on RTOC/UNEP (2006) and UN population data
India’s Long Term Hydrofl uorocarbon <strong>Emissions</strong><br />
17<br />
Our estimation of supermarket/hypermarket systems consists of two steps:<br />
(i) Estimating floorspace under organised food retail for the year 2010: Total commercial floor space in India is<br />
going to see a huge growth in future. It is estimated to grow from approximately 520 million-m 2 in 2005 to<br />
seven times in 2030 and twenty times in 2050. The share of retail in total commercial floor space is assumed to<br />
be constant at 20% (USAID & BEE, 2014) throughout the time horizon. Survey results of National Accounts<br />
Statistics 2007 indicate that large share of this retail is currently unorganised: 82% in 2005 (Rue du Can et al.,<br />
2009). It is assumed that the share of organised sector in retail increases form 18 % in 2005 to 50% in 2050.<br />
A large population in India still relies heavily on unorganised food retail. Although the share of food in total<br />
retail is over 50%, in case of organised sector it is miniscule at 1% (Kinght Frank, 2010).<br />
(ii) Estimating number of supermarkets: Firstly, we develop an understanding of the probable saturation level of<br />
supermarkets per million population for 2050. Based on this understanding the saturation for supermarkets’<br />
demand in 2050 (Supermarkets for 1 million population) was set to 2003 Europe levels of 92 supermarkets<br />
per million population which forms the key assumptions for estimating supermarkets in India in 2050. For<br />
hypermarkets, this level was 8 per million population. Secondly, we estimate the number of supermarkets/<br />
hypermarkets in the base year 2010. RTOC/UNEP (2006) gives representative supermarket sizes for different<br />
countries which is the basis of our assumption on average supermarket floor space area of 1,500 m 2 . Similarly,<br />
hypermarket size is assumed to be 6,000 m 2 . On the basis of estimate of floorspace under food retail, derived<br />
as explained earlier, and average supermarket/hypermarket size, we estimate the number of supermarkets/<br />
hypermarkets in India in 2010. Finally, we linearly grow the number of supermarkets between 2010 year estimate<br />
and 2050 saturation value.<br />
Table 12: Assumptions under BAU for commercial refrigeration<br />
Equipment type Capacity range Refrigerants<br />
under BAU<br />
Charge rate<br />
Operational<br />
leakage<br />
k operational<br />
Servicing<br />
Recovery<br />
e servicing<br />
End of life<br />
Recovery<br />
e end_of_life<br />
r charge<br />
[kg/ unit]<br />
[Percentage of r charge<br />
]<br />
[Percentage of r charge<br />
]<br />
[Percentage of r charge<br />
]<br />
Stand Alone
18<br />
Methodological Approach<br />
ranges from 7,200 km for the smaller city to 12,500 km for Delhi. We expect that AVTK in cities that are small<br />
today will grow to the value of bigger cities as these cities become larger. However, as more and more rural areas<br />
become urbanised, we will see many new small towns and urban areas in India. For households that own cars in<br />
these newly urbanised areas we can expect the AVTK to be lower than 7,200 km. We have hence assumed that<br />
between 2010 and 2050, the average AVTK across new small towns, medium sized towns and bigger cities will be<br />
7,200 km, though there will be a distribution around this number. These assumptions have been used to calculate<br />
base year stock from the model (GCAM) output which is in terms of passenger service. The time series sales data<br />
is used to calibrate base year stock figures. Base year stock is calculated to be 10.32 million. The lifetime of cars<br />
is assumed to be 12 years (Su, et al., 2015). Since 2010, 100% of cars sold have factory installed air-conditioning<br />
systems (Chaney et al., 2007), which means that in the future all the cars will be with ACs once the stock of 2009<br />
year cars expires.<br />
The switch from CFC-12 to HFC-134a was a global decision taken by automobile manufacturers in developed<br />
countries (IPCC/TEAP, 2006). By 1994 almost all vehicles sold in developed countries used this refrigerant (IPCC/<br />
TEAP, 2006). This transition in developing nations happened in the late 2000’s (IPCC/TEAP, 2006). India stopped<br />
production of CFC based MAC units in 2003 (Andersen et al., 2013). Thus, it is assumed that by 2010 all passenger<br />
cars have pre-installed HFC-134a based air-conditioning systems. The key information required for emissions<br />
calculations is charge rates for Mobile AC units. Through industry interaction it is found that average charge rate<br />
for cars and SUVs is 350 grams and 600 grams respectively. Operation leakage rates are 20% per annum of initial<br />
charge rate. In the reference scenario there is no servicing and end of life recovery of gases. Thus, all the residual<br />
gases during servicing and end of life are let out into the atmosphere.<br />
Mobile Air-conditioning in Buses<br />
Sales of buses have grown from 90,000 in 2001 to 98,000 in 2011 (PCRA, 2013). Data for number of registered<br />
buses from 1961 to 2012 was obtained from government database (MoRTH, 2013). Lifetime for buses is taken as<br />
20 years. Stock figure for buses in the base year is calculated to be 1.21 million from government database. AVTK<br />
for buses has been assumed to be 105,000 km. Stock AVTK is assumed constant for the time frame. Load factor<br />
for buses is assumed to be 36 persons/bus. Data for sales of air-conditioned buses was not available. Hence, it has<br />
been assumed that AC bus sales started from 1990 and AC bus sales constituted 1% of total bus sales in 1990. The<br />
share of AC buses in overall bus sales grows by 1% per annum. The stock of AC buses grows from 17% in 2010<br />
to 53% of total stock of busses in 2050.<br />
Through industry interaction it was found that average charge rate in buses range from 1,200 gram to 4,600 gram.<br />
Based on interaction with industry, a charge rate of 2,400 gm/unit is assumed. Operational leakage rates range<br />
from 20% per annum of initial charge rate. In the reference scenario there is no servicing and end of life recovery<br />
of gases. Thus, all the residual gases during servicing and end of life are let out into the atmosphere.<br />
Mobile Air-conditioning in Passenger Rail<br />
The number of passenger coaches has grown from 30,000 in 1990 to 50,000 in 2010 (Indian Railways, 2014).<br />
Stock of coaches in 2010 is obtained from Indian Railways database (Indian Railways, 2014). Share of AC coaches<br />
in the total stock has grown from 4.64% in 1990 to 13.19% in 2010 (Indian Railways, 2014). For the reference<br />
scenario emission calculations share of AC coaches in the total stock is grown linearly to 50% in 2050. Lifetime<br />
of these units are assumed to be 10 years. AVTK is assumed to be 315,000 km. Stock AVTK is assumed constant<br />
for the time frame. Load factor of each coach is 50.62. This has been calculated from available data on stock and<br />
ridership of railways.<br />
The key information required for emission calculation is charge rates for the railway coaches. Through stakeholder<br />
interactions it was found that each Indian Railways coach has two 5 TR direct cooling air-conditioners. These<br />
units are based on HFC-134a and have a charge rate of 3.5 kg. There was a lack of data on production, lifetime,
India’s Long Term Hydrofl uorocarbon <strong>Emissions</strong><br />
19<br />
end-of-life of AC units used in rail coaches. Thus, number of coaches requiring servicing could not be estimated<br />
from available data. It has been assumed that 10% of stock each year needs to be serviced. Each year 10% of stock<br />
of previous year reaches end-of-life. Operational leakage rate of 20% per annum of initial charge rate has been<br />
assumed for emission calculations. In the reference scenario there is no servicing and end of life recovery of gases.<br />
Thus, all the residual gases during servicing and end of life are let out into the atmosphere. All assumptions under<br />
BAU have been summarised in Table 13.<br />
Table 13: Assumptions under BAU for mobile AC<br />
Refrigerants<br />
under BAU<br />
Charge rate<br />
r charge<br />
[kg/ unit]<br />
Operational<br />
leakage<br />
k operational<br />
[Percentage of<br />
r charge<br />
]<br />
Servicing<br />
Recovery<br />
e servicing<br />
[Percentage of<br />
r charge<br />
]<br />
End of life<br />
Recovery<br />
e end_of_life<br />
[Percentage of<br />
r charge<br />
]<br />
Annual Vehicle<br />
Transport<br />
Kilometre<br />
[AVTK]<br />
Car HFC-134a 350 20% 0% 0% 7,200 12<br />
SUV HFC-134a 600 20% 0% 0% 7,200 12<br />
Bus HFC-134a 2,400 20% 0% 0% 1,05,000 20<br />
Rail HFC-134a 3,500 20% 0% 0% 3,05,000 10<br />
Light Duty<br />
Trucks<br />
Heavy<br />
Duty<br />
Trucks<br />
HFC-134a 475 20% 0% 0% 16,866 20<br />
HFC-134a 525 20% 0% 0% 59,071 20<br />
Lifetime<br />
Source: CEEW compilation based on PCRA (2013), Mohan et al. (2014), Su et al. (2015), stakeholder interactions and<br />
own analysis<br />
2.3.6 Freight Transportation<br />
There are two types of trucks that have been considered in the fright sector- Light Duty Trucks (LDT) and Heavy<br />
Duty Trucks (HDT). The stock of total freight trucks in India was 6.35 million in 2010 (MoRTH, 2013). The inherent<br />
distribution of the stock between LDT and HDT was not available. This was calculated based on the sales<br />
data. Sales of LDT and HDT trucks have grown from 43,000 and 68,000 in 2001 to 411,000 and 271,000 in 2011<br />
respectively (PCRA, 2013). Based on sales data stock of LDT and HDT in 2010 is 2.79 million and 3.50 million<br />
respectively. The average annual vehicle transport kilometres (AVTK) used for LDT and HDT were 16,866 km<br />
and 59,071 km respectively (PCRA, 2013). AVTK is assumed to be constant over the time frame. In the absence of<br />
reliable data for the penetration of air-conditioning in freight trucks, it is assumed that penetration in stock grows<br />
from 0% in 2010 to 50% in 2050. The lifetime of these trucks was assumed to be 20 years.<br />
Through industry interactions it was found that average charge rate for LDT and HDT is 475 gram and 525 gram<br />
respectively. Operation leakage rates are 20% per annum of initial charge rate. In the reference scenario there is<br />
no servicing and end of life recovery of gases. Thus, all the residual gases during servicing and end of life are let<br />
out into the atmosphere.<br />
[year]<br />
2.3.7 Refrigerated goods<br />
Transport Refrigerated Trucks<br />
The base year stock of total refrigerated trucks in India was 7,000 units in 2010 (NCCD, 2013). It is assumed<br />
that the growth in the transport refrigeration sector will be in line with the growth in the commercial refrigeration<br />
sector.
20<br />
Methodological Approach<br />
Based on industry stakeholder interactions it is be assumed that average charge rate for transport refrigeration<br />
trucks is 3.5 kg/unit. Currently most refrigerated trucks use HCFC-22. There are a number of options available for<br />
transition away from HCFCs. These are HFC-134a, R-404a, R-407c and R-410a (IPCC/TEAP, 2006). In absence<br />
of reliable information on their respective shares in the base year, an equal share of these four gases has been assumed<br />
for the future in the reference scenario. Based on stakeholder interactions it was assumed that lifetime of<br />
these trucks is 10 years. The range of operational emissions from this sector is very wide, varying from 15% to<br />
50% (IPCC, 2006). A mid-value of 32.5% has been chosen for our estimates. In the reference scenario there is no<br />
servicing and end of life recovery of gases. Thus, all the residual gases during servicing and end of life are let out<br />
into the atmosphere.<br />
Marine Refrigeration<br />
There was a lack of reliable data on the stock of marine refrigerated vessels. The consumption of chemical in the<br />
transportation refrigeration sector was obtained from HPMP. This included consumption by both refrigerated<br />
trucks and marine vessels. Based on our estimates of HCFC consumption in refrigerated trucks, the consumption<br />
of HCFC by marine vessels was estimated to be 33 tonnes in 2010. The growth rate of chemical consumption in<br />
this sub-sector was aligned to that of transport refrigerated trucks.<br />
In the absence of specific information on various parameters, we have estimated the emissions from this sub-sector<br />
based on elasticity of HFC emissions with respect to chemical consumption for refrigerated trucks in each year.<br />
Three HFC options mentioned in RTOC/UNEP (2012) are considered for marine vessels. HFC-134a constitutes<br />
50% of chemical consumption for this application and rest 25% each is met by R-404a and R-407c.<br />
All assumptions under BAU have been summarised in Table 14.<br />
Table 14: Assumption for emission estimation under BAU for refrigerated transportation<br />
Transport<br />
Refrigeration<br />
Refrigerants<br />
under BAU<br />
Charge rate Operational leakage Servicing Recovery End of life Recovery<br />
r charge<br />
k operational<br />
e servicing<br />
e end_of_life<br />
[kg/ unit]<br />
[Percentage of r charge<br />
]<br />
[Percentage of r charge<br />
]<br />
[Percentage of r charge<br />
]<br />
Refrigerated<br />
Trucks<br />
Marine<br />
Refrigeration<br />
HFC-134a,<br />
R-404a, R-407c,<br />
R-410a<br />
HFC-134a,<br />
R-404a, R-407c<br />
3.5 32.5 0 0<br />
NA 32.5 0 0<br />
Source: CEEW compilation based on IPCC (2006), RTOC/UNEP (2012) and stakeholder interactions<br />
2.3.8 Industrial Sectors<br />
Foams<br />
Foams are used for a number of applications. These applications include furniture cushioning, packaging and<br />
impact management (safety) foams, providing structural integrity, thermal insulation in appliances, buildings and<br />
transportation (IPCC/TEAP, 2006). HCFC/HFC is used in the manufacturing of foams as blowing agents. A blowing<br />
agent is present in a foam formulation to ensure that the polymer matrix expands prior to solidifying (UNEP,<br />
2010).<br />
<strong>Emissions</strong> are likely to occur during the manufacturing process or the in-use phase, with often the majority of<br />
emissions not occurring until end-of-life (IPCC, 2006). <strong>Emissions</strong> of HFCs from foam use in year t is calculated<br />
as follows:-
India’s Long Term Hydrofl uorocarbon <strong>Emissions</strong><br />
21<br />
<br />
Equation 6<br />
<br />
<br />
<br />
<br />
<br />
<br />
n<br />
emission from foam in year t [tonnes of HFC]<br />
total HFC used in manufacturing new foam in year t [tonnes of HFC]<br />
first year loss emission factor, fraction HFC used in foam manufacturing between year t and<br />
year t-n [tonnes of HFC]<br />
annual loss emission factor [% factor]<br />
total HFC used in manufacturing new foam in year (t-n) [tonnes of HFC]<br />
end-of-life emission factor [% factor]<br />
lifetime of product [years]<br />
Four sub-sectors within the foam industry are considered for emission calculations. These are discontinuous panel,<br />
continuous panel, integral skin and appliances. In 2010, these four sub-sectors accounted for 90% of all HCFC<br />
consumption in the foam sector in India. The emission factors used for these sectors are shown in Table 15.<br />
Table 15: Emission factors for foam sub-sectors<br />
Sub-sector<br />
Lifetime<br />
First year loss<br />
emission factor<br />
Annual loss<br />
emission factor<br />
End of life emission factor<br />
EF end_of_life<br />
[years] EF FYL<br />
[%] EF AL<br />
[%] [%]<br />
Discontinuous Panel 50 12.5 0.5 62.5<br />
Continuous Panel 50 10 0.5 65<br />
Integral Skin 12 95 2.5 0<br />
Appliance 15 7 0.5 85.5<br />
Source: UNEP (2010)<br />
A number of low-GWP foam blowing agents such as water, hydrocarbons and CO 2<br />
have come up in the recent<br />
decades (UNEP, 2011). Even though thermal efficiency of hydrocarbon-based foams has improved in recent years<br />
as a result of development focus, foam manufacturers in developed countries have still been reluctant to make the<br />
onward transition from HCFCs to zero-ODP alternatives (UNEP, 2010).These factors led to an uptake of HFCs<br />
as replacement for HCFCs in the early 2000’s (IPCC/TEAP, 2006). Since then the market share of hydrocarbon<br />
technologies has grown significantly (TEAP/UNEP, 2014). The blowing efficiency of hydrocarbon blowing agents<br />
is substantially better than that of CFC and HCFC that was replaced (TEAP/UNEP, 2014). Due to these reasons, a<br />
50% uptake of HFCs is anticipated in the foam industry (IPCC/TEAP, 2006). For emission a 50% uptake of HFCs<br />
is assumed within specific foam sub-sectors- discontinuous panel, continuous panel and integral skin. Based on<br />
HPMP a 25% uptake of HFCs by the appliance sub-sector is considered. The HFCs considered in BAU are HFC-<br />
134a, HFC-152a and HFC-245fa.
22<br />
Methodological Approach<br />
Solvents<br />
Solvents are widely used as process agents in a variety of industrial manufacturing processes although they are not<br />
contained in the final products to consumers (TEAP/UNEP, 2014). These are used in textile and garment industries,<br />
metal/electronic cleaning and for chemical manufacturing (Ozone Cell, 2010) The major application is in cleaning<br />
– which includes precision where dust is mainly cleaned, electronics where fuse is mainly cleaned and metal<br />
cleaning where metal working oil, grease, pitch wax, etc are cleaned (IPCC/TEAP, 2006).<br />
HCFC consumption in the solvent industry is estimated to be at 286 tonnes in 2010 (Ozone Cell, 2013). The<br />
two major HCFCs used within the industry were HCFC-123 (Ozone Cell, 2009) and HCFC-141b (UNEP, 2012).<br />
Overall chemical demand (HCFC, HFC or any other alternative) in the industry has been assumed to grow along<br />
with GDP. GDP assumptions are used from the GCAM model. Replacement of HCFCs by other alternatives has<br />
been taken as 1:1 by weight of chemical. Historically, emissions from solvent applications generally have been<br />
considered prompt emissions because 100 percent of the chemical is typically emitted within two years of initial<br />
use (IPCC, 2006).<br />
<strong>Emissions</strong> of HFCs from solvent use in year t are calculated as follows,<br />
<br />
Equation 7<br />
<br />
emissions in year t [tonnes of HFC]<br />
M t<br />
quantity of solvents manufactured in year t [tonnes of HFC]<br />
M (t-1)<br />
quantity of solvents manufactured in year t–1 [tonnes of HFC]<br />
EF<br />
emission factor [% factor]<br />
In the absence of country-specific data, it is good practice to use a default emission factor of 50 percent of the initial<br />
charge/year for solvent applications (IPCC, 2006). Due to higher cost of HFCs and ready availability of other<br />
low cost and acceptable alternatives, IPCC projects that less than 3% of solvent chemical demand could be met by<br />
HFCs (IPCC/TEAP, 2006). The HFCs considered under BAU are HFC-43-10mee and HFC-365mfc.<br />
Aerosols<br />
Aerosols can be divided in to two major categories- medical and non-medical. Non-medical aerosol are majorly<br />
used in perfumes, shaving foams, insecticides, paints, pharmaceuticals etc (Ozone Cell, 2010). Medical aerosols are<br />
used in Metered Dose Inhalers (MDI). HCFC consumption in the aerosol industry in 2010 was estimated to be 114<br />
tonnes (Ozone Cell, 2013). Over all chemical demand (HCFC, HFC or other alternatives) within the industry is<br />
assumed to grow along with the GDP. GDP estimates are taken from the GCAM and mentioned in Table 1. HCFC<br />
replacement is assumed to be 1:1 by weight.<br />
Aerosol emissions are considered prompt because all the initial charge escapes within the first year or two after<br />
manufacture (IPCC, 2006). During the use of aerosols, 100 percent of the chemical is emitted (IPCC, 2006). <strong>Emissions</strong><br />
of HFCs from aerosols use in year t are calculated as follows,
India’s Long Term Hydrofl uorocarbon <strong>Emissions</strong><br />
23<br />
<br />
Equation 8<br />
E t<br />
emissions in year t [tonnes of HFC]<br />
M t<br />
quantity of solvents manufactured in year t [tonnes of HFC]<br />
M (t - 1)<br />
quantity of solvents manufactured in year t–1 [tonnes of HFC]<br />
EF<br />
emission factor [% factor]<br />
Majority of the conversions of non-medical aerosols encouraged by the Montreal Protocol in the developed countries<br />
have been to ozone- and climate-safe propellants such as hydrocarbons (HC), dimethylether (DME), CO 2<br />
, or<br />
nitrogen (N 2<br />
) (IPCC/TEAP, 2006). The HFCs considered under BAU are HFC-134a, HFC-227ea, and HFC-152a<br />
(IPCC, 2006). The use of HFCs in this sector is limited.
24<br />
3. Results at the<br />
Sectoral Level<br />
3.1 <strong>Emissions</strong> from Residential Sector: Air-Conditioners and Refrigerators 1<br />
With increasing urbanization and growth, more and more Indians are moving in bigger homes and buying appliances<br />
required for an urban and higher income lifestyle. This shift in behaviour, largely induced by income, is<br />
bound to impact the demand for electricity. In fact, it is the residential sector which can be expected to be the primary<br />
driver of future electricity demand in India, as the other two big sectors transportation and industry depend<br />
heavily on direct application of fossil fuels rather than electricity.<br />
Total electricity demand in India across end use sectors will grow by six and a half times between 2010 and 2050,<br />
which is a huge growth, but likely as India’s per capita electricity consumption is still less than 900 KWh/capita.<br />
A large part of this growth is fuelled by increasing demand from the residential and commercial sector. Total per<br />
capita electricity production in India even in 2050 is 4,000 KWh. The average developed country’s consumption is<br />
7,000-8,000 KWh/capita/year. The residential and commercial building sector’s share in India’s electricity demand<br />
grows from 40% in 2010 to 57% in 2050.<br />
Total electricity consumption in India’s residential sector grows significantly, and stands at 1,813 TWh in 2050,<br />
which is 11 times of the consumption in 2010. In terms of electricity per unit floorspace, consumption grows<br />
from 12 KWh per m 2 in 2010 to 43 KWh per m 2 in 2050. The low figure of consumption in 2005 is because it also<br />
includes large rural floorspace, for which the electricity consumption intensity is abysmal due to low and erratic<br />
supply of power. Though the increase in electricity consumption, controlled for floorspace growth, is three and a<br />
half times across 40 years, the growth in service is much more as all electricity appliances, including room ACs,<br />
refrigerators, lighting, and other appliances, all become more and more efficient with time.<br />
A large part of the growth in residential sector’s electricity consumption is due to increase in air conditioning<br />
(Figure 5). As incomes grow, more and more people buy ACs. Impact of rising temperatures exacerbate this behaviour.<br />
In terms of share, AC electricity consumption increases from 9% of total residential electricity in 2010<br />
to 30% in 2050. Though refrigerator use will keep on growing in the future, this service is expected to consume<br />
8% of residential electricity consumption in 2050, which is also a significant number. Even though the stock of<br />
domestic refrigerators and ACs is not very different, energy consumption by refrigerators is low due to their lower<br />
unit energy consumption compared to ACs, which consume significant energy even with efficiency improvements.<br />
1 The interim results for residential air-conditioning sector were presented in the working paper ‘Chaturvedi V & Sharma M. 2014. Modelling<br />
long term HFC emissions from India’s residential air-conditioning sector. CEEW Working paper 2014/7’ .
India’s Long Term Hydrofl uorocarbon <strong>Emissions</strong><br />
25<br />
F igure 5: Residential AC-stocks, electricity consumption and emissions<br />
Source: CEEW analysis<br />
The stock of residential refrigerators in India grows from 48.5 million units in 2010 to 83 million units in 2020<br />
and 353 million units in 2050 (Figure 6). Compared to this, the stock of ACs grows at a much faster pace. AC<br />
stock increases from 2.6 million units in 2005 to 38 million units in 2020, and further to 445 million units in 2050<br />
(Figure 5). The stock of ACs in a high income India is higher than the stock of refrigerators in residential sector of<br />
India, which is most likely and is supported by what is already observed in terms of household behaviour. A given<br />
high income household will in all likelihood own only one fridge, but can own two or even three ACs for cooling<br />
separate rooms.<br />
Fi gure 6: Residential refrigerator-stocks, electricity consumption and emissions<br />
Source: CEEW analysis<br />
Comparing our results with the results from other studies, our forecast for the stock of ACs in India is well within<br />
the range of estimates by other studies. Our estimates of future stock of refrigerators in India are lower than estimates<br />
from other studies. Figure 7 compares estimates from our study with estimates from other studies. It should<br />
be noted here that the underlying assumptions of economic growth, energy prices, and efficiency improvements<br />
might be different between these different studies. However looking at the final results on the number of ACs in<br />
India in the future, our estimates are broadly midway as compared to the range based on other studies.
26<br />
Results at the Sectoral Level<br />
Fig ure 7: Comparison of CEEW residential AC and refrigerator stock under reference scenario with other studies<br />
Source: CEEW analysis<br />
If all the ACs move towards using HFC-410a as the alternative refrigerant instead of HCFC-22, HFC emissions<br />
from residential ACs will grow from less than 1 MtCO 2<br />
-eq in 2015 to 178 MtCO 2<br />
-eq in 2050. Indirect emissions<br />
from carbon dioxide use will grow from 24 MtCO 2<br />
-eq in 2015 to 318 MtCO 2<br />
-eq in 2050. This implies that the<br />
share of HFC emissions in the global warming impact of residential AC sector will be 36% in 2050.<br />
In contrast to this, global warming impact of HFC emissions from the residential refrigeration sector will be 3.5%<br />
in 2050. Total direct and indirect emissions from this sector will be 91 MtCO 2<br />
-eq in 2050, one-fifth of that of the<br />
residential AC sector. Smaller refrigerant charge rates per unit, as well as low leakage rates from domestic refrigerators<br />
are the key reasons for the small share of future HFC emissions from this sector.<br />
3.2 <strong>Emissions</strong> from Commercial Sector: Air-Conditioners and Refrigerators<br />
Huge growth in commercial floorspace is expected, which is an important underlying reason for total growth in<br />
commercial electricity demand. Total commercial floorspace in India grows from 520 million m 2 in 2005 to 10,600<br />
million m 2 in 2050. Consequently, total electricity consumption in India’s commercial sector grows significantly<br />
as well, and stands at 1,132 TWh in 2050, up from 85 TWh in 2010. In terms of electricity per unit floorspace,<br />
consumption grows from 67 KWh per m 2 in 2005 to 107 KWh per m 2 in 2050. Commercial sector appliances are<br />
also expected to gain from enhanced energy efficiency improvements.<br />
The installed capacity of commercial air-conditioning increases significantly from 51 TWh in 2010 to 1,489 TWh<br />
in 2050 (Figure 8). The increase in installed capacity is one and a half times of the increase in commercial floorspace,<br />
implying that cooling intensity of commercial floorspace increases rapidly with higher incomes and temperature.<br />
This is something already evident in the growing number of commercially build space including offices,<br />
malls, hotels, and many other establishments. The nature of commercial floorspace is significantly different in rural<br />
and urban areas. With increase in urbanization, India will also witness a transition from informal commercial establishments<br />
in rural areas to formal businesses and service delivery in urban areas, which is bound to increase the<br />
cooling intensity of floorspace which is evident in our results.
India’s Long Term Hydrofl uorocarbon <strong>Emissions</strong><br />
27<br />
Figu re 8: Commercial AC-installed capacity, electricity consumption and emissions<br />
Source: CEEW analysis<br />
Commercial refrigeration is an interesting category consisting stand alone units, vending machines, and remote<br />
condensing units. The growth of this category depends critically on increase in supermarkets and hypermarkets.<br />
With change in consumer preferences and food habits, the Indian market is already witnessing a move towards<br />
frozen foods, especially in the urban areas. We can expect this category to grow significantly in the future. By 2050,<br />
the total number of units in the market are expected to cross 25 Million units. Of this 45% each will be stand alone<br />
units and remote condensing units. In terms of HFC emissions, this sector is expected to have a significant share<br />
due to the high leakage rates. Total HFC emissions from this sector will increase to 71 MtCO 2<br />
-eq in 2050, which<br />
is 14% of total HFC emissions from India in 2050.<br />
Cooling energy takes 34% share of commercial sector electricity consumption in 2010, its share fluctuates around<br />
this figure throughout the next 40 years. Commercial refrigeration related electricity consumption share also increases<br />
from 8% in 2005 to 11% in 2050 of total commercial sector electricity consumption. <strong>Energy</strong> consumption<br />
for cooling commercial floorspace grows substantially from 24 TWh in 2010 to 384TWh in 2050. Both floorspace,<br />
and electricity per unit floorspace grows significantly for the commercial sector. Efficiency for cooling appliances<br />
is expected to double by 100% between 2005 and 2050, which implies much higher cooling service delivered with<br />
lower increase in electricity consumption.<br />
Figure 9: Commercial refrigeration-stocks, electricity consumption and emissions<br />
Source: CEEW analysis<br />
As is the case with residential AC sector, the global warming impact of HFC emissions from the commercial AC<br />
sector is also significant. HFC emissions from the commercial AC sector increase from 1 MtCO 2<br />
-eq in 2015 to<br />
125 MtCO 2<br />
-eq in 2050. Corresponding indirect carbon dioxide emissions from electricity usage increase from 30<br />
MtCO 2<br />
-eq in 2015 to 226 MtCO 2<br />
-eq in 2050, implying that the share of global warming impact of HFC emissions<br />
in commercial sector’s total global warming impact will be 35% in 2050. In the case of commercial refrigeration,
28<br />
Results at the Sectoral Level<br />
this impact is even higher. Due to high leakage rates, HFC emissions from this sector are almost equal to the indirect<br />
carbon-dioxide emissions in 2050, each being almost 70 MtCO 2<br />
-eq.<br />
3.3 <strong>Emissions</strong> from Mobile Air-Conditioning: Passenger Cars, Buses and<br />
Railways<br />
The share of transportation sector in India’s energy consumption as well as emissions is lower compared to the<br />
residential and industrial sector. However, it is expected that the growth in energy demand and emissions will be<br />
highest for this sector. Along with air-conditioners, cars is another personal asset which has been showing tremendous<br />
growth with rising incomes in India. In fact, there are a number of options in the Indian car markets which<br />
cater to the need of different income segments. First time buyers of middle income families have the option of<br />
buying small cars, which are the main stay of the Indian market. Families that graduate to a higher level of income<br />
have the option of buying bigger and more expensive cars. With successive governments investing heavily in road<br />
infrastructure, particularly long distance highways, passenger road travel is becoming increasingly comfortable.<br />
Increasing personal incomes as well as macro-economic activity is the primary driver for increasing passenger<br />
transportation service demands.<br />
Passenger transportation service is expected to increase with increasing per capita incomes, as has been observed in<br />
many other regions of the world. Total passenger service demand, across motorized and non-motorized transport<br />
modes, increases from 5 trillion pass-km in 2010 to 20 trillion pass-km in 2050. There are many modes of travel<br />
that service this demand, and most of the passenger service demand is met through motorized road and rail travel<br />
which meet 81% of the travel service demand in 2050. Rest is largely met by aviation sector. However, in terms of<br />
energy consumption, the aviation sector is most energy intensive and hence ends up taking a major share in India’s<br />
passenger transport sector fuel consumption, 52% in 2050 up from 12% in 2010.<br />
Figure 10: Car-stocks, energy consumption and emissions<br />
Source: CEEW analysis<br />
A huge increase is witnessed in the ownership of cars with rising Indian incomes. Car stock increases from 10 million<br />
units in 2010 to 43 million units in 2020 and 245 million units in 2050 (Figure 10). Growth in car stock is<br />
particularly high between 2015 and 2035 between which a high growth rate is assumed which will propel sales of<br />
cars. High growth in the overall transport sector demand ensures that the share of energy consumption from cars<br />
in total transportation sector energy consumption does not increase beyond 31% in 2050.
India’s Long Term Hydrofl uorocarbon <strong>Emissions</strong><br />
29<br />
Figure 11: Bus: Stock, energy consumption and emission<br />
Source: CEEW analysis<br />
Comparing our results with the results of other studies, we find that our estimates for both service demand as well<br />
as stock of cars in the future is more on the conservative side (Figure 12 and Figure 13). Our estimates are above<br />
the low growth estimates of other studies, but lower compared to the high growth results from other studies, which<br />
is also an assumption in our reference case. Our estimates of the future stock of buses is much lower compared to<br />
all other high growth scenarios (Figure 13). Comparing the results, we can conclude that our estimates are well<br />
within the range, though more on the conservative side.<br />
Figure 1 2: Comparison of passenger service for cars and buses from various sources<br />
Source: CEEW analysis<br />
Figure 13 : Comparison of stocks of cars and buses from various sources<br />
Source: CEEW analysis
30<br />
Results at the Sectoral Level<br />
In a developing country like India, public transportation is an important service. Buses, along with Indian Railways<br />
have provided that role of providing public transportation service. Buses meet 60% of current passenger<br />
service demand in India, and even with more and more people shifting towards cars, buses will meet almost half of<br />
total passenger service demand in India in 2050. Buses are very important from the perspective of meeting travel<br />
demands of a large concentration of population, many of which are lower or lower-middle income class. Hence<br />
from a developing country perspective, even though car ownership will grow many folds in the future, importance<br />
of bus service for meeting travel demand of a large and populous country is unlikely to be diminished. The stock<br />
of buses increases by two and a half times between 2010 and 2050.<br />
Railways have played an important role in India, especially for meeting long distance transportation needs. Passenger<br />
service delivered by railways is expected to more than double between 2010 and 2030. However, beyond<br />
this time, it is expected to be stagnant or decline slowly as with higher incomes more and more people shift to air<br />
travel. However in terms of the scale of India’s railways passenger transportation, we don’t expect any decline in<br />
its magnitude and significance. Total energy consumption by Indian railways increases, but its share in total transportation<br />
energy consumption decreases significantly from 6% in 2010 to only 1% in 2050. Number of railway<br />
coaches will follow the trend of total passenger service. In 2005, total railway coaches in India were 40,000 which<br />
is expected to increase to 1,25,000 coaches at its peak in 2025/30.<br />
With a high increase in the ownership of cars, HFC emissions from cars increase significantly to 75 MtCO 2<br />
-eq in<br />
2050, up from 1.6 MtCO 2<br />
-eq in 2010. Corresponding emissions from buses are 2.6 MtCO 2<br />
-eq in 2050, and that<br />
from AC railway coaches are .27 MtCO 2<br />
-eqin 2050. This shows that in the mobile air-conditioning sector, cars<br />
are going to take a lion’s share in the HFC emissions. Carbon dioxide emissions from oil consumption in cars are<br />
however are much larger, and increase from 13.7 MtCO 2<br />
-eq in 2010 to 263 MtCO 2<br />
-eq in 2050. Thus the global<br />
warming impact of HFC emissions in the total emissions from cars in 2050 will be 22%. For buses, this share is<br />
merely 3% in 2050, and for railways it is will be negligible.<br />
3.4 Freight Transport <strong>Emissions</strong><br />
Freight transportation is a critical part of economic activity. As the economy grows, demand for produced final<br />
goods as well as raw material grows, which leads to higher energy consumption and emissions. Clearly, it is the<br />
economic activity that determines demand for freight transportation services.<br />
Figure 14: Trucks: Stocks, energy consumption and emissions<br />
Source: CEEW analysis<br />
Freight transportation in India is driven either by goods trains of the Indian Railways, or through trucks. There<br />
are different types of trucks used for transportation of goods. Broadly speaking, these can be categorized in heavy<br />
duty and light duty trucks. As far as HFC emissions are concerned, trucks are the most relevant category. A ma-
India’s Long Term Hydrofl uorocarbon <strong>Emissions</strong><br />
31<br />
jor part of the current stock of Indian trucks is old and inefficient, without any air-conditioning available for the<br />
driver. However in the future with increased incomes, we do expect a higher share of trucks fitted with ACs for<br />
the driver’s compartment.<br />
Total road and rail freight transportation demand is expected to grow by seven and a half times between 2010 and<br />
2050, to 8,900 billion Ton-Km in 2050. The share of freight transported by road has been increasing in the past<br />
and was 70% (NTDPC, 2013) in 2012. This share was assumed to be constant over the time horizon. Total stock<br />
of light and heavy duty trucks will increase from 6.3 million trucks in 2010 to 46.8 million trucks in 2050, and a<br />
similar rate of growth will be seen in the associated energy consumption (Figure 14).<br />
Figure 15: Comparison of freight service and stock of trucks<br />
Source: CEEW analysis<br />
Comparing our results with the results of other studies, we find that our estimates for both service demand as well<br />
as stock of freight trucks in the future is more on the conservative side (Figure 15). Our estimates of fright service<br />
from trucks is lower than estimates of other studies (Figure 15). Our estimates of the future stock of trucks is much<br />
lower compared to other estimates (Figure 15). Literature on the future of freight sector in India is very limited and<br />
more research is required for this sector.<br />
As highlighted earlier, currently the share of trucks with air-conditioning is negligible in India. As the penetration<br />
rate of ACs in trucks increases, HFC emissions increase by over a thousand times between 2015 and 2050. However,<br />
in absolute terms, HFC emissions from this sector are still negligible. Especially when compared to the carbon<br />
emissions from this sector, HFC emissions even in 2050 are only 1.5% of the carbon dioxide emissions.<br />
3.5 <strong>Emissions</strong> from Industrial Sectors and Refrigerated Transport<br />
Industrial sector GHG emissions in India are expected to grow by leaps and bounds as industrial activity grows.<br />
However, there are only few industries that deal with HFCs and which are the source for HFC emissions. Mainly<br />
these are foams, medical and non-medical aerosols, and solvents. Our study assumes that the consumption of<br />
HFCs in these industrial sectors will grow with GDP. But HFC emissions across these sectors grow differently<br />
because of the different leakage rates.<br />
Highest growth in emissions is observed in the foam sector (Figure 16). The share of HFC emissions from the<br />
foam sector in total HFC emissions from key industrial sectors grows from 13% in 2015 to 81% in 2050. Though<br />
medical aerosols constitute of 55% of all industrial HFC emissions in 2015, their share will be 6.5 % in 2050 as<br />
these can be expected to grow only with population and not with GDP. Non-medical aerosols, like those used in<br />
deodorant sprays etc. can be expected to grow with GDP and hence increase their share over medical aerosols.<br />
HFC emissions from solvents is going to be negligible throughout the future.
32<br />
Results at the Sectoral Level<br />
Figure 16: E missions from industrial sectors and transport refrigeration<br />
Source: CEEW analysis<br />
Transportation refrigeration is a category that has the potential for growing fast and the Indian consumer food<br />
market is already witnessing a paradigm shift towards refrigerated products. Currently, a large part of the refrigerated<br />
transportation stock is for transporting dairy products that have a short shelf life. Dairy demand will definitely<br />
grow in the future with more and more people who graduate to middle income group from a lower income<br />
group increasing their intake of dairy products. At the same time, Indian market is expected to witness an increase<br />
in other refrigerated products.<br />
Increase in commercial refrigeration is a very good indicator of the kind of growth that refrigerated transportation<br />
will witness. Using the same growth rate, and sector specific refrigerant and leakage rates, we find that HFC emissions<br />
from transport refrigeration will grow hugely, even though in terms of absolute emissions, the level would be<br />
low. In 2050, HFC emissions from this sector would be less than Five MtCO 2<br />
-eq.
India’s Long Term Hydrofl uorocarbon <strong>Emissions</strong><br />
33<br />
4. Overall HFC <strong>Emissions</strong> and<br />
Carbon Dioxide <strong>Emissions</strong><br />
Our research aims at estimating future trajectory of HFC emissions across sectors for India. We undertake this assessment<br />
for residential, commercial, transportation, and industrial sectors and up to time period 2050. The analysis<br />
is undertaken within the integrated assessment modelling framework of Global Change Assessment Model<br />
(GCAM). We first estimate the increase in penetration of different energy service technologies like air-conditioners<br />
and cars based on assumptions around economic activity, and then estimate the HFC emissions from these sectors<br />
based on refrigerant charge rates and leakage rates. Apart from estimating the time path of HFC emissions across<br />
sectors, we also compare these to the indirect emissions from energy use in these sectors to get a perspective on<br />
how big are future HFC emissions going to be compared to the indirect energy use emissions across sectors as<br />
well as in totality for India. We focus only on emissions during the lifetime of equipment including the end of life<br />
emissions.<br />
Figure 17: HF C emissions across sectors<br />
600<br />
HFC emissions across sectors<br />
Solvents<br />
Foams<br />
<strong>Emissions</strong> in MtCO2-eq Eq<br />
500<br />
400<br />
300<br />
200<br />
Aerosols<br />
Transport Refrigeration<br />
Freight Trucks<br />
Mobile AC- Railways<br />
Mobile AC- Buses<br />
Mobile AC- Cars<br />
Commercial Refrigeration<br />
Source: CEEW analysis<br />
100<br />
0<br />
2010 2015 2020 2025 2030 2035 2040 2045 2050<br />
Residential Refrigeration<br />
Commercial Cooling<br />
Residential Cooling<br />
The first key finding is that HFC emissions grow significantly if India transitions from HCFCs to HFCs across<br />
sectors. Currently the key HCFC consumption sectors are moving away from these. Transportation sector has already<br />
shifted away from HCFCs towards HFC-134a. Consequently, even if economic activity is constant, there is<br />
going to be an increase in HFC emissions that replace HCFC emissions. However, the increase in HFC emissions<br />
for India comes from the significant growth in usage of energy service technologies. As people become wealthier,<br />
there is a high penetration of residential and commercial space cooling and refrigeration appliances, as well as<br />
personal cars. Consequently HFC emissions also increase, and are equal to 500 MtCO 2<br />
-eq in 2050 (Figure 17).<br />
Cumulative HFC emissions across sectors between 2010 and 2050 for India stand at 6.65 Billion tonnes of carbon<br />
dioxide equivalent.
34<br />
Overall HFC <strong>Emissions</strong> and Carbon Dioxide <strong>Emissions</strong><br />
In terms of sectoral share of emissions, the four big sectors contributing to emissions are residential cooling, commercial<br />
cooling, mobile air-conditioning in cars, and commercial refrigeration. In 2050, these sectors respectively<br />
are responsible for 35%, 28%, 15% and 14% of overall HFC emissions for India. For the first three sectors, the<br />
key driver of increasing emissions is undoubtedly increase in economic activity that leads to higher penetration of<br />
household and commercial appliances and vehicles. For the fourth sector however it is the high leakage rate that<br />
results in a significant share of the emissions from this sector. Industrial sectors in total account for only 5% of all<br />
HFC emissions in 2050.<br />
Figure 18: Sha re of global warming impact of HFC emission in sectoral GHG emissions in 2050<br />
Source: CEEW analysis<br />
On comparing direct HFC emissions from various sectors to indirect emissions from energy use, we find that operational<br />
and end of life HFC emissions from the residential cooling sector are responsible for 36% of the global<br />
warming impact from this sector in 2050 (Figure 18). Though direct HFC emissions from the commercial sector<br />
are smaller than that of the residential cooling sector, in terms of GHG impact these are 38% of the global warming<br />
impact of this sector. Interestingly it is the commercial refrigeration sector that has the highest global warming<br />
impact of direct HFC emissions, which amounts to 50% of the total impact of this sector. For all other sectors, the<br />
global warming impact of direct HFC emissions is very low. This is especially true for the industrial and freight<br />
trucks sectors, where energy use and consequent carbon dioxide emissions are very high.<br />
In terms of total global warming impact of HFC<br />
emissions in India, the share is 5.4% in 2050 when<br />
compared to total carbon dioxide and HFC emissions<br />
from India (Figure 19: Share of global warming<br />
impact of HFC emissions in total GHG emissions<br />
from India in 2050). Apart from the HFC<br />
consumption sectors, there are many sectors that<br />
use energy from primary energy fuels as well as<br />
electricity and contribute to carbon dioxide emissions.<br />
E.g. industrial sector is a big contributor to<br />
carbon dioxide emissions, but there are only few<br />
sub sectors emitting HFCs. So even if for individual<br />
sectors the share of HFC emissions in total GHG<br />
emissions could be big, in terms of the national<br />
contribution carbon dioxide emissions take a share<br />
of almost 95% in 2050. We should note here that<br />
Figure 19: Shar e of global warming impact of HFC emissions in<br />
total GHG emissions from India in 2050<br />
Source: CEEW analysis<br />
emissions from other potent greenhouse gases like methane are not included in this assessment. With additional<br />
GHGs coming into the picture, this share of HFCs can only be expected to be lower.
India’s Long Term Hydrofl uorocarbon <strong>Emissions</strong><br />
35<br />
5. Sensitivity Analysis:<br />
Economic Growth and<br />
Leakage Rates<br />
How the future will unfold is impossible to predict. We still try to understand how the future might shape itself<br />
given our best understanding of how the economy and technologies will evolve in the future. Our Reference scenario<br />
explores our best understanding of economic growth for India, as well as how efficiencies will change. We<br />
have however assumed that charge rates as well as leakage rates will stand as they do currently to the best of our<br />
understanding. Though this gives us a solid understanding of how HFC emissions across sectors can be expected<br />
to grow in the future, we do recognise that there are two critical variables that have a large impact on the future<br />
HFC emission trajectories. One is economic growth rates, and the other is leakage rates.<br />
In the past 20 years, economic growth in India has fluctuated widely. Growth slowly started picking up by mid<br />
1990s, however there was a dampening impact of the east Asian crisis by the end of last century. Post that period,<br />
the benefits of economic reforms started becoming evident and Indian real GDP growth reached a high of over<br />
9% for three consecutive years post 2005. Post 2010 this growth rate however decelerated to below 5% in the last<br />
fiscal year due to international economic conditions as well as stalling of domestic economic reforms within the<br />
country. Growth rate has already started picking up with expectations of a new set of economic reforms. Analysts<br />
and experts expect growth to move beyond 8% in the near term, and this is what our Reference scenario reflects.<br />
However, past experience has shown us that economic growth can also slow down, which will impact our results<br />
of future HFC emissions. Table 1 in the methodology section already highlights the high and low economic growth<br />
assumptions.<br />
Figure 20: Emiss ion from sectors in reference case and low growth scenario<br />
Source: CEEW analysis<br />
Sectoral HFC <strong>Emissions</strong> in Mt-CO2-eq<br />
300<br />
250<br />
200<br />
150<br />
100<br />
50<br />
0<br />
2010 2015 2020 2025 2030 2035 2040 2045 2050<br />
Resi Ref Growth<br />
Resi Low Growth<br />
Comm Ref Growth<br />
Comm Low Growth<br />
Trans Ref Growth<br />
Trans Low Growth<br />
All Other Ref Growth<br />
All Other Low Growth<br />
Our results for the low economic growth scenario show that even with lower income growth, HFC emissions<br />
will increase to 324 MtCO 2<br />
-eq in 2050. This figure is 35% lower compared to our Reference scenario HFC emissions.<br />
Figure 20 shows emissions from different sectors in our reference case and low growth scenario. The share<br />
of different sectors in overall HFC emissions remains the same irrespective of the growth scenario. Interestingly,<br />
if we compare direct HFC emissions to indirect carbon dioxide emissions from energy use, we find that the share
36<br />
Sensitivity Analysis: Economic Growth and Leakage Rates<br />
of HFC emissions in the global warming impact of Indian emissions remains almost the same, irrespective of the<br />
growth scenario. Lower economic growth means lesser number of air-conditioner and cars, consequently lesser<br />
energy consumption and hence lesser resultant carbon dioxide emissions from energy use. Thus irrespective of the<br />
economic growth, the share of India’s HFC emissions in total carbon dioxide and HFC emissions will be 5.5%-<br />
5.6% in 2050.<br />
Given an economic growth trajectory and penetration of ACs or cars in the market, HFC emissions can vary depending<br />
on leakage rates. Leakage rates is an important variable as this determines how many times an equipment<br />
will need to be recharged within its lifetime. The current understanding is that recovery rate of refrigerant left in<br />
the equipment is very low, close to zero. This is because there is no incentive for the service personnel to conserve<br />
refrigerant. So leakage rates do matter, and our assumptions around high, low and reference leakage rates across<br />
HFC emission sectors are mentioned in the methodology section (Table 4).<br />
Figure 21: HFC em ission from different sectors in reference case, low and high growth scenario<br />
Sectoral HFC <strong>Emissions</strong> in Mt-CO2-eq<br />
300<br />
250<br />
200<br />
150<br />
100<br />
50<br />
0<br />
g<br />
y<br />
Resi High<br />
Resi Ref<br />
Resi Low<br />
Comm High<br />
Comm Ref<br />
Comm Low<br />
Trans High<br />
Trans Ref<br />
Trans Low<br />
2010<br />
2015<br />
2020<br />
2025<br />
2030<br />
2035<br />
2040<br />
2045<br />
2050<br />
Source: CEEW analysis<br />
We find that relative to the reference leakage rate scenario, total HFC emissions in 2050 increase by 29% in the<br />
high leakage rate scenario, and decrease by 39% in the low leakage rate scenario. In absolute terms, total emissions<br />
vary from 307 MtCO 2<br />
-eq to 645 MtCO 2<br />
-eq in 2050 depending on the assumptions around leakage rate. In terms<br />
of percentage of total GHG emissions from India, the global warming impact of overall HFC emissions varies<br />
from 3.5% to 7.3% in 2050. In the reference scenario this impact is 5.4%. These numbers have been estimated for<br />
the reference growth assumptions, and as highlighted earlier should be valid for the low growth scenario as well.<br />
Figure 21 summarises HFC emission from residential, commercial and transportation segments in low, medium<br />
(reference case) and high leakage scenarios.
India’s Long Term Hydrofl uorocarbon <strong>Emissions</strong><br />
37<br />
6. Estimates of Consumption<br />
of HFCs<br />
The Indian industry is following the HCFC phase-out management protocol and moving towards alternatives<br />
to HFCs. If India moves towards HFCs as happened in developed countries, we will see increasing demand and<br />
consumption of these chemicals. Based on our research, we estimate the consumption of different HFC refrigerants<br />
in different sectors. This estimation depends on the underlying distribution of different technologies and refrigerants<br />
and our assumptions on these are highlighted in the methodology section. These estimates don’t include<br />
HFCs required for feedstock purposes. Also, there is no publicly available information/data on HFC consumption<br />
in 2010 or any other year thereafter. So the numbers for 2010 and 2015 are also our own estimates. It should be<br />
highlighted that even if base year data for calibration is not available, our methodology of estimating future HFC<br />
emissions based on number of equipment, charge rates, and leakage rates ensures that the lack of base year data<br />
on HFC consumption does not affect our estimates for the future.<br />
Figure 22: Long te rm HFC consumption for key sectors for India<br />
Source: CEEW Analysis<br />
As is the case with emissions, we find that if all the sectors move towards HFCs, biggest HFC consumers will be<br />
the commercial and residential air-conditioning sector (Figure 22). This will be followed by consumption demand
38<br />
Estimates of Consumption of HFCs<br />
from the mobile air-conditioning sector which has already shifted completely towards HFC-134a, and the commercial<br />
refrigeration sector due to high leakages in this sector. In the industrial sectors, foam sector will be the one<br />
with the largest demand for HFCs with consumption of 30,000 Tonnes of HFCs in 2050.<br />
The Indian amendment proposal proposes that HFC consumption in Article 5 countries peaks in 2030-31 and<br />
then declines to 15% of the baseline value in 2050. Figure 22 also shows the consumption of various HFCs across<br />
sectors in 2030. We can expect this magnitude of demand for various HFC chemicals in India in 2030. Beyond<br />
2030, demand for these chemicals will depend on the result of international negotiations and a globally accepted<br />
HFC phase-down pathway. Even if HFC consumption is frozen in 2030, our estimates are a good pointer to the<br />
magnitude of long term demand for alternatives to high GWP HFCs.
India’s Long Term Hydrofl uorocarbon <strong>Emissions</strong><br />
39<br />
7. Implications of the Indian<br />
Amendment Proposal<br />
If the Indian market follows the trend observed in developed countries, then a steep rise in HFC consumption<br />
could be expected, as a result of the rise in residential and commercial cooling and refrigeration technologies.<br />
HFCs are one of the highly potent greenhouse gases, which have been largely left out of the mitigation discussion<br />
in India until now. Recognising the criticality of mitigating HFCs, and for sending a strong signal to the Indian<br />
markets to prepare for the transition, the government has recently proposed an amendment to the Montreal Protocol<br />
for the inclusion of HFC’s within its legal framework. As per Government of India analysis, the proposal,<br />
if accepted, would mean that consumption of HFCs in India will peak in 2031, and will need to decline to 15%<br />
of the peak value by 2050. The proposal highlights a key change in India’s stand on greenhouse gas mitigation,<br />
particularly HFCs.<br />
It is critical to quantify the carbon dioxide equivalent mitigation potential of HFC mitigation if the Indian amendment<br />
proposal is adopted. Our study is first of its kind HFC modelling analysis for India and quantifies HFC<br />
emissions in the scenario when HFCs replace HCFCs following the phase-out management protocol. We find that<br />
cumulative HFC emission over the next 35 years will be 6.55 Gt CO 2<br />
eq across all HFC emission sectors.<br />
A freeze in HFC consumption in 2031 implies that market transitions will have to start much earlier because<br />
servicing related consumption will be a big component of India’s HFC consumption. Equipment sold in 2025 will<br />
need HFCs for servicing requirement for 10 or even 20 years post 2025, depending on the technology and sector.<br />
As there is a lag between HFC consumption and HFC emissions, freeze in consumption in 2031 as per the Indian<br />
amendment proposal will mean that HFC emissions will peak around 2035-36. Indian HFC emissions should<br />
decline to 15% of the peak value in 2055-56, if the Indian amendment proposal is accepted.<br />
The phase-down schedule between 2031 and 2051 could be stepwise, as in the case with HPMP. Looking at emissions<br />
only until 2050 if we assume that the phase-down schedule is linear, CEEW study finds that 4.2 GtCO 2<br />
eq.<br />
is avoided between 2010 and 2050, which is 64% of the total HFC which will emitted between 2010 and 2050<br />
if consumption is not frozen. Between 2050 and 2100 however, avoided HFC emissions amount to almost 41 Gt-<br />
CO 2<br />
eq. The following table (Table 18) gives the details.
40<br />
Results at the Sectoral Level<br />
Table 16: Indian HFC emissions under the reference and Indian amendment scenarios<br />
Year<br />
Business as usual Indian HFC<br />
emissions<br />
(MtCO 2<br />
-eq.)<br />
HFC <strong>Emissions</strong> if Indian Amendment<br />
proposal is adopted (MtCO 2<br />
eq.)<br />
<strong>Emissions</strong> avoided (MtCO 2<br />
eq.)<br />
2010-20 134 134<br />
2020-30 699 567<br />
2030-40 1,879 1,028<br />
2040-50 3,845 613<br />
2010-50 6,557 2,342 4,215<br />
2050-2100 42,365 850 41,515<br />
Source: CEEW analysis<br />
Clearly, the Indian government has made a positive move in global HFC mitigation discussion, and this move will<br />
definitely result in significant avoidance of HFC emissions. What is important for now is to keep focusing on the<br />
issues of safety and technical performance. Further, energy efficiency while transitioning towards alternative low<br />
GWP refrigerants is also important, but that accounting will end up being counted as a mitigation of carbon dioxide<br />
emissions, even though it is propelled by a move towards low GWP refrigerants.
India’s Long Term Hydrofl uorocarbon <strong>Emissions</strong><br />
41<br />
8. Limitations and Future<br />
Research<br />
8.1 Limitations<br />
Modelling future pathway for any variable depends on a whole range of socio-economic as well as technical variables.<br />
The study has addressed two most important uncertainties, one arising out of the future economic growth,<br />
and the other due to lack of information about leakage rates. There can however be other variables also that impact<br />
the future penetration of ACs, cars and growth in different HFC emission sectors. Some of these are:<br />
• Urbanization rate: Urbanization is an important part of the development story of any country. With economic<br />
growth, countries around the world have seen significant transformations across decades with more and more<br />
cities coming into being and existing cities expanding beyond their traditional peripheries. There are significant<br />
differences in urban and rural lifestyles, purchasing power, and consumption patterns. India’s current<br />
urbanization rate stands at below 30%. Our paper assumes that by 2050, urbanization rate in India would<br />
be 53%. We do recognize that the relationship between urbanization rate and economic growth is strong, but<br />
quantification of this relationship is unclear at best. A higher or lower urbanization rate will impact the demand<br />
for floorspace as well as air-conditioning and future HFC emissions. Available estimates of urbanization<br />
rates of other countries with their GDPs validate our assumption.<br />
• Cooling degree days: Cooling degree days (CDDs) is an aggregate variable that represents the duration and<br />
intensity of cooling required within a given geographical region in a year. Constant cooling degree days would<br />
mean that the climate of future would be the same as current climate. However, business as usual energy consumption<br />
and emissions would result in global warming and rising temperatures and consequently increase<br />
the number of cooling degree days. Our study hence incorporates the impact of changing climate. It is however<br />
challenging to understanding the impact of rising atmospheric concentrations of greenhouse gases, and average<br />
temperature increases across different regions of the world. The temperature sensitivity is a parameter that<br />
is not well understood and research is ongoing for a better understanding of this parameter. Our modelling<br />
approach considers the impact of increasing temperature on cooling energy demand, however at the same<br />
time we do recognize the challenges in estimation of future cooling degree days. What is important is that the<br />
CDDs used by us have been derived using the same methodology for the base year as well as future years till<br />
2050, which makes CDD estimates consistent across years. Thus growth in cooling energy for building sector<br />
depends on the growth rate in CDDs, and not their absolute value per se. Irrespective of the absolute value<br />
of CDDs, if the future growth in CDDs is similar to our assumptions, our estimates should not be affected.<br />
• Charge rates: Charge rates of refrigerants along with the leakage rates determine HFC emissions. Charge<br />
rates depend on the refrigerant characteristics as well as equipment design. e.g. Charge size for HFC-32 is<br />
lower than R-410A. Historically, as air-conditioners have moved from CFCs to HCFCs to HFCs, charge rates<br />
have also declined. The decline is a function of the refrigerant characteristics itself as well as improvements in<br />
technology and design of equipment. Decline in charge rates has been achieved in refrigerators as well as air-
42<br />
Limitations and Future Research<br />
conditioners. We might expect that charge rates will decline in the future as well. However, what will be the<br />
speed and magnitude of this potential decline is speculative at best at the current moment. Due to this reason,<br />
our study does not get into sensitivity analysis around charge rates, but assumes that current charge rates will<br />
hold in the future. If charge rates do decline, estimates of HFC emissions will also decline in the future.<br />
• Efficiency assumptions: We have assumed more than modest increases in efficiencies of residential and commercial<br />
appliances, building stock, as well as that of vehicles which have been mentioned in the section on<br />
methodology. We however assume in our reference scenario that future appliances on an ‘average’ will not be<br />
super-efficient. Such super-efficient appliances can definitely penetrate the Indian market in a big way if there<br />
are strong policies driving these. Bureau of <strong>Energy</strong> Efficiency (BEE) has launched the super-efficient appliance<br />
programme which is designed to facilitate a rapid market transformation to these super-efficient models.<br />
Presently it focuses only on fans, but in the future when it is extended to other appliances, it would result in<br />
more aggressive energy efficiency improvements (EEI) in future that those envisaged under BAU scenario in<br />
our analysis. The assumed EEI trajectories in our model apply on the stock number. This hence implies that<br />
there will be a distribution around this mean value and the best available efficiency in 2050 might as well be<br />
much higher than the actual stock average efficiency in 2050 as assumed in our study. For instance, the LBNL<br />
estimates that classic energy efficiency options could mean 60-72% (Shah et al., 2011) more efficient room air<br />
conditioner from base case model (average EER 2.8 on 2010-11), whereas our assumption on ‘average’ stock<br />
efficiency improvement is 35%. It should be highlighted here that our efficiency assumptions don’t affect our<br />
estimates of future HFC emissions. Efficiency assumptions only impact energy consumption related carbon<br />
dioxide emissions. If the stock average efficiency ends up being higher than our assumptions, this would imply<br />
lower carbon emissions and hence a higher share of HFCs in the global warming impact of India’s greenhouse<br />
gas emissions.<br />
8.2 Future Research<br />
Our research is a first step towards quantification of mitigation potential and cost of leapfrogging way from high<br />
GWP HFCs in India. This report sets the baseline level of emissions till 2050 for different HFC emission sectors.<br />
We also explore key sensitivities around our estimates. Our report seeks to set the agenda for more insightful HFC<br />
research for aiding policy makers in making decisions. Following issues are important for future HFC research<br />
within India:<br />
• Cost of Transition: India’s amendment proposal to the Montreal Protocol signal’s clear intent on the part of<br />
Indian government that high GWP HFCs will be eventually phased down. However this transition will require<br />
investment at the industry level as well as across the value chain. In the amendment proposal, Indian government<br />
has highlighted that funding will be required for the ‘total’ cost of transition, as against the ‘incremental’<br />
cost of transition. Thus funding requirement will include investment in research and development, capacity<br />
development and training of human resources, as well as cost of a double transition if it happens. Estimating<br />
costs for all of these components is indeed very challenging. However estimating industry level cost is doable<br />
with the help of information from industry as well as a set of complementary assumptions. The Technical<br />
and Economic Assessment Panel (TEAP) already reports average estimates for the cost of transition towards<br />
alternative refrigerants across sectors. However these numbers are global averages. India specific research on<br />
estimating cost is required for a better understanding of this issue and informing policy makers.<br />
• Implications of various amendment proposals: Currently there are five amendment proposals submitted to<br />
the Montreal Protocol- Indian, North American, European, African, and Small Island States (Micronesian)<br />
proposal. International negotiations will determine what is going to be the ultimate shape of any amendment,<br />
and what elements from different proposals are reflected in the final amendment, if it happens. It is hence important<br />
to understand the implications for Indian industry as well as policy of not just the Indian amendment<br />
proposal, but also other proposals on the table in terms of HFC phasedown pathways for different sectors and<br />
the associated cost and technical challenges.
India’s Long Term Hydrofl uorocarbon <strong>Emissions</strong><br />
43<br />
• Regulatory framework for facilitating transition: India has rich experience of CFC phasedown, which was<br />
facilitated through a domestic regulatory framework. If India wants to ultimately phase down HFCs, it has to<br />
develop a similar regulatory framework sooner or later. Research on regulatory frameworks adopted by other<br />
nations, and how this experience and information can be aligned to Indian policy priorities and market situation<br />
will be useful for informing India’s regulatory policy.<br />
• Understanding technical challenges: Though there are low GWP alternatives available for high GWP HFCs<br />
across sectors, there are technical challenges that impede the transition towards these. E.g. HC-290 is a low<br />
GWP refrigerant, but is flammable which makes higher charge rates like those required in commercial establishments<br />
unfeasible due to safety considerations. Similarly low GWP alternatives for the mobile air-conditioning<br />
sector also need to satisfy technical requirements. Understanding these challenges, how is the Indian<br />
industry preparing to deal with these, international developments on these issues, and insights for Indian<br />
policy makers are critical for transitioning away from HFCs in India.
44<br />
References<br />
Akpinar-Ferrand, E., & Singh, A. (2010). Modeling increased demand of energy for air conditioners and consequent<br />
CO 2<br />
emissions to minimize health risks due to climate change in India. Environmental Science & Policy ,<br />
13 (8), 702-712.<br />
Amann, M., Bertok, I., Borken, J., Chambers, A., Cofala, J., & Dentener, F. (2008a). GAINS-Asia: A tool to combat<br />
air pollution and climate change simultaneously - Methodology report. Laxenburg, Austria.: International<br />
Institute for Applied Systems Analysis (IIASA).<br />
Amann, M., Kejun, J., Jiming, H., Wang, S., Wei, W., & Jia, X. (2008b). GAINS Asia: Scenarios for cost-effective<br />
control of air pollution and greenhouse gases in China. Laxenburg, Austria.: International Institute for Applied<br />
Systems Analysis (IIASA).<br />
Amann, M., Bertok, I., Borken-Kleefeld, J., Cofala, J., Heyes, C., Höglund-Isaksson, L., et al. (2011). Cost-effective<br />
control of air quality and greenhouse gases in Europe: Modeling and policy applications. Environmental<br />
Modelling and Software, 26 (12), 1489-1501.<br />
Amann, M., Klimont, Z., & Wagner, F. (2013). Regional and global emissions of air pollutants: Recent trends<br />
and future scenarios. Annual Review of Environment and Resource , 38, 31-55.<br />
Andersen, S. O., Halberstadt, M. L., & Borgford-Parnell, N. (2013). Stratospheric ozone, global warming, and<br />
the principle of uninteded consequences-An ongoing science and policy success story. Journal of the Air & Waste<br />
Management Association , 63 (6), 607-647.<br />
Capros, P., De Vita, A., Hoeglund-Isaksson, L., Winiwarter, W., Purohit, P., Bottcher, H., et al. (2013). EU <strong>Energy</strong>,<br />
Transport and GHG <strong>Emissions</strong> Trends to 2050 - Reference Scenario. Luxembourg: Directorate General for <strong>Energy</strong>,<br />
Climate Action and Mobility & Transport, European Commission.<br />
Chaney, L., Thundiyil, K., Chidambram, S., Abbi, Y. P., & Andersen, S. (2007). Fuel Savings and Emission Reductions<br />
from Next-Generation Mobile Air Conditioning Technology in India. Vehicle Thermal Management<br />
Systems Conference & Exhibition. Nottingham.<br />
Chaturvedi, V., Kim, S., Smith, S., Clarke, L., Yuyu, Z., & Kyle, P. (2013). Model evaluation and hindcasting: An<br />
experiment with an integrated assessment model. <strong>Energy</strong> , 61, 479-490.<br />
Chaturvedi, V., & Shukla, P. (2014). Role of energy efficiency in climate change mitigation policy for India:<br />
Assessment of co-benefits and opportunities within an integrated assessment modeling framework. Climatic<br />
Change, 123 (3-4), 597-609.<br />
Chaturvedi, V., Eom, J., Clarke, L., & Shukla, P. R. (2014). Long term building energy demand for India: Disaggregating<br />
end use energy services in an integrated assessment modeling framework. <strong>Energy</strong> Policy, 64, 226-242.<br />
Chaturvedi, V., Hejazi, M., Edmonds, J., Clarke, L., Kyle, P., & Davies, E. (2015). Climate mitigation policy implications<br />
for global irrigation water demand. Mitigation and Adaptation Strategies for Global Change, 20 (3),<br />
389-407.<br />
Chaturvedi, V., & Sharma, M. (Forthcoming). Modeling long term HFC emissions from India’s residential airconditioning<br />
sector. Climate Policy.
India’s Long Term Hydrofl uorocarbon <strong>Emissions</strong><br />
45<br />
Clarke, J. F., & Edmonds, J. (1993). Modelling energy technologies in a competitive market. <strong>Energy</strong> Economics,<br />
15.<br />
Clarke, L., Lurz, J., Wise, M., Edmonds, J., & Kim, S. (2007). Model Documentation for the MiniCAM Climate<br />
Change Science Program Stabilization Scenarios. Technical Report PNNL-16735, Pacific Northwest National<br />
Laboratory, Department of <strong>Energy</strong>, Richland, WA.<br />
Clarke, L., Lurz, J., Wise, M., Edmonds, J., Kim, S., Placet, M. (2008). CO 2<br />
Emission Mitigation and Technological<br />
Advance: An Updated Analysis of Advance Technology Scenarios. Technical Report-18075, Pacific Northwest<br />
National Laboratory, Richland, WA.<br />
de la Rue du Can, S., McNeil, M., & Sathaye, J. (2009). India <strong>Energy</strong> Outlook: End Use Demand in India to<br />
2020. Ernest Orlando Lawrence Berkeley National Laboratory, Berkeley, USA.<br />
Edmond, J., & Reilly, J. (1983). A long-term global energy-economic model of carbon dioxide release from fossil<br />
fuel use. <strong>Energy</strong> Economics, 5.<br />
Eom, J., Clarke, L., Kim, S., Kyle, P., & Patel, P. (2012). China’s building energy demand: A long-term perspective<br />
based on a detailed assessment. <strong>Energy</strong>, 46 (1), 405-419.<br />
Godrej & Boyce. (Undated). Service Technician Guide for Godrej Direct Cool Refrigerator EDGE Range - GDE<br />
19, 23 & 26. Godrej & Boyce Mfg. Co. Ltd, Appliance Division. Available at www.baanservice.godrej.com [Accessed<br />
on 12th December 2014].<br />
Gschrey, B., Schwarz, W., Elsner, C., & Engelhardt, R. (2011). High increase of global F-gas emissions until<br />
2050. Greenhouse Gas Measurement and Management , 1 (2), 85–92.<br />
GoI. (2006). Integrate <strong>Energy</strong> Policy: Report of the Expert Committee. Planning Commission, Government of<br />
India.<br />
Hejazi, M., Edmonds, J., Chaturvedi, V., Davies, E., & Eom, J. (2013). Scenarios of global municipal water use<br />
demand projections over the 21st century. Hydrological Sciences Journal , 3, 1-20.<br />
Höglund-Isaksson, L., Winiwarter, W., & Purohit, P. (2013). Non-CO 2<br />
greenhouse gas emissions, mitigation potentials<br />
and costs in the EU-28 from 2005 to 2050. International Institute for Applied Systems Analysis (IIASA),<br />
Laxenburg, Austria.<br />
Höglund-Isaksson, L., Winiwarter, W., Purohit, P., Rafaj, P., Schöpp, W., & Klimont, Z. (2012). EU Low Carbon<br />
Roadmap 2050: Potentials and costs for mitigation of non-CO 2<br />
greenhouse gases. <strong>Energy</strong> Strategy, 97-108.<br />
ICF. (2012). Techno-Economic Analyses of the Incremental Cost of Super Efficiency for Refrigerators in India.<br />
ICF International, August 2012.<br />
Indian Railways. (2014). Statistical Summary - Indian Railways. Available at http://www.indianrailways.gov.<br />
in/railwayboard/uploads/directorate/stat_econ/pdf/Summary%20Sheet_Eng.pdf [Accessed on 14th November2014].<br />
IPCC. (2006). <strong>Emissions</strong> of Fluorinated Substitutes for Ozone Depleting Substances. In IPCC, 2006 IPCC<br />
Guidelines for National Greenhouse Gas Inventories.
46<br />
IPCC. (2007). Changes in Atmospheric Constituents and in Radiative Forcing. In IPCC Fourth Assessment Report:<br />
Climate Change 2007. New York: Cambridge University Press<br />
IPCC/TEAP. (2006). Special Report on Safeguarding the Ozone Layer and the Global Climate System: Issues<br />
Related to <strong>Hydrofluorocarbon</strong>s and Perfluorocarbons. New York: Cambridge University Press.<br />
Knight Frank. (2010). India organised retail market: Diagnosis and Outlook. Knight Frank, India.<br />
Klimont, Z., Cofala, J., Xing, J., Wei, W., Zhang, C., & Kejun, J. (2009). Projections of SO2, NOx, and carbonaceous<br />
aerosols emissions in Asia. Chemical and Physical Meteorology , 61B (4), 602-617.<br />
Krey, V., O’Neill, B., van Ruijven, B., Chaturvedi, V., & Ren, X. (2012). Urban and rural energy use and carbondioxide<br />
emissions in Asia. <strong>Energy</strong> Economics 34, S , S272-S283.<br />
Kumar, S., Kapoor, R., Deshmukh, A., Kamath, M., & Manu, S. (2010). <strong>Energy</strong> Conservation and Commercialization<br />
(ECO-III): Total Commercial Floor Space Estimates for India. United States Agency for International<br />
Development, USA and Bureau of <strong>Energy</strong> Efficiency, India.<br />
Kyle, P., & Kim, S. (2011). Long Term Implications Of Alternative Light-duty Vehicle Technologies For Global<br />
Greenhouse Gas <strong>Emissions</strong> And Primary <strong>Energy</strong> Demands. <strong>Energy</strong> Policy , 39, 3012-3024.<br />
Miller, B. R., & Kuijpers, L. M. (2011). Projecting future HFC-23 emissions. Atmospheric Chemistry and Physics,<br />
11, 13259-13267.<br />
Mishra, G., Kyle, P., Teter, J., Morrison, G., Kim, S., & Yeh, S. (2013). Transportation Module of Global Change<br />
Assessment Model (GCAM): Model Documentation. Davis, California, USA: Institute of Transportation Studies,<br />
University of California, Davis.<br />
Mohan, D., Goel, R., Guttikunda, S., & Tiwari, G. (2014). Assessment of Motor Vehicle Use Characteristics in<br />
Three Indian Cities. UNEP Riso Centre on <strong>Energy</strong>, Climate and <strong>Sustainable</strong> Development, Techical University of<br />
Denmark.<br />
MoRTH. (2009). Road Transport Year Book 2006-07. Ministry of Road Transport and Highways, Government<br />
of India.<br />
MoRTH. (2013). Road Transport Year Book 2011-12. Ministry of Road Transport and Highways, Government<br />
of India.<br />
NCCD. (2013). Conclave on Refrigerated Transportation. National Centre for Cold Chain Development, Government<br />
of India. Available at http://www.nccd.gov.in/ [Accessed on 6th February 2015].<br />
NRDC, CEEW, TERI and IGSD. (2013). Cooling India with Less Warming: The business case for phasing down<br />
HFCs in room and vehicle air conditioners. Issue Paper, June 2013.<br />
NTDPC. (2013). India Transport Report. National Transport Development Policy Committee, Government of<br />
India, Vol. 2, Part 1.<br />
Ozone Cell. (2009). Roadmap for Phase-Out of HCFCs in India. Ozone Cell, Ministry of Environment and Forest,<br />
Government of India.
India’s Long Term Hydrofl uorocarbon <strong>Emissions</strong><br />
47<br />
Ozone Cell. (2010). The Montreal Protocol: India’s Success Story. Ozone Cell, Ministry of Environment and Forest,<br />
Government of India.<br />
Ozone Cell. (2013). HCFC Phase-out Management Plan (HPMP) Stage I. Ministry of Environment and Forest,<br />
Government of India.<br />
PCRA. (2013). Market Survey Leading to Fuel Survvey Norms for Diesel (Engine Driven) Trucks and Buses in<br />
India. Petroleum Conservation Research Association, India. Research report prepared by ICRA Management<br />
Consulting Services Limited.<br />
Phadke, A., Abhyankar, N., & Shah, N. (2013). Avoiding 100 New Power Plants by Increasing Efficiency of<br />
Room Air Conditioners in India: Opportunities and Challenges. Berkeley: Lawrence Berkeley National Laboratory.<br />
Prayas. (2011). Potential Savings from Selected Super-Efficient Electric Appliances in India- A Discussion Paper.<br />
Prayas <strong>Energy</strong> Group, Pune.<br />
Purohit, P., Amann, M., Mathur, R., Bhandari, P., Bertok, I., Borken, J. (2010). GAINS-Asia: Scenarios for<br />
cost-effective control of air pollution and greenhouse gases in India. International Institute for Applied Systems<br />
Analysis (IIASA), Laxenburg, Austria.<br />
Purohit, P., & Höglund-Isaksson, L. (2012). Global emissions of fluorinated greenhouse gases until 2050: technical<br />
mitigation potentials and costs. IIASA 40th Anniversary Conference. International Institute for Applied<br />
Systems Analysis (IIASA), Laxenburg, Austria.<br />
PwC. (2012). Analysis of impact of super efficiency on AC manufacturers /suppliers in India. Price Waterhouse<br />
Coopers, November 2012, Hyderabad, India.<br />
Rafaj, P., Schoepp, W., Russ, P., Heyes, C., & Amann, M. (2013). Co-benifits of post-2012 global climate mitigation<br />
policies. Mitigation and Adaptation Strategies for Global Change , 18 (6), 801-824.<br />
Rajadhyaksha, D. (2014). Implementation of Godrej HC 290 Project- Technical Challenges Experienced and<br />
Resolved. Presentation at UNEP Industry Roundtable at ACREX India, New Delhi, Feb 28, 2014.<br />
RTOC/UNEP. (2006). Report of the Refrigeration, Air Conditioning And Heat Pumps Technical Options Committee.<br />
Ozone Secretariat, United Nations Environment Programme, Nairobi.<br />
RTOC/UNEP. (2010). Report of the Refrigeration, Air Conditioning And Heat Pumps Technical Options Committee.<br />
Ozone Secretariat, United Nations Environment Programme, Nairobi.<br />
RTOC/UNEP. (2012). Report of the Refrigeration, Air Conditioning And Heat Pumps Technical Options Committee.<br />
Ozone Secretariat, United Nations Environment Programme, Nairobi.<br />
Sanderson, W., Schoepp, W., & Amann, M. (2013). Effects on well-being of investing in cleaner air in India. Environmental<br />
Science & Technology , 47 (23), 13222-13229.<br />
Shah, N., Waide, P., & Phadke, A. (2011). Cooling the Planet: Opportunities for Deployment of Superefficient<br />
Room Air Conditioners. Lawrence Berkeley National Laboratory, Berkeley, USA.<br />
Shukla, P. R., & Chaturvedi, V. (2012). Low carbon and clean energy scenarios for India: Analysis of targets approach.<br />
<strong>Energy</strong> Economics , 34, S487-S495.
48<br />
Shukla, P. R., & Chaturvedi, V. (2013). <strong>Sustainable</strong> energy transformations in India under climate policy. <strong>Sustainable</strong><br />
Development , 21, 48-59.<br />
SIAM. (Undated). Automobile Domestic Sales Trends. Society of Indian Automobile Manufacturers., Available at<br />
http://118.67.250.203//scripts/domestic-sales-trend.aspx [Accessed on December 20, 2014].<br />
Su, S., Fang, X., Li, L., Wu, J., Zhang, J., & Xu, W. (2015). HFC-134a emissions from mobile air conditioning in<br />
China from 1995 to 2030. Atmospheric Environment (102) , 122-129.<br />
TEAP/UNEP. (2014). Decision XXV/5 Task Force Report - Additional Information To Alternatives On ODS<br />
(Final Report). Report of the UNEP Technology and Economic Assessment Panel, Ozone Secretariat, United Nations<br />
Environment Programme, Nairobi, October 2014.<br />
TERI. (2006). National <strong>Energy</strong> Map for India: Technology Vision 2030. The <strong>Energy</strong> and Resources Institute,<br />
India.<br />
UNEP. (2010). Guidance on the Process for Selecting Alternatives to HCFCs in Foams. United Nations Environment<br />
Programme, July 2010.<br />
UNEP. (2011). HFCs: A Critical Link in Protecting Climate and The Ozone Layer. United Nations Environment<br />
Programme, November 2011.<br />
UNEP. (2012). Project Proposal: India. United Nations Environment Programme, March 2012.<br />
Available at www.multilateralfund.org/66/English/1/6638.pdf . [Accessed on December 20, 2014].<br />
USAID & BEE. (2014). PACE-D Technical Assistance Program: HVAC Market Assessment and Transformation<br />
Approach for India. United States Agency for International Development, USA and Bureau of <strong>Energy</strong> Efficiency,<br />
India.<br />
Velders, G J.M; Fahey, D W; Daniel, J S; McFarland, M; & Andersen, S O. (2009). The large contribution of projected<br />
HFC emissions to future climate forcing. Proceedings of the National Academy of Sciences of the United<br />
States of America, 106 (27), pp. 10949-10954.<br />
Virmani. (2014). HFC-32 Prospective, Daikin Air-conditioning India Pvt. Ltd. Presentation at UNEP Industry<br />
Roundtable at ACREX India, New Delhi, Feb 28, 2014.<br />
Wagner, F., Amann, M., Borken-Kleefeld, J., Cofala, J., Höglund-Isaksson, L., & Purohit, P. (2012). Sectoral<br />
marginal abatement cost curves: implications for mitigation pledges and air pollution co-benefits for Annex-I.<br />
Sustainability Science , 7 (2), 169-184.<br />
Waide, P., van der Sluis, S., & Michineau, T. (2014). CLASP Commercial Refrigeration Equipment: Mapping and<br />
Benchmarking. Report prepared for CLASP by Waide Strategic Efficiency Ltd., Saint Trofee, and Cemafroid.<br />
Zhou, S., Kyle, G. P., Yu, S., Clarke, L. E., Eom, J., & Luckow, P. (2013). <strong>Energy</strong> use and CO 2<br />
emissions of<br />
China’s industrial sector from a global perspective. <strong>Energy</strong> Policy , 58, 284-294.
India’s Long Term Hydrofl uorocarbon <strong>Emissions</strong><br />
49<br />
CEEW Publications<br />
<br />
<br />
<br />
<br />
<br />
<br />
<br />
<br />
<br />
<br />
<br />
<br />
<br />
<br />
Poulami Choudhury (2015) 'Unlocking Access to Finance for Decentralised <strong>Energy</strong><br />
Solutions', April<br />
Council on <strong>Energy</strong>, Environment and Water (2015) 'Negotiating the Climate Cliff: India's<br />
Climate Policy and Intended Nationally Determined Contributions', Conference Report,<br />
February<br />
Council on <strong>Energy</strong>, Environment and Water (2015) 'Negotiating the Climate Cliff: India's<br />
Climate Policy and Intended Nationally Determined Contributions', Conference Report,<br />
February<br />
Abhishek Jain, Poulami Choudhury, and Karthik Ganesan (2015) 'Clean, Affordable and<br />
<strong>Sustainable</strong> Cooking <strong>Energy</strong> for India: Possibilities and Realities beyond LPG', February<br />
Arunabha Ghosh, Shalu Agrawal, Poulami Choudhury, Kanika Chawla, Anjali Jaiswal,<br />
Meredith Connolly, Bhaskar Deol, and Nehmat Kaur (2015) 'Clean <strong>Energy</strong> Powers Local<br />
Job Growth in India', CEEW-NRDC Interim Report, February<br />
P.R. Shukla, Amit Garg, and Hem H. Dholakia (2015) ' <strong>Energy</strong>-<strong>Emissions</strong>: Trends and<br />
Policy Landscape in India'. New Delhi: Allied Publishers<br />
Abhishek Jain, Shalu Agrawal, and Karthik Ganesan (2014) 'Improving Effectiveness of<br />
Domestic LPG Subsidy and Distribution in India: Rationalising Subsidies, Reaching the<br />
Underserved', November<br />
Vaibhav Chaturvedi, Vaibhav Gupta, Nirmalya Choudhury, Sonali Mittra, Arunabha Ghosh,<br />
and Rudresh Sugam (2014) 'State of Environmental Clearances in India: Procedures,<br />
Timelines and Delays across Sectors and States’, October<br />
Council on <strong>Energy</strong>, Environment and Water; and InSIS (2014) Climate Geoengineering<br />
Governance, Conference Report, June<br />
Arunabha Ghosh, Rajeev Palakshappa, Rishabh Jain, Shalu Aggarwal, and Poulami<br />
Choudhury (2014) 'Solar Power Jobs: Exploring the Employment Potential in India's Grid-<br />
Connected Solar Market', CEEW-NRDC Report, August<br />
Arunabha Ghosh, Rajeev Palakshappa, Poulami Choudhury, Rishabh Jain, and Shalu<br />
Aggarwal (2014) 'Reenergizing India's Solar <strong>Energy</strong> Market through Financing', CEEW-<br />
NRDC Report, August<br />
Sonali Mittra, Rudresh Sugam, Arunabha Ghosh (2014) Collective Action for Water<br />
Security and Sustainability: Preliminary Investigations, CEEW-2030 WRG Report, August<br />
Poulami Choudhury, Rajeev Palakshappa, and Arunabha Ghosh (2014) RE+: Renewables<br />
Beyond Electricity- Solar Air Conditioning and Desalination, CEEW-WWF Report, August<br />
Karthik Ganesan, Poulami Choudhury, Rajeev Palakshappa, Rishabh Jain, and Sanyukta<br />
Raje (2014) Assessing Green Industrial Policy: The India Experience, CEEW-IISD Report,<br />
April
50<br />
Vaibhav Gupta, Karthik Ganesan, Sanyukta Raje, Faraz Ahmed, and Arunabha Ghosh<br />
(2013) Strategic Industries and Emerging Technologies for a Future Ready India, Report<br />
submitted to India’s National Security Advisory Board, Prime Minister’s Office, December<br />
Rishabh Jain, Poulami Choudhury, Rajeev Palakshappa, and Arunabha Ghosh (2013) RE+:<br />
Renewables Beyond Electricity, CEEW-WWF Report, December<br />
Rudresh Sugam and Arunabha Ghosh (2013) Urban Water and Sanitation in India: Multistakeholder<br />
Dialogues for Systemic Solutions, CEEW-Veolia Report, November, pp. i-147<br />
Rajeev Palakshappa, Arunabha Ghosh, Poulami Choudhury, and Rishabh Jain (2013)<br />
Developing Effective Networks for <strong>Energy</strong> Access- An Analysis, CEEW-USAID Report,<br />
October<br />
Nirmalya Choudhury, Rudresh Sugam and Arunabha Ghosh (2013) 2030 Water Resources<br />
Group National Water Platform: Preliminary Investigation of the Possible Roles, Functions<br />
and Potential Governance, New Delhi Council on <strong>Energy</strong> Environment and Water-Water<br />
Resources Group Report, September, pp. i-25<br />
Arunabha Ghosh et al. (2012) Concentrated Solar Power: Heating Up India's Solar Thermal<br />
Market under the National Solar Mission, Report (Addendum to Laying the <strong>Foundation</strong> for<br />
a Bright Future: Assessing Progress under Phase I of India's National Solar Mission),<br />
September, New Delhi, Council on <strong>Energy</strong>, Environment and Water; and Natural Resources<br />
Defense Council<br />
Arunabha Ghosh, with Himani Gangania (2012) Governing Clean <strong>Energy</strong> Subsidies: What,<br />
Why and How Legal?, August, Geneva: International Centre for Trade and <strong>Sustainable</strong><br />
Development<br />
Rudresh K. Sugam, and Arunabha Ghosh (2012) Institutional Reform for Improved Service<br />
Delivery in Bihar: Economic Growth, Agricultural Productivity, and a Plan for<br />
Reorganising the Minor Water Resources Department, Research Report submitted to the<br />
Government of Bihar, July, New Delhi: Council on <strong>Energy</strong>, Environment and Water, and<br />
International Growth Centre, Patna<br />
Council on <strong>Energy</strong>, Environment and Water; and Natural Resources Defense Council (2012)<br />
Laying the <strong>Foundation</strong> for a Bright Future: Assessing Progress Under Phase 1 of India's<br />
National Solar Mission, Interim Report, April, pp. i-37<br />
Arunabha Ghosh, Arundhati Ghose, Suman Bery, C. Uday Bhaskar, Tarun Das, Nitin Desai,<br />
Anwarul Hoda, Kiran Karnik, Srinivasapuram Krishnaswamy, Radha Kumar, Shyam Saran<br />
(2011) Understanding Complexity, Anticipating Change: From Interests to Strategy on<br />
Global Governance, Report of the Working Group on India and Global Governance,<br />
December, pp. i-70<br />
Martin A. Burton, Rahul Sen, Simon Gordon-Walker, and Arunabha Ghosh (2011) National<br />
Water Resources Framework Study: Roadmaps for Reforms, October, New Delhi: Council<br />
on <strong>Energy</strong>, Environment and Water, and 2030 Water Resources Group, pp i-68
India’s Long Term Hydrofl uorocarbon <strong>Emissions</strong><br />
51<br />
<br />
<br />
Martin A. Burton, Rahul Sen, Simon Gordon-Walker, Anand Jalakam, and Arunabha Ghosh<br />
(2011) National Water Resources Framework Study: Research Report Submitted to the<br />
Planning Commission for the 12th Five Year Plan, September, New Delhi: Council on<br />
<strong>Energy</strong>, Environment and Water, and 2030 Water Resources Group, pp. i-584<br />
Arunabha Ghosh (2010) Harnessing the Power Shift: Governance Options for International<br />
Climate Financing, Oxfam Research Report, October, pp. 1-90<br />
Papers/Book Chapters<br />
Vaibhav Chaturvedi (2015) 'The Costs of Climate Change Impacts for India', CEEW<br />
Working Paper 2015/11, March<br />
Herath Gunatilake, Karthik Ganesan, and Eleanor Bacani (2014) 'Valuation of Health<br />
Impacts of Air Pollution from Power Plants in Asia: A Practical Guide', ADB South Asia<br />
Working Paper Series, October<br />
David Steven and Arunabha Ghosh (2014) 'Materials, Markets, Multilateralism: A Strategic<br />
Approach to India's Resource Challenges' in The New Politics of Strategic Resources:<br />
<strong>Energy</strong> and Food Security Challenges in the 21st Century, edited by David Steven, Emily<br />
O'Brien, Bruce James. Washington: Brookings Institution Press<br />
Vaibhav Chaturvedi and Mohit Sharma (2014) 'Modelling Long Term HFC <strong>Emissions</strong> from<br />
India's Residential Air-Conditioning Sector', CEEW Working Paper 2014/7, July<br />
Karthik Ganesan and Rajeev Vishnu (2014) ‘<strong>Energy</strong> Access in India-Today, and<br />
Tomorrow’, CEEW Working Paper 2014/10, June<br />
Vaibhav Chaturvedi and Son H Kim (2014) 'Long Term <strong>Energy</strong> and Emission Implications<br />
of Global Shift to Electricity-Based Public Rail Transit System', CEEW Working Paper<br />
2014/9, May<br />
Vaibhav Chaturvedi, Priyadarshi R Shukla, and Karthik Ganesan (2014) 'Implications of<br />
Risk Perceptions for Long Term Future of Nuclear <strong>Energy</strong> in India: A Sensitivity Analysis<br />
around Nuclear <strong>Energy</strong> Cost within an Integrated Assessment Modelling Framework',<br />
CEEW Working Paper 2014/6, April<br />
Arunabha Ghosh (2014) ‘Environmental Institutions, International Research Programmes,<br />
and Lessons for Geoengineering Research', Geoengineering Our Climate Working Paper,<br />
February<br />
Nirmalya Choudhury and Arunabha Ghosh (2013) 'Responsible Hydropower Development<br />
in India: Challenges for future', CEEW Working Paper 2013/5, December<br />
Rishabh Jain, Karthik Ganesan, Rajeev Palakshappa and Arunabha Ghosh (2013) ‘<strong>Energy</strong><br />
Storage for Off-Grid Renewables in India: Understanding Options and Challenges for<br />
Entrepreneurs’, CEEW Report, July<br />
Arunabha Ghosh, and David Steven (2013) ‘India’s <strong>Energy</strong>, Food, and Water Security:<br />
International Cooperation for Domestic Capacity’, in Shaping the Emerging World: India<br />
and the Multilateral Order, edited by Waheguru Pal Singh Sidhu, Pratap Bhanu Mehta, and
52<br />
<br />
<br />
<br />
<br />
<br />
<br />
<br />
<br />
<br />
Bruce Jones, Washington, D.C.: Brookings Press<br />
Rajeev Palakshappa et al. (2013) ‘Cooling India with Less Warming: The Business Case for<br />
Phasing-Down HFC’s in Room and Vehicle Air Conditioners,’ Council on <strong>Energy</strong>,<br />
Environment and Water; Natural Resources Defense Council; The <strong>Energy</strong> and Resources<br />
Institute; and The Institute for Governance and <strong>Sustainable</strong> Development, June<br />
Arunabha Ghosh (2013) ‘<strong>Energy</strong>-Food-Water-Climate Nexus: Implications for India’s<br />
National Security,’ Paper submitted to India’s National Security Advisory Board, Prime<br />
Minister’s Office, March<br />
Vyoma Jha and Rishabh Jain (2012) ‘Results-Based Financing for Off-grid <strong>Energy</strong> Access<br />
in India,’ Case-study on the Economics of Results-Based Financing in Study by<br />
Vivideconomics for <strong>Energy</strong> Sector Management Assistance Program (ESMAP), World<br />
Bank, Washington DC, November<br />
Arunabha Ghosh (2012) 'Industrial demand and energy supply management: A delicate<br />
balance,’ Empowering growth - Perspectives on India's energy future, A report from the<br />
Economist Intelligence Unit: 26-32, October<br />
Arunabha Ghosh, Benito Müller, William Pizer, and Gernot Wagner (2012) ‘Mobilizing the<br />
Private Sector: Quantity-Performance Instruments for Public Climate Funds,’ Oxford<br />
<strong>Energy</strong> and Environment Brief, The Oxford Institute for <strong>Energy</strong> Studies, August, pp. 1-15<br />
Sachin Shah (2012) ‘Institutional Reform for Water Use Efficiency in Agriculture:<br />
International Best Practices and Policy Lessons for India,’ CEEW Working Paper 2012/3,<br />
April<br />
Arunabha Ghosh (2011) ‘Seeking Coherence In Complexity: The Governance Of <strong>Energy</strong><br />
By Trade And Investment Institutions,’ Global Policy 2 (Special Issue): 106-119<br />
Arunabha Ghosh (2011) ‘Strengthening WTO Surveillance: Making Transparency Work for<br />
Developing Countries,’ in Making Global Trade Governance Work for Development, edited<br />
by Carolyn Deere-Birkbeck. Cambridge: Cambridge University Press<br />
Jason Blackstock, and Arunabha Ghosh (2011) ‘Does geoengineering need a global<br />
response - and of what kind?,’ Background Paper, Solar Radiation Management Governance<br />
Initiative, Royal Society UK, Chicheley, March<br />
Policy Briefs & Legislative/Government Briefings<br />
<br />
<br />
Hem H Dholakia and Abhishek Jain (2015) 'Lead Acid Battery Recycling in India:<br />
Challenges and Next Steps' CEEW Issue Brief, April<br />
Natural Resources Defense Council (NRDC); Council on <strong>Energy</strong>, Environment and Water<br />
(CEEW); Institute for Governance and <strong>Sustainable</strong> Development (IGSD); and Stephen<br />
Seidel (2015) 'India Proposes HFC Phase-Down Amendment Proposal to the Montreal<br />
Protocol', Fact Sheet, April
India’s Long Term Hydrofl uorocarbon <strong>Emissions</strong><br />
53<br />
Shannon Dilley, Arunabha Ghosh, Anjali Jaiswal, Vaibhav Chaturvedi, and Bhaskar Deol<br />
(2015) ' Reducing Stress on India's <strong>Energy</strong> Grid: The Power Sector Benefits of<br />
Transitioning to Lower Global Warming Potential and <strong>Energy</strong> Efficient Refrigerants in<br />
Room Air Conditioners 'CEEW NRDC Interim Issue Brief, March<br />
Sudatta Ray, Vaibhav Chaturvedi, Karthik Ganesan, and Arunabha Ghosh (2015) ‘India’s<br />
Intended Nationally Determined Contributions: Renewable <strong>Energy</strong> and the Pathway to<br />
Paris’, CEEW Policy Brief, February<br />
Karthik Ganesan, Abhishek Jain, Sudatta Ray, Mohit Sharma, and Arunabha Ghosh (2014)<br />
'Agenda for a Reformed Power Sector in India: Risk, Resource, Relay, and Restructuring'<br />
CEEW Policy Brief, December<br />
Poulami Choudhury, Shalu Agrawal, Kanika Chawla, Rajeev Palakshappa, Karthik<br />
Ganesan, and Arunabha Ghosh (2014) 'Tapping Every Ray of the Sun: A Roadmap for a<br />
Significant Role of Solar in India' CEEW Policy Brief, October<br />
Rudresh Kumar Sugam, Sonali Mittra, and Arunabha Ghosh (2014) 'Swachh Bharat: Kachra<br />
Mukt, Shouchalaya Yukt Bharat' CEEW Policy Brief, October<br />
Arunabha Ghosh (2014) ‘Making the UN Secretary General’s Climate Summit Count’,<br />
Issue Brief, September<br />
Council on <strong>Energy</strong>, Environment and Water (2014) 'Shaping a Prosperous and <strong>Sustainable</strong><br />
India: Action Plan for <strong>Energy</strong>, Environment and Water', Policy Report, September<br />
Council on <strong>Energy</strong>, Environment and Water and Natural Resources Defense Council (2014)<br />
'Creating Green Jobs: Employment Created by Kiran <strong>Energy</strong>'s 20 Megawatt Solar Plant in<br />
Rajasthan, India' Issue Paper, August<br />
Arunabha Ghosh, Rajeev Palakshappa, Rishabh Jain, Shalu Agarwal (2014) 'Making Use of<br />
the Roof: Employment Generation from Hero MotoCorp's 80 kW Rooftop Solar Project in<br />
Haryana India' CEEW-NRDC Issue Paper, August<br />
Rajeev Palakshappa, Poulami Choudhury, and Arunabha Ghosh (2014) 'Creating Green<br />
Jobs: Employment Generation by Gamesa-Renew Power's 85 Megawatt Wind Project in<br />
Jath, Maharashtra' CEEW-NRDC Issue Paper, August<br />
Arunabha Ghosh, Rajeev Palakshappa, Poulami Choudhury, and Rishabh Jain (2014) 'A<br />
Second Wind for India's <strong>Energy</strong> Market: Financing Mechanisms to Support India's National<br />
Wind <strong>Energy</strong> Mission' CEEW-NRDC Issue Paper, August<br />
Arunabha Ghosh (2014) "High Value, Technology-Enabled Manufacturing" Briefing note<br />
for the India-U.S. Strategic Dialogue. New Delhi. 18 July<br />
Arunabha Ghosh (2014) "India-U.S. Partnership on <strong>Energy</strong> Storage (R&D, Enterprise and<br />
Deployment)" Briefing note for the India-U.S.Strategic Dialogue. New Delhi. 16 July<br />
Arunabha Ghosh (2014) "Clean <strong>Energy</strong> Access Network (CLEAN) and Supporting<br />
Decentralised Clean <strong>Energy</strong>" Briefing note for the India-U.S. Strategic Dialogue. New<br />
Delhi. 13 July
54<br />
<br />
<br />
<br />
<br />
<br />
<br />
<br />
<br />
<br />
<br />
<br />
<br />
Vaibhav Gupta and Karthik Ganesan (2014) ‘India’s Critical Mineral Resources: A Trade<br />
and Economic Analysis’, CEEW Policy Brief, July<br />
Arunabha Ghosh and Susan G. Esserman (2014) ‘India-U.S. Cooperation on Renewable<br />
<strong>Energy</strong> and Trade,’ Briefing paper for the India-U.S. Track II Dialogue on Climate Change<br />
and <strong>Energy</strong>. Washington D.C. 12 February<br />
Arunabha Ghosh and Karthik Ganesan (2014) ‘National Wind Mission,’ Briefing to MNRE<br />
Secretary, New Delhi, 4 February<br />
Arunabha Ghosh (2013) ‘Strategic Industries and Emerging Technologies for a Future<br />
Ready India,’ Briefing to India’s National Security Adviser, Prime Minister’s Office, New<br />
Delhi, 18 October; to National Security Advisory Board, Mumbai, 3 December; and to<br />
India’s Planning Commission, New Delhi, 10 December<br />
Arunabha Ghosh (2013) ‘Business Case for HFC Phase Down in India,’ Briefing to Prime<br />
Minister’s Office, New Delhi, 22 November<br />
Arunabha Ghosh, Rudresh Sugam, Nirmalya Choudhury (2013) ‘Integrated <strong>Energy</strong>,<br />
Environment and Water Plan for Jharkhand: Preliminary Investigations and Propositions,’<br />
Briefing to the Government of Jharkhand, Ranchi, 18 September<br />
Nirmalya Choudhury (2013) ‘Knowledge Hub under National Water Mission – Governance<br />
Issues’, Briefing to the Ministry of Water Resources, Government of India, on the<br />
proceedings of the Working Group on Governance of the Knowledge Hub under the<br />
National Water Mission (a flagship mission of the Government of India under the National<br />
Action Plan on Climate Change), New Delhi, 26 August<br />
Nirmalya Choudhury (2013) ‘Governance Issues towards Creating a Knowledge Hub under<br />
the National Water Mission,’ Briefing for a multi-stakeholder roundtable discussion on<br />
creating a Knowledge Hub under the National Water Mission (a flagship mission of the<br />
Government of India under the National Action Plan on Climate Change), New Delhi, 14<br />
August<br />
Arunabha Ghosh (2013) ‘National Water Platform: Some Thoughts for Brainstorming<br />
Meeting,’ Briefing to the Ministry of Water Resources, Government of India, on creating a<br />
Knowledge Hub under the National Water Mission (a flagship mission of the Government<br />
of India under the National Action Plan on Climate Change), New Delhi, 5 August<br />
Rudresh Sugam and Urvashi Sharma (2013) “Capacity building in the urban water sector,”<br />
Issue brief for the Fifth CEEW-Veolia Water Roundtable on Urban Water Management, 5<br />
July<br />
Arunabha Ghosh, Stephen O. Andersen, Bhaskar Deol, and David Doniger (2013) ‘The<br />
Business Case for Avoiding & Replacing High-Global Warming Potential HFC Refrigerants<br />
While Phasing Out HCFC Refrigerants,’ Briefing at the Montreal Protocol Open-Ended<br />
Working Group. Bangkok, 26 June<br />
Rudresh Sugam and Urvashi Sharma (2013) “Water data and measurement,” Issue brief for<br />
the Fourth CEEW-Veolia Water Roundtable on Urban Water Management, 27 May
India’s Long Term Hydrofl uorocarbon <strong>Emissions</strong><br />
55<br />
<br />
<br />
<br />
<br />
<br />
<br />
<br />
<br />
<br />
<br />
<br />
Rudresh Sugam and Urvashi Sharma (2013) “Regulatory framework for urban water<br />
management in India,” Issue brief for the Third CEEW-Veolia Water Roundtable on Urban<br />
Water Management, 9 April<br />
Rudresh Sugam and Urvashi Sharma (2013) “Private sector participation in water<br />
management and water for all,” Issue brief for the Second CEEW-Veolia Water Round table<br />
on Urban Water Management, 11 February<br />
Arunabha Ghosh (2013) ‘Renewable Energies and Trade: Addressing tensions and<br />
challenges,’ Briefing to a high-level policy dialogue at the World Trade Organization<br />
meeting of Ambassadors, Geneva, 21 January<br />
Rudresh Sugam (2012) “Water Utility Management in the Urban Water Sector,” Issue brief<br />
for the First CEEW-Veolia Water Roundtable on Urban Water Management, New Delhi, 20<br />
December<br />
Karthik Ganesan (2012) “Climate Change and Business Leadership: Pathways to GHG<br />
<strong>Emissions</strong> Reduction and Sustainability in the Indian Cement Industry,” Paper presented at<br />
the Third National ICRN Conference on Climate Change, Indian Institute of Science,<br />
Bangalore, 4 November<br />
Vyoma Jha (2012) “Trends in Investor Claims over Feed-in Tariffs for Renewable <strong>Energy</strong>,”<br />
Investment Treaty News, July<br />
Arunabha Ghosh (2012) “Water governance priorities in India, South and East Asia, the<br />
case for integrated energy, environment and water plans, and Rio+20 goals,” Briefing to the<br />
Brazilian Federal Senate, Environment, Consumer Rights and Oversight Committee &<br />
Agriculture and Land Reform Committee, Rio de Janeiro, 20 June<br />
Arunabha Ghosh (2011) “Briefing on global governance to Ambassador Shivshankar<br />
Menon, National Security Adviser, Government of India,” Prime Minister’s Office, 20<br />
December<br />
Arunabha Ghosh (2011) “Governing clean energy subsidies: Why legal and policy clarity is<br />
needed,” Bridges Trade BioRes, November<br />
Vyoma Jha (2011) “Cutting Both Ways?: Climate, Trade and the Consistency of India's<br />
Domestic Policies,” CEEW Policy Brief, August<br />
Arunabha Ghosh (2010) “Negotiating around Tradeoffs: Alternative Institutional Designs<br />
for Climate Finance,” European Climate Platform Report No. 10, Centre for European<br />
Policy Studies, Brussels, 9 December<br />
Op-eds/Conference Papers/Other publications<br />
<br />
Hem Himanshu Dholakia (2015) ‘Cutting the Flab From Delhi’s Polluted Air’<br />
Fairboserver.com, 21 May. Available at<br />
http://www.fairobserver.com/region/central_south_asia/cutting-the-flab-from-delhispolluted-air-90124/
56<br />
Arunabha Ghosh (2015) 'Shifts and risks in energy' Business Standard, 19 May. Available at<br />
http://ceew.in/pdf/ag-shifts-and-risks-in-energy-bs-column-19-may15.pdf<br />
Arunabha Ghosh and Karthik Ganesan (2015) Rethink India's energy strategy, Nature 521,<br />
156–157 (14 May) doi:10.1038/521156a<br />
Arunabha Ghosh (2015) 'Build capacity for energy diplomacy' Business Standard, 21 April.<br />
Available at http://ceew.in/pdf/ag-build-capacity-for-energy-diplomacy-21-apr-15.pdf<br />
Arunabha Ghosh, Shalu Agrawal and Kanika Chawla (2015) 'RE Vision Laid, Delivery<br />
Next' <strong>Energy</strong> Next, March. Available at http://ceew.in/pdf/ceew-article-on-re-budgetanalysis-for-energy-n.pdf<br />
Arunabha Ghosh and Hem Himanshu Dholakia (2015) 'Competitive pollutionism no good'<br />
Business Standard, 17 March. Available at http://www.businessstandard.com/article/opinion/arunabha-ghosh-hem-himanshu-dholakia-competitivepollutionism-no-good-115031601230_1.html<br />
Vaibhav Chaturvedi, Karthik Ganesan, and Hem Dholakia (2015) ‘Cohesive Natural<br />
Resource Management Needed for Sustained’ The Sunday Guardian, 1 March. Available at<br />
http://www.sunday-guardian.com/extra/cohesive-natural-resource-management-needed-forsustained-growth<br />
Arunabha Ghosh (2015) 'Speed, scale, skill…solar?’ Business Standard, 17 February.<br />
Available at http://www.business-standard.com/article/opinion/arunabha-ghosh-speed-scaleskill-solar-115021601820_1.html<br />
Arunabha Ghosh (2015) 'India US Strategic Economic Compass' Business Standard, 20<br />
January. Available at http://ceew.in/pdf/ag-india-us-strategic-economic-compass-bscolumn-21jan15.pdf<br />
Arunabha Ghosh and Abhishek Jain (2014) 'A Rs 12,000-crore year-end gift' Business<br />
Standard, 23 December. Available at http://ceew.in/pdf/ceew-a-rs-12000-crore-year-endgift-bs-column-23dec14.pdf<br />
Arunabha Ghosh (2014) Breaking Through the Climate Chakravyuh' Business Standard, 25<br />
November. Available at http://ceew.in/pdf/ceew-ag-bs-column-breaking-through-theclimate-chakravyuh-25nov14.pdf<br />
Council on <strong>Energy</strong>, Environment and Water; Institute for Governance and <strong>Sustainable</strong><br />
Development; Natural Resources Defense Council; and The <strong>Energy</strong> and Resources Institute<br />
(2014) 'Frequently Asked Questions, Cooling India with Less Warming: The Business Case<br />
for Phasing Down HFCs', Fact Sheet, November<br />
Council on <strong>Energy</strong>, Environment and Water and Natural Resources Defense Council (2014)<br />
'Efficient Air Conditioning for the Next Decade: A Profile of <strong>Energy</strong>-Efficient Room Air<br />
Conditioners That Use HFC-32' Company Profile, November<br />
Council on <strong>Energy</strong>, Environment and Water and Natural Resources Defense Council (2014)<br />
'Air Conditioners with Hydrocarbon Refrigerant - Saving <strong>Energy</strong> while Saving Money: A<br />
Profile of <strong>Energy</strong>-Efficient Propane (HC-290) Based Room Air Conditioners by Godrej &
India’s Long Term Hydrofl uorocarbon <strong>Emissions</strong><br />
57<br />
Boyce' Company Profile, November<br />
Arunabha Ghosh (2014) 'Clearing the Air on Clearances' Business Standard, 28 October.<br />
Available at http://ceew.in/pdf/AG-BS-Column-Clearing-the-Air-on-Clearances-<br />
28Oct14.pdf<br />
Suresh P Prabhu (2014) Rethink on Land Use' The Economic Times, 22 July. Available at<br />
http://ceew.in/pdf/SP-Ground-Beneath-our-Feet-ET-Article-24Jul14.pdf<br />
Suresh P Prabhu (2014) 'Ganga Rakshak Dal Banane Ki Zaroorat' Dainik Jagran, 3 July.<br />
Available at http://ceew.in/pdf/CEEW-SP-Article-in-Dainik-Jagran14Jul14.pdf<br />
Rishabh Jain, Karthik Ganesan, and Vaibhav Gupta (2014) 'India's Coal Conundrum:<br />
Spurring Growth vs. <strong>Energy</strong> Security vs. Environmental Sustainability', CEEW Factsheet,<br />
June<br />
Vaibhav Gupta, Karthik Ganesan, and Rishabh Jain (2014) 'Natural Gas as a Pillar of<br />
Growth: Domestic Production and Import Vulnerabilities', CEEW Fact Sheet, June<br />
Arunabha Ghosh (2014) ‘Three Mantras for India’s Resource Security’ Seminar Magazine,<br />
June. Available at http://ceew.in/pdf/AG-Three-Mantras-for-India-s-Resource-Security-<br />
Seminar-658-Jun14.pdf<br />
Suresh P Prabhu (2014) ‘Handling the <strong>Energy</strong> Crisis’ The Hindu, 18 April. Available at<br />
http://ceew.in/pdf/CEEW-Handling-the-energy-crisis-SP-Article-in-The-Hindu-<br />
18Apr14.pdf<br />
Suresh P. Prabhu (2014) 'Idea 5: Let There Be Light, Always' Open Magazine, 22 March.<br />
Available at http://ceew.in/pdf/Idea%205%20_%20OPEN%20Magazine.pdf<br />
Suresh P. Prabhu (2014) 'India's Green Growth needs Policy Push' <strong>Energy</strong> Next, 8 February.<br />
Available at<br />
http://ceew.in/pdf/Indias_Green_Growth_Needs_Policy_Push_Suresh_Prabhu.pdf<br />
Suresh P. Prabhu (2013) 'Strengthening the regulatory network' The Hindu, 3 December.<br />
Available at http://www.thehindu.com/opinion/op-ed/strengthening-the-regulatorynetwork/article5415035.ece<br />
Suresh P. Prabhu (2013) 'Strengthening the regulatory network' The Gulf Today, 5<br />
December. Available at http://ceew.in/pdf/SPP-Strengthening-the-regulatory-network-The-<br />
Gulf-Today-5Dec13.pdf<br />
Jake Schmidt, Stephen O. Andersen, Arunabha Ghosh, et al (2013) ‘Cooling India with Less<br />
Warming: The Business Case for Phasing Down HFCS,’ Fact Sheet, November.<br />
Arunabha Ghosh (2013) ‘More Lethal Greenhouse Gas’ The Times of India, 25 October.<br />
Available at http://timesofindia.indiatimes.com/home/opinion/edit-page/More-lethalgreenhouse-gas/articleshow/24675848.cms<br />
Arunabha Ghosh (2013) ‘Himalayan Ecosystems and Himalayan Cooperation: A Himalayan<br />
Effort Needed?’ Arctic Circle Forum. Reykjavik. 13 October.<br />
Suresh P Prabhu (2013) ‘Gloom to Bloom to Doom’ The Economic Times, 13 August.<br />
Available at http://ceew.in/pdf/SPP-Gloom-to-bloom-to-doom-The-Economic-Times-
58<br />
3Aug13.pdf<br />
Suresh P Prabhu (2013) ‘Reviving the Power of Electricity’ The Financial Express, 22<br />
April. Available at http://epaper.financialexpress.com/108103/Indian-Express/22-April-<br />
2013#page/6/2<br />
Suresh P Prabhu (2013) ‘Think of Water Before it Rains Again’ The Financial Express, 19<br />
April. Available at bit.ly/XWaALS<br />
Suresh P. Prabhu (2013) 'Sharing the burden of going green' The Hindu, 17 May. Available<br />
at http://ceew.in/pdf/SPP-Sharing_the_burden_of_going_green-The-Hindu-<br />
17May2013.pdf<br />
Jamshyd N Godrej (2013) 'Bring in smart policies, clear the air on clean energy' The<br />
Economic Times, 17 April. Available at<br />
http://economictimes.indiatimes.com/opinion/comments-analysis/bring-in-smart-policiesclear-the-air-on-clean-energy/articleshow/19587149.cms<br />
Arunabha Ghosh and Ricardo Meléndez-Ortiz (2013) ‘Want clean energy? Avoid trade<br />
disputes’Business Standard, 15 April. Available at http://www.business-<br />
standard.com/article/opinion/want-clean-energy-avoid-trade-disputes-<br />
113041500023_1.html.<br />
Arunabha Ghosh (2013) ‘India’s resource nexus: priorities for action’ Mint, 10 April.<br />
Available athttp://www.livemint.com/Opinion/zAOvm6gwBKa6Bzr9DfSyxN/Indiasresource-nexus-priorities-for-action.html.<br />
Arunabha Ghosh (2013) ‘Private Sustainability Finance: Need for cash, role of<br />
institutions’ NYU – UAE MOFA Workshop on Climate Finance and Institutions. Abu<br />
Dhabi. 22 April.<br />
Sanyukta Raje and Vaibhav Gupta (2013) ‘India-US Track II Dialogue on Climate Change<br />
and <strong>Energy</strong>: Enhancing Bilateral Cooperation between India and the US’, Proceedings<br />
Report, 18-20 April.<br />
Arunabha Ghosh and Anjali Jaiswal (2012) 'What's eclipsing India's solar sector' Business<br />
Standard,11 August. Available at http://ceew.in/pdf/AG%20&%20AJ-<br />
Business_Standard_11Oct12.pdf<br />
Arunabha Ghosh (2012) ' Make it profitable to save resources' India Today, 26 March.<br />
Available athttp://ceew.in/pdf/AG-Make_it_profitable_to_save_resources-India_Today-<br />
26Mar12.pdf<br />
Arunabha Ghosh (2012) ' Leave polemics out of the water policy ' The Hindu, 19 March.<br />
Available at http://ceew.in/pdf/AG-Leave_polemics_out_of_the_water_policy-The_Hindu-<br />
19Mar12.pdf<br />
Arunabha Ghosh (2012) ' Innovation needs an ecosystem' Business Standard, 26 February.<br />
Available at http://ceew.in/pdf/AG-Innovation_Needs_an_Ecosystem-<br />
Business_Standard_26Feb12.pdf
India’s Long Term Hydrofl uorocarbon <strong>Emissions</strong><br />
59<br />
Jamshyd N Godrej (2011) 'ET Awards' Agenda for Renewal 2011: <strong>Energy</strong>, the new poverty,<br />
says Jamshyd Godrej, Chairman & MD, Godrej & Boyce' The Economic Times, 24<br />
November. Available at http://articles.economictimes.indiatimes.com/2011-11-<br />
24/news/30437448_1_clean-energy-energy-security-comprehensive-energy-plan<br />
Jamshyd N Godrej (2011) 'Deregulation: Solving diesel conundrum' The Times of India, 28<br />
January. Available at http://timesofindia.indiatimes.com/business/indiabusiness/Deregulation-Solving-diesel-conundrum/articleshow/7375419.cms?referral=PM<br />
Arunabha Ghosh (2009) 'Climate for a win-win dialogue' The Financial Express, 22<br />
December. Available at http://www.financialexpress.com/news/column-climate-for-awinwin-dialogue/557335/0<br />
Arunabha Ghosh (2009) 'Street lessons in climate governance' The Financial Express, 18<br />
December. Available at http://www.financialexpress.com/news/column-street-lessons-inclimate-governance/555484/0<br />
Arunabha Ghosh (2009) 'Red herrings in debates over climate finance' Opinio Juris, 15<br />
December. Available at http://opiniojuris.org/2009/12/15/red-herrings-in-debates-overclimate-finance/<br />
Arunabha Ghosh (2009) 'Even climate is about the money' The Financial Express, 7<br />
December<br />
Arunabha Ghosh (2009) 'Making Copenhagen count' the GEG blog, 7 December.