Hydrofluorocarbon Emissions-Shakti Sustainable Energy Foundation
One such critically important category of gases is hydrofl uorocarbon (HFC). HFCs are potent greenhouse gases and are expected to contribute signifi cantly to global warming by 2050 (IPCC/TEAP, 2006; Velders et al., 2009; Gschrey et al., 2011; Miller & Kuijpers, 2011; Höglund-Isaksson et al., 2013). Read more information visit: http://shaktifoundation.in/report/indias-long-term-hydrofluorocarbon-hfc-emissions-detailed-cross-sectoral-analysis/
One such critically important category of gases is hydrofl uorocarbon (HFC). HFCs are potent greenhouse gases and are expected to contribute signifi cantly to global warming by 2050 (IPCC/TEAP, 2006; Velders et al., 2009; Gschrey et al., 2011; Miller & Kuijpers, 2011; Höglund-Isaksson et al., 2013). Read more information visit: http://shaktifoundation.in/report/indias-long-term-hydrofluorocarbon-hfc-emissions-detailed-cross-sectoral-analysis/

You also want an ePaper? Increase the reach of your titles
YUMPU automatically turns print PDFs into web optimized ePapers that Google loves.
16<br />
Methodological Approach<br />
These units have cooling capacity less than 1 kW. Data on stocks and market sales of equipment is largely absent.<br />
We have relied on CLASP mapping and benchmarking of commercial and refrigeration equipment (Weide et al.,<br />
2014) estimates of existing equipment in the base year. According to the source, there were 53 million plug-in<br />
display cabinet units in India in 2009. Due to lack of any data or labelling of equipment for HFC charges, average<br />
HFC uptake of 260 grams per units for the stand alone equipment is assumed, based on UNEP’s RTOC report<br />
(RTOC/UNEP, 2006). This is validated from the fact that charges rate is in similar range as domestic refrigerator<br />
because of the fact that the cooling capacities are very similar.<br />
Vending Machines<br />
Base year data for the vending machines is also taken from CLASP report (Weide et al., 2014). The higher range<br />
of HFC uptake for stand-alone units is taken from UNEP report (RTOC/UNEP, 2006) and represents as average<br />
charge (300 grams per unit) in absence of data from manufacturers.<br />
Remote Condenser Units<br />
Remote condenser units could either be display type employed by large retails shops or it could as well be for storage<br />
of additional refrigerated goods. The display type units are based on data from Weide et al., 2014. Non display<br />
units have racks of condensing units placed in a small machinery room away from the display area. Estimation of<br />
the total number of non-display units is based on our estimates of total electricity consumption for these units and<br />
their unit energy consumption. Refrigerant charges for this equipment type are assumed to be 3 kg -HFC based on<br />
information from latest UNEP report on refrigerant options (RTOC/UNEP, 2010). It is assumed that HFC-134a is<br />
being used in India for all remote condensing units as opposed to R-404a as a result of HFC-134a’s better performance<br />
at ambient temperatures (RTOC/UNEP, 2010).<br />
Centralised or Supermarket Systems<br />
Supermarkets use centralised refrigeration systems where compressors racks are installed in a machine room. As<br />
a result, length of piping, containing liquid refrigerant from the machinery room and vapour phase refrigerant<br />
back from the sales area, increases significantly and could be up to several kilometres (RTOC/UNEP, 2010). This<br />
explains the high leakages that are prevalent in the supermarket systems. This coupled with the only refrigerant<br />
choice: R-404a, for the kind of systems, which has highest GWP among all end-use replacement options, exacerbates<br />
the direct HFC emissions.<br />
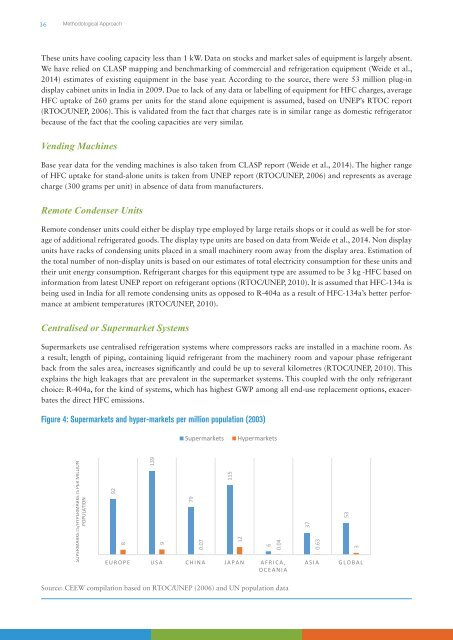
Figure 4: Supermarkets and hyper-markets per million population (2003)<br />
Supermarkets<br />
Hypermarkets<br />
SUPERMARKETS/HYPERMARKETS PER MILLION<br />
POPULATION<br />
92<br />
8<br />
139<br />
9<br />
79<br />
0.07<br />
EUROPE USA CHINA JAPAN AFRICA,<br />
OCEANIA<br />
115<br />
12<br />
6<br />
0.04<br />
37<br />
0.63<br />
ASIA<br />
53<br />
3<br />
GLOBAL<br />
Source: CEEW compilation based on RTOC/UNEP (2006) and UN population data