Platforms and Consumer / PFM Market Analysis
2cfJGdh
2cfJGdh

You also want an ePaper? Increase the reach of your titles
YUMPU automatically turns print PDFs into web optimized ePapers that Google loves.
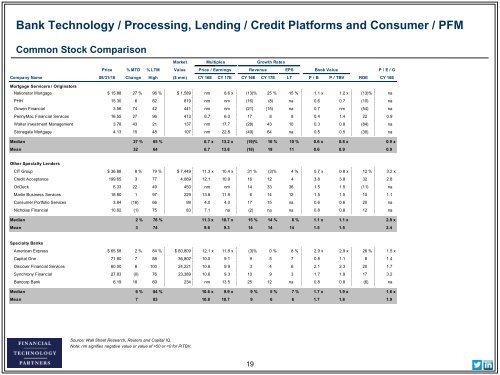
Bank Technology / Processing, Lending / Credit <strong>Platforms</strong> <strong>and</strong> <strong>Consumer</strong> / <strong>PFM</strong><br />
Common Stock Comparison<br />
<strong>Market</strong> Multiples Growth Rates<br />
Price % MTD % LTM Value Price / Earnings Revenue EPS Book Value P / E / G<br />
Company Name 08/31/16 Change High ($ mm) CY 16E CY 17E CY 16E CY 17E LT P / B P / TBV ROE CY 16E<br />
Mortgage Servicers / Originators<br />
Nationstar Mortgage $ 15.88 27 % 96 % $ 1,589 nm 8.6 x (13)% 25 % 15 % 1.1 x 1.2 x (13)% na<br />
PHH 15.30 6 82 819 nm nm (16) (8) na 0.6 0.7 (10) na<br />
Ocwen Financial 3.56 74 42 441 nm nm (21) (15) na 0.7 nm (54) na<br />
PennyMac Financial Services 16.55 27 96 413 6.7 6.0 17 8 8 0.4 1.4 22 0.9<br />
Walter Investment Management 3.78 43 21 137 nm 17.7 (28) 43 10 0.3 0.8 (84) na<br />
Stonegate Mortgage 4.13 15 48 107 nm 22.8 (49) 64 na 0.5 0.5 (30) na<br />
Median 27 % 65 % 6.7 x 13.2 x (19)% 16 % 10 % 0.6 x 0.8 x 0.9 x<br />
Mean 32 64 6.7 13.8 (18) 19 11 0.6 0.9 0.9<br />
Other Specialty Lenders<br />
CIT Group $ 36.88 8 % 79 % $ 7,449 11.3 x 10.4 x 31 % (3)% 4 % 0.7 x 0.8 x 12 % 3.2 x<br />
Credit Acceptance 199.65 3 77 4,069 12.1 10.9 16 12 4 3.8 3.8 32 2.8<br />
OnDeck 6.33 22 49 450 nm nm 14 33 36 1.5 1.5 (11) na<br />
Marlin Business Services 18.80 1 97 229 13.6 11.8 6 14 12 1.5 1.5 10 1.1<br />
<strong>Consumer</strong> Portfolio Services 3.84 (16) 66 99 4.0 4.0 17 15 na 0.6 0.6 20 na<br />
Nicholas Financial 10.62 (1) 75 83 7.1 na (2) na na 0.8 0.8 12 na<br />
Median 2 % 76 % 11.3 x 10.7 x 15 % 14 % 8 % 1.1 x 1.1 x 2.8 x<br />
Mean 3 74 9.6 9.3 14 14 14 1.5 1.5 2.4<br />
Specialty Banks<br />
American Express $ 65.58 2 % 84 % $ 60,809 12.1 x 11.8 x (3)% 0 % 8 % 2.9 x 2.9 x 26 % 1.5 x<br />
Capital One 71.60 7 88 36,802 10.0 9.1 9 5 7 0.8 1.1 8 1.4<br />
Discover Financial Services 60.00 6 100 24,221 10.6 9.9 3 4 6 2.1 2.3 20 1.7<br />
Synchrony Financial 27.83 (0) 76 23,389 10.6 9.3 10 9 3 1.7 1.9 17 3.2<br />
Bancorp Bank 6.19 18 69 234 nm 13.5 25 12 na 0.8 0.8 (6) na<br />
Median 6 % 84 % 10.6 x 9.9 x 9 % 5 % 7 % 1.7 x 1.9 x 1.6 x<br />
Mean 7 83 10.8 10.7 9 6 6 1.7 1.8 1.9<br />
Source: Wall Street Research, Reuters <strong>and</strong> Capital IQ.<br />
Note: nm signifies negative value or value of >50 or