

2230_SAIRR_WWACinSA_sm4.indd 1 2016/09/05 5:04 PM
sairr_english_wwacinsa_print_050916
sairr_english_wwacinsa_print_050916

Create successful ePaper yourself
Turn your PDF publications into a flip-book with our unique Google optimized e-Paper software.
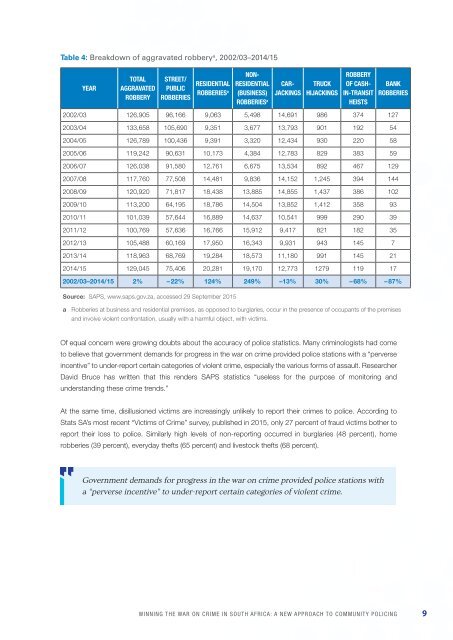
Table 4: Breakdown of aggravated robbery a , 2002/03–2014/15<br />
YEAR<br />
TOTAL<br />
AGGRAVATED<br />
ROBBERY<br />
STREET/<br />
PUBLIC<br />
ROBBERIES<br />
RESIDENTIAL<br />
ROBBERIES a<br />
NON-<br />
RESIDENTIAL<br />
(BUSINESS)<br />
ROBBERIES a<br />
CAR-<br />
JACKINGS<br />
TRUCK<br />
HIJACKINGS<br />
ROBBERY<br />
OF CASH-<br />
IN-TRANSIT<br />
HEISTS<br />
BANK<br />
ROBBERIES<br />
2002/03 126,9<strong>05</strong> 96,166 9,063 5,498 14,691 986 374 127<br />
2003/<strong>04</strong> 133,658 1<strong>05</strong>,690 9,351 3,677 13,793 901 192 54<br />
20<strong>04</strong>/<strong>05</strong> 126,789 100,436 9,391 3,320 12,434 930 220 58<br />
20<strong>05</strong>/06 119,242 90,631 10,173 4,384 12,783 829 383 59<br />
2006/07 126,038 91,580 12,761 6,675 13,534 892 467 129<br />
2007/08 117,760 77,508 14,481 9,836 14,152 1,245 394 144<br />
2008/<strong>09</strong> 120,920 71,817 18,438 13,885 14,855 1,437 386 102<br />
20<strong>09</strong>/10 113,200 64,195 18,786 14,5<strong>04</strong> 13,852 1,412 358 93<br />
2010/11 101,039 57,644 16,889 14,637 10,541 999 290 39<br />
2011/12 100,769 57,636 16,766 15,912 9,417 821 182 35<br />
2012/13 1<strong>05</strong>,488 60,169 17,950 16,343 9,931 943 145 7<br />
2013/14 118,963 68,769 19,284 18,573 11,180 991 145 21<br />
2014/15 129,<strong>04</strong>5 75,406 20,281 19,170 12,773 1279 119 17<br />
2002/03–2014/15 2% – 22% 124% 249% –13% 30% – 68% – 87%<br />
Source: SAPS, www.saps.gov.za, accessed 29 September 2015<br />
a Robberies at business and residential premises, as opposed to burglaries, occur in the presence of occupants of the premises<br />
and involve violent confrontation, usually with a harmful object, with victims.<br />
Of equal concern were growing doubts about the accuracy of police statistics. Many criminologists had come<br />
to believe that government demands for progress in the war on crime provided police stations with a “perverse<br />
incentive” to under-report certain categories of violent crime, especially the various forms of assault. Researcher<br />
David Bruce has written that this renders SAPS statistics “useless for the purpose of monitoring and<br />
understanding these crime trends.”<br />
At the same time, disillusioned victims are increasingly unlikely to report their crimes to police. According to<br />
Stats SA’s most recent “Victims of Crime” survey, published in 2015, only 27 percent of fraud victims bother to<br />
report their loss to police. Similarly high levels of non-reporting occurred in burglaries (48 percent), home<br />
robberies (39 percent), everyday thefts (65 percent) and livestock thefts (68 percent).<br />
Government demands for progress in the war on crime provided police stations with<br />
a “perverse incentive” to under-report certain categories of violent crime.<br />
WINNING THE WAR ON CRIME IN SOUTH AFRICA: A NEW APPROACH TO COMMUNITY POLICING 9<br />
<strong>2230</strong>_<strong>SAIRR</strong>_<strong>WWACinSA</strong>_<strong>sm4.indd</strong> 9<br />
<strong>2016</strong>/<strong>09</strong>/<strong>05</strong> 5:<strong>04</strong> <strong>PM</strong>