

Ambient air pollution A global assessment of exposure and burden of disease
9789241511353-eng
9789241511353-eng

Create successful ePaper yourself
Turn your PDF publications into a flip-book with our unique Google optimized e-Paper software.
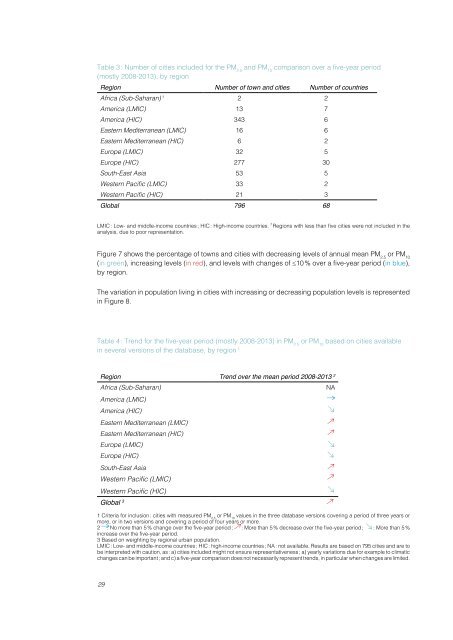
Table 3 : Number <strong>of</strong> cities included for the PM 2.5<br />
<strong>and</strong> PM 10<br />
comparison over a five-year period<br />
(mostly 2008-2013), by region<br />
Region Number <strong>of</strong> town <strong>and</strong> cities Number <strong>of</strong> countries<br />
Africa (Sub-Saharan) 1 2 2<br />
America (LMIC) 13 7<br />
America (HIC) 343 6<br />
Eastern Mediterranean (LMIC) 16 6<br />
Eastern Mediterranean (HIC) 6 2<br />
Europe (LMIC) 32 5<br />
Europe (HIC) 277 30<br />
South-East Asia 53 5<br />
Western Pacific (LMIC) 33 2<br />
Western Pacific (HIC) 21 3<br />
Global 796 68<br />
LMIC : Low- <strong>and</strong> middle-income countries ; HIC : High-income countries. 1 Regions with less than five cities were not included in the<br />
analysis, due to poor representation.<br />
Figure 7 shows the percentage <strong>of</strong> towns <strong>and</strong> cities with decreasing levels <strong>of</strong> annual mean PM 2.5<br />
or PM 10<br />
(in green), increasing levels (in red), <strong>and</strong> levels with changes <strong>of</strong> ≤10 % over a five-year period (in blue),<br />
by region.<br />
The variation in population living in cities with increasing or decreasing population levels is represented<br />
in Figure 8.<br />
Table 4 : Trend for the five-year period (mostly 2008-2013) in PM 2.5<br />
or PM 10<br />
based on cities available<br />
in several versions <strong>of</strong> the database, by region 1<br />
Region Trend over the mean period 2008-2013 2<br />
Africa (Sub-Saharan)<br />
America (LMIC)<br />
America (HIC)<br />
Eastern Mediterranean (LMIC)<br />
Eastern Mediterranean (HIC)<br />
Europe (LMIC)<br />
Europe (HIC)<br />
South-East Asia<br />
Western Pacific (LMIC)<br />
Western Pacific (HIC)<br />
Global 3<br />
1 Criteria for inclusion : cities with measured PM 2.5<br />
or PM 10<br />
values in the three database versions covering a period <strong>of</strong> three years or<br />
more, or in two versions <strong>and</strong> covering a period <strong>of</strong> four years or more.<br />
2 : No more than 5 % change over the five-year period ; : More than 5 % decrease over the five-year period ; : More than 5 %<br />
increase over the five-year period.<br />
3 Based on weighting by regional urban population.<br />
LMIC : Low- <strong>and</strong> middle-income countries ; HIC : high-income countries ; NA : not available. Results are based on 795 cities <strong>and</strong> are to<br />
be interpreted with caution, as : a) cities included might not ensure representativeness ; a) yearly variations due for example to climatic<br />
changes can be important ; <strong>and</strong> c) a five-year comparison does not necessarily represent trends, in particular when changes are limited.<br />
NA<br />
29
