

Ambient air pollution A global assessment of exposure and burden of disease
9789241511353-eng
9789241511353-eng

Create successful ePaper yourself
Turn your PDF publications into a flip-book with our unique Google optimized e-Paper software.
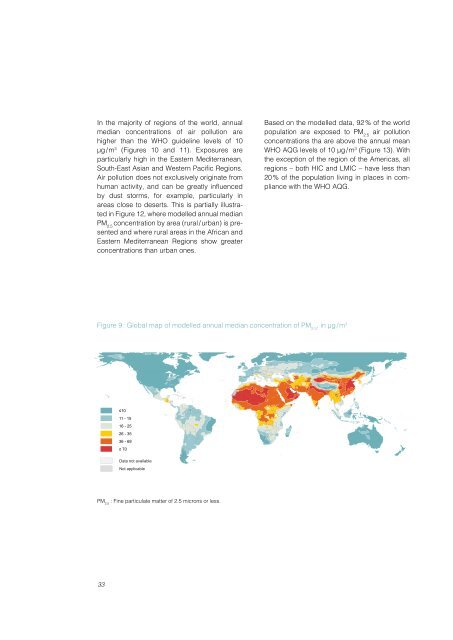
In the majority <strong>of</strong> regions <strong>of</strong> the world, annual<br />
median concentrations <strong>of</strong> <strong>air</strong> <strong>pollution</strong> are<br />
higher than the WHO guideline levels <strong>of</strong> 10<br />
μg / m 3 (Figures 10 <strong>and</strong> 11). Exposures are<br />
particularly high in the Eastern Mediterranean,<br />
South-East Asian <strong>and</strong> Western Pacific Regions.<br />
Air <strong>pollution</strong> does not exclusively originate from<br />
human activity, <strong>and</strong> can be greatly influenced<br />
by dust storms, for example, particularly in<br />
areas close to deserts. This is partially illustrated<br />
in Figure 12, where modelled annual median<br />
PM 2.5<br />
concentration by area (rural / urban) is presented<br />
<strong>and</strong> where rural areas in the African <strong>and</strong><br />
Eastern Mediterranean Regions show greater<br />
concentrations than urban ones.<br />
Based on the modelled data, 92 % <strong>of</strong> the world<br />
population are exposed to PM 2.5<br />
<strong>air</strong> <strong>pollution</strong><br />
concentrations tha are above the annual mean<br />
WHO AQG levels <strong>of</strong> 10 μg / m 3 (Figure 13). With<br />
the exception <strong>of</strong> the region <strong>of</strong> the Americas, all<br />
regions – both HIC <strong>and</strong> LMIC – have less than<br />
20 % <strong>of</strong> the population living in places in compliance<br />
with the WHO AQG.<br />
Figure 9 : Global map <strong>of</strong> modelled annual median concentration <strong>of</strong> PM 2.5<br />
, in µg / m 3<br />
PM 2.5<br />
: Fine particulate matter <strong>of</strong> 2.5 microns or less.<br />
33
