- Page 1 and 2:
Patent Assertion Entity Activity AN
- Page 3 and 4:
Table of Contents EXECUTIVE SUMMARY
- Page 5 and 6:
Litigation Outcomes................
- Page 7 and 8:
Executive Summary and Recommendatio
- Page 9 and 10:
Table A.1: Categories of PAEs in FT
- Page 11 and 12:
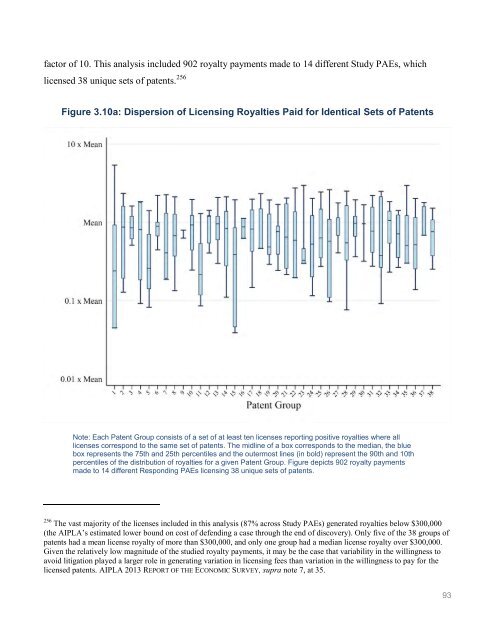
generated royalties of less than $3
- Page 13 and 14:
most frequently by Study PAEs, or (
- Page 15 and 16:
litigations tended to settle early;
- Page 17 and 18:
in a timely manner would help allev
- Page 19 and 20:
In December 2015, however, an amend
- Page 21 and 22:
Chapter 1: Introduction and Backgro
- Page 23 and 24:
corresponded to various types of NP
- Page 25 and 26:
PAE’s enforcement of that patent
- Page 27 and 28:
In one of the earliest studies, Jam
- Page 29 and 30:
defendants that will arise in the l
- Page 31 and 32:
entrepreneurship and related invest
- Page 33 and 34:
and efficient marketplace for paten
- Page 35 and 36:
The FTC and the DOJ supported USPTO
- Page 37 and 38:
the brief observed that the share o
- Page 39 and 40:
Greater transparency of patent owne
- Page 41 and 42:
only egregious misconduct, as Justi
- Page 43 and 44:
In September 2013, the Commission b
- Page 45 and 46:
were intended to generate a sample
- Page 47 and 48: The FTC’s study has two parts. Th
- Page 49 and 50: Litigation PAEs: Litigation PAEs ty
- Page 51 and 52: licenses. There was little overlap
- Page 53 and 54: guaranteed revenue and zero risk. T
- Page 55 and 56: agreements exclusively. These agree
- Page 57 and 58: Larger Litigation PAEs also used th
- Page 59 and 60: determine whether it has already li
- Page 61 and 62: epresented as unique docket numbers
- Page 63 and 64: Prior to initiating the study, the
- Page 65 and 66: FTC examined the frequency with whi
- Page 67 and 68: Study PAEs sent demands to relative
- Page 69 and 70: from related PAEs may help them neg
- Page 71 and 72: Electronic Product Manufacturing”
- Page 73 and 74: arely generated license agreements
- Page 75 and 76: In addition, four Responding PAEs a
- Page 77 and 78: Litigation PAEs and Portfolio PAEs
- Page 79 and 80: Table 3.1 provides the distribution
- Page 81 and 82: Figure 3.5a: Technology Category of
- Page 83 and 84: PAE cases and 44% of Litigation PAE
- Page 85 and 86: Figure 3.6: Frequency Distribution
- Page 87 and 88: Figure 3.7: Proportion of Study PAE
- Page 89 and 90: portfolios of patents, which typica
- Page 91 and 92: manner and extent to which Respondi
- Page 93 and 94: as quickly as possible. For Portfol
- Page 95 and 96: Study PAEs Generated Approximately
- Page 97: likely seeks to avoid the possibili
- Page 101 and 102: Figure 3.10a could be the result of
- Page 103 and 104: Figure 3.11: Number of Licenses Inv
- Page 105 and 106: granted licenses to firms operating
- Page 107 and 108: Turning to specific assertion behav
- Page 109 and 110: The preceding considerations have l
- Page 111 and 112: Chapter 4 first describes how Wirel
- Page 113 and 114: A Small Number of Targets Received
- Page 115 and 116: These percentages suggest that both
- Page 117 and 118: worldwide wireless chipset sales du
- Page 119 and 120: with 75% of their settlements occur
- Page 121 and 122: Wireless Respondents’ Licensing A
- Page 123 and 124: Table 4.2: Percentage of Wireless P
- Page 125 and 126: license with that entity, whereas P
- Page 127 and 128: Most Wireless Licensees Operated in
- Page 129 and 130: Conclusion The FTC’s goal in stud
- Page 131 and 132: Patent assignments were frequently
- Page 133 and 134: Figure 5.1: Size of Patent Holdings
- Page 135 and 136: Classification. 309 As of the time
- Page 137 and 138: while USPTO economists estimate tha
- Page 139 and 140: categories were Other Electrical &
- Page 141 and 142: More Than 75% of Study Patents Incl
- Page 143 and 144: Affiliates and Holding Entities, he
- Page 145 and 146: Figure 5.5: Age Distribution of Stu
- Page 147 and 148: eceive more citations than other ca
- Page 149 and 150:
1.5 and the median was 0.6, meaning
- Page 151 and 152:
Table 5.1: Percentage of Acquired P
- Page 153 and 154:
Appendix A: Glossary of Frequently
- Page 155 and 156:
“PAE Special Order” means the i
- Page 157 and 158:
Appendix B: Methodology Introductio
- Page 159 and 160:
contained more than 9,100 variants
- Page 161 and 162:
of the dispute as of the end of the
- Page 163 and 164:
Affiliates to a single industry. 37
- Page 165 and 166:
industry called “Management of Co
- Page 167 and 168:
the selected firms meet the FTC’s
- Page 169 and 170:
owning 10% or more of its stock.”
- Page 171 and 172:
Delaware avoided disclosing any inf
- Page 173 and 174:
SPECIFICATIONS A. Identification of
- Page 175 and 176:
(2) identify, from the following li
- Page 177 and 178:
(2) identify, from the following li
- Page 179 and 180:
(a) state the total amount paid in
- Page 181 and 182:
(3) did the Firm grant an exclusive
- Page 183 and 184:
H. Patent Assertion Information 1.
- Page 185 and 186:
Do not report revenue reported for
- Page 187 and 188:
f. Does the License relate to a Wir
- Page 189 and 190:
(e) provide a narrative response st
- Page 191 and 192:
1. Separately, for each year since
- Page 193 and 194:
APPENDIX A A. General Instructions
- Page 195 and 196:
“Patent” means a United States
- Page 197 and 198:
For district court and bankruptcy c
- Page 199 and 200:
Number Ending Reference Number Cust
- Page 201 and 202:
(i) (ii) (iii) (iv) For productions
- Page 203 and 204:
APPENDIX B Certification This Speci
- Page 205 and 206:
SPECIFICATIONS A. Identification of
- Page 207 and 208:
(1) state the jurisdiction; and (2)
- Page 209 and 210:
e. Identify, from the following lis
- Page 211 and 212:
(1) state the total revenue the Fir
- Page 213 and 214:
(1) identify the geographic restric
- Page 215 and 216:
F. Aggregate Cost Information 1. Se
- Page 217 and 218:
3. Produce, and provide a narrative
- Page 219 and 220:
Microsoft Word and PDF versions. Fo
- Page 221 and 222:
U.S. Patent numbers shall be provid
- Page 223 and 224:
(ii) Submit emails in image format
- Page 225 and 226:
Filename with extension Production
- Page 227 and 228:
(v) (vi) For each document withheld
- Page 229 and 230:
APPENDIX E: SUPPORTING STATEMENT FO
- Page 231 and 232:
“strongly urge[s] the FTC to foll
- Page 233 and 234:
The proposed case studies will prov
- Page 235 and 236:
What strategies do PAEs employ to a
- Page 237 and 238:
competition, innovation, and intell
- Page 239 and 240:
proposed requests “are a rational
- Page 241 and 242:
study questions and removed questio
- Page 243 and 244:
Some of the proposed requests for d
- Page 245 and 246:
Response: The Commission has narrow
- Page 247 and 248:
increase are not well understood.
- Page 249 and 250:
equests include interactions betwee
- Page 251 and 252:
In contrast, several commenters bel
- Page 253 and 254:
average burden for each of the appr
- Page 255 and 256:
enefits), and 320 research assistan
- Page 257 and 258:
PART B - COLLECTION OF INFORMATION
- Page 259 and 260:
stratum. The FTC will sum the two s
- Page 261 and 262:
Freedom and RPX use public sources
- Page 263 and 264:
The FTC will send one set of inform
- Page 265 and 266:
will have one entry for each acquis
- Page 267 and 268:
are two reasons why it is important
- Page 269:
Federal Trade Commission ftc.gov