Hunger
2doIQaO
2doIQaO
You also want an ePaper? Increase the reach of your titles
YUMPU automatically turns print PDFs into web optimized ePapers that Google loves.
Food Insecurity Persists Despite students’ Efforts<br />
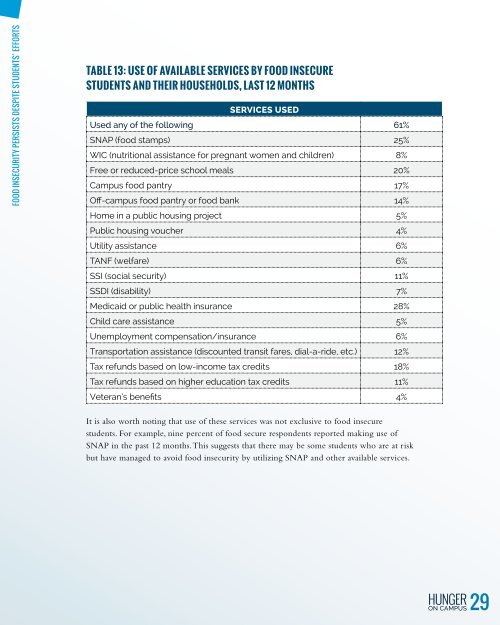
Table 13: Use of Available Services by Food Insecure<br />
Students and their Households, Last 12 Months<br />
Services Used<br />
Used any of the following 61%<br />
SNAP (food stamps) 25%<br />
WIC (nutritional assistance for pregnant women and children) 8%<br />
Free or reduced-price school meals 20%<br />
Campus food pantry 17%<br />
Off-campus food pantry or food bank 14%<br />
Home in a public housing project 5%<br />
Public housing voucher 4%<br />
Utility assistance 6%<br />
TANF (welfare) 6%<br />
SSI (social security) 11%<br />
SSDI (disability) 7%<br />
Medicaid or public health insurance 28%<br />
Child care assistance 5%<br />
Unemployment compensation/insurance 6%<br />
Transportation assistance (discounted transit fares, dial-a-ride, etc.) 12%<br />
Tax refunds based on low-income tax credits 18%<br />
Tax refunds based on higher education tax credits 11%<br />
Veteran’s benefits 4%<br />
It is also worth noting that use of these services was not exclusive to food insecure<br />
students. For example, nine percent of food secure respondents reported making use of<br />
SNAP in the past 12 months. This suggests that there may be some students who are at risk<br />
but have managed to avoid food insecurity by utilizing SNAP and other available services.<br />
29


