J K Lakshmi Cement
kN8x305Ch54
kN8x305Ch54

You also want an ePaper? Increase the reach of your titles
YUMPU automatically turns print PDFs into web optimized ePapers that Google loves.
27 October 2016<br />
2QFY17 Results Update | Sector: <strong>Cement</strong><br />
J K <strong>Lakshmi</strong> <strong>Cement</strong><br />
BSE SENSEX<br />
S&P CNX<br />
27,916 8,615<br />
Bloomberg<br />
JKLC IN<br />
Equity Shares (m) 117.7<br />
M.Cap.(INRb)/(USDb) 56.5 / 0.9<br />
52-Week Range (INR) 514 / 253<br />
1, 6, 12 Rel. Per (%) 0/28/24<br />
Avg Val, INRm 40<br />
Free float (%) 54.1<br />
Financials & Valuations (INR b)<br />
Y/E Mar 2016 2017E 2018E<br />
Sales 26.2 31.0 37.9<br />
EBITDA 2.7 4.6 7.8<br />
NP 0.0 1.0 3.6<br />
Adj EPS (INR) 0.4 8.7 30.3<br />
EPS Gr. (%) -97.1 2,230.2 249.2<br />
BV/Sh. (INR) 113.3 117.9 139.5<br />
RoE (%) 0.3 7.5 23.6<br />
RoCE (%) -0.9 7.3 14.4<br />
EV/EBITDA (x) 26.2 15.0 8.4<br />
EV/Ton (USD) 117 115 99<br />
Estimate change<br />
TP change<br />
Rating change<br />
CMP: INR480 TP: INR606 (+26%) Buy<br />
Realization improvement in a seasonally weak quarter<br />
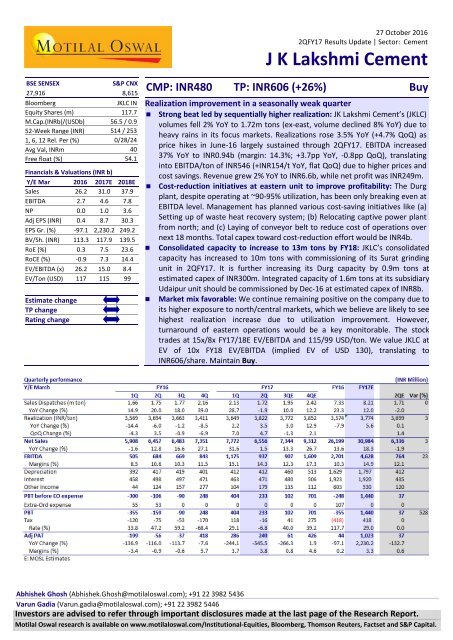
• Strong beat led by sequentially higher realization: JK <strong>Lakshmi</strong> <strong>Cement</strong>’s (JKLC)<br />
volumes fell 2% YoY to 1.72m tons (ex-east, volume declined 8% YoY) due to<br />
heavy rains in its focus markets. Realizations rose 3.5% YoY (+4.7% QoQ) as<br />
price hikes in June-16 largely sustained through 2QFY17. EBITDA increased<br />
37% YoY to INR0.94b (margin: 14.3%; +3.7pp YoY, -0.8pp QoQ), translating<br />
into EBITDA/ton of INR546 (+INR154/t YoY, flat QoQ) due to higher prices and<br />
cost savings. Revenue grew 2% YoY to INR6.6b, while net profit was INR249m.<br />
• Cost-reduction initiatives at eastern unit to improve profitability: The Durg<br />
plant, despite operating at ~90-95% utilization, has been only breaking even at<br />
EBITDA level. Management has planned various cost-saving initiatives like (a)<br />
Setting up of waste heat recovery system; (b) Relocating captive power plant<br />
from north; and (c) Laying of conveyor belt to reduce cost of operations over<br />
next 18 months. Total capex toward cost-reduction effort would be INR4b.<br />
• Consolidated capacity to increase to 13m tons by FY18: JKLC’s consolidated<br />
capacity has increased to 10m tons with commissioning of its Surat grinding<br />
unit in 2QFY17. It is further increasing its Durg capacity by 0.9m tons at<br />
estimated capex of INR300m. Integrated capacity of 1.6m tons at its subsidiary<br />
Udaipur unit should be commissioned by Dec-16 at estimated capex of INR8b.<br />
• Market mix favorable: We continue remaining positive on the company due to<br />
its higher exposure to north/central markets, which we believe are likely to see<br />
highest realization increase due to utilization improvement. However,<br />
turnaround of eastern operations would be a key monitorable. The stock<br />
trades at 15x/8x FY17/18E EV/EBITDA and 115/99 USD/ton. We value JKLC at<br />
EV of 10x FY18 EV/EBITDA (implied EV of USD 130), translating to<br />
INR606/share. Maintain Buy.<br />
Abhishek Ghosh (Abhishek.Ghosh@motilaloswal.com); +91 22 3982 5436<br />
Varun Gadia (Varun.gadia@motilaloswal.com); +91 22 3982 5446<br />
Investors are advised to refer through important disclosures made at the last page of the Research Report.<br />
Motilal Oswal research is available on www.motilaloswal.com/Institutional-Equities, Bloomberg, Thomson Reuters, Factset and S&P Capital.
J K <strong>Lakshmi</strong> <strong>Cement</strong><br />
Exhibit 1: Volume declined by 2% due to heavy rains<br />
Volume (mt) Growth (%)<br />
Exhibit 2: Realizations improved QoQ by 4.7% (INR/ton)<br />
1.26<br />
4QFY11<br />
11 19 23<br />
13 13<br />
7 7 14 19 18 13 15 20 18<br />
2 6<br />
1<br />
-9<br />
-10<br />
-12<br />
1.13<br />
1.13<br />
1.23<br />
1.42<br />
1.39<br />
1.21<br />
1.25<br />
1.43<br />
2QFY12<br />
4QFY12<br />
2QFY13<br />
4QFY13<br />
1.22<br />
1.29<br />
1.42<br />
1.70<br />
1.44<br />
1.46<br />
1.50<br />
2QFY14<br />
4QFY14<br />
2QFY15<br />
4QFY15 1.55<br />
39<br />
29<br />
-2<br />
1.66<br />
1.75<br />
1.77<br />
2.16<br />
2.13<br />
1.72<br />
2QFY16<br />
4QFY16<br />
2QFY17<br />
3,269<br />
3,467<br />
3,134<br />
3,582<br />
3,707<br />
3,837<br />
4,075<br />
3,949<br />
3,744<br />
3,745<br />
3,482<br />
3,539<br />
3,809<br />
4,170<br />
3,931<br />
3,706<br />
3,729<br />
3,569<br />
3,694<br />
3,663<br />
3,411<br />
3,649<br />
3,822<br />
4QFY11<br />
2QFY12<br />
4QFY12<br />
2QFY13<br />
4QFY13<br />
2QFY14<br />
4QFY14<br />
2QFY15<br />
4QFY15<br />
2QFY16<br />
4QFY16<br />
2QFY17<br />
Source: Company, MOSL<br />
Source: Company, MOSL<br />
Exhibit 3: OPM marginally declined QoQ due to increase in<br />
P&F and Freight costs<br />
EBITDA (INR m) Margin (%)<br />
Exhibit 4: Trend in EBITDA/ton (INR)<br />
19 19<br />
21 23 23 23 20 18 15<br />
13 13<br />
17 19 16 14 12<br />
9 11 10 11 15 14<br />
12<br />
4QFY11<br />
2QFY12<br />
4QFY12<br />
2QFY13<br />
4QFY13<br />
2QFY14<br />
4QFY14<br />
2QFY15<br />
4QFY15<br />
2QFY16<br />
4QFY16<br />
2QFY17<br />
4QFY11<br />
2QFY12<br />
4QFY12<br />
2QFY13<br />
4QFY13<br />
2QFY14<br />
4QFY14<br />
2QFY15<br />
4QFY15<br />
2QFY16<br />
4QFY16<br />
2QFY17<br />
767<br />
738<br />
412<br />
929<br />
1,208<br />
1,218<br />
1,128<br />
981<br />
953<br />
702<br />
563<br />
634<br />
1,121<br />
1,135<br />
892<br />
754<br />
714<br />
505<br />
684<br />
669<br />
843<br />
1,175<br />
937<br />
609<br />
653<br />
364<br />
758<br />
851<br />
876<br />
936<br />
785<br />
666<br />
576<br />
436<br />
447<br />
658<br />
788<br />
612<br />
503<br />
461<br />
305<br />
391<br />
378<br />
391<br />
552<br />
546<br />
Source: Company, MOSL<br />
Source: Company, MOSL<br />
Exhibit 5: Key performance indicator<br />
INR/Ton 2QFY17 2QFY16 YoY (%) 1QFY16 QoQ (%)<br />
Net realization 3,822 3,694 3.5 3,649 4.7<br />
Expenditure<br />
RM Cost 978 1,072 -6.6 1,001 -2.5<br />
Employee Expenses 301 273 10.5 252 19.2<br />
Power, Oil & Fuel 679 751 -9.6 616 10.2<br />
Freight 914 871 4.9 857 6.6<br />
Other Expenses 404 336 30.5 370 9.1<br />
Total Expenses 3,276 3,303 -0.6 3,097 5.8<br />
EBITDA 546 391 39.5 552 -1.0<br />
Management commentary<br />
• Capacity expansion: The consolidated capacity of the company has increased to<br />
10m tons with the recent commissioning of its Surat grinding unit in 2QFY17. It<br />
is further increasing its Durg capacity by 0.9m tons at an estimated capex of<br />
INR300mn. The integrated capacity of 1.6mtons at its subsidiary Udaipur unit is<br />
likely to get commissioned by December-16 at an estimated capex of INR8bn<br />
• Cost reduction initiatives at Easter unit: JKLC eastern unit has been only<br />
breaking even at EBITDA level despite operating at close to 100% utilization due<br />
to cost inefficiencies. In order to improve cost efficiencies, management is<br />
putting up a conveyor belt for limestone transportation, Waste Heat Recovery<br />
System to meet 30% of its power requirement, relocating the captive power<br />
27 October 2016 2
J K <strong>Lakshmi</strong> <strong>Cement</strong><br />
plant from its Northern operations. The combined capex towards the cost<br />
reduction programs would be INR4bn.<br />
• Management expects cost savings for its eastern units to the extent of INR200/t<br />
‣ INR 70 to INR 80/ton from WHRs unit that will be operational from<br />
September 2017<br />
‣ INR 80 to 90/ton from thermal power unit that will be operational from<br />
March 2017<br />
‣ INR 30 to 40/ton from conveyor belt that will increase productivity<br />
• Demand expected to grow 8 to 10% due to pre Diwali spending, government<br />
initiatives and good monsoons<br />
• North Trade mix at 50% vs. 50% Non-Trade and East Trade mix at 20% vs. 80%<br />
Non-Trade<br />
• The impact of higher power and fuel costs will not be completely seen in<br />
December quarter; Most of the power and fuel impact will be seen in 4QFY17<br />
• Standalone net debt at ~15b at the end of 2QFY17.<br />
• Estimate capex for FY17 would be INR 2bn for standalone operations.<br />
Fundamental strength getting stained by rising concerns in east operations<br />
• JKLC has a strong market-mix with 75% of its sales in North markets . It has also<br />
diversified itself by adding capacity in the east. Capacity addition in Surat and<br />
east offer further growth potential for the company.<br />
• The company has a superior cost structure due to (a) consistently improving<br />
fuel efficiency (in top quartile among industry players), (b) 100% self-sufficiency<br />
in power in north, and (c) competitive fuel mix with pet coke (85%).<br />
• However the eastern operations profitability is impacted due to cost<br />
inefficiencies in form of higher power and fuel cost. Management is taking<br />
prudent measure to improve profitability of the unit in next 1-2 years.<br />
• Net debt likely to have peaked out with the conclusion of large part of ongoing<br />
expansion; Company expects to refinance loans taking benefit of lower interest<br />
rates.<br />
• We continue to remain positive on the company due to its higher exposure to<br />
North and Central markets which we believe is likely to see highest realization<br />
increase on back of utilization improvement. However the turnaround of<br />
eastern operations would be a key monitorable. The stock trades at 15x/8x<br />
FY17/18E EV/EBITDA and 115/99 USD/ton. We value JKLC at EV of 10x FY18<br />
EV/EBITDA (implied EV of USD 130), translating to INR606/share. Maintain Buy<br />
27 October 2016 3
J K <strong>Lakshmi</strong> <strong>Cement</strong><br />
Exhibit 6: Capacity expansion aids volume levers<br />
Capacity (mt)<br />
Dispatch (mt)<br />
Effective Utilization (%)<br />
105 103<br />
100<br />
91<br />
92<br />
94<br />
88<br />
88<br />
83<br />
78<br />
4.7<br />
4.0<br />
4.7<br />
4.6<br />
4.7<br />
4.3<br />
4.7<br />
4.9<br />
5.3<br />
5.3<br />
5.9<br />
5.6<br />
8.3<br />
5.9<br />
7.3<br />
8.2<br />
9.3<br />
9.3<br />
10.3<br />
9.2<br />
FY09 FY10 FY11 FY12 FY13 FY14 FY15 FY16E FY17E FY18E<br />
Source: Company, MOSL<br />
Exhibit 7: Market mix improves (%)<br />
North East West<br />
20 15 22<br />
35<br />
26<br />
27<br />
80<br />
64 65<br />
51<br />
Cap mix FY14 Cap mix FY17 Vol mix FY14 Vol mix FY17<br />
Source: Company, MOSL<br />
Exhibit 8: end in EBITDA/ton (INR)<br />
Exhibit 9: RoE to improve FY17 onwards (%)<br />
963<br />
771<br />
925<br />
431<br />
686<br />
812<br />
536<br />
588<br />
369<br />
564<br />
850<br />
30<br />
20<br />
10<br />
RoE<br />
RoCE<br />
FY08<br />
FY09<br />
FY10<br />
FY11<br />
FY12<br />
FY13<br />
FY14<br />
FY15<br />
FY16E<br />
FY17E<br />
FY18E<br />
Source: Company, MOSL<br />
0<br />
-10<br />
FY09<br />
FY10<br />
FY11<br />
FY12<br />
FY13<br />
FY14<br />
FY15<br />
FY16E<br />
FY17E<br />
FY18E<br />
Source: Company, MOSL<br />
27 October 2016 4
J K <strong>Lakshmi</strong> <strong>Cement</strong><br />
Financials and valuations<br />
Income Statement<br />
(INR Million)<br />
Y/E March 2011 2012 2013 2014 2015 2016 2017E 2018E<br />
Net Sales 13,168 17,177 20,550 20,566 23,071 26,199 30,984 37,875<br />
Change (%) -11.7 30.4 19.6 0.1 12.2 13.6 18.3 22.2<br />
Total Expenditure 11,314 13,824 16,262 17,546 19,576 23,497 26,357 30,057<br />
% of Sales 85.9 80.5 79.1 85.3 84.9 89.7 85.1 79.4<br />
EBITDA 1,854 3,353 4,287 3,020 3,495 2,701 4,628 7,817<br />
Margin (%) 14.1 19.5 20.9 14.7 15.1 10.3 14.9 20.6<br />
Depreciation 846 1,297 1,489 1,352 1,119 1,629 1,797 1,792<br />
EBIT 1,008 2,056 2,798 1,668 2,376 1,073 2,831 6,025<br />
Int. and Finance Charges 605 874 835 772 907 1,923 1,920 1,638<br />
Other Income - Rec. 385 638 555 443 282 603 530 375<br />
PBT bef. EO Exp. 788 1,820 2,517 1,339 1,750 -248 1,440 4,762<br />
EO Expense/(Income) 0 392 163 185 633 107 0 0<br />
PBT after EO Exp. 788 1,427 2,354 1,154 1,118 -355 1,440 4,762<br />
Current Tax 45 179 696 132 87 0 418 1,190<br />
Deferred Tax 151 161 -99 92 75 -418 0 0<br />
Tax Rate (%) 25.0 23.8 25.3 19.4 14.5 117.7 29.0 25.0<br />
PAT Adj for EO items 591 1,387 1,879 1,079 1,497 44 1,023 3,571<br />
Change (%) -75.5 134.5 35.5 -42.6 38.7 -97.1 2,230.2 249.2<br />
Margin (%) 4.5 8.1 9.1 5.2 6.5 0.2 3.3 9.4<br />
Balance Sheet<br />
0 0.2193 0.17610428<br />
(INR Million)<br />
Y/E March 2011 2012 2013 2014 2015 2016 2017E 2018E<br />
Equity Share Capital 612 612 589 589 589 589 589 589<br />
Total Reserves 9,851 11,140 12,010 12,444 12,719 12,746 13,287 15,825<br />
Net Worth 10,463 11,752 12,598 13,032 13,307 13,334 13,875 16,413<br />
Deferred Liabilities 1,458 1,233 1,134 1,226 1,284 867 867 867<br />
Total Loans 8,483 11,004 13,370 16,042 18,992 19,201 19,201 17,201<br />
Capital Employed 20,404 23,989 27,101 30,300 33,584 33,402 33,943 34,481<br />
Gross Block 23,186 24,486 26,782 29,305 40,946 47,417 47,167 47,167<br />
Less: Accum. Deprn. 9,376 11,193 12,436 13,590 15,121 16,749 18,547 20,339<br />
Net Fixed Assets 13,810 13,293 14,346 15,715 25,825 30,668 28,621 26,828<br />
Capital WIP 409 2,941 6,881 9,080 2,000 0 2,000 4,000<br />
Total Investments 5,278 4,538 4,065 4,477 4,228 4,005 4,005 4,005<br />
Curr. Assets, Loans&Adv. 4,880 7,085 6,145 6,392 8,819 7,746 8,076 9,599<br />
Inventory 1,199 1,201 1,148 1,024 2,235 2,406 2,647 3,120<br />
Account Receivables 280 382 501 555 705 965 947 1,157<br />
Cash and Bank Balance 888 890 127 356 1,768 118 39 469<br />
Loans and Advances 2,514 4,612 4,369 4,457 4,112 4,258 4,443 4,853<br />
Curr. Liability & Prov. 4,359 3,868 4,335 5,364 7,289 9,017 8,758 9,951<br />
Account Payables 4,127 3,513 3,896 4,950 6,815 8,804 8,508 9,475<br />
Provisions 232 355 439 415 473 213 251 476<br />
Net Current Assets 521 3,218 1,810 1,028 1,531 -1,271 -683 -352<br />
Appl. of Funds 20,404 23,989 27,101 30,300 33,584 33,402 33,943 34,481<br />
E: MOSL Estimates; * Adjusted for treasury stocks<br />
27 October 2016 5
J K <strong>Lakshmi</strong> <strong>Cement</strong><br />
Financials and Valuations<br />
Ratios<br />
Y/E March 2011 2012 2013 2014 2015 2016 2017E 2018E<br />
Basic (INR) *<br />
EPS 4.8 11.3 16.0 9.2 12.7 0.4 8.7 30.3<br />
Cash EPS 11.7 21.9 28.6 20.7 22.2 14.2 24.0 45.6<br />
BV/Share 85.5 96.0 107.0 110.7 113.1 113.3 117.9 139.5<br />
DPS 1.2 1.9 2.5 2.0 2.0 2.0 3.5 7.5<br />
Payout (%) 30.1 25.3 19.5 29.6 28.8 437.9 47.1 28.9<br />
Valuation (x) *<br />
P/E 42.4 52.4 37.8 1,288.1 55.3 15.8<br />
Cash P/E 21.9 23.3 21.6 33.8 20.0 10.5<br />
P/BV 5.0 4.3 4.2 4.2 4.1 3.4<br />
EV/Sales 3.4 2.9 3.0 2.7 2.2 1.7<br />
EV/EBITDA 17.7 19.8 19.8 26.2 15.0 8.4<br />
EV/Ton (USD) 192 155 128 117 115 99<br />
Dividend Yield (%) 0.4 0.4 0.4 0.4 0.7 1.6<br />
Return Ratios (%)<br />
RoE 5.7 12.5 15.4 8.4 11.4 0.3 7.5 23.6<br />
RoCE 5.4 9.8 10.3 6.2 7.4 -0.9 7.3 14.4<br />
RoIC 6.0 10.4 10.6 5.7 7.6 -0.7 6.6 14.7<br />
Working Capital Ratios<br />
Asset Turnover (x) 0.6 0.7 0.8 0.7 0.7 0.8 0.9 1.1<br />
Inventory (Days) 33.2 25.5 20.4 18.2 35.4 33.5 31.2 30.1<br />
Debtor (Days) 7 7 8 9 10 12 10 10<br />
Creditor (Days) 114 75 69 88 108 123 100 91<br />
Growth (%)<br />
Sales -11.7 30.4 19.6 0.1 12.2 13.6 18.3 22.2<br />
EBITDA -56.3 80.8 27.8 -29.6 15.7 -22.7 71.3 68.9<br />
PAT -75.5 134.5 35.5 -42.6 38.7 -97.1 2,230.2 249.2<br />
Leverage Ratio (x)<br />
Current Ratio 1.1 1.8 1.4 1.2 1.2 0.9 0.9 1.0<br />
Interest Cover Ratio 2 2 3 2 3 1 1 4<br />
Debt/Equity 0.8 0.9 1.1 1.2 1.4 1.4 1.4 1.0<br />
* Adjusted for treasury stocks<br />
Cash Flow Statement<br />
(INR Million)<br />
Y/E March 2011 2012 2013 2014 2015 2016 2017E 2018E<br />
Oper. Profit/(Loss) before Tax 1,854 3,353 4,287 3,020 3,495 2,701 4,628 7,817<br />
Interest/Dividends Recd. 385 638 555 443 282 603 530 375<br />
Depreciation 0 0 0 0 0 0 0 0<br />
Direct Taxes Paid -45 -179 -696 -132 -103 0 -418 -1,190<br />
(Inc)/Dec in WC 1,253 -2,693 644 1,012 909 1,151 -667 99<br />
CF from Operations 3,446 1,119 4,790 4,342 4,582 4,455 4,073 7,101<br />
EO expense 123 127 -163 -185 -633 -107 0 0<br />
CF from Operating incl EO 3,569 1,246 4,627 4,157 3,950 4,348 4,073 7,101<br />
(inc)/dec in FA -2,739 -3,831 -6,236 -4,723 -4,560 -4,472 -1,750 -2,000<br />
Free Cash Flow 830 -2,585 -1,610 -565 -610 -124 2,323 5,101<br />
(Pur)/Sale of Investments -472 740 473 -413 249 223 0 0<br />
CF from investments -3,212 -3,091 -5,763 -5,135 -4,311 -4,249 -1,750 -2,000<br />
Issue of Shares -157 476 -569 -220 -406 240 0 0<br />
(Inc)/Dec in Debt -734 2,521 2,366 2,673 2,950 209 0 -2,000<br />
Interest Paid -605 -874 -835 -772 -907 -1,923 -1,920 -1,638<br />
Dividend Paid -178 -275 -342 -275 -275 -275 -482 -1,033<br />
CF from Fin. Activity -1,674 1,848 619 1,405 1,361 -1,749 -2,402 -4,671<br />
Inc/Dec of Cash -1,317 3 -518 427 1,000 -1,650 -79 430<br />
Add: Beginning Balance 2,204 888 890 127 356 1,768 118 39<br />
Closing Balance 887 890 372 554 1,356 118 39 469<br />
E: MOSL Estimates; * Adjusted for treasury stocks<br />
27 October 2016 6
J K <strong>Lakshmi</strong> <strong>Cement</strong><br />
Corporate profile<br />
Company description<br />
JK <strong>Lakshmi</strong> <strong>Cement</strong> (JKLC), promoted by the HS<br />
Singhania group, is a North India-based cement<br />
company. It has a cement capacity of 5.3mtpa and a<br />
CPP capacity of 66MW, which makes it selfsufficient<br />
in energy. While the North and the West<br />
account for 90-95% of its current dispatch mix,<br />
ongoing greenfield expansion of 2.7mtpa at Durg in<br />
Chhattisgarh would enhance its presence in the<br />
central and eastern markets, raising total capacity<br />
to 9.2mtpa by FY15.<br />
Exhibit 1: Sensex rebased<br />
Source: MOSL/Bloomberg<br />
Exhibit 2: Shareholding pattern (%)<br />
Sep-16 Jun-16 Sep-15<br />
Promoter 45.9 45.9 45.9<br />
DII 21.0 19.8 18.4<br />
FII 12.2 12.6 14.4<br />
Others 20.9 21.7 21.3<br />
Note: FII Includes depository receipts Source: Capitaline<br />
Exhibit 3: Top holders<br />
Holder Name<br />
% Holding<br />
Sachin Bansal & Vivek Bansal 4.0<br />
Hdfc Standard Life Insurance Company<br />
Limited 3.8<br />
Goldman Sachs India Fund Limited 2.5<br />
Life Insurance Corporation Of India 2.5<br />
Government Pension Fund Global 2.3<br />
Source: Capitaline<br />
Exhibit 4: Top management<br />
Name<br />
Bharat Hari Singhania<br />
Vinita Singhania<br />
Brijesh K Daga<br />
Designation<br />
Chairman & Managing<br />
Director<br />
Vice Chairman & M.D.<br />
Company Secretary<br />
Exhibit 5: Directors<br />
Name<br />
B V Bhargava<br />
N G Khaitan<br />
Raghupati Singhania<br />
S K Wali<br />
Name<br />
K N Memani<br />
Pradeep Dinodia<br />
Ravi Jhunjhunwala<br />
Shailendra Chouksey<br />
Source: Capitaline<br />
*Independent<br />
Exhibit 6: Auditors<br />
Name<br />
Lodha & Co<br />
Namo Narain Agarwal<br />
R J Goel & Co<br />
Type<br />
Statutory<br />
Secretarial Audit<br />
Cost Auditor<br />
Exhibit 7: MOSL forecast v/s consensus<br />
EPS<br />
MOSL Consensus<br />
(INR) forecast forecast<br />
Variation (%)<br />
FY17 8.7 11.6 -25.3<br />
FY18 30.3 25.2 20.2<br />
Source: Capitaline<br />
Source: Bloomberg<br />
27 October 2016 7
Disclosures<br />
This document has been prepared by Motilal Oswal Securities Limited (hereinafter referred to as Most) to provide information about the company (ies) and/sector(s), if any, covered in the report J and K <strong>Lakshmi</strong> may be distributed <strong>Cement</strong> by it and/or<br />
its affiliated company(ies). This report is for personal information of the selected recipient/s and does not construe to be any investment, legal or taxation advice to you. This research report does not constitute an offer, invitation or<br />
inducement to invest in securities or other investments and Motilal Oswal Securities Limited (hereinafter referred as MOSt) is not soliciting any action based upon it. This report is not for public distribution and has been furnished to<br />
you solely for your general information and should not be reproduced or redistributed to any other person in any form. This report does not constitute a personal recommendation or take into account the particular investment<br />
objectives, financial situations, or needs of individual clients. Before acting on any advice or recommendation in this material, investors should consider whether it is suitable for their particular circumstances and, if necessary, seek<br />
professional advice. The price and value of the investments referred to in this material and the income from them may go down as well as up, and investors may realize losses on any investments. Past performance is not a guide<br />
for future performance, future returns are not guaranteed and a loss of original capital may occur.<br />
MOSt and its affiliates are a full-service, integrated investment banking, investment management, brokerage and financing group. We and our affiliates have investment banking and other business relationships with a some<br />
companies covered by our Research Department. Our research professionals may provide input into our investment banking and other business selection processes. Investors should assume that MOSt and/or its affiliates are<br />
seeking or will seek investment banking or other business from the company or companies that are the subject of this material and that the research professionals who were involved in preparing this material may educate<br />
investors on investments in such business . The research professionals responsible for the preparation of this document may interact with trading desk personnel, sales personnel and other parties for the purpose of gathering,<br />
applying and interpreting information. Our research professionals are paid on twin parameters of performance & profitability of MOSt.<br />
MOSt generally prohibits its analysts, persons reporting to analysts, and members of their households from maintaining a financial interest in the securities or derivatives of any companies that the analysts cover. Additionally,<br />
MOSt generally prohibits its analysts and persons reporting to analysts from serving as an officer, director, or advisory board member of any companies that the analysts cover. Our salespeople, traders, and other professionals or<br />
affiliates may provide oral or written market commentary or trading strategies to our clients that reflect opinions that are contrary to the opinions expressed herein, and our proprietary trading and investing businesses may make<br />
investment decisions that are inconsistent with the recommendations expressed herein. In reviewing these materials, you should be aware that any or all of the foregoing among other things, may give rise to real or potential<br />
conflicts of interest. MOSt and its affiliated company(ies), their directors and employees and their relatives may; (a) from time to time, have a long or short position in, act as principal in, and buy or sell the securities or derivatives<br />
thereof of companies mentioned herein. (b) be engaged in any other transaction involving such securities and earn brokerage or other compensation or act as a market maker in the financial instruments of the company(ies)<br />
discussed herein or act as an advisor or lender/borrower to such company(ies) or may have any other potential conflict of interests with respect to any recommendation and other related information and opinions.; however the<br />
same shall have no bearing whatsoever on the specific recommendations made by the analyst(s), as the recommendations made by the analyst(s) are completely independent of the views of the affiliates of MOSt even though<br />
there might exist an inherent conflict of interest in some of the stocks mentioned in the research report<br />
Reports based on technical and derivative analysis center on studying charts company's price movement, outstanding positions and trading volume, as opposed to focusing on a company's fundamentals and, as such, may not<br />
match with a report on a company's fundamental analysis. In addition MOST has different business segments / Divisions with independent research separated by Chinese walls catering to different set of customers having various<br />
objectives, risk profiles, investment horizon, etc, and therefore may at times have different contrary views on stocks sectors and markets.<br />
Unauthorized disclosure, use, dissemination or copying (either whole or partial) of this information, is prohibited. The person accessing this information specifically agrees to exempt MOSt or any of its affiliates or employees from,<br />
any and all responsibility/liability arising from such misuse and agrees not to hold MOSt or any of its affiliates or employees responsible for any such misuse and further agrees to hold MOSt or any of its affiliates or employees free<br />
and harmless from all losses, costs, damages, expenses that may be suffered by the person accessing this information due to any errors and delays. The information contained herein is based on publicly available data or other<br />
sources believed to be reliable. Any statements contained in this report attributed to a third party represent MOSt’s interpretation of the data, information and/or opinions provided by that third party either publicly or through a<br />
subscription service, and such use and interpretation have not been reviewed by the third party. This Report is not intended to be a complete statement or summary of the securities, markets or developments referred to in the<br />
document. While we would endeavor to update the information herein on reasonable basis, MOSt and/or its affiliates are under no obligation to update the information. Also there may be regulatory, compliance, or other reasons<br />
that may prevent MOSt and/or its affiliates from doing so. MOSt or any of its affiliates or employees shall not be in any way responsible and liable for any loss or damage that may arise to any person from any inadvertent error in<br />
the information contained in this report. MOSt or any of its affiliates or employees do not provide, at any time, any express or implied warranty of any kind, regarding any matter pertaining to this report, including without limitation<br />
the implied warranties of merchantability, fitness for a particular purpose, and non-infringement. The recipients of this report should rely on their own investigations.<br />
This report is intended for distribution to institutional investors. Recipients who are not institutional investors should seek advice of their independent financial advisor prior to taking any investment decision based on this report or<br />
for any necessary explanation of its contents.<br />
Most and it’s associates may have managed or co-managed public offering of securities, may have received compensation for investment banking or merchant banking or brokerage services, may have received any compensation<br />
for products or services other than investment banking or merchant banking or brokerage services from the subject company in the past 12 months.<br />
Most and it’s associates have not received any compensation or other benefits from the subject company or third party in connection with the research report.<br />
Subject Company may have been a client of Most or its associates during twelve months preceding the date of distribution of the research report<br />
MOSt and/or its affiliates and/or employees may have interests/positions, financial or otherwise of over 1 % at the end of the month immediately preceding the date of publication of the research in the securities mentioned in this<br />
report. To enhance transparency, MOSt has incorporated a Disclosure of Interest Statement in this document. This should, however, not be treated as endorsement of the views expressed in the report.<br />
Motilal Oswal Securities Limited is registered as a Research Analyst under SEBI (Research Analyst) Regulations, 2014. SEBI Reg. No. INH000000412<br />
Pending Regulatory inspections against Motilal Oswal Securities Limited:<br />
SEBI pursuant to a complaint from client Shri C.R. Mohanraj alleging unauthorized trading, issued a letter dated 29th April 2014 to MOSL notifying appointment of an Adjudicating Officer as per SEBI regulations to hold inquiry and<br />
adjudge violation of SEBI Regulations; MOSL replied to the Show Cause Notice whereby SEBI granted us an opportunity of Inspection of Documents. Since all the documents requested by us were not covered we have requested<br />
to SEBI vide our letter dated June 23, 2015 to provide pending list of documents for inspection.<br />
List of associate companies of Motilal Oswal Securities Limited -Click here to access detailed report<br />
Analyst Certification<br />
The views expressed in this research report accurately reflect the personal views of the analyst(s) about the subject securities or issues, and no part of the compensation of the research analyst(s) was, is, or will be directly or<br />
indirectly related to the specific recommendations and views expressed by research analyst(s) in this report. The research analysts, strategists, or research associates principally responsible for preparation of MOSt research<br />
receive compensation based upon various factors, including quality of research, investor client feedback, stock picking, competitive factors and firm revenues<br />
Disclosure of Interest Statement<br />
JK LAKSHMI CEMENT<br />
• Analyst ownership of the stock No<br />
• Served as an officer, director or employee - No<br />
A graph of daily closing prices of securities is available at www.nseindia.com and http://economictimes.indiatimes.com/markets/stocks/stock-quotes<br />
Regional Disclosures (outside India)<br />
This report is not directed or intended for distribution to or use by any person or entity resident in a state, country or any jurisdiction, where such distribution, publication, availability or use would be contrary to law, regulation or<br />
which would subject MOSt & its group companies to registration or licensing requirements within such jurisdictions.<br />
For Hong Kong: This report is distributed in Hong Kong by Motilal Oswal capital Markets (Hong Kong) Private Limited, a licensed corporation (CE AYY-301) licensed and regulated by the Hong Kong Securities and Futures<br />
Commission (SFC) pursuant to the Securities and Futures Ordinance (Chapter 571 of the Laws of Hong Kong) “SFO”. As per SEBI (Research Analyst Regulations) 2014 Motilal Oswal Securities (SEBI Reg No. INH000000412)<br />
has an agreement with Motilal Oswal capital Markets (Hong Kong) Private Limited for distribution of research report in Kong Kong. This report is intended for distribution only to “Professional Investors” as defined in Part I of<br />
Schedule 1 to SFO. Any investment or investment activity to which this document relates is only available to professional investor and will be engaged only with professional investors.” Nothing here is an offer or solicitation of<br />
these securities, products and services in any jurisdiction where their offer or sale is not qualified or exempt from registration. The Indian Analyst(s) who compile this report is/are not located in Hong Kong & are not conducting<br />
Research Analysis in Hong Kong.<br />
For U.S.<br />
Motilal Oswal Securities Limited (MOSL) is not a registered broker - dealer under the U.S. Securities Exchange Act of 1934, as amended (the"1934 act") and under applicable state laws in the United States. In addition MOSL is<br />
not a registered investment adviser under the U.S. Investment Advisers Act of 1940, as amended (the "Advisers Act" and together with the 1934 Act, the "Acts), and under applicable state laws in the United States. Accordingly, in<br />
the absence of specific exemption under the Acts, any brokerage and investment services provided by MOSL, including the products and services described herein are not available to or intended for U.S. persons.<br />
This report is intended for distribution only to "Major Institutional Investors" as defined by Rule 15a-6(b)(4) of the Exchange Act and interpretations thereof by SEC (henceforth referred to as "major institutional investors"). This<br />
document must not be acted on or relied on by persons who are not major institutional investors. Any investment or investment activity to which this document relates is only available to major institutional investors and will be<br />
engaged in only with major institutional investors. In reliance on the exemption from registration provided by Rule 15a-6 of the U.S. Securities Exchange Act of 1934, as amended (the "Exchange Act") and interpretations thereof by<br />
the U.S. Securities and Exchange Commission ("SEC") in order to conduct business with Institutional Investors based in the U.S., MOSL has entered into a chaperoning agreement with a U.S. registered broker-dealer, Motilal<br />
Oswal Securities International Private Limited. ("MOSIPL"). Any business interaction pursuant to this report will have to be executed within the provisions of this chaperoning agreement.<br />
The Research Analysts contributing to the report may not be registered /qualified as research analyst with FINRA. Such research analyst may not be associated persons of the U.S. registered broker-dealer, MOSIPL, and<br />
therefore, may not be subject to NASD rule 2711 and NYSE Rule 472 restrictions on communication with a subject company, public appearances and trading securities held by a research analyst account.<br />
For Singapore<br />
Motilal Oswal Capital Markets Singapore Pte Limited is acting as an exempt financial advisor under section 23(1)(f) of the Financial Advisers Act(FAA) read with regulation 17(1)(d) of the Financial Advisors Regulations and is a<br />
subsidiary of Motilal Oswal Securities Limited in India. This research is distributed in Singapore by Motilal Oswal Capital Markets Singapore Pte Limited and it is only directed in Singapore to accredited investors, as defined in the<br />
Financial Advisers Regulations and the Securities and Futures Act (Chapter 289), as amended from time to time.<br />
In respect of any matter arising from or in connection with the research you could contact the following representatives of Motilal Oswal Capital Markets Singapore Pte Limited:<br />
Varun Kumar<br />
Kadambari Balachandran<br />
Varun.kumar@motilaloswal.com<br />
kadambari.balachandran@motilaloswal.com<br />
Contact : (+65) 68189232 (+65) 68189233 / 65249115<br />
Office Address:21 (Suite 31),16 Collyer Quay,Singapore 04931<br />
Motilal Oswal Securities Ltd<br />
Motilal Oswal Tower, Level 9, Sayani Road, Prabhadevi, Mumbai 400 025<br />
27 October 2016 Phone: +91 22 3982 5500 E-mail: reports@motilaloswal.com<br />
8