PVR
pH36305Ceuw
pH36305Ceuw

Create successful ePaper yourself
Turn your PDF publications into a flip-book with our unique Google optimized e-Paper software.
BSE SENSEX<br />
S&P CNX<br />
27,916 8,615<br />
Bloomberg<br />
<strong>PVR</strong>L IN<br />
Equity Shares (m) 46.7<br />
M.Cap.(INRb)/(USDb) 57.4/0.9<br />
52-Week Range (INR) 1334/646<br />
1, 6, 12 Rel. Per (%) 2/35/43<br />
Avg Val, INRm/ Vol m 153.4 / 0.2<br />
Free float (%) 74.0<br />
Financials & Valuations (INR b)<br />
Y/E Mar 2016 2017E 2018E<br />
Net Sales 18.7 22.2 27.0<br />
EBITDA 3.3 3.7 5.0<br />
PAT 1.2 1.2 2.0<br />
EPS (INR) 25.5 26.5 42.9<br />
Gr. (%) 664.3 3.9 61.7<br />
BV/Sh (INR) 186.2 210.2 250.2<br />
RoE (%) 18.7 13.4 18.6<br />
RoCE (%) 14.5 11.2 14.8<br />
P/E (x) 47.6 45.8 28.3<br />
P/BV (x) 6.5 5.8 4.9<br />
Estimate change<br />
TP change<br />
Rating change<br />
27 October 2016<br />
Q2FY17 Results Update | Sector: Media<br />
<strong>PVR</strong><br />
CMP: INR1215 TP: INR1392(+15%) Buy<br />
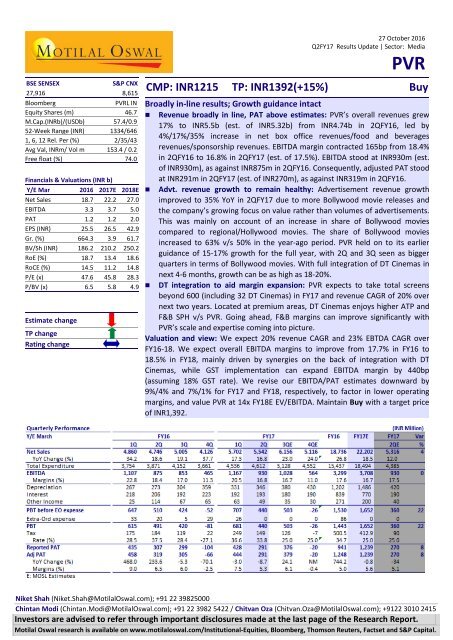
Broadly in-line results; Growth guidance intact<br />
• Revenue broadly in line, PAT above estimates: <strong>PVR</strong>’s overall revenues grew<br />
17% to INR5.5b (est. of INR5.32b) from INR4.74b in 2QFY16, led by<br />
4%/17%/35% increase in net box office revenues/food and beverages<br />
revenues/sponsorship revenues. EBITDA margin contracted 165bp from 18.4%<br />
in 2QFY16 to 16.8% in 2QFY17 (est. of 17.5%). EBITDA stood at INR930m (est.<br />
of INR930m), as against INR875m in 2QFY16. Consequently, adjusted PAT stood<br />
at INR291m in 2QFY17 (est. of INR270m), as against INR319m in 2QFY16.<br />
• Advt. revenue growth to remain healthy: Advertisement revenue growth<br />
improved to 35% YoY in 2QFY17 due to more Bollywood movie releases and<br />
the company’s growing focus on value rather than volumes of advertisements.<br />
This was mainly on account of an increase in share of Bollywood movies<br />
compared to regional/Hollywood movies. The share of Bollywood movies<br />
increased to 63% v/s 50% in the year-ago period. <strong>PVR</strong> held on to its earlier<br />
guidance of 15-17% growth for the full year, with 2Q and 3Q seen as bigger<br />
quarters in terms of Bollywood movies. With full integration of DT Cinemas in<br />
next 4-6 months, growth can be as high as 18-20%.<br />
• DT integration to aid margin expansion: <strong>PVR</strong> expects to take total screens<br />
beyond 600 (including 32 DT Cinemas) in FY17 and revenue CAGR of 20% over<br />
next two years. Located at premium areas, DT Cinemas enjoys higher ATP and<br />
F&B SPH v/s <strong>PVR</strong>. Going ahead, F&B margins can improve significantly with<br />
<strong>PVR</strong>’s scale and expertise coming into picture.<br />
Valuation and view: We expect 20% revenue CAGR and 23% EBTDA CAGR over<br />
FY16-18. We expect overall EBITDA margins to improve from 17.7% in FY16 to<br />
18.5% in FY18, mainly driven by synergies on the back of integration with DT<br />
Cinemas, while GST implementation can expand EBITDA margin by 440bp<br />
(assuming 18% GST rate). We revise our EBITDA/PAT estimates downward by<br />
9%/4% and 7%/1% for FY17 and FY18, respectively, to factor in lower operating<br />
margins, and value <strong>PVR</strong> at 14x FY18E EV/EBITDA. Maintain Buy with a target price<br />
of INR1,392.<br />
Niket Shah (Niket.Shah@MotilalOswal.com); +91 22 39825000<br />
Chintan Modi (Chintan.Modi@MotilalOswal.com); +91 22 3982 5422 / Chitvan Oza (Chitvan.Oza@MotilalOswal.com); +9122 3010 2415<br />
Investors are advised to refer through important disclosures made at the last page of the Research Report.<br />
Motilal Oswal research is available on www.motilaloswal.com/Institutional-Equities, Bloomberg, Thomson Reuters, Factset and S&P Capital.
<strong>PVR</strong> Ltd<br />
Revenue broadly inline, PAT above estimates<br />
• <strong>PVR</strong> reported overall revenue of INR5.5b (est. INR5.32b) as against INR4.74b in<br />
2QFY16 marking a YoY growth of 17%.<br />
• EBITDA margins declined 165bp YoY from 18.4% in 2QFY16 to 16.8% in 2QFY17<br />
(est. 17.5%). EBITDA stood at INR930 (est. INR930m) as against INR875m in<br />
2QFY16.<br />
• Other income came in at INR49m in 2QFY17 against INR114m in 2QFY16.<br />
• Depreciation was lower at INR346m compared to our expectations of INR420m.<br />
• Consequently, adjusted PAT stood at INR291m in 2QFY17 (est. INR270m) as<br />
against INR319m in 2QFY16.<br />
• Top 5 movies contributed 46% to gross Box office I n 2QFY17 compared to 51%<br />
YoY, occupancy of top 5 movies stood at 40% vs 50% YoY.<br />
• Occupancy rate has declined from 37.1% to 32.1% in 2QFY17 YoY while footfalls<br />
have declined by 2% to 18.5m.<br />
Exhibit 1: Revenue trend<br />
Revenue (INR m) YoY growth (%)<br />
34<br />
38<br />
25<br />
19 19 17 17<br />
8 9 2,996<br />
-5<br />
3,623 4,002 4,203 4,860 4,746 5,005 4,126 5,702 5,542<br />
Exhibit 2: EBITDA trend<br />
EBITDA (INR m) Margin (%)<br />
23<br />
20<br />
20<br />
18<br />
17<br />
17<br />
15 15<br />
11<br />
1,107 1,167<br />
831 4 875 853 930<br />
547 586<br />
108<br />
465<br />
Q1FY15<br />
Q2FY15<br />
Q3FY15<br />
Q4FY15<br />
Q1FY16<br />
Q2FY16<br />
Q3FY16<br />
Q4FY16<br />
Q1FY17<br />
Q2FY17<br />
Q1FY15<br />
Q2FY15<br />
Q3FY15<br />
Q4FY15<br />
Q1FY16<br />
Q2FY16<br />
Q3FY16<br />
Q4FY16<br />
Q1FY17<br />
Q2FY17<br />
Source: MOSL, Company<br />
Source: MOSL, Company<br />
Exhibit 3: Property additions<br />
85 97 101102102 105106107109114 120121<br />
26 30 33 39<br />
Exhibit 4: Screens additions<br />
Number of screens<br />
351 421444 454 454467474477491 524551 557<br />
108123142 166<br />
FY09<br />
FY10<br />
FY11<br />
FY12<br />
FY13<br />
FY14<br />
1QFY15<br />
2QFY15<br />
3QFY15<br />
4QFY15<br />
Q1FY16<br />
Q2FY16<br />
Q3FY16<br />
Q4FY16<br />
Q1FY17<br />
Q2FY17<br />
FY09<br />
FY10<br />
FY11<br />
FY12<br />
FY13<br />
FY14<br />
1QFY15<br />
2QFY15<br />
3QFY15<br />
4QFY15<br />
Q1FY16<br />
Q2FY16<br />
Q3FY16<br />
Q4FY16<br />
Q1FY17<br />
Q2FY17<br />
Source: MOSL, Company<br />
Source: MOSL, Company<br />
27 October 2016 2
<strong>PVR</strong> Ltd<br />
Exhibit 5: Seats additions<br />
Number of seats<br />
Exhibit 6: Quarterly footfall trend<br />
Total patrons during the year (mn)<br />
FY09<br />
FY10<br />
FY11<br />
FY12<br />
FY13<br />
FY14<br />
1QFY15<br />
2QFY15<br />
3QFY15<br />
4QFY15<br />
Q1FY16<br />
Q2FY16<br />
Q3FY16<br />
Q4FY16<br />
Q1FY17<br />
Q2FY17<br />
FY08<br />
FY09<br />
FY10<br />
FY11<br />
FY12<br />
FY13<br />
FY14<br />
1QFY15<br />
2QFY15<br />
3QFY15<br />
4QFY15<br />
Q1FY16<br />
Q2FY16<br />
Q3FY16<br />
Q4FY16<br />
Q1FY17<br />
Q2FY17<br />
27,886<br />
32,232<br />
36,877<br />
42,252<br />
87,493<br />
101,095<br />
105,668<br />
107,809<br />
107,292<br />
110,524<br />
111,278<br />
112,499<br />
114,634<br />
119,673<br />
126,377<br />
127,520<br />
22.0<br />
25.3<br />
27.0<br />
31.1<br />
41.3<br />
54.9<br />
59.9<br />
15.2<br />
15.7<br />
16.0<br />
12.2<br />
19.0<br />
18.8<br />
16.5<br />
15.3<br />
20.7<br />
18.5<br />
Source: MOSL, Company<br />
Source: MOSL, Company<br />
Advertisement revenue growth to remain healthy<br />
• Advertisement revenue growth improved 35% for 2QFY17 YoY due to more<br />
Bollywood movies as well as <strong>PVR</strong>’s growing focus on value compared to more<br />
volume of advertisements.<br />
• This was mainly on account of increase in share of Bollywood movies compared<br />
to regional and Hollywood movies.<br />
• The share of Bollywood movies increased to 63% vs 50% YoY for 2QFY17.<br />
• <strong>PVR</strong> held on its earlier guidance of 15-17% growth for full year as 2Q and 3Q are<br />
seen to be bigger quarters in terms of Bollywood movies.<br />
• With full integration of DT cinemas in next 4-6 months, the growth can be as<br />
high as 18-20%.<br />
Exhibit 7: ATP continues to be robust<br />
Exhibit 8: SPH going strong<br />
ATP (INR)<br />
169 169 175 176 181 185 183 187 200 182<br />
195 202<br />
160 168<br />
54 54 54 56<br />
SPH (INR)<br />
74<br />
63 63 67<br />
62<br />
68<br />
74 72<br />
78<br />
84<br />
Q1FY14<br />
Q2FY14<br />
Q3FY14<br />
Q4FY14<br />
Q1FY15<br />
Q2FY15<br />
Q3FY15<br />
Q4FY15<br />
Q1FY16<br />
Q2FY16<br />
Q3FY16<br />
Q4FY16<br />
Q1FY17<br />
Q2FY17<br />
Q1FY14<br />
Q2FY14<br />
Q3FY14<br />
Q4FY14<br />
Q1FY15<br />
Q2FY15<br />
Q3FY15<br />
Q4FY15<br />
Q1FY16<br />
Q2FY16<br />
Q3FY16<br />
Q4FY16<br />
Q1FY17<br />
Q2FY17<br />
Source: MOSL, Company<br />
Source: MOSL, Company<br />
Exhibit 9: Snapshot of key matrices<br />
Consolidated 2QFY17 2QFY16 Change % 1QFY17 Change %<br />
Location 121 107 13.1% 120 0.8%<br />
Screens 557 477 16.8% 551 1.1%<br />
Seats 127,520 112,499 13.4% 126,377 0.9%<br />
Footfalls (m) 18.5 18.8 -1.6% 20.7 -10.6%<br />
ATP 202 187 8.0% 195 3.6%<br />
SPH 84 68 23.5% 78 7.7%<br />
Source: Company, MOSL<br />
27 October 2016 3
<strong>PVR</strong> Ltd<br />
Exhibit 10: Consolidated revenue break up (INR m)<br />
Particulars 2QFY17 2QFY16 Change % 1QFY17 Change %<br />
Ticket sales 2,781 2,662 4.5% 3,056 -9.0%<br />
Sale of Food and beverages 1,396 1,196 16.8% 1,475 -5.3%<br />
Advertisement and royalty income 624 461 35.3% 515 21.2%<br />
Source: Company, MOSL<br />
Guidance intact for full year, DT integration to aid margin expansion<br />
• <strong>PVR</strong> expects to take total screens beyond 600 (including 32 DT cinemas) in FY17<br />
and revenue CAGR of 20% over next two years.<br />
• DT cinemas being located in premium location enjoys higher ATP and F&B SPH<br />
vs <strong>PVR</strong>.<br />
• Going ahead F&B margins can improve significantly with <strong>PVR</strong>’s scale and<br />
expertise coming into picture.<br />
Conference call takeaways<br />
• Advertisement spends: Advertisements mainly depends on perception of films.<br />
<strong>PVR</strong> has contracts with some clients where advertisement revenues are linked<br />
to footfalls; though majority contracts mainly work on star power of the movie.<br />
<strong>PVR</strong> is more focused on value from advertisement rather than volume to not<br />
disrupt the consumer experience. It charges a blockbuster premium for all the<br />
bigger films (to the extent of 75%-100%).<br />
• High Advertisement revenue: 2QFY17 had very little regional content and more<br />
of Bollywood films due to which ATP has increased YoY. The mix of<br />
Bollywood/Hollywood/Regional movies stood at 63%/15%/22% in 2QFY17,<br />
compared to 50%/16%/34% in 2QFY17 due to which ATP has increased.<br />
• F&B: Revenues increased by 17% YoY for 2QFY17 wherein ~60% of growth was<br />
attributable to value increase due to price rise while 40% to volume increase.<br />
The management believes double digit growth is possible for next few years and<br />
intends to increase SPH as a % of current ATP from ~40% to 50% going ahead.<br />
• Premium/ Luxury segment: Some premium customers look for luxury and<br />
experience in a theatre; <strong>PVR</strong> has ~30 screens having 30-100 seat capacity to<br />
cater to this segment. Currently, it accounts for 6% of screens which it intends<br />
to grow to 10% going ahead.<br />
• DT Cinemas: DT cinemas being located in premium location enjoys higher ATP<br />
and F&B SPH vs <strong>PVR</strong>. Currently, it contributes to less than 10% of revenues. Few<br />
screens remained closed during the quarter while some have been renovated to<br />
capture footfalls for Diwali. Synergies will continue to increase with <strong>PVR</strong> mainly<br />
from FY18.<br />
• Competition: All competitors (Inox, Cinepolis, Carnival) are aggressively eyeing<br />
screens and bidding for similar properties due to which rental cost may get<br />
impacted in long run.<br />
• Interest rate: 10.25% is average blended interest cost at the company level.<br />
• Outlook: <strong>PVR</strong> is targeting to open 58 new screens instead of 65 by end of FY17.<br />
With more movies lined up for 2HFY17, the management expects a better<br />
2HFY17 growth compared to 1HFY17.The management expects to take total<br />
screens beyond 600 (including 32 DT cinemas) in FY17 and has guided for a<br />
revenue CAGR of 20% over next two years.<br />
27 October 2016 4
<strong>PVR</strong> Ltd<br />
Valuations and view: Maintain ‘Buy’<br />
We value <strong>PVR</strong>L at 14x FY18E EV/EBITDA with a target price of INR1,392 justified by:<br />
• Continued leadership in film exhibition business in India.<br />
• Significant screen additions in the pipeline.<br />
• Strong content outlook going forward.<br />
• GST rollout which can result in 400-500bp margin expansion.<br />
We believe the following factors pose risks to our assumptions:<br />
• Weaker content which can reduce footfall growth.<br />
• Slower than expected roll out of GST which can delay margin expansion.<br />
• Escalating rental costs which can put pressure on margins.<br />
• Continued price controls by state governments in several states like TN and AP.<br />
Exhibit 11: Target Price Methodology<br />
Valuations (INR m)<br />
EBITDA- FY18E 4,988<br />
Target Multiple 14.0<br />
Target Enterprise Value 69,833<br />
Net Debt 4,858<br />
Target Market cap 64,975<br />
No of shares 46.7<br />
Value per share 1,392<br />
Source: MOSL<br />
27 October 2016 5
<strong>PVR</strong> Ltd<br />
Story in charts<br />
Exhibit 12: India has the lowest screen density<br />
Screen / mn population<br />
125<br />
Exhibit 13: Multiplex penetration still quite low<br />
Single Screen<br />
Multiplexes<br />
8<br />
31<br />
38 43 45 46<br />
52 53<br />
61<br />
77<br />
888 960<br />
1104 1400 1700<br />
8700 8600 8100 7700 7700<br />
India<br />
China<br />
UK<br />
Belgium<br />
Germany<br />
Spain<br />
Italy<br />
Ireland<br />
Denmark<br />
France<br />
US<br />
2010 2011 2012 2013 2014<br />
Source: MOSL, Company<br />
Source: MOSL, Company<br />
Exhibit 14: <strong>PVR</strong> is India’s largest multiplex chain<br />
Exhibit 15: <strong>PVR</strong> – most aggressive screen additions<br />
421<br />
348<br />
No of screens (FY14 end)<br />
259<br />
84 82<br />
29<br />
166<br />
351<br />
Number of screens<br />
516<br />
464<br />
421<br />
603<br />
658<br />
<strong>PVR</strong>+<br />
Inox+<br />
Big<br />
Cinemas<br />
Cinepolis<br />
Fun<br />
Cinemas<br />
DT<br />
Cinemas<br />
FY12 FY13 FY14 FY15 FY16 FY17E FY18E<br />
Source: MOSL, Company<br />
Source: MOSL, Company<br />
Exhibit 16: RoCE to improve significantly<br />
Exhibit 17: Free cash to improve significantly<br />
RoCE (%)<br />
14.5<br />
14.8<br />
Free cash flow (INR m)<br />
3,106<br />
8.5<br />
10.9 10.7<br />
8.0<br />
11.2<br />
859<br />
680<br />
FY12 FY13 FY14 FY15 FY16E FY17E FY18E<br />
Source: MOSL, Company<br />
-153<br />
-384<br />
-841<br />
-68<br />
-2,306<br />
FY11 FY12 FY13 FY14 FY15 FY16E FY17E FY18E<br />
Source: MOSL, Company<br />
27 October 2016 6
<strong>PVR</strong> Ltd<br />
Exhibit 18: Upcoming Content<br />
Exhibit 19: Upcoming Content<br />
27 October 2016 7
<strong>PVR</strong> Ltd<br />
Exhibit 20: Upcoming Content<br />
Source: MOSL, Company<br />
Exhibit 21: Upcoming Content<br />
Source: MOSL, Company<br />
27 October 2016 8
<strong>PVR</strong> Ltd<br />
Exhibit 22: Upcoming Content<br />
Source: MOSL, Company<br />
Exhibit 23: Upcoming Content<br />
Source: MOSL, Company<br />
27 October 2016 9
<strong>PVR</strong> Ltd<br />
Key operating metrics<br />
Operating matrices Q3FY15 Q4FY15 1QFY16 2QFY16 3QFY16 4QFY16 1QFY17 2QFY17<br />
Location 102 105 106 107 109 114 120 121<br />
Screens 454 467 474 477 491 524 551 557<br />
Screens additions during the quarter 0 13 7 3 14 33 27 6<br />
Seats 107,292 110,524 111,278 112,499 114,634 119,673 126,377 127,520<br />
Footfalls (m) 16.0 12.2 19.0 18.8 16.5 15.3 20.7 18.5<br />
ATP (INR) 185 168 183 187 200 182 195 202<br />
SPH (INR) 67 62 74 68 74 72 78 84<br />
Consolidated revenues (INR mn) Q3FY15 Q4FY15 1QFY16 2QFY16 3QFY16 4QFY16 1QFY17 2QFY17<br />
Ticket sales (INR m) 2,307 1,579 2,667 2,662 2,512 2,144 3,056 2,781<br />
Sale of Food and beverages (INR m) 1,006 692 1,298 1,196 1,136 1,037 1,475 1,396<br />
Advertisement and royalty income (INR<br />
m) 539 381 457 461 693 455 515 624<br />
Other income 123.5 83.3 224 201 209 234 379 326<br />
Total revenues (INR mn) 3,975 2,735 4,645 4,520 4,550 3,869 5,425 5,127<br />
Revenue mix Q3FY15 Q4FY15 1QFY16 2QFY16 3QFY16 4QFY16 1QFY17 2QFY17<br />
Ticket sales 58% 58% 57% 59% 55% 55% 56% 54%<br />
Sale of Food and beverages 25% 25% 28% 26% 25% 27% 27% 27%<br />
Advertisement and royalty income 14% 14% 10% 10% 15% 12% 9% 12%<br />
Other income 3% 3% 5% 4% 5% 6% 7% 6%<br />
Total revenues 100% 100% 100% 100% 100% 100% 100% 100%<br />
Key Assumptions FY14 FY15 FY16 FY17E FY18E<br />
Number of Screens 421 464 516 603 658<br />
Screen additions 70 43 52 55 55<br />
Number of seats 101,095 110,524 119,673 137,540 148,815<br />
Occupancy rate 31% 30% 35% 33% 35%<br />
Number of shows per day 5.4 5.0 5.0 5.1 5.1<br />
Total footfalls (m) 60 59 64 73 84<br />
Average ticket price (INR) 168 177 188 201 217<br />
ATP growth (YoY) 3% 5% 6% 7% 8%<br />
Spend per head (INR) 54 64 72 83 96<br />
SPH growth (YoY) 15% 19% 13% 15% 16%<br />
Ad revenue per screen (NR/m) 3.7 3.8 4.2 4.7 5.2<br />
27 October 2016 10
<strong>PVR</strong> Ltd<br />
Financials and Valuations<br />
Consolidated - Income Statement<br />
(INR Million)<br />
Y/E March FY14 FY15 FY16 FY17E FY18E<br />
Net Sales 13,475 14,771 18,688 22,202 26,963<br />
Change (%) 67.3 9.6 26.5 18.8 21.4<br />
EBITDA 2,117 2,008 3,299 3,708 4,988<br />
Margin (%) 15.7 13.6 17.7 16.7 18.5<br />
Depreciation 944 1,168 1,252 1,486 1,796<br />
EBIT 1,173 840 2,047 2,222 3,193<br />
Int. and Finance Charges 795 783 839 770 701<br />
Other Income - Rec. 113 89 283 200 180<br />
PBT bef. EO Exp. 491 146 1,491 1,652 2,671<br />
EO Expense/(Income) 32 -22 67 0 0<br />
PBT after EO Exp. 523 125 1,425 1,652 2,671<br />
Current Tax 140 2 232 413 668<br />
Deferred Tax -121 6 0 0 0<br />
Tax Rate (%) 3.7 6.5 16.3 25.0 25.0<br />
Less: Minority Interest 57 11 0.0 0.0 0.0<br />
Reported PAT 560 128 1,193 1,239 2,003<br />
PAT Adj for EO items 530 148 1,248 1,239 2,003<br />
Change (%) 14.5 -72.1 744 -0.8 61.7<br />
Margin (%) 3.9 1.0 6.7 5.6 7.4<br />
Consolidated - Balance Sheet<br />
(INR Million)<br />
Y/E March FY14 FY15 FY16 FY17E FY18E<br />
Equity Share Capital 411 415 467 467 467<br />
Total Reserves 3,582 3,677 8,228 9,347 11,215<br />
Net Worth 3,993 4,092 8,695 9,814 11,682<br />
Minority Interest 771 383 401 401 401<br />
Deferred Liabilities 4 11 93 93 93<br />
Total Loans 6,133 7,470 6,623 7,373 5,373<br />
Capital Employed 10,902 11,956 15,812 17,682 17,550<br />
Gross Block 11,889 13,356 16,639 22,469 24,169<br />
Less: Accum. Deprn. 3,723 4,784 6,036 7,522 9,317<br />
Intangible assets- Goodwill 31 31 52 52 52<br />
Net Fixed Assets 8,197 8,604 10,655 14,999 14,903<br />
Capital WIP 806 611 0 222 270<br />
Total Investments 235 19 2,446 0 0<br />
Curr. Assets, Loans&Adv. 4,294 5,055 6,007 6,245 6,995<br />
Inventory 106 126 205 136 163<br />
Account Receivables 523 767 901 973 1,182<br />
Cash and Bank Balance 273 267 244 245 515<br />
Loans and Advances 3,392 3,895 4,658 4,890 5,135<br />
Curr. Liability & Prov. 2,631 2,333 3,296 3,784 4,618<br />
Account Payables 2,392 2,161 3,051 3,527 4,307<br />
Provisions 239 172 245 257 311<br />
Net Current Assets 1,663 2,723 2,711 2,461 2,377<br />
Appl. of Funds 10,902 11,955 15,812 17,682 17,550<br />
27 October 2016 11
<strong>PVR</strong> Ltd<br />
Financials and Valuations<br />
Ratios<br />
Y/E March FY14 FY15 FY16 FY17E FY18E<br />
Basic (INR)<br />
EPS 15.0 3.3 25.5 26.5 42.9<br />
Cash EPS 35.8 31.7 53.6 58.4 81.4<br />
BV/Share 97.1 98.5 186.2 210.2 250.2<br />
DPS 4.0 1.6 3.1 4.0 4.5<br />
Payout (%) 21.5 39.5 7.7 9.6 6.8<br />
Valuation (x)<br />
P/E 81.0 363.5 47.6 45.8 28.3<br />
Cash P/E 33.9 38.3 22.7 20.8 14.9<br />
P/BV 12.5 12.3 6.5 5.8 4.9<br />
EV/Sales 4.7 4.4 3.4 2.9 2.3<br />
EV/EBITDA 29.9 32.2 19.3 17.4 12.5<br />
Dividend Yield (%) 0.3 0.1 0.3 0.3 0.4<br />
Return Ratios (%)<br />
RoE 11.8 3.4 18.7 13.4 18.6<br />
RoCE 10.7 8.0 14.5 11.2 14.8<br />
RoIC 10.7 7.6 14.2 11.0 14.1<br />
Working Capital Ratios<br />
Asset Turnover (x) 1.2 1.2 1.2 1.3 1.5<br />
Inventory (Days) 3 3 4 2 2<br />
Debtor (Days) 14 19 18 14 14<br />
Creditor (Days) 65 53 60 58 58<br />
Working Capital Turnover (Days) 38 61 48 36 25<br />
Leverage Ratio (x)<br />
Current Ratio 1.6 2.2 1.8 1.7 1.5<br />
Debt/Equity 1.5 1.8 0.8 0.8 0.5<br />
Consolidated - Cash Flow Statement<br />
Y/E March FY14 FY15 FY16 FY17E FY18E<br />
Net Profit / (Loss) Before Tax / EO 523 125 1,425 1,652 2,671<br />
Depreciation 944 1,168 1,252 1,486 1,796<br />
Interest & Finance Charges 743 783 839 770 701<br />
Direct Taxes Paid -154 -69 -232 -413 -668<br />
(Inc)/Dec in WC 91 -863 -12 252 354<br />
CF from Operations 2,147 1,144 3,272 3,746 4,854<br />
EO Expense -15 163 81 0 0<br />
CF from Operating incl EO 2,132 1,307 3,353 3,746 4,854<br />
(inc)/dec in FA -1,273 -1,691 -2,672 -6,052 -1,748<br />
(Pur)/Sale of Investments 193 -131 -2,427 2,446 0<br />
Others 14 14 0 0 0<br />
CF from Investments -1,065 -1,808 -5,099 -3,606 -1,748<br />
Issue of Shares 121 100 3,502 0 0<br />
(Inc)/Dec in Debt -434 1,337 -847 750 -2,000<br />
Interest Paid -812 -827 -839 -770 -701<br />
Dividend Paid -46 -122 -92 -119 -135<br />
Others 9 8 0 0 0<br />
CF from Fin. Activity -1,162 496 1,724 -139 -2,836<br />
Inc/Dec of Cash -95 -6 -23 2 270<br />
Add: Beginning Balance 368 272 267 243 245<br />
Closing Balance 272 267 243 245 515<br />
27 October 2016 12
<strong>PVR</strong> Ltd<br />
Corporate profile<br />
•<br />
Company description<br />
<strong>PVR</strong>, a pioneer in multiplex development in India, is<br />
the largest cinema exhibition player in the country<br />
today. Post the acquisition of Cinemax, <strong>PVR</strong> has<br />
become India’s largest multiplex chain with 102<br />
properties, 454 screens and 108k seats. Being the<br />
only player that is still expanding aggressively, it is<br />
further extending its leadership.<br />
Exhibit 1: Sensex rebased<br />
Source: MOSL/Bloomberg<br />
Exhibit 2: Shareholding pattern (%)<br />
Sep-16 Jun-16 Sep-15<br />
Promoter 25.3 25.3 26.3<br />
DII 28.8 29.6 14.0<br />
FII 32.6 30.6 25.4<br />
Others 13.4 14.5 34.3<br />
Note: FII Includes depository receipts Source: Capitaline<br />
Exhibit 3: Top holders<br />
Holder Name<br />
% Holding<br />
Plenty Private Equity I Fund Ltd 8.9<br />
Reliance Capital Trustee Co Ltd A/c Reliance<br />
Equity Opportunities Fund 8.7<br />
Multiples Private Equity I Fund Ltd 6.3<br />
Major Cineplex Group Public Company Ltd 4.0<br />
Baron Emerging Markets Fund 3.2<br />
Source: Capitaline<br />
Exhibit 4: Top management<br />
Name<br />
Ajay Bijli<br />
Sanjeev Kumar<br />
N C Gutpa<br />
Designation<br />
Chairman & Managing<br />
Director<br />
Joint Managing<br />
Director<br />
Company Secretary<br />
Exhibit 5: Directors<br />
Name<br />
Amit Burman<br />
Sanjai Vohra<br />
Vicha Poolvaraluk<br />
Sanjay Kapoor<br />
Name<br />
Renuka Ramnath<br />
Sanjay Khanna<br />
Vikram Bakshi<br />
*Independent<br />
Source: Capitaline<br />
Exhibit 6: Auditors<br />
Name<br />
KPMG<br />
S R Batliboi & Co LLP<br />
Type<br />
Internal<br />
Statutory<br />
Exhibit 7: MOSL forecast v/s consensus<br />
EPS<br />
MOSL Consensus<br />
(INR) forecast forecast<br />
Variation (%)<br />
FY17 26.5 29.8 -11.0<br />
FY18 42.9 40.5 6.1<br />
Source: Capitaline<br />
Source: Bloomberg<br />
27 October 2016 13
Disclosures<br />
<strong>PVR</strong> Ltd<br />
This document has been prepared by Motilal Oswal Securities Limited (hereinafter referred to as Most) to provide information about the company (ies) and/sector(s), if any, covered in the report and may be distributed by it and/or its<br />
affiliated company(ies). This report is for personal information of the selected recipient/s and does not construe to be any investment, legal or taxation advice to you. This research report does not constitute an offer, invitation or<br />
inducement to invest in securities or other investments and Motilal Oswal Securities Limited (hereinafter referred as MOSt) is not soliciting any action based upon it. This report is not for public distribution and has been furnished to<br />
you solely for your general information and should not be reproduced or redistributed to any other person in any form. This report does not constitute a personal recommendation or take into account the particular investment<br />
objectives, financial situations, or needs of individual clients. Before acting on any advice or recommendation in this material, investors should consider whether it is suitable for their particular circumstances and, if necessary, seek<br />
professional advice. The price and value of the investments referred to in this material and the income from N them O may T E go down S as well as up, and investors may realize losses on any investments. Past performance is not a guide for<br />
future performance, future returns are not guaranteed and a loss of original capital may occur.<br />
MOSt and its affiliates are a full-service, integrated investment banking, investment management, brokerage and financing group. We and our affiliates have investment banking and other business relationships with a some<br />
companies covered by our Research Department. Our research professionals may provide input into our investment banking and other business selection processes. Investors should assume that MOSt and/or its affiliates are<br />
seeking or will seek investment banking or other business from the company or companies that are the subject of this material and that the research professionals who were involved in preparing this material may educate investors<br />
on investments in such business . The research professionals responsible for the preparation of this document may interact with trading desk personnel, sales personnel and other parties for the purpose of gathering, applying and<br />
interpreting information. Our research professionals are paid on twin parameters of performance & profitability of MOSt.<br />
MOSt generally prohibits its analysts, persons reporting to analysts, and members of their households from maintaining a financial interest in the securities or derivatives of any companies that the analysts cover. Additionally, MOSt<br />
generally prohibits its analysts and persons reporting to analysts from serving as an officer, director, or advisory board member of any companies that the analysts cover. Our salespeople, traders, and other professionals or affiliates<br />
may provide oral or written market commentary or trading strategies to our clients that reflect opinions that are contrary to the opinions expressed herein, and our proprietary trading and investing businesses may make investment<br />
decisions that are inconsistent with the recommendations expressed herein. In reviewing these materials, you should be aware that any or all of the foregoing among other things, may give rise to real or potential conflicts of interest.<br />
MOSt and its affiliated company(ies), their directors and employees and their relatives may; (a) from time to time, have a long or short position in, act as principal in, and buy or sell the securities or derivatives thereof of companies<br />
mentioned herein. (b) be engaged in any other transaction involving such securities and earn brokerage or other compensation or act as a market maker in the financial instruments of the company(ies) discussed herein or act as an<br />
advisor or lender/borrower to such company(ies) or may have any other potential conflict of interests with respect to any recommendation and other related information and opinions.; however the same shall have no bearing<br />
whatsoever on the specific recommendations made by the analyst(s), as the recommendations made by the analyst(s) are completely independent of the views of the affiliates of MOSt even though there might exist an inherent<br />
conflict of interest in some of the stocks mentioned in the research report Reports based on technical and derivative analysis center on studying charts company's price movement, outstanding positions and trading volume, as<br />
opposed to focusing on a company's fundamentals and, as such, may not match with a report on a company's fundamental analysis. In addition MOST has different business segments / Divisions with independent research<br />
separated by Chinese walls catering to different set of customers having various objectives, risk profiles, investment horizon, etc, and therefore may at times have different contrary views on stocks sectors and markets.<br />
Unauthorized disclosure, use, dissemination or copying (either whole or partial) of this information, is prohibited. The person accessing this information specifically agrees to exempt MOSt or any of its affiliates or employees from,<br />
any and all responsibility/liability arising from such misuse and agrees not to hold MOSt or any of its affiliates or employees responsible for any such misuse and further agrees to hold MOSt or any of its affiliates or employees free<br />
and harmless from all losses, costs, damages, expenses that may be suffered by the person accessing this information due to any errors and delays. The information contained herein is based on publicly available data or other<br />
sources believed to be reliable. Any statements contained in this report attributed to a third party represent MOSt’s interpretation of the data, information and/or opinions provided by that third party either publicly or through a<br />
subscription service, and such use and interpretation have not been reviewed by the third party. This Report is not intended to be a complete statement or summary of the securities, markets or developments referred to in the<br />
document. While we would endeavor to update the information herein on reasonable basis, MOSt and/or its affiliates are under no obligation to update the information. Also there may be regulatory, compliance, or other reasons that<br />
may prevent MOSt and/or its affiliates from doing so. MOSt or any of its affiliates or employees shall not be in any way responsible and liable for any loss or damage that may arise to any person from any inadvertent error in the<br />
information contained in this report. MOSt or any of its affiliates or employees do not provide, at any time, any express or implied warranty of any kind, regarding any matter pertaining to this report, including without limitation the<br />
implied warranties of merchantability, fitness for a particular purpose, and non-infringement. The recipients of this report should rely on their own investigations.<br />
This report is intended for distribution to institutional investors. Recipients who are not institutional investors should seek advice of their independent financial advisor prior to taking any investment decision based on this report or for<br />
any necessary explanation of its contents.<br />
Most and it’s associates may have managed or co-managed public offering of securities, may have received compensation for investment banking or merchant banking or brokerage services, may have received any compensation<br />
for products or services other than investment banking or merchant banking or brokerage services from the subject company in the past 12 months.<br />
Most and it’s associates have not received any compensation or other benefits from the subject company or third party in connection with the research report.<br />
Subject Company may have been a client of Most or its associates during twelve months preceding the date of distribution of the research report<br />
MOSt and/or its affiliates and/or employees may have interests/positions, financial or otherwise of over 1 % at the end of the month immediately preceding the date of publication of the research in the securities mentioned in this<br />
report. To enhance transparency, MOSt has incorporated a Disclosure of Interest Statement in this document. This should, however, not be treated as endorsement of the views expressed in the report.<br />
Motilal Oswal Securities Limited is registered as a Research Analyst under SEBI (Research Analyst) Regulations, 2014. SEBI Reg. No. INH000000412<br />
Pending Regulatory inspections against Motilal Oswal Securities Limited:<br />
SEBI pursuant to a complaint from client Shri C.R. Mohanraj alleging unauthorized trading, issued a letter dated 29th April 2014 to MOSL notifying appointment of an Adjudicating Officer as per SEBI regulations to hold inquiry and<br />
adjudge violation of SEBI Regulations; MOSL replied to the Show Cause Notice whereby SEBI granted us an opportunity of Inspection of Documents. Since all the documents requested by us were not covered we have requested to<br />
SEBI vide our letter dated June 23, 2015 to provide pending list of documents for inspection.<br />
List of associate companies of Motilal Oswal Securities Limited -Click here to access detailed report<br />
Analyst Certification<br />
The views expressed in this research report accurately reflect the personal views of the analyst(s) about the subject securities or issues, and no part of the compensation of the research analyst(s) was, is, or will be directly or<br />
indirectly related to the specific recommendations and views expressed by research analyst(s) in this report. The research analysts, strategists, or research associates principally responsible for preparation of MOSt research receive<br />
compensation based upon various factors, including quality of research, investor client feedback, stock picking, competitive factors and firm revenues<br />
Disclosure of Interest Statement<br />
<strong>PVR</strong><br />
• Analyst ownership of the stock No<br />
• Served as an officer, director or employee No<br />
A graph of daily closing prices of securities is available at www.nseindia.com and http://economictimes.indiatimes.com/markets/stocks/stock-quotes<br />
Regional Disclosures (outside India)<br />
This report is not directed or intended for distribution to or use by any person or entity resident in a state, country or any jurisdiction, where such distribution, publication, availability or use would be contrary to law, regulation or which<br />
would subject MOSt & its group companies to registration or licensing requirements within such jurisdictions.<br />
For Hong Kong: This report is distributed in Hong Kong by Motilal Oswal capital Markets (Hong Kong) Private Limited, a licensed corporation (CE AYY-301) licensed and regulated by the Hong Kong Securities and Futures<br />
Commission (SFC) pursuant to the Securities and Futures Ordinance (Chapter 571 of the Laws of Hong Kong) “SFO”. As per SEBI (Research Analyst Regulations) 2014 Motilal Oswal Securities (SEBI Reg No. INH000000412) has<br />
an agreement with Motilal Oswal capital Markets (Hong Kong) Private Limited for distribution of research report in Kong Kong. This report is intended for distribution only to “Professional Investors” as defined in Part I of Schedule 1 to<br />
SFO. Any investment or investment activity to which this document relates is only available to professional investor and will be engaged only with professional investors.” Nothing here is an offer or solicitation of these securities,<br />
products and services in any jurisdiction where their offer or sale is not qualified or exempt from registration. The Indian Analyst(s) who compile this report is/are not located in Hong Kong & are not conducting Research Analysis in<br />
Hong Kong.<br />
For U.S<br />
Motilal Oswal Securities Limited (MOSL) is not a registered broker - dealer under the U.S. Securities Exchange Act of 1934, as amended (the"1934 act") and under applicable state laws in the United States. In addition MOSL is not a<br />
registered investment adviser under the U.S. Investment Advisers Act of 1940, as amended (the "Advisers Act" and together with the 1934 Act, the "Acts), and under applicable state laws in the United States. Accordingly, in the<br />
absence of specific exemption under the Acts, any brokerage and investment services provided by MOSL, including the products and services described herein are not available to or intended for U.S. persons.<br />
This report is intended for distribution only to "Major Institutional Investors" as defined by Rule 15a-6(b)(4) of the Exchange Act and interpretations thereof by SEC (henceforth referred to as "major institutional investors"). This<br />
document must not be acted on or relied on by persons who are not major institutional investors. Any investment or investment activity to which this document relates is only available to major institutional investors and will be<br />
engaged in only with major institutional investors. In reliance on the exemption from registration provided by Rule 15a-6 of the U.S. Securities Exchange Act of 1934, as amended (the "Exchange Act") and interpretations thereof by<br />
the U.S. Securities and Exchange Commission ("SEC") in order to conduct business with Institutional Investors based in the U.S., MOSL has entered into a chaperoning agreement with a U.S. registered broker-dealer, Motilal Oswal<br />
Securities International Private Limited. ("MOSIPL"). Any business interaction pursuant to this report will have to be executed within the provisions of this chaperoning agreement.<br />
The Research Analysts contributing to the report may not be registered /qualified as research analyst with FINRA. Such research analyst may not be associated persons of the U.S. registered broker-dealer, MOSIPL, and therefore,<br />
may not be subject to NASD rule 2711 and NYSE Rule 472 restrictions on communication with a subject company, public appearances and trading securities held by a research analyst account.<br />
For Singapore<br />
Motilal Oswal Capital Markets Singapore Pte Limited is acting as an exempt financial advisor under section 23(1)(f) of the Financial Advisers Act(FAA) read with regulation 17(1)(d) of the Financial Advisors Regulations and is a<br />
subsidiary of Motilal Oswal Securities Limited in India. This research is distributed in Singapore by Motilal Oswal Capital Markets Singapore Pte Limited and it is only directed in Singapore to accredited investors, as defined in the<br />
Financial Advisers Regulations and the Securities and Futures Act (Chapter 289), as amended from time to time.<br />
In respect of any matter arising from or in connection with the research you could contact the following representatives of Motilal Oswal Capital Markets Singapore Pte Limited:<br />
Varun Kumar<br />
Kadambari Balachandran<br />
Varun.kumar@motilaloswal.com<br />
kadambari.balachandran@motilaloswal.com<br />
Contact : (+65) 68189232 (+65) 68189233 / 65249115<br />
Office Address:21 (Suite 31),16 Collyer Quay,Singapore 04931<br />
Motilal Oswal Securities Ltd<br />
Motilal Oswal Tower, Level 9, Sayani Road, Prabhadevi, Mumbai 400 025<br />
Phone: +91 22 3982 5500 E-mail: reports@motilaloswal.com<br />
27 October 2016 14