DISCUSSION
n?u=RePEc:iza:izadps:dp10283&r=exp
n?u=RePEc:iza:izadps:dp10283&r=exp

Create successful ePaper yourself
Turn your PDF publications into a flip-book with our unique Google optimized e-Paper software.
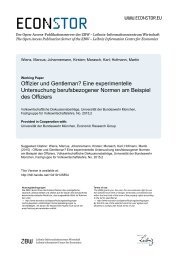
Panel I: All students in the task-based goals experiment<br />
Total points score Pr(Grade ≥ A–) Pr(Grade ≥ B+)<br />
OLS Median OLS OLS<br />
Effect of asking students to set 0.743 0.924 ∗ 0.042 ∗ 0.043 ∗<br />
task-based goals (0.474) (0.475) (0.022) (0.022)<br />
[0.117] [0.052] [0.057] [0.052]<br />
Effect / (SD in Control group) 0.068 0.085 0.086 0.087<br />
Mean of dependent variable in Control group 83.111 83.111 0.393 0.493<br />
Observations 2,004 2,004 2,004 2,004<br />
Panel II: Male students in the task-based goals experiment<br />
Total points score Pr(Grade ≥ A–) Pr(Grade ≥ B+)<br />
OLS Median OLS OLS<br />
Effect of asking students to set 1.581 ∗∗ 1.700 ∗∗ 0.093 ∗∗∗ 0.058 ∗<br />
task-based goals (0.706) (0.674) (0.033) (0.033)<br />
[0.025] [0.012] [0.005] [0.078]<br />
Effect / (SD in Control group) 0.141 0.151 0.189 0.115<br />
Mean of dependent variable in Control group 83.285 83.285 0.417 0.529<br />
Observations 918 918 918 918<br />
Panel III: Female students in the task-based goals experiment<br />
Total points score Pr(Grade ≥ A–) Pr(Grade ≥ B+)<br />
OLS Median OLS OLS<br />
Effect of asking students to set 0.017 0.471 -0.003 0.030<br />
task-based goals (0.637) (0.652) (0.029) (0.030)<br />
[0.979] [0.470] [0.921] [0.320]<br />
Effect / (SD in Control group) 0.002 0.045 -0.006 0.060<br />
Mean of dependent variable in Control group 82.966 82.966 0.373 0.463<br />
Observations 1,086 1,086 1,086 1,086<br />
Notes: The regressions are the same as those reported in Table 6, except that we no longer include controls for<br />
student characteristics. Heteroskedasticity-consistent standard errors are shown in round brackets and two-sided<br />
p-values are shown in square brackets.<br />
∗ , ∗∗ and ∗∗∗ denote, respectively, significance at the 10%, 5% and 1%<br />
levels (two-sided tests).<br />
Table SWA.5: Effects of task-based goals on student performance without controls for student<br />
characteristics<br />
Supplementary Web Appendix, p. 4