ZaraAnnual-English2008

Create successful ePaper yourself
Turn your PDF publications into a flip-book with our unique Google optimized e-Paper software.
InterContinental Jordan<br />
12. Financial impact of non-recurring transactions that occurred during the fiscal<br />
year and do not fall within the main activities of the company:<br />
There is no financial impact of non-recurring transactions that occurred during the fiscal year and<br />
do not fall within the main activities of the Company.<br />
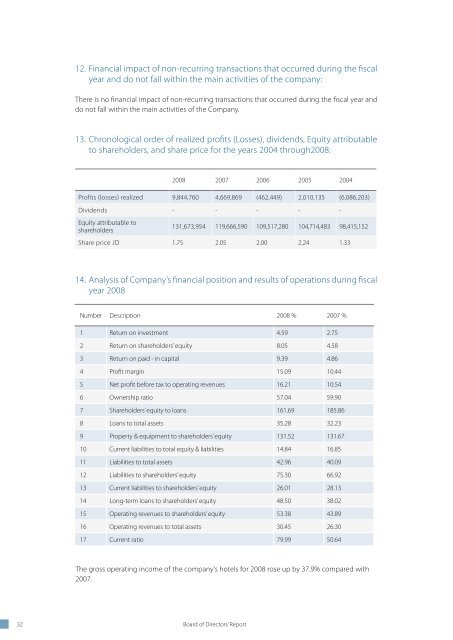
13. Chronological order of realized profits (Losses), dividends, Equity attributable<br />
to shareholders, and share price for the years 2004 through2008:<br />
2008 2007 2006 2005 2004<br />
Profits (losses) realized 9,844,760 4,669,869 (462,449) 2,010,135 (6,086,203)<br />
Dividends - - - - -<br />
Equity attributable to<br />
shareholders<br />
131,673,954 119,666,590 109,517,280 104,714,483 98,415,152<br />
Share price JD 1.75 2.05 2.00 2.24 1.33<br />
14. Analysis of Company’s financial position and results of operations during fiscal<br />
year 2008<br />
Number Description 2008 % 2007 %<br />
1 Return on investment 4.59 2.75<br />
2 Return on shareholders’ equity 8.05 4.58<br />
3 Return on paid - in capital 9.39 4.86<br />
4 Profit margin 15.09 10.44<br />
5 Net profit before tax to operating revenues 16.21 10.54<br />
6 Ownership ratio 57.04 59.90<br />
7 Shareholders’ equity to loans 161.69 185.86<br />
8 Loans to total assets 35.28 32.23<br />
9 Property & equipment to shareholders’ equity 131.52 131.67<br />
10 Current liabilities to total equity & liabilities 14.84 16.85<br />
11 Liabilities to total assets 42.96 40.09<br />
12 Liabilities to shareholders’ equity 75.30 66.92<br />
13 Current liabilities to shareholders’ equity 26.01 28.13<br />
14 Long-term loans to shareholders’ equity 48.50 38.02<br />
15 Operating revenues to shareholders’ equity 53.38 43.89<br />
16 Operating revenues to total assets 30.45 26.30<br />
17 Current ratio 79.99 50.64<br />
The gross operating income of the company’s hotels for 2008 rose up by 37.9% compared with<br />
2007.<br />
Key indicators of the company’s hotels for 2008 compared with those for 2007<br />
Hotel<br />
Number<br />
of<br />
Rooms<br />
Occupancy<br />
Average Room Rate<br />
JD<br />
Operating Revenues JD<br />
2008 2007 2008 2007 2008 2007<br />
450 65 53 102 94 19,878,637 15,497,624<br />
316 67 59 124 103 18,092,380 14,080,182<br />
Hyatt Tower 90 59 60 114 92 1,259,449 1,008,967<br />
362 75 65 94 80 17,198,450 13,109,948<br />
332 79 64 78 73 10,717,463 7,812,350<br />
183 69 72 70 51 7,268,926 4,835,143<br />
92 67 60 49 39 1,917,771 553,198<br />
Total 1825 71 62 93 81 76,333,076 56,897,412<br />
32 Board of Directors’ Report Annual Report 2008 33