ZaraAnnual-English2011
You also want an ePaper? Increase the reach of your titles
YUMPU automatically turns print PDFs into web optimized ePapers that Google loves.
Board of Directors’ Report Annual Report 2011<br />
Following are the key indicators of the Company’s hotels for 2011 compared with those for 2010:<br />
Hotel<br />
Number of<br />
Rooms<br />
Occupancy % Average Room Operating Revenues JD<br />
Rate JD<br />
2011 2010 2011 2010 2011 2010<br />
450 56 66 118 126 19,337,205 18,484,409<br />
316 49 63 122 124 12,618,939 16,547,340<br />
Hyatt Tower 90 84 70 135 133 1,954,963 1,695,439<br />
362 55 68 123 127 16,361,557 20,851,125<br />
332 61 59 84 89 8,530,147 8,999,867<br />
14.<br />
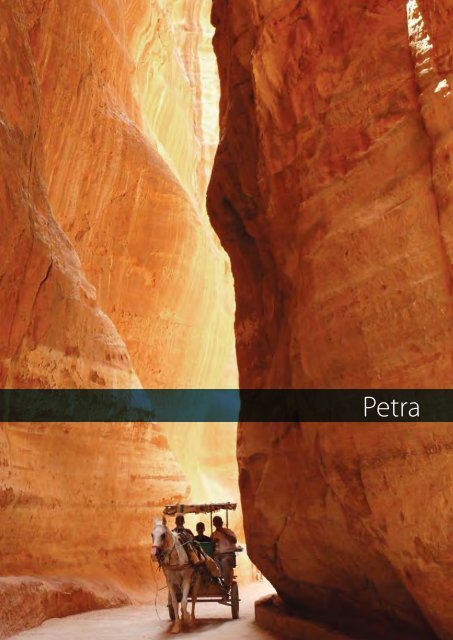
Jerash - one of the most complete and best-preserved cities of the Roman province of Arabia, situated in the biblical<br />
land of Gilead. 60 minutes away from the Grand Hyatt Amman Hotel and InterContinental Jordan.<br />
Analysis of Company’s financial position and results of operations during fiscal year 2011 - 2010:<br />
183 56 68 108 118 6,806,463 9,307,544<br />
No.<br />
Description<br />
2011 %<br />
2010 %<br />
92 21 59 71 83 778,722 2,604,212<br />
1<br />
2<br />
Return on Investments<br />
Return on Equity<br />
-0.40<br />
-0.64<br />
3.36<br />
5.51<br />
306 61 57 92 90 10,912,902 10,031,567<br />
3<br />
4<br />
Return on Paid-in Capital<br />
Profit Margin<br />
-0.86<br />
-1.37<br />
7.52<br />
10.48<br />
Total 2,131 55 63 107 113 77,300,898 88,521,503<br />
5<br />
Earnings before Taxes (EBT) to Operating Revenues<br />
-0.64<br />
11.95<br />
6<br />
7<br />
8<br />
9<br />
10<br />
11<br />
12<br />
13<br />
14<br />
15<br />
16<br />
Ownership Ratio<br />
Equity to Loans<br />
Loans to Assets<br />
Property and Equipment to Equity<br />
Current Liability to total assets<br />
Liabilities to Total Assets<br />
Liabilities to Equity<br />
Current Liabilities to Equity<br />
Long-term Loans to Equity<br />
Operating Revenues to Equity<br />
Operating Revenues to Assets<br />
61.38<br />
182.24<br />
33.68<br />
130.27<br />
14.38<br />
38.62<br />
62.91<br />
23.42<br />
39.35<br />
46.97<br />
28.83<br />
60.92<br />
184.83<br />
32.96<br />
130.64<br />
11.13<br />
39.08<br />
64.16<br />
18.27<br />
45.74<br />
52.61<br />
32.05<br />
1.<br />
2.<br />
3.<br />
4.<br />
5.<br />
The consolidated statement of financial position of Zara indicates that the total assets as of 31/12/2011 totaled JD<br />
271,189,060 compared with JD 279,856,071 as of 31/12/2010, representing a decline of 3.1%<br />
The equity attributable to shareholders as of 31/12/2011 totaled JD 146,323,274 compared with JD 149,726,285 as of<br />
31/12/2010 representing a decline of 2.3%<br />
The consolidated income statement indicates that operating revenues for 2011 totaled JD 78,192,232 compared with JD<br />
89,687,120 representing a decline of 12.8%<br />
The consolidated expenses including administration, depreciation, and net finance expenses for 2011 totaled JD<br />
23,266,722 compared with JD 21,936,508 representing an increase of 6.1% increase.<br />
The consolidated net loss attributable to shareholders for 2011 totaled JD 867,718 compared with net profit JD 9,008,144<br />
for 2010 representing a decline 0f 109.6%.<br />
17<br />
Current Ratio<br />
62.36<br />
81.07<br />
40<br />
41


