

PEACE
2gDMXRh
2gDMXRh

You also want an ePaper? Increase the reach of your titles
YUMPU automatically turns print PDFs into web optimized ePapers that Google loves.
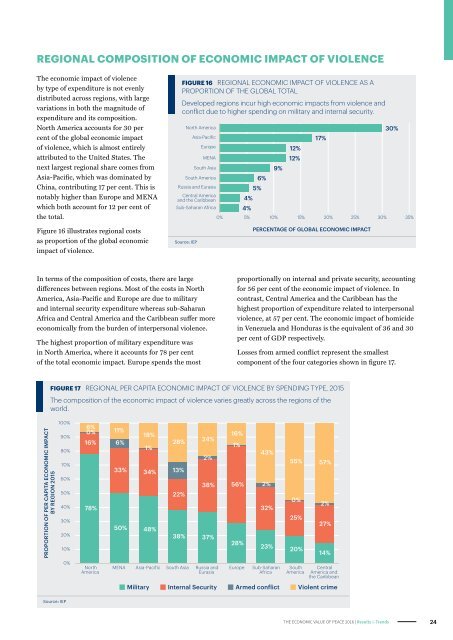
REGIONAL COMPOSITION OF ECONOMIC IMPACT OF VIOLENCE<br />
The economic impact of violence<br />
by type of expenditure is not evenly<br />
distributed across regions, with large<br />
variations in both the magnitude of<br />
expenditure and its composition.<br />
North America accounts for 30 per<br />
cent of the global economic impact<br />
of violence, which is almost entirely<br />
attributed to the United States. The<br />
next largest regional share comes from<br />
Asia-Pacific, which was dominated by<br />
China, contributing 17 per cent. This is<br />
notably higher than Europe and MENA<br />
which both account for 12 per cent of<br />
the total.<br />
FIGURE 16 REGIONAL ECONOMIC IMPACT OF VIOLENCE AS A<br />
PROPORTION OF THE GLOBAL TOTAL<br />
Developed regions incur high economic impacts from violence and<br />
conflict due to higher spending on military and internal security.<br />
North America<br />
Asia-Pacific<br />
Europe<br />
MENA<br />
South Asia<br />
South America<br />
Russia and Eurasia<br />
Central America<br />
and the Caribbean<br />
Sub-Saharan Africa<br />
4%<br />
4%<br />
5%<br />
6%<br />
9%<br />
12%<br />
12%<br />
17%<br />
30%<br />
0% 5% 10% 15% 20% 25% 30% 35%<br />
Figure 16 illustrates regional costs<br />
as proportion of the global economic<br />
impact of violence.<br />
Source: IEP<br />
PERCENTAGE OF GLOBAL ECONOMIC IMPACT<br />
In terms of the composition of costs, there are large<br />
differences between regions. Most of the costs in North<br />
America, Asia-Pacific and Europe are due to military<br />
and internal security expenditure whereas sub-Saharan<br />
Africa and Central America and the Caribbean suffer more<br />
economically from the burden of interpersonal violence.<br />
The highest proportion of military expenditure was<br />
in North America, where it accounts for 78 per cent<br />
of the total economic impact. Europe spends the most<br />
proportionally on internal and private security, accounting<br />
for 56 per cent of the economic impact of violence. In<br />
contrast, Central America and the Caribbean has the<br />
highest proportion of expenditure related to interpersonal<br />
violence, at 57 per cent. The economic impact of homicide<br />
in Venezuela and Honduras is the equivalent of 36 and 30<br />
per cent of GDP respectively.<br />
Losses from armed conflict represent the smallest<br />
component of the four categories shown in figure 17.<br />
FIGURE 17 REGIONAL PER CAPITA ECONOMIC IMPACT OF VIOLENCE BY SPENDING TYPE, 2015<br />
The composition of the economic impact of violence varies greatly across the regions of the<br />
world.<br />
PROPORTION OF PER CAPITA ECONOMIC IMPACT<br />
BY REGION 2015<br />
100%<br />
90%<br />
80%<br />
70%<br />
60%<br />
50%<br />
40%<br />
30%<br />
20%<br />
10%<br />
0%<br />
6%<br />
0%<br />
16%<br />
78%<br />
North<br />
America<br />
11%<br />
6%<br />
18%<br />
1%<br />
33% 34%<br />
50% 48%<br />
28%<br />
13%<br />
22%<br />
24%<br />
2%<br />
38% 37%<br />
MENA Asia-Pacific South Asia Russia and<br />
Eurasia<br />
16%<br />
1%<br />
38% 56%<br />
28%<br />
Europe<br />
43%<br />
2%<br />
32%<br />
23%<br />
Sub-Saharan<br />
Africa<br />
55% 57%<br />
0%<br />
25%<br />
20%<br />
South<br />
America<br />
2%<br />
27%<br />
14%<br />
Central<br />
America and<br />
the Caribbean<br />
Military Internal Security Armed conflict Violent crime<br />
Source: IEP<br />
THE ECONOMIC VALUE OF <strong>PEACE</strong> 2016 | Results & Trends 24