

NORTHEASTERN
Jan17NUCLEUS
Jan17NUCLEUS

Create successful ePaper yourself
Turn your PDF publications into a flip-book with our unique Google optimized e-Paper software.
Summer Scholar Report<br />
Continued from page 9<br />
modifications. Native and brominated antibody was incubated<br />
at 100-, 500-, and 1000-fold dilutions for 4 days. After 2 days<br />
of incubation of HRP-linked secondary antibody, sections<br />
were dehydrated in sucrose gradations, frozen in TissueTek,<br />
and cryosectioned into 20 μm slices followed by coloration<br />
with Vector VIP peroxidase substrate until proper signal-tonoise<br />
was achieved. Subsequent visualization was carried out<br />
via brightfield light microscopy. Optimal dilution factor 100x<br />
was applied to brominated antibody for 7 days on control and<br />
fatty liver sections followed by 3D visualization via Scanco<br />
μCT 40 as preliminary testing for immuno-eDECT.<br />
Results<br />
Direct protein bromination afforded low oxidative fragmentation<br />
with acceptable degrees of bromination. Bradford UV<br />
assay of dialysis bath content revealed protein fragmentation<br />
below 1%. Optimization reactions revealed that decreasing<br />
pH from 9.0 to 3.0 did significantly decrease bromination of<br />
BSA from 88 to 56%, while doubling or tripling NBS concentration<br />
had no significant impact on bromination (see Table<br />
1) as determined by fourth-derivative assay. Fourth derivative<br />
spectroscopy predicted 16.8 ± 3.1 tyrosyl residues, agreeing<br />
with the 19 residues found in native BSA. It was determined<br />
that lapine anti-TGF used contained 15.9 ± 4.5 tyrosyl<br />
residues. As seen in Table 2, a significant difference in degree<br />
of bromination was seen with both BSA and antibody bromination<br />
in comparison to native forms, with 36% bromination<br />
of anti-TGF and 78% bromination of BSA, when bromination<br />
occurs at physiological pH 7.4.<br />
Table 1. Impact of pH and NBS concentration on BSA tyrosyl bromination.<br />
Note that values marked with † show significant (p < 0.05) difference in<br />
the number of brominated tyrosyl residues than bromination at pH 7.4.<br />
Table 2. Number of tyrosine residues not brominated via oxidation as detected<br />
by UV spectroscopic assay. Note prediction of number of tyrosine<br />
residues in native BSA agrees with theory. Significant difference in tyrosine<br />
residues between native and brominated BSA (p < 0.001) and native<br />
and brominated antibody (p = 0.002). †Lapine Fc IgG, UniProt database.<br />
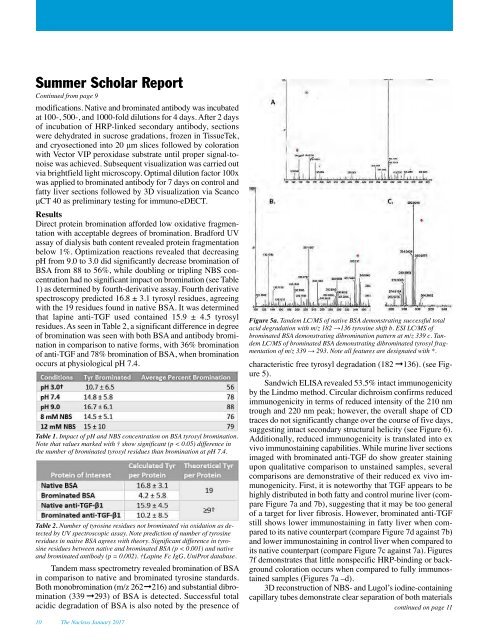
Tandem mass spectrometry revealed bromination of BSA<br />
in comparison to native and brominated tyrosine standards.<br />
Both monobromination (m/z 262 ➞216) and substantial dibro -<br />
mination (339 ➞293) of BSA is detected. Successful total<br />
acidic degradation of BSA is also noted by the presence of<br />
Figure 5a. Tandem LC/MS of native BSA demonstrating successful total<br />
acid degradation with m/z 182 →136 tyrosine shift b. ESI LC/MS of<br />
brominated BSA demonstrating dibromination pattern at m/z 339 c. Tandem<br />
LC/MS of brominated BSA demonstrating dibrominated tyrosyl fragmentation<br />
of m/z 339 → 293. Note all features are designated with *.<br />
characteristic free tyrosyl degradation (182 ➞136). (see Figure<br />
5).<br />
Sandwich ELISA revealed 53.5% intact immunogenicity<br />
by the Lindmo method. Circular dichroism confirms reduced<br />
immunogenicity in terms of reduced intensity of the 210 nm<br />
trough and 220 nm peak; however, the overall shape of CD<br />
traces do not significantly change over the course of five days,<br />
suggesting intact secondary structural helicity (see Figure 6).<br />
Additionally, reduced immunogenicity is translated into ex<br />
vivo immunostaining capabilities. While murine liver sections<br />
imaged with brominated anti-TGF do show greater staining<br />
upon qualitative comparison to unstained samples, several<br />
comparisons are demonstrative of their reduced ex vivo immunogenicity.<br />
First, it is noteworthy that TGF appears to be<br />
highly distributed in both fatty and control murine liver (compare<br />
Figure 7a and 7b), suggesting that it may be too general<br />
of a target for liver fibrosis. However, brominated anti-TGF<br />
still shows lower immunostaining in fatty liver when compared<br />
to its native counterpart (compare Figure 7d against 7b)<br />
and lower immunostaining in control liver when compared to<br />
its native counterpart (compare Figure 7c against 7a). Figures<br />
7f demonstrates that little nonspecific HRP-binding or background<br />
coloration occurs when compared to fully immunostained<br />
samples (Figures 7a –d).<br />
3D reconstruction of NBS- and Lugol’s iodine-containing<br />
capillary tubes demonstrate clear separation of both materials<br />
continued on page 11<br />
10 The Nucleus January 2017