

NORTHEASTERN
Jan17NUCLEUS
Jan17NUCLEUS

Create successful ePaper yourself
Turn your PDF publications into a flip-book with our unique Google optimized e-Paper software.
Summer Scholar Report<br />
Continued from page 10<br />
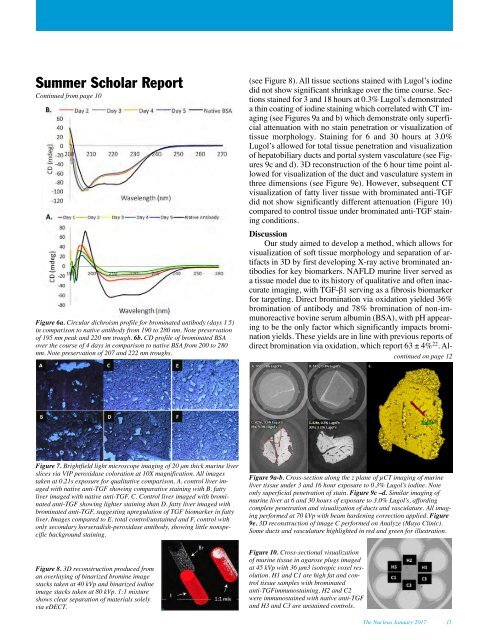
Figure 6a. Circular dichroism profile for brominated antibody (days 1 5)<br />
in comparison to native antibody from 190 to 280 nm. Note preservation<br />
of 195 nm peak and 220 nm trough. 6b. CD profile of brominated BSA<br />
over the course of 4 days in comparison to native BSA from 200 to 280<br />
nm. Note preservation of 207 and 222 nm troughs.<br />
(see Figure 8). All tissue sections stained with Lugol’s iodine<br />
did not show significant shrinkage over the time course. Sections<br />
stained for 3 and 18 hours at 0.3% Lugol’s demonstrated<br />
a thin coating of iodine staining which correlated with CT imaging<br />
(see Figures 9a and b) which demonstrate only superficial<br />
attenuation with no stain penetration or visualization of<br />
tissue morphology. Staining for 6 and 30 hours at 3.0%<br />
Lugol’s allowed for total tissue penetration and visualization<br />
of hepatobiliary ducts and portal system vasculature (see Figures<br />
9c and d). 3D reconstruction of the 6 hour time point allowed<br />
for visualization of the duct and vasculature system in<br />
three dimensions (see Figure 9e). However, subsequent CT<br />
visualization of fatty liver tissue with brominated anti-TGF<br />
did not show significantly different attenuation (Figure 10)<br />
compared to control tissue under brominated anti-TGF staining<br />
conditions.<br />
Discussion<br />
Our study aimed to develop a method, which allows for<br />
visualization of soft tissue morphology and separation of artifacts<br />
in 3D by first developing X-ray active brominated antibodies<br />
for key biomarkers. NAFLD murine liver served as<br />
a tissue model due to its history of qualitative and often inaccurate<br />
imaging, with TGF-β1 serving as a fibrosis biomarker<br />
for targeting. Direct bromination via oxidation yielded 36%<br />
bromination of antibody and 78% bromination of non-immunoreactive<br />
bovine serum albumin (BSA), with pH appearing<br />
to be the only factor which significantly impacts bromination<br />
yields. These yields are in line with previous reports of<br />
direct bromination via oxidation, which report 63 ± 4% 22 . Alcontinued<br />
on page 12<br />
Figure 7. Brightfield light microscope imaging of 20 μm thick murine liver<br />
slices via VIP peroxidase coloration at 10X magnification. All images<br />
taken at 0.21s exposure for qualitative comparison. A. control liver imaged<br />
with native anti-TGF showing comparative staining with B. fatty<br />
liver imaged with native anti-TGF. C. Control liver imaged with brominated<br />
anti-TGF showing lighter staining than D. fatty liver imaged with<br />
brominated anti-TGF, suggesting upregulation of TGF biomarker in fatty<br />
liver. Images compared to E. total control/unstained and F. control with<br />
only secondary horseradish-peroxidase antibody, showing little nonspecific<br />
background staining.<br />
Figure 8. 3D reconstruction produced from<br />
an overlaying of binarized bromine image<br />
stacks taken at 40 kVp and binarized iodine<br />
image stacks taken at 80 kVp. 1:1 mixture<br />
shows clear separation of materials solely<br />
via eDECT.<br />
Figure 9a-b. Cross-section along the z plane of µCT imaging of murine<br />
liver tissue under 3 and 16 hour exposure to 0.3% Lugol’s iodine. Note<br />
only superficial penetration of stain. Figure 9c –d. Similar imaging of<br />
murine liver at 6 and 30 hours of exposure to 3.0% Lugol’s, affording<br />
complete penetration and visualization of ducts and vasculature. All imaging<br />
performed at 70 kVp with beam hardening correction applied. Figure<br />
9e. 3D reconstruction of image C performed on Analyze (Mayo Clinic).<br />
Some ducts and vasculature highlighted in red and green for illustration.<br />
Figure 10. Cross-sectional visualization<br />
of murine tissue in agarose plugs imaged<br />
at 45 kVp with 36 μm3 isotropic voxel resolution.<br />
H1 and C1 are high fat and control<br />
tissue samples with brominated<br />
anti-TGFimmunostaining, H2 and C2<br />
were immunostained with native anti-TGF<br />
and H3 and C3 are unstained controls.<br />
The Nucleus January 2017 11