

NORTHEASTERN
Jan17NUCLEUS
Jan17NUCLEUS

Create successful ePaper yourself
Turn your PDF publications into a flip-book with our unique Google optimized e-Paper software.
Summer Scholar Report<br />
Continued from page 8<br />
anti-TGF-β1 was then brominated in 4 mM NBS for optimized<br />
time of 40 minutes at room temperature, also halted<br />
with dialysis for 48 hours. Optimization reactions varied NBS<br />
concentration to 8 and 12 mM and pH to 3.0 and 9.0 under<br />
similar conditions.<br />
Tandem mass spectrometry<br />
BSA and antibody samples were first lyophilized overnight.<br />
BSA was then degraded in 6 M hydrochloric acid (8 M for<br />
antibody) with 10 µL of 1 µg/ml phenol and 50 µL of thioglycolic<br />
acid at 105 °C for 16 hours (48 hours for antibody)<br />
in 40 ml pressure vials. Residual acid content was removed<br />
via lyophilization and amino acid residue was resuspended in<br />
0.1% acetic acid. A gradient elution was performed as cited<br />
by Kato, et al. 18 Native and brominated tyrosine were used as<br />
standards.<br />
Fourth derivative UV spectroscopy<br />
UV analysis follows a method developed by Bray, et al 19 to<br />
determine the number of tyrosyl residues brominated by NBS.<br />
In brief, UV absorption due to tryptophan must first be quantified<br />
and separated from absorption due to tyrosine (see Figure<br />
3). Aliquots ranging from 0.03 to 0.15 mM of tryptophan<br />
methyl ester standard are added to 6 M guanidine buffer and<br />
read from 250 to 310 nm, for determination of the tryptophan<br />
molar extinction coefficient at 282 and 292 nm, Then 1 mg/ml<br />
BSA and 2.2 μM antibody are spiked with aliquots of 4.9 and<br />
1.0 µM tyrosine ethyl ester, respectively, to create standard<br />
additions plots from which the number of unaffected tyrosyl<br />
residues may be determined and subsequently the percent<br />
bromination.<br />
Circular dichroism<br />
Aliquots of 0.2 mg/ml of native and brominated BSA and antibody<br />
in PBS were scanned in triplicate with a 1 mm crystal<br />
cuvette ranging from 200 to 280 nm. Scans were performed<br />
over the course of days after bromination to monitor protein<br />
structural stability.<br />
Validation of bromine and iodine X-ray separation<br />
Solutions of 0.02 mM NBS and Lugol’s iodine (equivalent to<br />
the maximum concentration of staining agent in murine liver)<br />
were loaded into roughly 1 cm polystyrene capillary tubes. A<br />
1:1 mixture was also produced. The tubes were loaded into a<br />
specially designed polystyrene hollowed fixture which allows<br />
for minimal pixel shifting over the course of scanning (see<br />
Figure 4). Scanning was performed via Zeiss Xradia 520<br />
Versa at 40 and 80 kVp, with LE2 and LE5 filters, for bromine<br />
and iodine respectively. Scanning occurred at roughly 4X<br />
magnification with 5 µm 3 isotropic resolution for 5 hours.<br />
Post-processing such as calibration to low- and high-attenuating<br />
standards, filtering, and masking was performed on<br />
Zeiss Reconstructor 11 and DSCoVer 11 software, with 3D<br />
reconstruction performed on Analyze (Mayo Clinic).<br />
Lugol’s iodine time course on ex vivo murine liver tissue<br />
Five 0.5 cm sections of healthy murine tissue were first fixed<br />
overnight at 4 °C in Dent’s fixative (80% methanol, 20%<br />
DMSO) and then underwent four freeze/thaw cycles at -80 °C<br />
in 100% methanol. Tissues were rehydrated in 50 and then<br />
15% methanol and permeabilized for 30 minutes at room temperature<br />
with 10 µg/ml proteinase K. Sections were each<br />
stained under one of the five following conditions: 3, 18, and<br />
24 hours at 0.3% Lugol and 42 hours 0.3% with 6 and 30<br />
hours at 3.0% Lugol’s. Sections were rinsed at the end of each<br />
staining period and cast in 0.5% agarose in small plastic cylinders<br />
(Figure 4). Sections were then scanned on Scanco µCT40<br />
at 70 kVp with 3D reconstruction performed on Analyze<br />
(Mayo Clinic).<br />
Figure 3. UV activity of most proteins is due to absorption from aromatic<br />
amino acids tyrosine and tryptophan. A characteristic peak at 282 nm represents<br />
an overlay of tyrosine and tryptophan absorption, whereas the<br />
characteristic 292 nm trough is solely tryptophan absorption. Equation 1<br />
allows for calculation of tryptophan absorptivity at 292 nm, determined<br />
from tryptophan standards. Equation 2 then separates the contribution of<br />
tryptophan to the 282 nm absorption to quantify the number of intact tyrosyl<br />
residues.<br />
Sandwich enzyme-linked immunosorbent assay<br />
(ELISA)<br />
Seven wells across two rows of a Coulter 96-well plate were<br />
used to compare native and brominated antibody immunogen -<br />
icity. Manufacturer-provided capture antibody, TGF antigen,<br />
HRP-linked secondary antibody and coloring reagent were<br />
used. Two-fold serial dilutions were performed on TGF antigen<br />
to create a calibration curve. The Lindmo method of infinite<br />
antigen excess 20 was used to determine immunogenicity.<br />
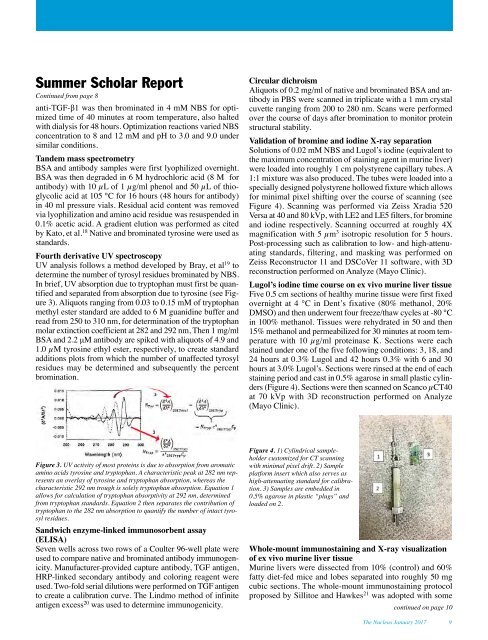
Figure 4. 1) Cylindrical sampleholder<br />
customized for CT scanning<br />
with minimal pixel drift. 2) Sample<br />
platform insert which also serves as<br />
high-attenuating standard for calibration.<br />
3) Samples are embedded in<br />
0.5% agarose in plastic “plugs” and<br />
loaded on 2.<br />
Whole-mount immunostaining and X-ray visualization<br />
of ex vivo murine liver tissue<br />
Murine livers were dissected from 10% (control) and 60%<br />
fatty diet-fed mice and lobes separated into roughly 50 mg<br />
cubic sections. The whole-mount immunostaining protocol<br />
proposed by Sillitoe and Hawkes 21 was adopted with some<br />
continued on page 10<br />
The Nucleus January 2017 9