Macroeconomics
n?u=RePEc:bbk:bbkcam:1603&r=for
n?u=RePEc:bbk:bbkcam:1603&r=for

You also want an ePaper? Increase the reach of your titles
YUMPU automatically turns print PDFs into web optimized ePapers that Google loves.
h = 1<br />
h = 4<br />
h = 8<br />
2.5<br />
Normal: AR(1)<br />
2.5<br />
Normal: AR(1)-B<br />
2.5<br />
Student-t: AR(1)<br />
2.5<br />
Student-t: AR(1)-B<br />
2<br />
2<br />
2<br />
2<br />
1.5<br />
1.5<br />
1.5<br />
1.5<br />
1<br />
1<br />
1<br />
1<br />
0.5<br />
0.5<br />
0.5<br />
0.5<br />
0<br />
0 0.2 0.4 0.6 0.8 1<br />
0<br />
0 0.2 0.4 0.6 0.8 1<br />
0<br />
0 0.2 0.4 0.6 0.8 1<br />
0<br />
0 0.2 0.4 0.6 0.8 1<br />
3<br />
3<br />
3<br />
3<br />
2<br />
2<br />
2<br />
2<br />
1<br />
1<br />
1<br />
1<br />
0<br />
0 0.2 0.4 0.6 0.8 1<br />
0<br />
0 0.2 0.4 0.6 0.8 1<br />
0<br />
0 0.2 0.4 0.6 0.8 1<br />
0<br />
0 0.2 0.4 0.6 0.8 1<br />
29<br />
3<br />
3<br />
3<br />
3<br />
2<br />
2<br />
2<br />
2<br />
1<br />
1<br />
1<br />
1<br />
0<br />
0 0.2 0.4 0.6 0.8 1<br />
0<br />
0 0.2 0.4 0.6 0.8 1<br />
0<br />
0 0.2 0.4 0.6 0.8 1<br />
0<br />
0 0.2 0.4 0.6 0.8 1<br />
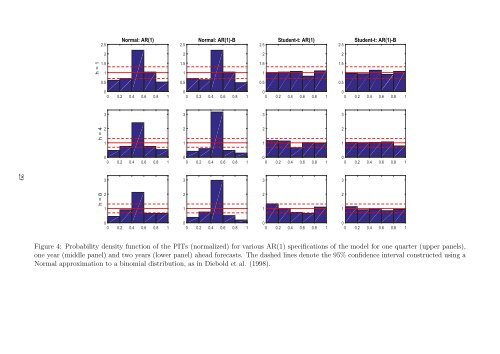
Figure 4: Probability density function of the PITs (normalized) for various AR(1) specifications of the model for one quarter (upper panels),<br />
one year (middle panel) and two years (lower panel) ahead forecasts. The dashed lines denote the 95% confidence interval constructed using a<br />
Normal approximation to a binomial distribution, as in Diebold et al. (1998).