Macroeconomics
n?u=RePEc:bbk:bbkcam:1603&r=for
n?u=RePEc:bbk:bbkcam:1603&r=for

Create successful ePaper yourself
Turn your PDF publications into a flip-book with our unique Google optimized e-Paper software.
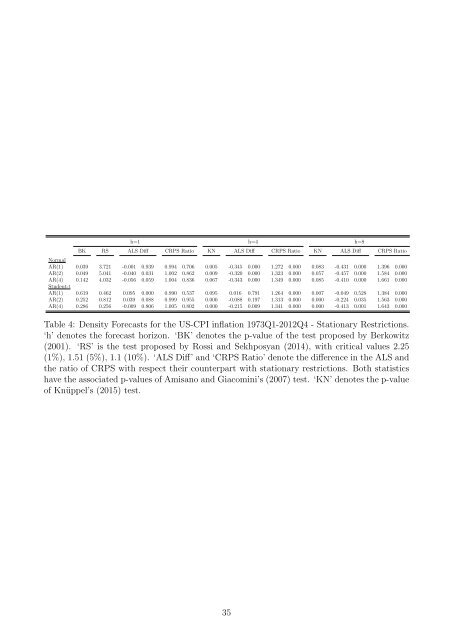
h=1 h=4 h=8<br />
BK RS ALS Diff CRPS Ratio KN ALS Diff CRPS Ratio KN ALS Diff CRPS Ratio<br />
Normal<br />
AR(1) 0.039 3.721 -0.001 0.939 0.994 0.706 0.005 -0.345 0.000 1.272 0.000 0.083 -0.431 0.000 1.396 0.000<br />
AR(2) 0.049 5.041 -0.040 0.031 1.002 0.862 0.009 -0.320 0.000 1.323 0.000 0.057 -0.457 0.000 1.584 0.000<br />
AR(4) 0.142 4.032 -0.056 0.059 1.004 0.836 0.067 -0.343 0.000 1.349 0.000 0.085 -0.410 0.000 1.661 0.000<br />
Student-t<br />
AR(1) 0.619 0.462 0.095 0.000 0.990 0.537 0.095 0.016 0.791 1.264 0.000 0.007 -0.049 0.528 1.384 0.000<br />
AR(2) 0.252 0.812 0.039 0.088 0.999 0.955 0.000 -0.088 0.197 1.313 0.000 0.000 -0.224 0.035 1.563 0.000<br />
AR(4) 0.286 0.256 -0.009 0.806 1.005 0.802 0.000 -0.215 0.009 1.341 0.000 0.000 -0.413 0.001 1.643 0.000<br />
Table 4: Density Forecasts for the US-CPI inflation 1973Q1-2012Q4 - Stationary Restrictions.<br />
‘h’ denotes the forecast horizon. ‘BK’ denotes the p-value of the test proposed by Berkowitz<br />
(2001). ‘RS’ is the test proposed by Rossi and Sekhposyan (2014), with critical values 2.25<br />
(1%), 1.51 (5%), 1.1 (10%). ‘ALS Diff’ and ‘CRPS Ratio’ denote the difference in the ALS and<br />
the ratio of CRPS with respect their counterpart with stationary restrictions. Both statistics<br />
have the associated p-values of Amisano and Giacomini’s (2007) test. ‘KN’ denotes the p-value<br />
of Knüppel’s (2015) test.<br />
35