Macroeconomics
n?u=RePEc:bbk:bbkcam:1603&r=for
n?u=RePEc:bbk:bbkcam:1603&r=for
Create successful ePaper yourself
Turn your PDF publications into a flip-book with our unique Google optimized e-Paper software.
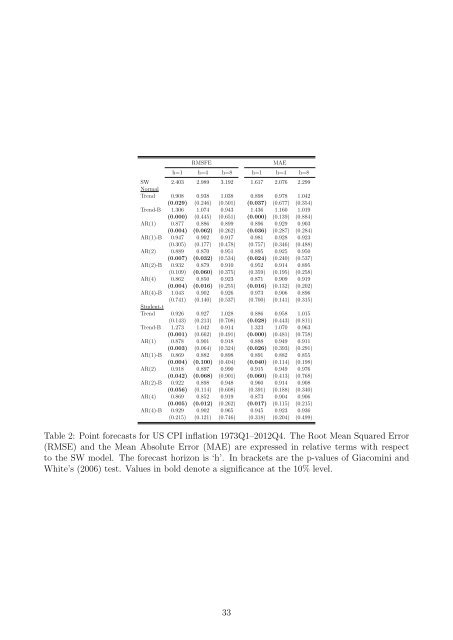
RMSFE<br />
MAE<br />
h=1 h=4 h=8 h=1 h=4 h=8<br />
SW 2.403 2.989 3.192 1.617 2.076 2.299<br />
Normal<br />
Trend 0.908 0.938 1.038 0.898 0.978 1.042<br />
(0.029) (0.246) (0.501) (0.037) (0.677) (0.354)<br />
Trend-B 1.306 1.074 0.943 1.436 1.160 1.019<br />
(0.000) (0.445) (0.651) (0.000) (0.139) (0.884)<br />
AR(1) 0.877 0.886 0.899 0.896 0.929 0.903<br />
(0.004) (0.062) (0.262) (0.036) (0.287) (0.284)<br />
AR(1)-B 0.947 0.902 0.917 0.981 0.928 0.923<br />
(0.305) (0.177) (0.478) (0.757) (0.346) (0.488)<br />
AR(2) 0.889 0.870 0.951 0.895 0.925 0.950<br />
(0.007) (0.032) (0.534) (0.024) (0.240) (0.537)<br />
AR(2)-B 0.932 0.879 0.910 0.952 0.914 0.895<br />
(0.109) (0.060) (0.375) (0.359) (0.195) (0.258)<br />
AR(4) 0.862 0.850 0.923 0.871 0.909 0.919<br />
(0.004) (0.016) (0.255) (0.016) (0.132) (0.202)<br />
AR(4)-B 1.043 0.902 0.926 0.973 0.906 0.896<br />
(0.741) (0.140) (0.537) (0.700) (0.141) (0.315)<br />
Student-t<br />
Trend 0.926 0.927 1.028 0.886 0.958 1.015<br />
(0.143) (0.213) (0.708) (0.028) (0.443) (0.811)<br />
Trend-B 1.273 1.042 0.914 1.323 1.070 0.963<br />
(0.001) (0.662) (0.491) (0.000) (0.481) (0.758)<br />
AR(1) 0.878 0.901 0.918 0.888 0.949 0.911<br />
(0.003) (0.064) (0.324) (0.026) (0.393) (0.291)<br />
AR(1)-B 0.869 0.882 0.898 0.891 0.882 0.855<br />
(0.004) (0.100) (0.404) (0.040) (0.114) (0.198)<br />
AR(2) 0.918 0.897 0.990 0.915 0.949 0.976<br />
(0.042) (0.068) (0.901) (0.060) (0.413) (0.768)<br />
AR(2)-B 0.922 0.898 0.948 0.960 0.914 0.908<br />
(0.056) (0.114) (0.608) (0.391) (0.188) (0.340)<br />
AR(4) 0.869 0.852 0.919 0.873 0.904 0.906<br />
(0.005) (0.012) (0.262) (0.017) (0.115) (0.215)<br />
AR(4)-B 0.929 0.902 0.965 0.945 0.923 0.936<br />
(0.215) (0.121) (0.746) (0.318) (0.204) (0.499)<br />
Table 2: Point forecasts for US CPI inflation 1973Q1–2012Q4. The Root Mean Squared Error<br />
(RMSE) and the Mean Absolute Error (MAE) are expressed in relative terms with respect<br />
to the SW model. The forecast horizon is ‘h’. In brackets are the p-values of Giacomini and<br />
White’s (2006) test. Values in bold denote a significance at the 10% level.<br />
33


