The-Global-Sustainable-Competitiveness-Index-2015

You also want an ePaper? Increase the reach of your titles
YUMPU automatically turns print PDFs into web optimized ePapers that Google loves.
Summary<br />
<strong>Sustainable</strong><br />
Competitive<br />
Natural<br />
Capital<br />
Social<br />
Capital<br />
Intellectual<br />
Capital<br />
Resource<br />
Management<br />
Governance Spotlight Data<br />
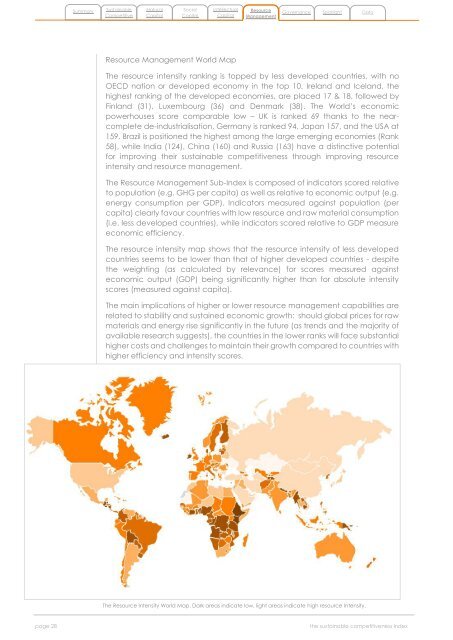
Resource Management World Map<br />
<strong>The</strong> resource intensity ranking is topped by less developed countries, with no<br />
OECD nation or developed economy in the top 10. Ireland and Iceland, the<br />
highest ranking of the developed economies, are placed 17 & 18, followed by<br />
Finland (31), Luxembourg (36) and Denmark (38). <strong>The</strong> World’s economic<br />
powerhouses score comparable low – UK is ranked 69 thanks to the nearcomplete<br />
de-industrialisation, Germany is ranked 94, Japan 157, and the USA at<br />
159. Brazil is positioned the highest among the large emerging economies (Rank<br />
58), while India (124), China (160) and Russia (163) have a distinctive potential<br />
for improving their sustainable competitiveness through improving resource<br />
intensity and resource management.<br />
<strong>The</strong> Resource Management Sub-<strong>Index</strong> is composed of indicators scored relative<br />
to population (e.g. GHG per capita) as well as relative to economic output (e.g.<br />
energy consumption per GDP). Indicators measured against population (per<br />
capita) clearly favour countries with low resource and raw material consumption<br />
(i.e. less developed countries), while indicators scored relative to GDP measure<br />
economic efficiency.<br />
<strong>The</strong> resource intensity map shows that the resource intensity of less developed<br />
countries seems to be lower than that of higher developed countries - despite<br />
the weighting (as calculated by relevance) for scores measured against<br />
economic output (GDP) being significantly higher than for absolute intensity<br />
scores (measured against capita).<br />
<strong>The</strong> main implications of higher or lower resource management capabilities are<br />
related to stability and sustained economic growth: should global prices for raw<br />
materials and energy rise significantly in the future (as trends and the majority of<br />
available research suggests), the countries in the lower ranks will face substantial<br />
higher costs and challenges to maintain their growth compared to countries with<br />
higher efficiency and intensity scores.<br />
<strong>The</strong> Resource Intensity World Map. Dark areas indicate low, light areas indicate high resource Intensity.<br />
page 28<br />
the sustainable competitiveness index