


Create successful ePaper yourself
Turn your PDF publications into a flip-book with our unique Google optimized e-Paper software.
<strong>AIMS</strong> <strong>ASSET</strong> <strong>MANAGEMENT</strong> <strong>SDN</strong> <strong>BHD</strong> (Co.Reg. 395862-P)<br />
Suite 10.3, 10 th Floor, West Wing, Rohas PureCircle, 9 Jalan P. Ramlee, 50450 Kuala Lumpur, Malaysia<br />
Tel: +603-2381-1660 / 2161-8722 Fax: +603-2381-1770 / 2161-8730<br />
14 October 2016<br />
Kuala Lumpur<br />
Market & Portfolio Review<br />
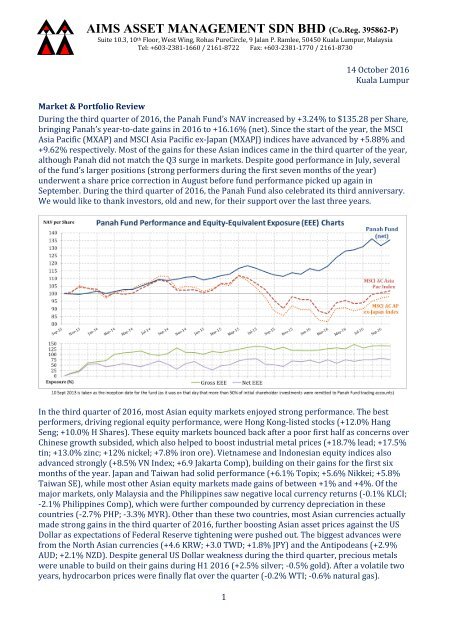
During the third quarter of 2016, the Panah Fund’s NAV increased by +3.24% to $135.28 per Share,<br />
bringing Panah’s year-to-date gains in 2016 to +16.16% (net). Since the start of the year, the MSCI<br />
Asia Pacific (MXAP) and MSCI Asia Pacific ex-Japan (MXAPJ) indices have advanced by +5.88% and<br />
+9.62% respectively. Most of the gains for these Asian indices came in the third quarter of the year,<br />
although Panah did not match the Q3 surge in markets. Despite good performance in July, several<br />
of the fund’s larger positions (strong performers during the first seven months of the year)<br />
underwent a share price correction in August before fund performance picked up again in<br />
September. During the third quarter of 2016, the Panah Fund also celebrated its third anniversary.<br />
We would like to thank investors, old and new, for their support over the last three years.<br />
In the third quarter of 2016, most Asian equity markets enjoyed strong performance. The best<br />
performers, driving regional equity performance, were Hong Kong-listed stocks (+12.0% Hang<br />
Seng; +10.0% H Shares). These equity markets bounced back after a poor first half as concerns over<br />
Chinese growth subsided, which also helped to boost industrial metal prices (+18.7% lead; +17.5%<br />
tin; +13.0% zinc; +12% nickel; +7.8% iron ore). Vietnamese and Indonesian equity indices also<br />
advanced strongly (+8.5% VN Index; +6.9 Jakarta Comp), building on their gains for the first six<br />
months of the year. Japan and Taiwan had solid performance (+6.1% Topix; +5.6% Nikkei; +5.8%<br />
Taiwan SE), while most other Asian equity markets made gains of between +1% and +4%. Of the<br />
major markets, only Malaysia and the Philippines saw negative local currency returns (-0.1% KLCI;<br />
-2.1% Philippines Comp), which were further compounded by currency depreciation in these<br />
countries (-2.7% PHP; -3.3% MYR). Other than these two countries, most Asian currencies actually<br />
made strong gains in the third quarter of 2016, further boosting Asian asset prices against the US<br />
Dollar as expectations of Federal Reserve tightening were pushed out. The biggest advances were<br />
from the North Asian currencies (+4.6 KRW; +3.0 TWD; +1.8% JPY) and the Antipodeans (+2.9%<br />
AUD; +2.1% NZD). Despite general US Dollar weakness during the third quarter, precious metals<br />
were unable to build on their gains during H1 2016 (+2.5% silver; -0.5% gold). After a volatile two<br />
years, hydrocarbon prices were finally flat over the quarter (-0.2% WTI; -0.6% natural gas).<br />
1
Panah’s +3.24% gain in Q3 2016 was achieved while running a net market exposure 1 of ~70-85%.<br />
This was slightly higher than has been the case historically, primarily because of a relatively large<br />
position in a Papua New Guinea LNG stock which was subject to a takeover bid (the investment<br />
case for this stock is described in the Q2 2016 letter to investors). This LNG company contributed<br />
around one-third of Q3 gains for the fund, as did the fund’s long-term holding in a Korean semiconductor<br />
equipment. Stocks in Vietnam also made a strong contribution to performance in the<br />
third quarter. Panah’s positions in Japan in aggregate made no overall contribution to returns over<br />
the quarter: smaller gainers were offset by a steep though healthy correction in one of the fund’s<br />
larger Japanese holdings (to which we added on weakness). The fund trimmed some of its<br />
outperforming gold stock positions earlier in Q3 (reallocating capital to less popular companies),<br />
so despite the violent sell-off in many gold stocks over the summer, Panah’s gold losers offset<br />
winners almost exactly over the quarter. The fund lost some money in HK-China, where the fund’s<br />
long value holdings came under pressure while short positions were squeezed.<br />
During the third quarter of the year, we made incremental rather than dramatic adjustments to the<br />
fund’s positioning. Early in Q3, Panah exited a modest position in a Hong Kong-listed value stock<br />
operating in the China retail sector; our divestment followed the resignation of the CEO and a loss<br />
of confidence in the company’s strategy. We also exited a small investment in a Thai financial<br />
company where we judged that management had been slow to deliver on turnaround plans, and<br />
that it would still take quite some time to set the company back on the right path. Although these<br />
stocks seemed cheap, the outlook for both was uncertain nonetheless, and we simply saw other<br />
investment opportunities as more compelling. We continued to add to core Vietnamese stock<br />
positions as lines of stock became available, increasing our position in a jewellery retailer after a<br />
correction in the stock price (this firm is described in our Q2 2016 letter to investors). We also<br />
doubled the size of our position in a well-managed Vietnamese conglomerate which operates in<br />
several sectors: as a mechanical and electrical engineering contractor, an air-con manufacturer, a<br />
real estate developer and landlord, and an investor in power and water infrastructure.<br />
In Japan, we continued to trim back the fund’s real estate stock holdings as the property cycle<br />
approaches a peak (as set out in our Q1 2016 letter to investors). Instead, we added to a<br />
longstanding holding in a Japanese consultancy company which also leverages its business<br />
expertise to make early-stage investments in smaller firms. Over the last year we have met several<br />
representatives of the company (in Japan and abroad), and are impressed by the ‘strength-indepth’<br />
of this firm’s employees, as well as their planning and execution ability. We also added to the<br />
fund’s largest Japanese holding, a power plant service company (described in the Q2 2016 letter to<br />
investors); the share price tumbled in August as the scandal-ridden parent company sold down<br />
part of its 60% stake in the firm. Although the market reaction was negative, we saw this partial<br />
divestment as good news, so added to our position at more attractive valuations.<br />
Later in the third quarter, after extremely strong liquidity-driven rallies in Asian and Emerging<br />
Markets, which seemed to be driven to a large degree by passive equity flows, 2 Panah increased its<br />
short positions in Hong Kong- and Japan-listed stocks. Many of these single stock shorts are on<br />
companies which operate in sectors subject to cyclical pressure and increasing competition, or<br />
with aggressive accounting policies which distort the economic fundamentals of these firms. (We<br />
have shorted several of these stocks before, in 2014 and 2015, before covering the positions in late<br />
2015 and early 2016 as stock markets fell.) As market volatility subsided towards the end of the<br />
third quarter, Panah also bought several cheap, out-of-the-money put options on individual stocks<br />
and indices with 3-6 months to expiry; this puts at risk ~80bps of NAV in return for substantial<br />
downside protection for the portfolio during a period when the market faces numerous risk events.<br />
1 Market exposure is stated in net ‘Equity-Equivalent Exposure’ (EEE) terms, which aggregates equity positions<br />
and adjusts non-equity positions (i.e. commodities, bonds, FX) for volatility and correlation to equities, to give a<br />
risk measure showing the Panah Fund’s equivalent exposure to equity markets.<br />
2 EM fund inflows hit a 58-week high in August: https://www.ft.com/content/4ff6670a-65c3-11e6-a08ac7ac04ef00aa.<br />
2
Portfolio Positioning<br />
In the Q1 2016 letter to investors we introduced the ‘Panah Portfolio Mind Map’, designed to help<br />
investors visualise the fund’s portfolio exposures. This received a positive reception, so we have<br />
updated the diagram and have appended it to the end of this letter. The fund’s three largest<br />
positions (each accounting for 6.5-8.5% of NAV) were described in the fund’s Q2 quarterly letter to<br />
investors: a Papua New Guinean LNG explorer; a Vietnamese jewellery retailer; and a Japanese<br />
plant service company. The top five holdings for the fund are rounded out by a Vietnamese<br />
conglomerate, and by a Japanese home centre retailer. We expect the LNG explorer will exit the<br />
portfolio sometime in the next month as a result of a successful takeover bid, although we do not<br />
anticipate any other major changes in the fund’s top holdings in the near future.<br />
At the end of the third quarter of 2016, there were no significant changes to the Panah Fund’s<br />
largest country exposures: Japan (34.2% gross, 26.4% net; consisting of ten stocks long and two<br />
stocks short), and Vietnam (33.8% gross + net; consisting of long positions in seven stocks and two<br />
closed-end funds). We presented the investment case for Japan in our Q1 2016 letter to investors…<br />
In summary, we think that despite an unenviable macro-economic backdrop – exacerbated by<br />
unpredictable and experimental monetary policy 3 – Japan has various redeeming features for<br />
equity investors. First, Japanese stocks tend to be less-widely covered by the sell-side compared to<br />
other countries in Asia, leading to more inefficiencies and thus opportunities for stock-pickers.<br />
Second, we think that the most important contribution of Abenomics might well have been the<br />
company stewardship and corporate governance codes; while progress has been slower than<br />
hoped, there have nonetheless been real improvements. Third, although foreigners have tended to<br />
be the swing equity market investors over the last decade, there is now much more involvement<br />
from domestic buyers, including the Bank of Japan and pension funds. Going forward, we expect<br />
this domestic constituency to provide more of a stabilising influence at times of market weakness,<br />
and also to get more involved in corporate governance issues. Finally, equities in Japan are cheap,<br />
and positive corporate governance pressure should help to unlock this value in coming years.<br />
The macro and investment outlook for Vietnam was set out in our Q2 2016 letter to investors…<br />
After runaway inflation, a credit bust followed in the period 2010-12; the bank recapitalisation<br />
process is now well underway, and Vietnam’s credit cycle is at a much earlier stage than in larger<br />
neighbouring SE Asian countries. Favourable demographics, cheap labour costs, and a good<br />
location near well-established trade routes mean that Vietnam is well placed to capture market<br />
share in low-end manufacturing. The recent surge in FDI and trade exports underline that over the<br />
coming decades, the country is well-placed to pursue the ‘Asian tiger’ export-manufacturing<br />
growth and urbanisation model. Vietnam’s recently signed international trade treaties provide a<br />
solid base, but it will be necessary for external conditions to remain stable in order for the country<br />
to fulfil its potential. Vietnam has been prone to boom-bust cycles in the past, and policymakers<br />
will have to work hard to maintain monetary and financial stability in the future.<br />
The size of Vietnam’s fiscal deficit is a concern, but the willingness of the new government to<br />
embrace reform is encouraging. In particular, we are impressed by the recent government<br />
decisions to divest of its 45% Vinamilk stake (shortly after the Foreign Ownership Limit for this<br />
stock was lifted), and to sell its stakes in the two SOE beer companies (Sabeco and Habeco) to the<br />
highest bidder. 4 This will not only reduce the fiscal deficit, but these brewers should also be run<br />
3 The latest policy initiatives from the Bank of Japan (announced on 21 September) involve: further equity<br />
purchases; enhanced ‘yield curve control’ (i.e. holding short rates negative but the 10yr bond at ~0%, presumably<br />
to reduce pressure on financial firms); and the removal of a time constraint for hitting a 2% CPI target (the<br />
monetary base will keep expanding until such time as the CPI target is exceeded). There has been a fairly subdued<br />
market reaction to such a radical announcement, perhaps because these initiatives present an uncertain path for<br />
monetary policy. Indeed, one could imagine a scenario of unlimited bond purchases (i.e. if bond yield rise) which<br />
might threaten currency stability, or even the tapering of bond purchases (e.g. in a higher inflation environment).<br />
4 http://www.scmp.com/business/companies/article/2012798/vietnam-sell-stake-prized-beer-companiessabeco-and-habeco.<br />
3
more efficiently with involvement from professional managers. Vietnam’s stock market valuations<br />
were extremely low last year; after a strong rally, multiples have now increased towards average<br />
valuations for Asian regional markets. Although certain areas of the Vietnamese market now do<br />
look frothy (e.g. real estate and certain small caps), the secular growth outlook remains strong.<br />
Given limited market liquidity and availability of stock, it makes sense to retain positions in<br />
attractive franchises with good long-term growth potential. New IPOs and SOE divestments will<br />
likely mean a reasonably strong supply of new stock hitting the market in 2017, which will require<br />
new investors to step up. If handled properly, increased liquidity should attract more international<br />
institutional investors, and help move Vietnam from MSCI Frontier status towards the MSCI<br />
Emerging Market Index. A virtuous cycle?<br />
With around one third of the portfolio in Japan, and another third in Vietnam, investors may be<br />
forgiven for asking whether Panah is pursuing a “barbell” strategy of ‘Japan value’ v ‘Vietnam<br />
growth’? This might seem a slick description of Panah’s allocations, though in reality this is not an<br />
accurate characterisation of portfolio positioning. In Japan, Vietnam, and indeed throughout our<br />
investment universe, we prioritise investing in well-managed companies with solid balance sheets,<br />
strong cash flows and respectable long-term growth prospects. Low valuations provide a necessary<br />
though not sufficient margin of safety, as it is also important to have an appreciation of why such<br />
market inefficiencies exist. While we favour ‘compounder’ companies which are able to reinvest<br />
their cash flows at a high rate of return over the long-haul, Panah also occasionally makes ‘deep<br />
value’ investments in companies with substantial ‘balance sheet protection’ (e.g. when net cash or<br />
net-net working capital exceed market cap) and where we are also fairly confident that a catalyst is<br />
imminent. We have made such deep value investments in various markets, including Japan,<br />
Vietnam, Taiwan, Hong Kong, and Papua New Guinea, and have also invested in compounders<br />
throughout the region. (On the Panah Fund Mind Map, dark green circles indicate stock positions<br />
with a deep value-catalyst investment thesis, whereas lighter green circles represent the similarly<br />
geographically-diversified ‘compounders’. However, note this classification is not always clear-cut!)<br />
There are no other major country concentrations in the portfolio; most other holdings are spread<br />
fairly evenly across other Asian markets. There is one notable sector allocation towards a selection<br />
of precious metal companies (accounting for 7.1% of NAV at end-Sept 2016, in five stocks). Since<br />
Panah started investing in the gold sector (in late 2015), we have become increasingly disillusioned<br />
with the quality of management in the sector. The managers of many gold-miners apparently find it<br />
hard to resist the siren song of avaricious investment bankers, hurrying to issue shares after any<br />
significant rally in their stock price, almost regardless of whether this is necessary or advisable<br />
from a business perspective. For long-suffering shareholders, all too often this means unnecessary<br />
dilution. As one experienced gold investor so memorably commented: “Gold companies issue more<br />
paper than the Fed!” Or, for that matter, any of the G3 central banks.<br />
We have little patience for weak gold mine managers and their ballooning share counts. Of the<br />
seven precious metal companies in which Panah has invested in 2016, the managers of three firms<br />
have displayed symptoms of premature issuance. In each case, our response has been to make our<br />
displeasure known, and then reduce and eventually divest of each holding, reallocating our profits<br />
towards positions in companies with a more attractive outlook, run by managers who demonstrate<br />
more restraint (we hope). As always, it helps if management also owns a reasonable amount of<br />
stock to give them ‘skin in the game’. Despite recent volatility in real interest rates and gold prices,<br />
we believe that there is a strong valuation and macro case for allocating a small part of the fund to<br />
precious metal stocks. However, we do not anticipate that the fund’s total allocation towards this<br />
sector will exceed the size of a single ‘conviction holding’ within the portfolio (i.e.
China: How I Learned to Stop Worrying and Love the Debt<br />
China is currently undergoing a brief cyclical upturn amid a longer-term structural slowdown in<br />
the economy. The most salient features of this upturn have been a sharp spike in real estate prices,<br />
and aggressive credit growth since the economy bottomed out in Q1 2015. After critical comments<br />
from an ‘authoritative person’ in May concerning unsustainable debt accumulation driving<br />
investment and growth, 5 foreign investors questioned whether the authorities would move to<br />
tighten macro policy, thereby crimping growth and increasing the probability of volatility in<br />
financial markets. A few months on, however, it is clear that President Xi Jinping’s ambitious 6.5%<br />
GDP growth target is intact. Apparently the most certain way to reach this goal is by keeping the<br />
credit taps turned on, regardless of the long-term costs of such a policy. Indeed, credit growth is<br />
still running at ~2.5x the pace of GDP growth, and so aggregate debt levels continue to increase. It<br />
is now widely accepted that China’s debt-to-GDP ratio has reached ~250%, a rise of more than<br />
100% since 2009. 6 There is no deleveraging in sight. Interest rates are being held at low levels to<br />
keep debt service costs under control.<br />
In the past we have likened the debt game in China to ‘whack-a-mole’, with the authorities<br />
struggling to keep up with the latest innovative forms of credit which pop up everywhere. Over the<br />
last two years, there has been a rapid increase in ‘non-loan assets’ on the balance sheets of the city<br />
commercial and joint stock banks, and in many cases these now exceed the size of these banks’ loan<br />
books. 7 These non-loan assets mostly take the form of ‘investments’ and ‘receivables’, and have<br />
often been created with help from Trusts and other Non-Bank Financial Institutions (NBFIs).<br />
Although these ‘non-loan assets’ might not be loans by name, by nature they are remarkably similar<br />
to loans. Unsurprisingly, the regulatory-mandated levels of disclosure regarding these quasi-loans,<br />
as well as recognition of impairments and required provisioning, are much less than for official<br />
loans. This presumably explains why China’s lower tier banks have been so keen to reclassify loans<br />
as instruments such as ‘Trust Beneficiary Rights’ and ‘Directional Asset Management Plans’. As a<br />
result, China’s weaker banks seem to be presenting a flattering view of their own asset quality,<br />
which also has implications for system-wide Non-Performing Loan (NPL) numbers.<br />
While China’s ‘big four’ state-owned commercial banks do not appear to have significant issues in<br />
this regard, many lower tier banks do appear to have problems. We recently identified one small<br />
bank with a shrinking loan book and an NPL ratio as low as 0.5%, but which has seen runaway<br />
growth of +73% in financial investments over the last year (exposed to real estate and resources in<br />
the north-east of China), which now account for ~50% of total assets (i.e. larger than the loan<br />
book). At the same time, this city commercial bank is experiencing funding issues and was recently<br />
forced to access an emergency liquidity line from the central bank. Despite these red flags, this<br />
institution (listed in Hong Kong) was recently trading at a price-to-book ratio of more than 1.0x. No<br />
matter what happens to the broader banking sector in China, we expect that it will be necessary for<br />
this bank to raise significant equity in the near-term, likely causing a substantial dilution for<br />
existing shareholders. The Panah Fund has recently established a short position on the stock.<br />
The Market-Cycle Diaries<br />
In previous letters to investors, we noted that China’s real estate cycle bottomed out in early 2015.<br />
So far this year (to the end of August), a record 875m sq m of property floor space has been sold in<br />
China, a year-on-year increase of +25.5% (this growth rate was as high as +36.5% at the end of<br />
April). House prices in Tier 1 cities, where supply has been tightest, have been rising at an average<br />
pace of ~30% year-on-year (with even more rapid rises in certain cities such as Shenzhen and<br />
Shanghai), while house prices in Tier 2 cities have been approaching double-digit average y-o-y<br />
5 This ‘authoritative person’ (presumed to be Liu He, an advisor to President Xi) published an article in the<br />
People’s Daily on 9 May. For highlights, see: http://www.bloomberg.com/news/articles/2016-05-09/china-sauthoritative-warning-on-debt-people-s-daily-excerpts.<br />
6 The experts differ on the exact numbers, but all of them now seem to agree that there is a problem:<br />
http://ftalphaville.ft.com/2016/10/12/2177069/in-search-of-chinas-hidden-credit/.<br />
7 Jason Bedford at UBS has been the most assiduous analyst of such developments within China’s banking system.<br />
5
gains. The price advances in Tier 3 cities have been much slower, only just creeping into positive y-<br />
o-y territory in Q2 2016, apparently reflecting higher inventory levels in China’s regional cities.<br />
During the last month there have been targeted tightening announcements in some Tier 1 cities<br />
where price advances have been most extreme (e.g. higher down-payments, and restrictions on<br />
buying second and third properties), but not across the entire country.<br />
Given elevated inventory levels in China’s lower tier cities, the rebound in housing starts has been<br />
much slower compared to previous real estate cycles, which in turn has been reflected in lacklustre<br />
demand for raw materials. Indeed, this seems to have been one of the main reasons that Chinese<br />
growth has been so slow to pick up despite the massive credit impulse over the last 18 months.<br />
Policymakers are still actively promoting inventory destocking across the country, and households<br />
have been encouraged to take on more debt to buy housing. More than 70% of new bank loans<br />
made in July and August were for new mortgages. 8 Such developments seem to imply that China’s<br />
authoritative person and his concerns over rapidly rising debt are being disregarded. Indeed,<br />
statements from other policymakers have emphasised that deleveraging is too risky, and even if<br />
corporate indebtedness seems high, there is still room for the central government and households<br />
to pick up the slack. 9 With such a view apparently gaining ascendancy, we see no reason that<br />
China’s credit-driven stimulus should stop any time soon.<br />
Even if China’s real estate market is now past its peak (with selective tightening measures being<br />
implemented in the frothiest regions), economic activity still seems likely to pick up in coming<br />
quarters in a ‘delayed reaction’, as property inventories finally fall and real estate developers get<br />
back to work. This should support demand for raw materials and support Chinese growth in the<br />
coming months. To some extent – given high valuations in onshore stocks, as well as the recent<br />
rally in HK stocks and most industrial metals – it might be said that China-related markets are<br />
already pricing in a cyclical rebound scenario. Indeed, the rally in commodity prices this year does<br />
seem to reflect a tighter supply-demand dynamic, and we would be unsurprised to see resource<br />
stocks make further gains in coming months. However, China’s wild stock market gyrations have<br />
seemed increasingly detached from fundamentals in recent years –how much sense does it make to<br />
ask whether equities reflect underlying economic growth and liquidity conditions?<br />
China’s domestic equity markets went on a tear from mid-2014, rallying aggressively for the next<br />
12 months even as most measures of Chinese activity and credit fell precipitously into early 2015.<br />
Towards the peak of this bubble, domestic markets also exerted a gravitational pull on Hong Kong<br />
stocks, which spiked in Q2 2015. Note that this does not seem to have been a case of equity prices<br />
moving ahead of the economy: stocks in China and HK peaked at the end of Q2 2015 before<br />
plunging over the next nine months, even as economic growth turned up. Part of the collapse in<br />
stock prices reflected a sudden loss of confidence in policymaker competence, given their role in<br />
inflating and supporting the 2015 stock bubble and then their notable lack of communication<br />
during the sudden Renminbi devaluation. Nonetheless, all too often China’s domestic stocks are led<br />
by sentiment and speculation (driving multiple expansion and contraction), rather than by<br />
earnings and fundamental data. Perhaps this is unsurprising given that broader monetary<br />
aggregates still dwarf the country’s equity market capitalisation, allowing money flows to reign<br />
supreme. Will Hong Kong now have to get used to this ‘casino’ dynamic as more channels open up<br />
for onshore capital to flow south? Maybe, but we hope that over time, the growing onshore<br />
institutional investor base will succeed in taming the market’s wildest excesses.<br />
Apocalypse When?<br />
Those predicting an imminent debt bust and a financial crisis in China have been frustrated by<br />
recent developments. When will the unsustainable debt accumulation come to an end? What will<br />
force a ‘final reckoning’? In most debt crises, it is not just the absolute level of debt which causes a<br />
8 http://www.reuters.com/article/us-china-economy-loans-idUSKCN11K15T.<br />
9 http://www.bloomberg.com/news/articles/2016-06-23/china-rapid-deleveraging-can-bring-new-risks-says-<br />
government.<br />
6
meltdown, but rather a rapid increase in debt over a short period of time, funded by liability<br />
positions which prove to be unstable and trigger a crisis when they are unwound. Many Emerging<br />
Market debt crises have involved a massive rise in external liabilities (i.e. foreign currency debt),<br />
but when these lenders realise that this debt cannot be serviced, the withdrawal of foreign capital<br />
causes a collapse in the exchange rate and domestic asset prices (e.g. the 1997 Asian Crisis).<br />
Although China’s authorities came close to triggering widespread capital flight early in 2016, on<br />
balance this sort of crisis seems less likely for China in the near-term given the substantial fall in<br />
the country’s cross-border net liabilities from late 2014 to early 2016, 10 as well as the substantial<br />
tightening of capital controls since earlier this year. 11 (However, that is not to say that banks and<br />
other financial institutions in US Dollar-pegged Hong Kong won’t suffer as the credit quality of their<br />
cross-border debt exposures to mainland China deteriorates, and as the Renminbi weakens.)<br />
Another flavour of debt crisis involves an unsustainable build-up in domestic debt, increasingly<br />
funded by short-term and unstable liabilities, until a ‘Minsky Moment’ arrives to trigger the crisis<br />
(e.g. the 2008 Lehman Crisis, characterised by a mismatch between longer-term poor quality<br />
mortgage-assets, and short-term wholesale financing liabilities). We would not rule out such a<br />
crisis in China at some point, given the recent proliferation of short-term liabilities within NBFIs,<br />
together with their complex and growing links to China’s lower tier banks. A lack of reliable data<br />
means that it is difficult to predict in advance exactly when a crisis of this sort might occur, and so<br />
we think it makes more sense to focus on early-warning signs. 12 Real estate serves as collateral for<br />
most loans, so property prices are an important determinant of asset quality. Given the vital role<br />
that debt plays in greasing the wheels of the economy (and allowing property prices to levitate), a<br />
contraction in credit presents serious risks, and we are extremely sensitive to potential policy<br />
errors arising from ‘overtightening’. It is thus important to keep an eye on broader credit<br />
aggregates and regulatory initiatives (e.g. to rein in NBFIs or bring quasi-debt back on bank balance<br />
sheets), and monitor the more vulnerable and opaque parts of the system, e.g. corporate bond<br />
yields and default rates, as well as asset quality and funding stress among weaker banks and NBFIs.<br />
If these are the risks, we also see plenty of things to be optimistic about as long-term equity<br />
investors in the Greater China region. The opening up of the Shanghai and Shenzhen stock markets<br />
to foreign investors should, over time, provide numerous interesting investment opportunities. The<br />
Shanghai-Hong Kong Stock Connect currently allows northbound investors to access 686 stocks<br />
with a total market capitalisation of US ~$3.9t, while the Shenzhen-Hong Kong Connect launch,<br />
slated for late 2016, will bring more investment opportunities. 13 We have started to do our<br />
homework on various China domestic-listed stocks that match the fund’s quality criteria. It is still<br />
early days, but as yet we have not found any quality domestic China stocks trading at sufficiently<br />
attractive valuations for us to get involved. Our work continues nonetheless, and we are cautiously<br />
confident that in the coming months and years we will be able to find good quality domesticallylisted<br />
China stocks trading at valuations which also provide a sufficient margin of safety.<br />
In the meantime, our long exposure to China consists of two ‘deep value’ positions in China stateowned<br />
enterprises (in shipping and telecoms) where we are also hopeful of imminent stockspecific<br />
catalysts. We also have a small position in a niche Taiwanese consumer company which has<br />
10 Many Chinese companies paid down their US Dollar loans over this period, exchanging them for Renminbi debt.<br />
For more details, see: http://www.bis.org/publ/qtrpdf/r_qt1603u.htm.<br />
11 Despite the tightening of capital controls, it is interesting to note that capital outflows still continue (albeit in<br />
smaller size since the Renminbi panic subsided). China has a current account surplus and should be accumulating<br />
US ~$250b in foreign exchange reserves a year. However, forex reserves have been flat (rather than rising) since<br />
the Renminbi panic subsided in Q1 2016, which suggests that outflows continue, albeit in smaller size.<br />
12 Some commentators have predicted that a crisis is still many years away, as the Loan-to-Deposit Ratio (LDR) for<br />
China’s financial system is substantially lower than for other countries which have experienced debt crises in the<br />
past. However, we do not have strong confidence in this approach, not least because there is wide variation in the<br />
figures for system-wide LDRs calculated by different economists (presumably because of data issues), and since<br />
China also has somewhat unusual and convoluted financial market ‘plumbing’.<br />
13 This compares to 3,905 listed stocks in Japan with a combined market cap of US $5.8t.<br />
7
ecently launched what we anticipate will be a successful expansion to Mainland China. Offsetting<br />
these long positions, we have various single stock shorts on HK-listed firms which we think will<br />
come under pressure as the credit cycle progresses, and which in some cases have also adopted<br />
aggressive accounting policies which we think do not reflect the underlying economic<br />
fundamentals of their businesses.<br />
Thoughts on the last three years, and what to expect for the next three…<br />
Panah’s recent birthday has been a time for reflection on what has changed in the markets and in<br />
our investment approach over the last three years. I moved to Malaysia to set up the Panah Fund in<br />
May 2013, which was also the month when Asian equities tumbled by ~15% – the so-called ‘Taper<br />
Tantrum’ – as investors panicked that the Federal Reserve was about to tighten monetary policy<br />
aggressively. By the time that Panah was born in September 2013, Asian equity markets were in<br />
the midst of a sharp rebound. Since that time, the Fed has only succeeded in raising interest rates<br />
on one occasion (by a meagre 0.25%), and the regional MSCI Asian equity index is flat. Instead, the<br />
big global investment stories have instead been all about the dominance of US Dollar-denominated<br />
assets, as well as the extraordinary central bank-fuelled rally in G3 bonds. That’s not to say it has<br />
been impossible to make money in Asia during this period. Since 2013, the notable Asian equity<br />
market outperformers have been the Indian stock market (from late-2013 to early-2015), China’s<br />
Shenzhen index (from mid-2014 to mid-2015), and Vietnam (in 2016), all of which have returned<br />
more than 35% in USD-terms. In an uncertain world, it pays to be selective.<br />
One of our recurring concerns over the last three years has been that overly loose monetary policy,<br />
in all so-called Developed Markets and many Emerging Markets too, has managed to inflate asset<br />
prices and also perpetuate excess capacity in numerous industries by delaying the exit of<br />
overleveraged and uncompetitive firms. Looking out of the window here in Kuala Lumpur as I<br />
write, this point is forcefully illustrated by the preponderance of empty tower blocks and cranes<br />
dotting the horizon. It is also true of other sectors in other countries. But this has been the case for<br />
quite some time, so when will these imbalances correct? What to expect for the next three years?<br />
Perhaps the best investment scenario we can hope for is ‘more of the same’, with loose monetary<br />
allowing equity valuations to drift slowly higher, even if growth disappoints. However, there are<br />
various reasons that such a benign outlook might prove to be too optimistic. Even if the current US<br />
expansion approaches the length of the previous longest post-war expansion on record (1991-<br />
2001), a US recession at some point in the next three years does not seem unlikely. Such a<br />
downturn might well be triggered by more monetary tightening from the Federal Reserve, which<br />
seems likely to increase interest rates again within the next couple of quarters. A resurgence in<br />
stagflation (i.e. a combination of higher inflation and lacklustre growth) would present serious<br />
challenges to monetary policymakers, with the potential to trigger a more aggressive tightening<br />
cycle than markets are currently expecting. The fragile nature of China’s debt-fuelled expansion<br />
raises the stakes, and increases the likelihood of a global downturn when imbalances do start to<br />
correct. More generally, increases in inequality around the world are fuelling scepticism about<br />
globalisation. Increased geopolitical tensions further increase uncertainty.<br />
Whereas the response to the Great Financial Crisis of 2008 has been dominated by aggressive<br />
action from central banks, there is now a growing perception that the negative side-effects of their<br />
policies are unacceptable. The response to a future downturn will likely involve more heavy-lifting<br />
from G3 fiscal authorities (if indeed this does not begin before the next recession), with a<br />
reasonable chance of seeing an attempt at coordinated fiscal and monetary policy. The key question<br />
would then be whether sovereign bond markets respond favourably to such developments, which<br />
will probably vary country-by-country depending on perceptions of fiscal sustainability.<br />
Given the uncertain and potentially hostile investment outlook, we reaffirm Panah’s bias towards<br />
investing in well-run companies with solid balance sheets, strong cash flows, respectable long-term<br />
growth prospects, and reasonable valuations. Over the last three years, it has struck us how hard it<br />
is to find firms which genuinely fit these criteria. When we do find such companies, and as we get to<br />
8
know management better and build conviction in our investment thesis, we have become<br />
increasingly comfortable to build larger position sizes. As for stock-specific shorts, Panah has had<br />
mixed success since inception. We have made money from ‘capital cycle’ shorts on companies<br />
operating in excess capacity industries. However, we have lost money by shorting expensive stocks<br />
with strong investor followings; even negative catalysts rarely seem to do much damage for long, as<br />
these stocks tumble briefly before trading back up to higher multiples. Over the last year, we have<br />
put more effort into finding single stock shorts on companies with questionable accounting<br />
techniques which we think misrepresent the economic realities of the business. We have had some<br />
initial modest success in this area, and will continue to persevere in the expectation that the size of<br />
the ‘bezzle’ 14 will become apparent in the next downturn. The fund’s small allocation towards gold<br />
stocks should be seen as a tail-hedge with substantial portfolio utility. Finally, we have found that<br />
well-placed macro hedges not only provide capital protection, but can also pay off at just the right<br />
time, allowing Panah to reinvest hedging profits into core long positions during a market<br />
correction when many of these core holdings are trading at more attractive valuations.<br />
No matter what the next three years hold, we have little doubt that the investment journey will be<br />
an interesting one with plenty of unexpected twists and turns along the way. Panah will proceed<br />
with prudence.<br />
Andrew Limond<br />
Disclaimer… This document contains general information on <strong>AIMS</strong> Asset Management Sdn Bhd (“<strong>AIMS</strong>”) and the Panah Fund (“the Fund”). This<br />
presentation is not an offer to sell nor a solicitation of an offer to purchase interests of the Fund. <strong>AIMS</strong> reserves the right to change any terms of the<br />
offering at any time. Offers and sales of interests in the Fund will be made only pursuant to a confidential Private Offering Memorandum, complete<br />
documentation of the relevant Fund and in accordance with the applicable securities laws, and this presentation is qualified in its entirety by reference<br />
to such documentation, including the risk factors and conflicts of interest disclosure set forth therein. This presentation is strictly confidential and<br />
intended exclusively for the use of the person to whom it was delivered by the Manager. This presentation may not be reproduced or redistributed in<br />
whole or in part.<br />
The content of this presentation is for information purposes only and is directed at institutional, professional and sophisticated investors able to<br />
understand and accept the risks involved. It has been prepared using publicly available information, internally developed data and other sources<br />
believed to be reliable. It does not constitute an offer or solicitation to any person in any jurisdiction to purchase or sell any investment, nor does it<br />
constitute investment advice. Whilst <strong>AIMS</strong> has used all reasonable endeavours to ensure that the information in this presentation is accurate and up-todate,<br />
it gives no warranties or representations as to the reliability, accuracy and completeness of any such information. <strong>AIMS</strong> accepts no liability for<br />
any damage or loss, whether direct, indirect or consequential, in respect of any use of or reliance on the content of this presentation. The views<br />
expressed and the information contained in this presentation may be subject to change at any time without notice. This document is intended for the<br />
sole use of the intended recipients and its content may not be copied, published or otherwise distributed.<br />
Investment risks… An investment in the Fund is speculative and involves a high degree of risk. Past performance of a fund is no indication of future<br />
performance. Investment results may vary substantially over time and there can be no certainty that the investment objectives of the Fund will be<br />
achieved. The Fund discussed in this presentation may not be suitable for all investors. The value of investments and the income from them cannot be<br />
guaranteed. Investors may not get back the full amount invested. Rates of exchange may cause the value of investments to rise or fall. The assets of the<br />
Fund mentioned in this presentation may be in a variety of currencies and currency fluctuations may therefore affect the value of an investor’s holding.<br />
Please refer to the Private Offering Memorandum for a more comprehensive statement of risks associated with the Fund. If you require information<br />
about the suitability of the Fund, you are advised to seek independent financial advice.<br />
Jurisdictional notice… The material in this presentation is directed only at entities or persons in jurisdictions or countries where access to and use of<br />
this information is not contrary to local laws or regulations. It is the responsibility of each individual investor to be aware of and to observe all<br />
applicable laws and regulations of any relevant jurisdiction.<br />
Information for investors in the United Kingdom… In the UK, this communication is only available to and directed at persons who are “investment<br />
professionals” or “high net worth companies, unincorporated associations, etc.”, as defined in Article 19 and Article 49 of the FSMA 2000 (Financial<br />
Promotion) Order 2005 (as amended). Only persons falling within these definitions are able to invest in the Panah Fund. If you do not fall within these<br />
definitions, you should alert <strong>AIMS</strong> Asset Management of this, and should not place any reliance on this communication or act upon it. This<br />
communication has not been approved by an authorised person in the UK.<br />
Information for investors in Switzerland… Representative: The representative in Switzerland is PVB Pernet von Ballmoos AG, Bellerivestrasse 20,<br />
8008 Zurich.Paying Agent: The paying agent in Switzerland is Neue Helvetische Bank, Seefeldstrasse 215, 8008 Zurich. Reference point of important<br />
documents: The fund’s legal documents (e.g. private offering memorandum, articles of association) as well as its audited financial statements may be<br />
obtained free of charge from the representative. Place of performance and court of jurisdiction: In respect of the units sold in and distributed from<br />
Switzerland, the place of performance and the court of jurisdiction have been established at the registered office of the representative. Domicile of the<br />
fund: Cayman Islands.<br />
14 https://www.project-syndicate.org/commentary/asset-bubbles-price-boom-by-john-kay-1-2015-<br />
10?barrier=true.<br />
9
Panah Portfolio Mind Map<br />
Q3 2016<br />
Digitalisation<br />
of automobiles<br />
Smartphone<br />
Commoditisation<br />
TECH<br />
Ageing<br />
society<br />
JAPAN<br />
Corporate<br />
governance reforms<br />
Retail<br />
Power<br />
Electricity market<br />
liberalisation<br />
Closedend<br />
Funds<br />
VIETNAM<br />
Power &<br />
Utilities<br />
Trade treaties<br />
Construction<br />
& Real Estate<br />
FDI<br />
Infrastructure<br />
Investment<br />
Semi-con<br />
Evolution<br />
Security<br />
concerns<br />
Real Estate<br />
Consulting<br />
VC<br />
IT<br />
Positive<br />
demographics<br />
Japan QE & NIRP<br />
Shipping<br />
CHINA<br />
SOE reform<br />
Telco<br />
Long position<br />
DM Monetary<br />
Policy<br />
Precious Metals<br />
Real Estate, Banks,<br />
Retail<br />
Pharma<br />
Jewellery<br />
Retail<br />
Long (deep value)<br />
SINGAPORE & HK<br />
Short position<br />
Size of bubbles represents<br />
approximate size of position<br />
Consolidation<br />
in oil and gas<br />
LNG<br />
M&A<br />
RESOURCES<br />
Renminbi<br />
China Structural<br />
Slowdown<br />
US Interest<br />
Rates<br />
Thematic<br />
stocks with<br />
problems<br />
EM GROWTH<br />
Mature<br />
credit cycle<br />
Consumption<br />
growth