nex-ar2015-full

You also want an ePaper? Increase the reach of your titles
YUMPU automatically turns print PDFs into web optimized ePapers that Google loves.
Strong financial performance<br />
Front cover<br />
One of our new German trains departs Cologne<br />
station – a key destination for our new rail services.<br />
Read more about them on page 48–49<br />
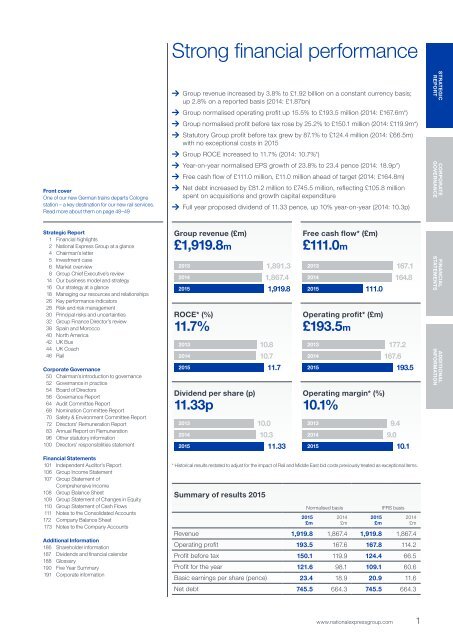
Group revenue increased by 3.8% to £1.92 billion on a constant currency basis;<br />
up 2.8% on a reported basis (2014: £1.87bn)<br />
Group normalised operating profit up 15.5% to £193.5 million (2014: £167.6m*)<br />
Group normalised profit before tax rose by 25.2% to £150.1 million (2014: £119.9m*)<br />
Statutory Group profit before tax grew by 87.1% to £124.4 million (2014: £66.5m)<br />
with no exceptional costs in 2015<br />
Group ROCE increased to 11.7% (2014: 10.7%*)<br />
Year-on-year normalised EPS growth of 23.8% to 23.4 pence (2014: 18.9p*)<br />
Free cash flow of £111.0 million, £11.0 million ahead of target (2014: £164.8m)<br />
Net debt increased by £81.2 million to £745.5 million, reflecting £105.8 million<br />
spent on acquisitions and growth capital expenditure<br />
Full year proposed dividend of 11.33 pence, up 10% year-on-year (2014: 10.3p)<br />
STRATEGIC<br />
REPORT<br />
CORPORATE<br />
GOVERNANCE<br />
Strategic Report<br />
1 Financial highlights<br />
2 National Express Group at a glance<br />
4 Chairman’s letter<br />
5 Investment case<br />
6 Market overview<br />
8 Group Chief Executive’s review<br />
14 Our business model and strategy<br />
16 Our strategy at a glance<br />
18 Managing our resources and relationships<br />
26 Key performance indicators<br />
28 Risk and risk management<br />
30 Principal risks and uncertainties<br />
32 Group Finance Director’s review<br />
38 Spain and Morocco<br />
40 North America<br />
42 UK Bus<br />
44 UK Coach<br />
46 Rail<br />
Corporate Governance<br />
50 Chairman’s introduction to governance<br />
52 Governance in practice<br />
54 Board of Directors<br />
56 Governance Report<br />
64 Audit Committee Report<br />
68 Nomination Committee Report<br />
70 Safety & Environment Committee Report<br />
72 Directors’ Remuneration Report<br />
83 Annual Report on Remuneration<br />
96 Other statutory information<br />
100 Directors’ responsibilities statement<br />
Financial Statements<br />
101 Independent Auditor’s Report<br />
106 Group Income Statement<br />
107 Group Statement of<br />
Comprehensive Income<br />
108 Group Balance Sheet<br />
109 Group Statement of Changes in Equity<br />
110 Group Statement of Cash Flows<br />
111 Notes to the Consolidated Accounts<br />
172 Company Balance Sheet<br />
173 Notes to the Company Accounts<br />
Additional Information<br />
186 Shareholder information<br />
187 Dividends and financial calendar<br />
188 Glossary<br />
190 Five Year Summary<br />
191 Corporate information<br />
Group revenue (£m)<br />
£1,919.8m<br />
Free cash flow* (£m)<br />
£111.0m<br />
2013<br />
1,891.3 2013<br />
2014<br />
1,867.4 2014<br />
2015 1,919.8 2015<br />
111.0<br />
ROCE* (%)<br />
11.7%<br />
Operating profit* (£m)<br />
£193.5m<br />
167.1<br />
164.8<br />
2013<br />
10.8<br />
2013<br />
177.2<br />
2014<br />
10.7<br />
2014<br />
167.6<br />
2015 11.7 2015<br />
193.5<br />
Dividend per share (p)<br />
11.33p<br />
2013<br />
2014<br />
10.0<br />
10.3<br />
11.33<br />
Operating margin* (%)<br />
10.1%<br />
9.4<br />
9.0<br />
2015 2015<br />
10.1<br />
* Historical results restated to adjust for the impact of Rail and Middle East bid costs previously treated as exceptional items.<br />
Summary of results 2015<br />
2013<br />
2014<br />
Normalised basis<br />
2015<br />
£m<br />
2014<br />
£m<br />
2015<br />
£m<br />
IFRS basis<br />
Revenue 1,919.8 1,867.4 1,919.8 1,867.4<br />
Operating profit 193.5 167.6 167.8 114.2<br />
Profit before tax 150.1 119.9 124.4 66.5<br />
Profit for the year 121.6 98.1 109.1 60.6<br />
Basic earnings per share (pence) 23.4 18.9 20.9 11.6<br />
Net debt 745.5 664.3 745.5 664.3<br />
2014<br />
£m<br />
FINANCIAL<br />
STATEMENTS<br />
ADDITIONAL<br />
INFORMATION<br />
www.nationalexpressgroup.com<br />
1