

A new urban paradigm pathways to sustainable development
PiF37
PiF37

Create successful ePaper yourself
Turn your PDF publications into a flip-book with our unique Google optimized e-Paper software.
Cities are the engines of global progress:<br />
they can act as economic engines<br />
for entire countries 1<br />
by Richard Florida 2<br />
The 21 st century, we increasingly recognise,<br />
will be a century of cities. Today, some<br />
3.5 billion people, roughly half the world’s<br />
population, live in cities and <strong>urban</strong> areas.<br />
As recently as 200 years ago, only about 3<br />
per cent of the world’s population did.<br />
By 1900, after a century of industrialisation,<br />
the <strong>urban</strong> share of the population had risen<br />
<strong>to</strong> roughly 15 per cent. The world’s <strong>urban</strong><br />
population is projected <strong>to</strong> almost triple over<br />
the next century or so, peaking at nearly 10<br />
billion people, roughly 85 per cent of a <strong>to</strong>tal<br />
population of between 11 and 12 billion<br />
(Fuller and Romer 2013). To put all this in<br />
perspective, consider that in 1800 there was<br />
only one city in the world—Beijing—whose<br />
population exceeded 1 million people. In<br />
1900, a century later, there were 12. By 1950,<br />
the number had increased sevenfold <strong>to</strong> 83,<br />
and by 2005 it had ballooned <strong>to</strong> 400.<br />
Today, there are more than 500. 3<br />
Economists and <strong>urban</strong>ists have long<br />
noted the powerful connection between<br />
<strong>urban</strong>isation and economic <strong>development</strong>,<br />
but that connection may be breaking<br />
down <strong>to</strong>day. For the past several centuries,<br />
<strong>urban</strong>isation has been society’s premier<br />
engine of cultural, technological, political<br />
and economic progress. But the long-held<br />
connection between <strong>urban</strong>isation and<br />
growth that has shaped the <strong>development</strong> of<br />
the advanced cities and nations of the West<br />
has become much more tenuous in <strong>to</strong>day’s<br />
rapidly <strong>urban</strong>ising regions, a trend that has<br />
been dubbed ‘<strong>urban</strong>isation without growth’.<br />
The profound divide between the less<br />
advantaged cities of the developing world<br />
and their more affluent counterparts<br />
in advanced nations can be gauged by<br />
comparing cities and metropolitan areas<br />
by what is perhaps the most basic metric<br />
for economic <strong>development</strong>: —the amount<br />
of economic output produced by each<br />
person. Using data from the Brookings<br />
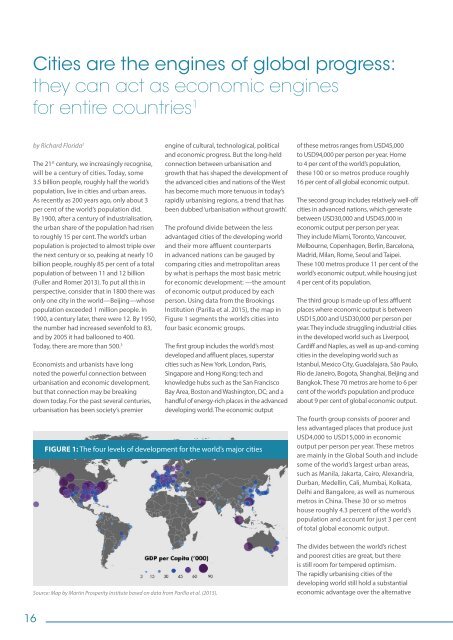
Institution (Parilla et al. 2015), the map in<br />
Figure 1 segments the world’s cities in<strong>to</strong><br />
four basic economic groups.<br />
The first group includes the world’s most<br />
developed and affluent places, superstar<br />
cities such as New York, London, Paris,<br />
Singapore and Hong Kong; tech and<br />
knowledge hubs such as the San Francisco<br />
Bay Area, Bos<strong>to</strong>n and Washing<strong>to</strong>n, DC; and a<br />
handful of energy-rich places in the advanced<br />
developing world. The economic output<br />
FIGURE 1: The four levels of <strong>development</strong> for the world’s major cities<br />
Source: Map by Martin Prosperity Institute based on data from Parilla et al. (2015).<br />
of these metros ranges from USD45,000<br />
<strong>to</strong> USD94,000 per person per year. Home<br />
<strong>to</strong> 4 per cent of the world’s population,<br />
these 100 or so metros produce roughly<br />
16 per cent of all global economic output.<br />
The second group includes relatively well-off<br />
cities in advanced nations, which generate<br />
between USD30,000 and USD45,000 in<br />
economic output per person per year.<br />
They include Miami, Toron<strong>to</strong>, Vancouver,<br />
Melbourne, Copenhagen, Berlin, Barcelona,<br />
Madrid, Milan, Rome, Seoul and Taipei.<br />
These 100 metros produce 11 per cent of the<br />
world’s economic output, while housing just<br />
4 per cent of its population.<br />
The third group is made up of less affluent<br />
places where economic output is between<br />
USD15,000 and USD30,000 per person per<br />
year. They include struggling industrial cities<br />
in the developed world such as Liverpool,<br />
Cardiff and Naples, as well as up-and-coming<br />
cities in the developing world such as<br />
Istanbul, Mexico City, Guadalajara, São Paulo,<br />
Rio de Janeiro, Bogota, Shanghai, Beijing and<br />
Bangkok. These 70 metros are home <strong>to</strong> 6 per<br />
cent of the world’s population and produce<br />
about 9 per cent of global economic output.<br />
The fourth group consists of poorer and<br />
less advantaged places that produce just<br />
USD4,000 <strong>to</strong> USD15,000 in economic<br />
output per person per year. These metros<br />
are mainly in the Global South and include<br />
some of the world’s largest <strong>urban</strong> areas,<br />
such as Manila, Jakarta, Cairo, Alexandria,<br />
D<strong>urban</strong>, Medellin, Cali, Mumbai, Kolkata,<br />
Delhi and Bangalore, as well as numerous<br />
metros in China. These 30 or so metros<br />
house roughly 4.3 percent of the world’s<br />
population and account for just 3 per cent<br />
of <strong>to</strong>tal global economic output.<br />
The divides between the world’s richest<br />
and poorest cities are great, but there<br />
is still room for tempered optimism.<br />
The rapidly <strong>urban</strong>ising cities of the<br />
developing world still hold a substantial<br />
economic advantage over the alternative<br />
16