Clinical Laboratory Tests: Which, Why, and What Do ... - LabMedicine
Clinical Laboratory Tests: Which, Why, and What Do ... - LabMedicine
Clinical Laboratory Tests: Which, Why, and What Do ... - LabMedicine

You also want an ePaper? Increase the reach of your titles
YUMPU automatically turns print PDFs into web optimized ePapers that Google loves.
<strong>Clinical</strong> <strong>Laboratory</strong> <strong>Tests</strong>:<br />
<strong>Which</strong>, <strong>Why</strong>, <strong>and</strong> <strong>What</strong> <strong>Do</strong> The Results Mean?<br />
Frank H. Wians, Jr., PhD, MT(ASCP), DABCC, FACB<br />
(Department of Pathology, University of Texas Southwestern Medical Center, Dallas, TX)<br />
DOI: 10.1309/LM4O4L0HHUTWWUDD<br />
Abstract<br />
According to Dr. Michael Laposata, the medical<br />
specialty that nearly every practicing physician<br />
relies on every day, for which training in many<br />
medical schools is limited to no more than a<br />
scattered few lectures throughout the entire<br />
curriculum, is “laboratory medicine.” The<br />
After reading this paper, readers should be able to describe the<br />
“laboratory testing cycle” <strong>and</strong> discuss the potential sources of error<br />
that can occur in each phase of this cycle. Readers should also be able<br />
to describe the general principles for selecting the most appropriate<br />
laboratory test based on its diagnostic performance characteristics.<br />
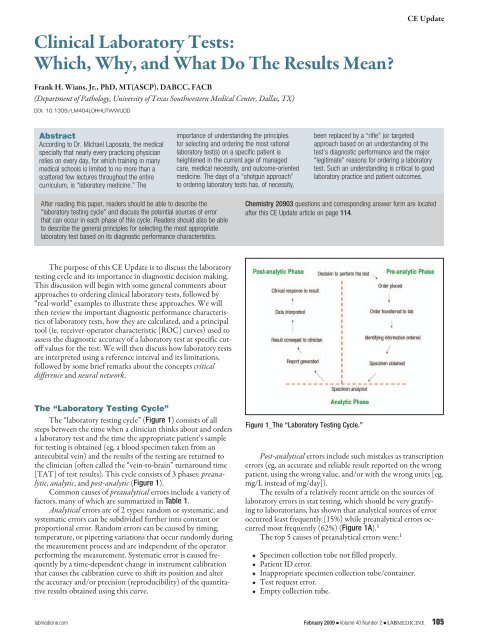
The purpose of this CE Update is to discuss the laboratory<br />
testing cycle <strong>and</strong> its importance in diagnostic decision making.<br />
This discussion will begin with some general comments about<br />
approaches to ordering clinical laboratory tests, followed by<br />
“real-world” examples to illustrate these approaches. We will<br />
then review the important diagnostic performance characteristics<br />
of laboratory tests, how they are calculated, <strong>and</strong> a principal<br />
tool (ie, receiver-operator characteristic [ROC] curves) used to<br />
assess the diagnostic accuracy of a laboratory test at specific cutoff<br />
values for the test. We will then discuss how laboratory tests<br />
are interpreted using a reference interval <strong>and</strong> its limitations,<br />
followed by some brief remarks about the concepts critical<br />
difference <strong>and</strong> neural network.<br />
The “<strong>Laboratory</strong> Testing Cycle”<br />
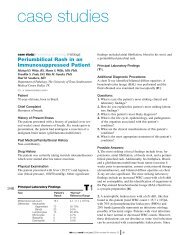
The “laboratory testing cycle” (Figure 1) consists of all<br />
steps between the time when a clinician thinks about <strong>and</strong> orders<br />
a laboratory test <strong>and</strong> the time the appropriate patient’s sample<br />
for testing is obtained (eg, a blood specimen taken from an<br />
antecubital vein) <strong>and</strong> the results of the testing are returned to<br />
the clinician (often called the “vein-to-brain” turnaround time<br />
[TAT] of test results). This cycle consists of 3 phases: preanalytic,<br />
analytic, <strong>and</strong> post-analytic (Figure 1).<br />
Common causes of preanalytical errors include a variety of<br />
factors, many of which are summarized in Table 1.<br />
Analytical errors are of 2 types: r<strong>and</strong>om or systematic, <strong>and</strong><br />
systematic errors can be subdivided further into constant or<br />
proportional error. R<strong>and</strong>om errors can be caused by timing,<br />
temperature, or pipetting variations that occur r<strong>and</strong>omly during<br />
the measurement process <strong>and</strong> are independent of the operator<br />
performing the measurement. Systematic error is caused frequently<br />
by a time-dependent change in instrument calibration<br />
that causes the calibration curve to shift its position <strong>and</strong> alter<br />
the accuracy <strong>and</strong>/or precision (reproducibility) of the quantitative<br />
results obtained using this curve.<br />
importance of underst<strong>and</strong>ing the principles<br />
for selecting <strong>and</strong> ordering the most rational<br />
laboratory test(s) on a specific patient is<br />
heightened in the current age of managed<br />
care, medical necessity, <strong>and</strong> outcome-oriented<br />
medicine. The days of a “shotgun approach”<br />
to ordering laboratory tests has, of necessity,<br />
CE Update<br />
been replaced by a “rifle” (or targeted)<br />
approach based on an underst<strong>and</strong>ing of the<br />
test’s diagnostic performance <strong>and</strong> the major<br />
“legitimate” reasons for ordering a laboratory<br />
test. Such an underst<strong>and</strong>ing is critical to good<br />
laboratory practice <strong>and</strong> patient outcomes.<br />
Chemistry 20903 questions <strong>and</strong> corresponding answer form are located<br />
after this CE Update article on page 114.<br />
Figure 1_The “<strong>Laboratory</strong> Testing Cycle.”<br />
Post-analytical errors include such mistakes as transcription<br />
errors (eg, an accurate <strong>and</strong> reliable result reported on the wrong<br />
patient, using the wrong value, <strong>and</strong>/or with the wrong units [eg,<br />
mg/L instead of mg/day]).<br />
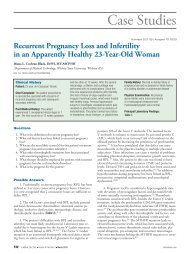
The results of a relatively recent article on the sources of<br />
laboratory errors in stat testing, which should be very gratifying<br />
to laboratorians, has shown that analytical sources of error<br />
occurred least frequently (15%) while preanalytical errors occurred<br />
most frequently (62%) (Figure 1A). 1<br />
The top 5 causes of preanalytical errors were: 1<br />
• Specimen collection tube not filled properly.<br />
• Patient ID error.<br />
• Inappropriate specimen collection tube/container.<br />
• Test request error.<br />
• Empty collection tube.<br />
labmedicine.com February 2009 j Volume 40 Number 2 j LABMEDICINE 105
CE Update<br />
Table 1_Examples of Common Causes of Preanalytical<br />
Error<br />
Biological<br />
Age<br />
Sex<br />
Race (Blacks vs. Caucasians)<br />
Behavioral<br />
Diet<br />
Obesity<br />
Smoking<br />
Alcohol intake<br />
Caffeine intake<br />
Exercise<br />
Stress<br />
<strong>Clinical</strong> (2 0 Alterations)<br />
Diseases:<br />
Hypothyroidism<br />
Insulin-dependent diabetes mellitus<br />
Nephrotic syndrome/chronic renal failure<br />
Biliary tract obstruction<br />
Acute myocardial infarction<br />
Drug Therapy:<br />
Diuretics<br />
Propanolol<br />
Oral contraceptives with high [progestin]<br />
Oral contraceptives with high [estrogen]<br />
Prednisolone<br />
Cyclosporine<br />
Pregnancy<br />
Specimen Collection & H<strong>and</strong>ling<br />
Specimen obtained from wrong patient*<br />
Specimen mix-up*<br />
Nonfasting vs. fasting (12 h)<br />
Anticoagulant:<br />
EDTA<br />
Heparin<br />
Capillary vs. venous blood<br />
Hemoconcentration (eg, use of a tourniquet)<br />
Specimen storage (@ 0–4 °C for up to 4 days)<br />
*Common sources of preanalytical error; however, frequency decreasing with advent of better<br />
quality assurance (QA) procedures to ensure positive patient ID <strong>and</strong> labeling of specimen tubes.<br />
Although 75.6% of all sources (preanalytical, analytical,<br />
or post-analytical) of laboratory errors had no effect on patient<br />
outcomes, ~25% had a negative impact, indicating much opportunity<br />
to reduce laboratory errors to Six Sigma levels (ie, < 3.4<br />
errors/1 million opportunities) or near perfection. 1,2<br />
Figure 1A_<strong>Laboratory</strong> errors in stat testing. Adapted from Ref 1.<br />
Diagnostic Decision Making<br />
The use of clinical laboratory test results in diagnostic decision<br />
making is an integral part of clinical medicine. The menu<br />
of laboratory tests available to clinicians constitutes an impressive<br />
array that has exp<strong>and</strong>ed exponentially since 1920 when<br />
Folin <strong>and</strong> Wu devised the first useful test for the quantification<br />
of serum glucose concentration. 3 The current list of tests offered<br />
by one major reference laboratory includes nearly 3,000<br />
analytes, which does not include the additional array of more<br />
commonly ordered tests (eg, complete blood count [CBC], electrolytes<br />
[sodium, potassium, chloride, carbon dioxide], thyroid<br />
stimulating hormone [TSH], glucose, etc.) routinely performed<br />
on site by most hospital-based clinical laboratories. Despite this<br />
ever-exp<strong>and</strong>ing plethora of useful <strong>and</strong> reliable clinical laboratory<br />
tests for diagnosing <strong>and</strong> monitoring the myriad of diseases<br />
effecting mankind, the recent emphasis on reducing health<br />
care costs <strong>and</strong> the emergence of managed care organizations led<br />
to efforts to reduce the abuse (over-ordering) <strong>and</strong> misuse (eg,<br />
ordering the right test for the wrong purpose or vice versa) of<br />
these tests.<br />
Medical Necessity<br />
As private health maintenance organizations (HMOs) <strong>and</strong><br />
government-sponsored agencies (eg, Department of Health <strong>and</strong><br />
Human Services [DHHS] <strong>and</strong> the Centers for Medicare <strong>and</strong><br />
Medicaid Services [CMS]) seek to provide quality medicine cost<br />
effectively, reduction in the ordering of “unnecessary” laboratory<br />
tests has become a favorite target of these efforts. The critical<br />
question facing physicians, however, is: <strong>What</strong> constitutes an<br />
unnecessary laboratory test? In the current climate of businessoriented<br />
medicine, the answer should not be: Any test for<br />
which reimbursement by a payer (eg, Medicare) is likely to be<br />
denied. The correct answer is: Any test for which the results are<br />
not likely to be “medically necessary” in the appropriate management<br />
of the patient’s medical condition. Thus, it is incumbent<br />
upon physicians <strong>and</strong> laboratorians to underst<strong>and</strong> which laboratory<br />
tests are appropriate to order in the diagnosis <strong>and</strong> follow up<br />
of a patient’s medical condition.<br />
Questions to Ask Before Ordering a<br />
<strong>Laboratory</strong> Test<br />
An underst<strong>and</strong>ing of which laboratory tests are appropriate<br />
to order in the diagnosis <strong>and</strong> follow up of a patient’s medical<br />
condition should include prior consideration of the answers to<br />
the following questions: 4<br />
• <strong>Why</strong> is the test being ordered?<br />
• <strong>What</strong> are the consequences of not ordering the test?<br />
• How good is the test in discriminating between health<br />
versus disease?<br />
• How are the test results interpreted?<br />
• How will the test results influence patient management <strong>and</strong><br />
outcome?<br />
The answers to these questions are critical to the optimal<br />
selection <strong>and</strong> cost-effective use of laboratory tests likely to<br />
benefit patient management. A major misconception among<br />
clinicians is the feeling that a laboratory test is more objective<br />
than a patient’s history <strong>and</strong> physical examination. Nevertheless,<br />
it is widely accepted that the judicious use of laboratory tests,<br />
106 LABMEDICINE j Volume 40 Number 2 j February 2009 labmedicine.com
coupled with thoughtful interpretation of the results of these<br />
tests, can contribute significantly to diagnostic decision making<br />
<strong>and</strong> patient management.<br />
Reasons for Ordering a <strong>Laboratory</strong> Test<br />
There are 4 major legitimate reasons for ordering a laboratory<br />
test: 4<br />
1. Diagnosis (to rule in or rule out a diagnosis).<br />
2. Monitoring (eg, the effect of drug therapy).<br />
3. Screening (eg, for congenital hypothyroidism via neonatal<br />
thyroxine testing).<br />
4. Research (to underst<strong>and</strong> the pathophysiology of a<br />
particular disease process).<br />
Approaches for Establishing a Diagnosis<br />
Based on <strong>Laboratory</strong> Test Results<br />
The principal approaches for establishing a diagnosis based<br />
on laboratory test results include: 4<br />
• Hypothesis deduction.<br />
• Pattern recognition.<br />
• Medical algorithms.<br />
• Rifle versus shotgun approach.<br />
Hypothesis deduction involves establishing a differential<br />
diagnosis based on the patient’s history, including family, social,<br />
<strong>and</strong> drug history, <strong>and</strong> physical exam findings, followed by the<br />
selection of laboratory tests that are the most likely to confirm<br />
(ie, allow the clinician to deduce) a diagnosis on the list of differential<br />
diagnoses.<br />
Example 1_Hypothesis deduction approach to laboratory<br />
test ordering: A 4-year-old child presents to the emergency<br />
room (ER) with an upper respiratory tract infection (URI),<br />
fever (102.2°F), <strong>and</strong> generalized seizures lasting 2 min. The<br />
clinician establishes a differential diagnosis of meningitis versus<br />
febrile seizures <strong>and</strong> deduces that the most appropriate laboratory<br />
tests to discriminate between these possibilities are the<br />
following tests performed on cerebrospinal fluid (CSF) from a<br />
spinal tap:<br />
• White blood cell (WBC) <strong>and</strong> red blood cell (RBC) counts.<br />
• Total protein.<br />
• Glucose.<br />
• Gram stain.<br />
• Bacterial, viral, <strong>and</strong>/or fungal cultures.<br />
• Rapid polymerase chain reaction (PCR) assay for a<br />
meningococcus-specific insertion sequence (IS).<br />
All results for these tests were either “normal,” “negative,”<br />
or “no growth” (cultures), supporting a diagnosis of febrile seizure<br />
over bacterial, viral, or fungal meningitis.<br />
Pattern recognition involves comparing the patient’s pattern<br />
of results for several laboratory tests that have been determined<br />
previously to provide excellent power in discriminating<br />
between various competing <strong>and</strong>/or closely related diagnoses<br />
(Table 2). The pattern of laboratory test results shown for<br />
the pregnant “Patient” in Table 2 most closely match those<br />
Table 2_Example of Pattern Recognition Approach<br />
to Diagnosis<br />
CE Update<br />
PT, prothrombin time; APTT, activated partial thromboplastin time; AST, aspartate<br />
aminotransferase; ALT, alanine aminotransferase; LD, lactate dehydrogenase; BUN,<br />
blood urea nitrogen; RBC, red blood cell; N, normal; LN, low-normal; ↓, decreased; ↑,<br />
increased, ↑↑↑, markedly increased; +/-, may be positive or negative; -, negative<br />
consistent with a diagnosis of idiopathic thrombocytopenic<br />
purpura (ITP), rather than other possible causes of pregnancyassociated<br />
thrombocytopenia: gestational thrombocytopenic<br />
(GTP); thrombotic thrombocytopenia (TTP); hemolytic uremic<br />
syndrome (HUS); disseminated intravascular coagulation<br />
(DIC); or, (syndrome of) hemolysis, elevated liver enzymes, <strong>and</strong><br />
low platelet count (HELLP).<br />
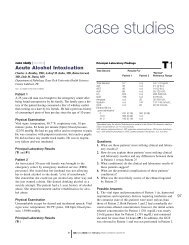
Medical algorithms (or “decision trees”) are particularly<br />
useful in establishing a diagnosis based, in part, on information<br />
obtained from ordering the most appropriate (ie, necessary)<br />
laboratory tests. Such algorithms (cf., Figures 2 <strong>and</strong> 2.1) are<br />
advantageous because they:<br />
Figure 2_Simplified algorithm for the diagnosis of a monoclonal<br />
gammopthy versus asymptomatic multiple myeloma versus active<br />
multiple myeloma (Source: Mayo Communique. 2002;27:2).<br />
labmedicine.com February 2009 j Volume 40 Number 2 j LABMEDICINE 107
CE Update<br />
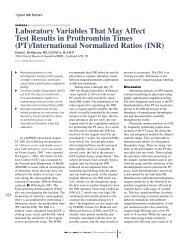
Figure 2.1_Algorithm for identifying individuals with thyroid disorders based on TSH level.<br />
TSH, thyroid-stimulating hormone; fT 4 , free thyroxine; NTI, nonthyroid illness; T 3 , trilodothyronine;<br />
HyperT, hyperthyroidism; HypoT, hypothyroidism.<br />
• are logical <strong>and</strong> sequential;<br />
• can be automated using a computer to achieve rapid<br />
turnaround time of results for tests included in the<br />
algorithm;<br />
• maximize a clinician’s efficiency;<br />
• minimize the ordering of unnecessary laboratory tests;<br />
• can be used by ancillary medical personnel (eg, physician<br />
assistants <strong>and</strong> nurse practitioners) assisting physicians;<br />
• can be easily updated with improved strategies for diagnostic<br />
decision making as new <strong>and</strong> better tests become available; <strong>and</strong><br />
• are incorporated into software programs that are relatively<br />
inexpensive to purchase <strong>and</strong> use.<br />
The rifle versus shotgun approach to laboratory test ordering<br />
relates to ordering specific laboratory tests based on an assessment<br />
of their diagnostic accuracy <strong>and</strong> predictive value in identifying<br />
a particular disease (ie, using a “rifle” to hit the bulls-eye<br />
representing the correct diagnosis) versus indiscriminate ordering<br />
of a large number of laboratory tests that may or may not have<br />
adequate diagnostic accuracy <strong>and</strong> predictive value in identifying<br />
a particular disease (ie, using a “shotgun” to hit the target, which<br />
is likely to create a pattern of shots on the target, none of which<br />
may hit the bulls-eye). Ordering the following 20 laboratory (<strong>and</strong><br />
other) tests on a 4-year-old child with signs <strong>and</strong> symptoms of an<br />
upper respiratory tract infection, fever (102.2 °F), <strong>and</strong> generalized<br />
seizure lasting 2 min represents a shotgun—<strong>and</strong> very<br />
expensive—approach to arriving at a diagnosis:<br />
WBC count w/differential<br />
Quantitative immunoglobulins (IgG, IgA, IgM)<br />
Erythrocyte sedimentation rate (ESR)<br />
Quantitative alpha-1-antitrypsin (AAT) level<br />
Retic count<br />
Arterial blood gasses (ABGs)<br />
Throat culture<br />
Sweat chloride<br />
Nasal smear for eosinophils<br />
Nasopharyngeal culture for<br />
pertussis infection<br />
Viral cultures<br />
Stool exam for ova <strong>and</strong> para-<br />
sites (O & P)<br />
Urinalysis<br />
Purified protein derivative<br />
(tuberculin) (PPD)/<br />
trichophyton/cocci<br />
skin tests<br />
Electrolytes<br />
Glucose<br />
Total bilirubin<br />
Aspartate aminotransferase<br />
(AST)<br />
Alanine aminotransferase<br />
(ALT)<br />
Chest X-ray (×3)<br />
Electrocardiogram (ECG)<br />
A rifle approach would involve<br />
ordering only those laboratory tests<br />
useful in discriminating between<br />
the diseases constituting the differential<br />
diagnosis (ie, meningitis<br />
or febrile seizure) as indicated in<br />
Example 1 above (ie, the 7 to 9 “targeted” tests on CSF).<br />
<strong>Clinical</strong> Performance Characteristics of<br />
<strong>Laboratory</strong> <strong>Tests</strong><br />
Because the clinical performance characteristics of all<br />
laboratory tests differ with respect to their diagnostic accuracy<br />
(ie, sensitivity <strong>and</strong> specificity), the selection of the appropriate<br />
laboratory test to order will vary depending on the purpose for<br />
which the test is to be used. Before considering this aspect of the<br />
selection of laboratory tests, we must first underst<strong>and</strong> the terms<br />
that describe their diagnostic performance. These terms include<br />
prevalence, sensitivity, specificity, efficiency, <strong>and</strong> predictive<br />
value. To illustrate the mathematical calculation of values for<br />
each of these parameters, consider the example given below: 4,5<br />
Example 2_The laboratory test, prostate-specific antigen<br />
(PSA), was studied with regard to its ability to discriminate patients<br />
with prostate cancer (PCa) from those without PCa. This<br />
test was performed on 10,000 men, 200 of whom have biopsyproven<br />
prostate cancer. Using this information, a 2 x 2 table can<br />
be constructed as shown below:<br />
No. of Men No. of Men<br />
With PCa Without PCa Total<br />
No. of men with positive a 160 6,860 7,020<br />
PSA test (TP) (FP)<br />
No. of men with negative b 40 2,940 2,980<br />
PSA test (FN) (TN)<br />
Total 200 9,800 10,000<br />
a Positive PSA test = men with a serum PSA concentration ≥ 4.0 ng/mL<br />
b Negative PSA test = men with a serum PSA concentra-tion < 4.0 ng/mL<br />
108 LABMEDICINE j Volume 40 Number 2 j February 2009 labmedicine.com
From this data, the values for prevalence, sensitivity, specificity,<br />
efficiency, positive predictive value (PPV), <strong>and</strong> negative<br />
predictive value (NPV) can be determined:<br />
Prevalence (p) = No. of individuals with disease/No. of<br />
individuals in population to be tested<br />
= 200/10,000 = 0.020 = 2.0%<br />
Sensitivity = percentage of individuals with disease who have<br />
a positive test result = No. of true-positives/(No. of truepositives<br />
+ No. of false-negatives) or TP/(TP + FN)<br />
= 160/(160 + 40) = 160/200 = 0.800 = 80%<br />
Specificity = percentage of individuals without disease who have<br />
a negative test result = No. of true-negatives/(No. of truenegatives<br />
+ No. of false-positives) or TN/(TN + FP)<br />
= 2,940/(2,940 + 6,860) = 2,940/9,800 = 0.30 = 30%<br />
Efficiency =percentage of individuals correctly classified by<br />
test results as being either positive or negative for the<br />
disease = (TP + TN)/(TP + FP + FN + TN) = (160 +<br />
2,940)/10,000 = 3,100/10,000 = 0.31 = 31%<br />
Positive Predictive Value (PPV) = percentage of individuals with<br />
a positive test result who truly have the disease = TP/(TP +<br />
FP) = 160/(160 + 6,860) = 160/7,020 = 0.023 = 2.3%, or<br />
PPV = (sensitivity)(p)/[(sensitivity)(p) + (1 - specificity)<br />
(1 - p) = (0.8)(0.02/[(0.8)(0.02) + (1 - 0.3)( 1 - 0.02)] =<br />
0.016/[0.016 + (0.7)(0.98)] = 0.016/[0.016 + 0.686] =<br />
0.016/0.702 = 0.023 = 2.3%<br />
Negative Predictive Value (NPV) = percentage of individuals<br />
with a negative test result who do not have the disease =<br />
TN/(TN + FN) = 2,940/(2,940 + 40) = 2,940/2,980 =<br />
0.987 = 98.7%, or NPV =(specificity)(1 - p)/[(specificity)<br />
(1 - p) + (1 - sensitivity)(p)] = (0.3)(1 - 0.02)/[(0.3)(1 -<br />
0.02) + (1 - 0.8)(0.02)] = 0.294/0.298 = 0.987 = 98.7%<br />
Sum of Sensitivity <strong>and</strong> Specificity = 80 + 30 = 110 (Note:<br />
In general, a useful laboratory test will have a sum >170)<br />
It is important to note that any test with a sensitivity =<br />
50% <strong>and</strong> a specificity = 50% is no better than a coin toss in<br />
deciding whether or not a disease may be present. <strong>Tests</strong> with a<br />
combined sensitivity <strong>and</strong> specificity total = 170 or greater are<br />
likely to prove clinically useful. Most clinicians can achieve this<br />
total with a good history <strong>and</strong> physical examination! Thus, a<br />
laboratory test with 95% sensitivity <strong>and</strong> 95% specificity (sum =<br />
190) is an excellent test.<br />
The poor PPV (2.3%) in the example above makes it appear<br />
as if even good laboratory tests (which PSA is) are relatively<br />
useless. If the test is used selectively, however, for example on a<br />
population of individuals likely to have a disease (eg, a population<br />
in which the prevalence of disease is high), many laboratory<br />
tests have excellent PPVs. The effect of prevalence on predictive<br />
value is demonstrated in Table 2.<br />
How do physicians increase the predictive value of laboratory<br />
tests? By appropriately selecting patients on whom the test<br />
is performed (ie, by maximizing the prevalence of disease in the<br />
population sampled). In the example cited above, performing<br />
PSA testing on men over age 50 years improves the PPV of PSA<br />
since the prevalence of prostate cancer increases from
CE Update<br />
Figure 2.2_Dramatic representation of diagnostic sensitivity <strong>and</strong><br />
specificity using the analyte prostate-specific antigen (PSA) as<br />
an example.<br />
Lastly, it is important to remember that knowing the sensitivity<br />
(ie, positivity in disease) <strong>and</strong> specificity (ie, negativity in<br />
health or non-disease) of a test is of limited value because these<br />
parameters represent the answer to the question: <strong>What</strong> is the<br />
probability of a patient having a positive test result if this patient<br />
has disease X? The more challenging question facing clinicians,<br />
however, is: <strong>What</strong> is the probability of this patient having<br />
disease X if the test result is positive (or negative)? 5 The reader<br />
is referred to reference 5 for a statistical briefing on how to estimate<br />
the probability of disease using likelihood ratios.<br />
Receiver-Operator Characteristic (ROC) Curves<br />
Receiver- (or relative-) operator characteristic (ROC)<br />
curves provide another useful tool in assessing the diagnostic<br />
accuracy of a laboratory test, because all (specificity, sensitivity)<br />
pairs for a test are plotted. The principal advantage of ROC<br />
curves is their ability to provide information on test performance<br />
at all decision thresholds. 3,6<br />
Typically, a ROC curve plots the false-positive rate (FPR =<br />
1 - specificity) versus the true-positive rate (TPR = sensitivity).<br />
The clinical usefulness or practical value of the information provided<br />
by ROC curves in patient care may vary, however, even<br />
for tests that have good discriminating ability (ie, high sensitivity<br />
<strong>and</strong> specificity at a particular decision threshold). This may<br />
occur for several reasons:<br />
• False-negative results may be so costly that there is no cutoff<br />
value for the test that provides acceptable sensitivity <strong>and</strong><br />
specificity.<br />
• The cost of the test <strong>and</strong>/or the technical difficulty in<br />
performing the test may be so high that its availability is<br />
limited.<br />
• Less invasive or less expensive tests may provide similar<br />
information.<br />
• The hardship (eg, financial <strong>and</strong>/or physical) associated<br />
with the test may cause patients to be unwilling to submit<br />
to the test.<br />
A test with 100% sensitivity <strong>and</strong> 100% specificity in discriminating<br />
prostatic cancer from benign prostatic hyperplasia<br />
(BPH) <strong>and</strong> prostatitis at all decision thresholds would be represented<br />
by the y-axis <strong>and</strong> the line perpendicular to the y-axis at<br />
a sensitivity of 1.0 = 100% in a square plot of FPR versus TPR<br />
(Figure 2.3A).<br />
A test for which the specificity <strong>and</strong> sensitivity pairs sum to<br />
exactly 100% at all decision thresholds would be represented by<br />
the diagonal of the square (Figure 2.3A) <strong>and</strong> represents a test<br />
with no clinical value.<br />
Thus, in qualitatively comparing 2 or more tests in their<br />
ability to discriminate between 2 alternative states of health<br />
using ROC curves, the test associated with the curve that is displaced<br />
further toward the upper left-h<strong>and</strong> corner of the ROC<br />
curve has better discriminating ability (ie, a cutoff value for the<br />
test can be chosen that yields higher sensitivity <strong>and</strong>/or specificity)<br />
than tests associated with curves that lie below this curve. A<br />
more precise quantitative estimate of the superiority of one test<br />
over another can be obtained by comparing the area-under-thecurve<br />
(AUC) for each test <strong>and</strong> applying statistics to determine<br />
the significance of the difference between AUC values.<br />
Figure 2.3_ROC curves for (A)<br />
perfect test (– – –), AUC=1.0;<br />
log prostate-specific antigen<br />
(PSA) concentration in discriminating<br />
organ-confined prostate<br />
cancer from benign prostatic<br />
hyperplasia (——), AUC=0.66<br />
(95% confidence interval, 0.60–<br />
0.72); test with no clinical value<br />
(-----), AUC=0.50. (B) Prostatic<br />
acid phosphatase (PAP) <strong>and</strong><br />
PSA in differentiating prostate<br />
cancer from benign prostatic<br />
hyperplasia <strong>and</strong> prostatitis at<br />
various cutoff values (indicated<br />
adjacent to points on each of<br />
the curves). Reproduced with<br />
permission from Nicoll CD,<br />
Jeffrey JG, Dreyer J. Clin Chem.<br />
1993;39:2540–2541.<br />
110 LABMEDICINE j Volume 40 Number 2 j February 2009 labmedicine.com
The AUC (range: 0.5 to 1.0) is a quantitative representation<br />
of overall test accuracy, where values from 0.5 to 0.7 represent<br />
low accuracy, values from 0.7 to 0.9 represent tests that are<br />
useful for some purposes, <strong>and</strong> values >0.9 represent tests with<br />
high accuracy. The ROC curve (AUC = 0.66; 95% confidence<br />
interval: 0.60–0.72) in Figure 2.3A demonstrates that PSA has<br />
only modest ability in discriminating BPH from organ-confined<br />
prostate cancer.<br />
However, other data using ROC curves to assess the ability<br />
of the tumor markers, prostatic acid phosphatase (PAP) <strong>and</strong><br />
prostate specific antigen (PSA), to differentiate prostate cancer<br />
from BPH <strong>and</strong> prostatitis at various cutoff values is illustrated<br />
in Figure 2.3B. Qualitatively, the ROC curve corresponding to<br />
PSA is displaced further toward the upper left-h<strong>and</strong> corner of<br />
the box than the curve for PAP. Quantitatively, the AUC values<br />
for PSA <strong>and</strong> PAP are 0.86 <strong>and</strong> 0.67, respectively. Thus, both<br />
qualitative <strong>and</strong> quantitative ROC analysis demonstrates that<br />
PSA provides better discrimination than PAP in distinguishing<br />
men with prostate cancer from those with BPH or prostatitis.<br />
Moreover, the diagnostic accuracy (ie, sensitivity <strong>and</strong> specificity)<br />
of PSA in providing this discrimination is higher (AUC =<br />
0.86) in Figure 2.3B than in Figure 2.3A (AUC = 0.66), probably<br />
due to differences in the study designs represented by the<br />
data shown in each panel of Figure 2.3.<br />
Reference Interval for Interpreting <strong>Laboratory</strong><br />
Test Results<br />
Once a clinical laboratory test with the appropriate diagnostic<br />
accuracy has been ordered, how are the results of the test<br />
interpreted? Typically, a reference interval or a decision level is<br />
used, against which the patient’s test value is compared. Decision<br />
level refers to a particular cutoff value for an analyte or test that<br />
enables individuals with a disorder or disease to be distinguished<br />
from those without the disorder or disease. Moreover, if the diagnostic<br />
accuracy of the test <strong>and</strong> the prevalence of the disease in<br />
a reference population are known, then the predictive value of<br />
the decision level for the disorder or disease can be determined.<br />
Reference interval relates to the values for an analyte (eg,<br />
PSA, glucose, etc.), determined on a defined population of<br />
“healthy” individuals, that lie between the lower <strong>and</strong> the upper<br />
limits that constitute 95% of all values. Thus, an analyte value less<br />
than the lower limit of the reference interval would be classified<br />
as abnormally low, while any value greater than the upper limit of<br />
the reference interval would be classified as abnormally high, <strong>and</strong><br />
values in between these limits would be classified as “normal.” For<br />
example, after establishing the status of a population of individuals<br />
as “healthy,” using such methods as history, physical exam, <strong>and</strong><br />
findings other than the test being evaluated, the reference interval<br />
for PSA, using many different assays, is typically stated as 0.0 ng/<br />
mL to 4.0 ng/mL. Thus, 95% of healthy men have a serum PSA<br />
concentration between these limits.<br />
Although many laboratories publish the lower limit of a<br />
reference interval as “0,” no analytical assay is capable of measuring<br />
a concentration precisely equal to 0 with high reproducibility.<br />
All quantitative assays have a finite lower limit of detection<br />
(LLD), distinct from 0, that more precisely constitutes the<br />
lower limit of the reference interval when this lower limit encompasses<br />
0. For many PSA assays, the LLD is typically 0.05<br />
ng/mL. Therefore, any PSA value less than 0.05 ng/mL would<br />
be reported appropriately as “less than 0.05 ng/mL” <strong>and</strong> not<br />
as 0.0 ng/mL. In addition, it is important to remember that<br />
CE Update<br />
reference intervals for an analyte are method dependent (ie, the<br />
reference interval established using one method cannot automatically<br />
be substituted for that of a different assay that measures<br />
the same analyte).<br />
Since reference intervals for all analytes are based typically<br />
on the limits for the analyte that include 95% of all values<br />
obtained on healthy individuals with the assumption that the<br />
distribution of these values is Gaussian (or “bell-shaped”), it is<br />
important to recognize that 5% (or 1 out of 20; ie, the 2.5% of<br />
healthy individuals with analyte values in the left tail of the data<br />
distribution <strong>and</strong> the 2.5% of healthy individuals with analyte<br />
values in the right tail of the distribution when the reference<br />
interval is defined as the limits of the 2.5th <strong>and</strong> 97.5th percentiles<br />
of the distribution of all analyte values obtained on healthy<br />
individuals) of healthy individuals will have values outside these<br />
limits, either low or high (Figure 2.4).<br />
Thus, reference intervals are intended to serve as a guideline<br />
for evaluating individual values <strong>and</strong>, for many analytes,<br />
information on the limits of an analyte for a population of<br />
Figure 2.4_Example of a Gaussian (or bell-shaped) distribution of test<br />
values in which ~68% of the values are between the mean (µ) ± 1<br />
st<strong>and</strong>ard deviation (σ); ~95% are between µ ± 2σ; <strong>and</strong>, ~99% are<br />
between µ ± 3σ.<br />
Figure 2.5_Example of a distribution of laboratory test values for an<br />
analyte (ie, the liver enzyme, gamma-glutamyl transferase [GGT]) for<br />
which the data are not Gaussian distributed.<br />
labmedicine.com February 2009 j Volume 40 Number 2 j LABMEDICINE 111
CE Update<br />
individuals with the disease or diseases the test was designed<br />
to detect is even more informative. Also, it is important to recognize<br />
that values for some analytes in a population of healthy<br />
individuals may not be Gaussian distributed.<br />
Figure 2.5 provides an illustration of this point applicable<br />
to the analyte, gamma-glutamyl transferase (GGT), in which<br />
the data is positively skewed. The reference interval for this data<br />
must be determined using a non-parametric statistical approach<br />
that does not make the assumption that the data is Gaussian<br />
distributed.<br />
Lastly, to accurately interpret test results, it may be necessary<br />
to know gender-specific <strong>and</strong>/or age-stratified reference<br />
intervals since the values for many analytes vary with developmental<br />
stage or age. For example, alkaline phosphatase, an<br />
enzyme produced by osteoblasts (bone-forming cells), would be<br />
expected to be higher in a healthy 10- to 12-year-old during puberty<br />
<strong>and</strong> the growth spurt (ie, increased bone formation during<br />
lengthening of the long bones) that normally accompanies<br />
puberty in adolescent males <strong>and</strong> females than those observed in<br />
a prepubertal or elderly individual.<br />
Ideally, the best reference interval for an analyte would<br />
be individual-specific such that the value for the analyte, determined<br />
when the individual is ill, could be compared with the<br />
limits for this analyte, established on this same individual, when<br />
he or she was healthy or without the illness. For obvious reasons,<br />
it is difficult, if not impossible, to obtain such reference intervals.<br />
Thus, population-based reference intervals offer the most<br />
cost-effective <strong>and</strong> rational alternative. When using populationbased<br />
reference intervals, however, it is critical that members of<br />
the reference population be free of any obvious or overt disease,<br />
especially diseases likely to affect the analyte for which the reference<br />
interval is being determined. For example, when determining<br />
a reference interval for TSH (also known as thyrotropin), it<br />
is critically important that the population of individuals tested<br />
be free of any pituitary or thyroid disease likely to affect the<br />
pituitary-hypothalamic-thyroid axis, which, under the action of<br />
the thyroid hormones tri- (T3) <strong>and</strong> tetraiodothyronine (T4),<br />
exert regulatory control over circulating levels of TSH.<br />
Critical Difference Between Consecutive<br />
<strong>Laboratory</strong> Test Results<br />
Since physicians frequently order the same test at multiple<br />
time points during the course of the patients’ management,<br />
they are faced with the challenge of interpreting when the<br />
magnitude of the change in values for an analyte constitutes<br />
a significant change (or critical difference [CD]) that may (or<br />
should) affect medical decision making (eg, trigger a change in<br />
therapy, such as increasing or decreasing a drug dosage). Quantitative<br />
values for all analytes are affected by both imprecision<br />
(ie, lack of reproducibility) in the measurement of the analyte<br />
<strong>and</strong> intra-individual variation over time in the concentration of<br />
the analyte due to normal physiologic mechanisms (ie, biological<br />
variation) that are independent of any disease process. For<br />
example, the analyte cortisol, a glucocorticoid produced by the<br />
adrenal cortex that is important in glucose homeostasis, normally<br />
displays diurnal variation. Blood cortisol levels begin to<br />
rise during the early morning hours, peak at mid-morning, <strong>and</strong><br />
then decline throughout the day to their lowest level between<br />
8 pm <strong>and</strong> midnight. In patients with Cushing’s syndrome, this<br />
diurnal variation is lost <strong>and</strong> blood cortisol levels remain elevated<br />
throughout the day.<br />
The degree of imprecision (ie, lack of reproducibility) in<br />
the quantitative measurement of any analyte is given by the<br />
magnitude of the coefficient of variation (CV), expressed usually<br />
as a percent, obtained from multiple measurements of the<br />
analyte using the formula: %CV = (SD/mean) × 100; where<br />
mean <strong>and</strong> SD are the mean <strong>and</strong> st<strong>and</strong>ard deviation of the values<br />
obtained from the multiple measurements of an analyte. There<br />
is a direct relationship between the magnitude of the CV <strong>and</strong><br />
the degree of imprecision (ie, the lower the CV, the lower the<br />
imprecision [or the higher the degree of precision]). The magnitude<br />
of analytical variation is given by CV a , while biological<br />
variability is defined by CV b . Approaches to determining assayspecific<br />
values for CV a , CV b , <strong>and</strong> CD are beyond the scope of<br />
this CE Update.<br />
Fortunately, most assays for a wide variety of analytes have<br />
excellent precision (ie,
data is never a substitute for a good physical exam <strong>and</strong> patient<br />
history (clinicians should treat the patient, not the laboratory<br />
results). LM<br />
1. Carraro P, Plebani M. Errors in a stat laboratory: Types <strong>and</strong> frequencies 10 years<br />
later. Clin Chem. 2007;53:1338–1342.<br />
2. Gras JM, Philippe M. Application of Six Sigma concept in clinical laboratories:<br />
A review. Clin Chem Lab Med. 2007;45:789–796.<br />
3. Wians FH Jr. Luminaries in laboratory medicine: Otto Folin. Lab Med.<br />
2009;40:1–2.<br />
4. Wians FH Jr, Baskin LB. Chapter 2: The Use of <strong>Clinical</strong> <strong>Laboratory</strong> <strong>Tests</strong> in<br />
Diagnostic Decision-Making. In: H<strong>and</strong>book of <strong>Clinical</strong> Pathology, ASCP Press:<br />
Chicago; 2000: 9–24.<br />
5. Lamb CR. Statistical briefing: Estimating the probability of disease. Vet Radiol<br />
Ultrasound. 2007;48:297–298.<br />
CE Update<br />
6. Obuchowski NA, Lieber ML, Wians FH Jr. ROC curves in clinical chemistry:<br />
Uses, misuses, <strong>and</strong> possible solutions. Clin Chem. 2004;50:1118–1125.<br />
7. Schweiger CR, Soeregi G, Spitzauer S, et al. Evaluation of laboratory data<br />
by conventional statistics <strong>and</strong> by three types of neural networks. Clin Chem.<br />
1993;39:1966–1971.<br />
8. Veltri RW, Chaudhari M, Miller MC, et al. Comparison of logistic regression<br />
<strong>and</strong> neural net modeling for prediction of prostate cancer pathologic stage. Clin<br />
Chem. 2002;48:1828–1834.<br />
9. Forsman RW. <strong>Why</strong> is the laboratory an afterthought for managed care<br />
organizations? Clin Chem. 1996;42:813–816.<br />
10. Khromova V, Gray TA. Learning needs in clinical biochemistry for doctors in<br />
foundation. Ann Clin Biochem. 2008;45:33–38.<br />
labmedicine.com February 2009 j Volume 40 Number 2 j LABMEDICINE 113