1 - Nuclear Sciences and Applications - IAEA
1 - Nuclear Sciences and Applications - IAEA
1 - Nuclear Sciences and Applications - IAEA

You also want an ePaper? Increase the reach of your titles
YUMPU automatically turns print PDFs into web optimized ePapers that Google loves.
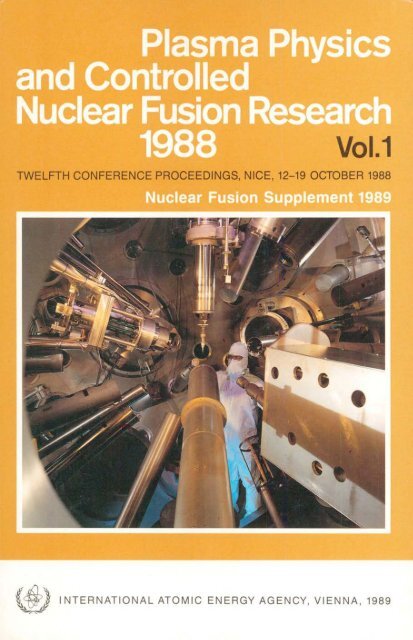
The cover picture shows the inside of the target chamber of the NOVA Laser.<br />
By courtesy of the Inertial Confinement Fusion Program of the Lawrence<br />
Livermore National Laboratory.
PLASMA PHYSICS<br />
AND CONTROLLED<br />
NUCLEAR FUSION RESEARCH<br />
1988<br />
VOLUME 1
AFGHANISTAN<br />
ALBANIA<br />
ALGERIA<br />
ARGENTINA<br />
AUSTRALIA<br />
AUSTRIA<br />
BANGLADESH<br />
BELGIUM<br />
BOLIVIA<br />
BRAZIL<br />
BULGARIA<br />
BURMA<br />
BYELORUSSIAN "OVIET<br />
SOCIALIST REPUBLIC<br />
CAMEROON<br />
CANADA<br />
CHILE<br />
CHINA<br />
COLOMBIA<br />
COSTA RICA<br />
COTE D'lVOIRE<br />
CUBA<br />
CYPRUS<br />
CZECHOSLOVAKIA<br />
DEMOCRATIC KAMPUCHEA<br />
DEMOCRATIC PEOPLE'S<br />
REPUBLIC OF KOREA<br />
DENMARK<br />
DOMINICAN REPUBLIC<br />
ECUADOR<br />
EGYPT<br />
EL SALVADOR<br />
ETHIOPIA<br />
FINLAND<br />
FRANCE<br />
GABON<br />
The following States are Members of the International Atomic Energy Agency:<br />
GERMAN DEMOCRATIC REPUBLIC<br />
GERMANY, FEDERAL REPUBLIC OF<br />
GHANA<br />
GREECE<br />
GUATEMALA<br />
HAITI<br />
HOLY SEE<br />
HUNGARY<br />
ICELAND<br />
INDIA<br />
INDONESIA<br />
IRAN, ISLAMIC REPUBLIC OF<br />
IRAQ<br />
IRELAND<br />
ISRAEL<br />
ITALY<br />
IAMAICA<br />
JAPAN<br />
JORDAN<br />
KENYA<br />
KOREA, REPUBLIC OF<br />
KUWAIT<br />
LEBANON<br />
LIBERIA<br />
LIBYAN ARAB JAMAHIRIYA<br />
LIECHTENSTEIN<br />
LUXEMBOURG<br />
MADAGASCAR<br />
MALAYSIA<br />
MALI<br />
MAURITIUS<br />
MEXICO<br />
MONACO<br />
MONGOLIA<br />
MOROCCO<br />
NAMIBIA<br />
NETHERLANDS<br />
NEW ZEALAND<br />
NICARAGUA<br />
NIGER<br />
NIGERIA<br />
NORWAY<br />
PAKISTAN<br />
PANAMA<br />
PARAGUAY<br />
PERU<br />
PHILIPPINES<br />
POLAND<br />
PORTUGAL<br />
QATAR<br />
ROMANIA<br />
SAUDI ARABIA<br />
SENEGAL<br />
SIERRA LEONE<br />
SINGAPORE<br />
SOUTH AFRICA<br />
SPAIN<br />
SRI LANKA<br />
SUDAN<br />
SWEDEN<br />
SWITZERLAND<br />
SYRIAN ARAB REPUBLIC<br />
THAILAND<br />
TUNISIA<br />
TURKEY<br />
UGANDA<br />
UKRAINIAN SOVIET SOCIALIST<br />
REPUBLIC<br />
UNION OF SOVIET SOCIALIST<br />
REPUBLICS<br />
UNITED ARAB EMIRATES<br />
UNITED KINGDOM OF GREAT<br />
BRITAIN AND NORTHERN<br />
IRELAND<br />
UNITED REPUBLIC OF<br />
TANZANIA<br />
UNITED STATES OF AMERICA<br />
URUGUAY<br />
VENEZUELA<br />
VIET NAM<br />
YUGOSLAVIA<br />
ZAIRE<br />
ZAMBIA<br />
ZIMBABWE<br />
The Agency's Statute was approved on 23 October 1956 by the Conference on the Statute of the <strong>IAEA</strong> held<br />
at United Nations Headquarters, New York; it entered into force on 29 July 1957. The Headquarters of the Agency<br />
are situated in Vienna. Its principal objective is "to accelerate <strong>and</strong> enlarge the contribution of atomic energy to peace,<br />
health <strong>and</strong> prosperity throughout the world".<br />
© <strong>IAEA</strong>, 1989<br />
Permission to reproduce or translate the information contained in this publication may be obtained by writing<br />
to the International Atomic Energy Agency, Wagramerstrasse 5, P.O. Box 100, A-1400 Vienna, Austria.<br />
Primed by the <strong>IAEA</strong> in Austria<br />
August 1989
NUCLEAR FUSION SUPPLEMENT 1989<br />
PLASMA PHYSICS<br />
AND CONTROLLED<br />
NUCLEAR FUSION RESEARCH<br />
1988<br />
PROCEEDINGS OF THE<br />
TWELFTH INTERNATIONAL CONFERENCE ON PLASMA PHYSICS<br />
AND CONTROLLED NUCLEAR FUSION RESEARCH<br />
HELD BY THE<br />
INTERNATIONAL ATOMIC ENERGY AGENCY<br />
IN NICE, 12-19 OCTOBER 1988<br />
In three volumes<br />
VOLUME 1<br />
INTERNATIONAL ATOMIC ENERGY AGENCY<br />
VIENNA, 1989
PLASMA PHYSICS AND<br />
CONTROLLED NUCLEAR FUSION RESEARCH 1988<br />
<strong>IAEA</strong>, VIENNA, 1989<br />
STI/PUB/787<br />
ISBN 92-0-130089-1<br />
ISSN 0074-1884
FOREWORD<br />
The Twelfth Internationa] Atomic Energy Agency Conference on Plasma<br />
Physics <strong>and</strong> Controlled <strong>Nuclear</strong> Fusion Research was characterized by a multitude<br />
of excellent scientific results on virtually all aspects of controlled fusion <strong>and</strong> fusion<br />
technology. Taken together, these results lay a solid foundation for continued<br />
progress <strong>and</strong> future steps.<br />
The conference was organized by the <strong>IAEA</strong> in co-operation with the French<br />
Commissariat a l'energie atomique <strong>and</strong> the Centre d'etudes nucleaires de Cadarache,<br />
to whom the <strong>IAEA</strong> wishes to express its gratitude. The conference was attended by<br />
over five hundred participants <strong>and</strong> some eighty observers from 35 countries <strong>and</strong> two<br />
international organizations.<br />
At the technical sessions, which included seven poster sessions, more than two<br />
hundred papers were presented. Contributions were made on magnetic <strong>and</strong> inertial<br />
confinement systems, fusion technology, magnetic confinement theory <strong>and</strong> modelling,<br />
alternative confinement approaches <strong>and</strong> next step concepts (ITER, NET, CIT,<br />
etc.). The traditional Artsimovich Memorial Lecture was given at the beginning of<br />
the conference.<br />
These proceedings, which include all the technical papers <strong>and</strong> five conference<br />
summaries, are published in English as a supplement to the <strong>IAEA</strong> journal <strong>Nuclear</strong><br />
Fusion.<br />
The <strong>IAEA</strong> is contributing to international collaboration <strong>and</strong> exchange of information<br />
in the field of nuclear fusion by organizing these biennial conferences <strong>and</strong> by<br />
holding workshops, technical committee meetings, consultants meetings, etc., on<br />
appropriate topics. Through these activities the <strong>IAEA</strong> hopes to contribute significantly<br />
to the attainment of controlled fusion power as one of the world's future energy<br />
resources.
EDITORIAL NOTE<br />
The Proceedings have been edited by the editorial staff of the <strong>IAEA</strong> to the extent considered necessary<br />
for the reader's assistance. The views expressed remain, however, the responsibility of the named<br />
authors or participants. In addition, the views are not necessarily :hose of the governments of the<br />
nominating Member States or of the nominating organizations.<br />
Although great care has been taken to maintain the accuracy of information contained in this publication,<br />
neither the <strong>IAEA</strong> nor its Member States assume any responsibility for consequences which may<br />
arise from its use.<br />
The use of particular designations of countries or territories does not imply any judgement by the<br />
publisher, the <strong>IAEA</strong>, as to the legal status of such countries or territories, of their authorities <strong>and</strong> institutions<br />
or of the delimitation of their boundaries.<br />
The mention of names of specific companies or products (whether or not indicated as registered)<br />
does not imply any intention to infringe proprietary rights, nor should it be construed as an endorsement<br />
or recommendation on the part of the <strong>IAEA</strong>.<br />
The authors are responsible for having obtained the necessary permission for the <strong>IAEA</strong> to<br />
reproduce, translate or use material from sources already protected by copyrights-<br />
Material prepared by authors who are in contractual relation with governments is copyrighted<br />
by the <strong>IAEA</strong>, as publisher, only to the extent permitted by the appropriate national regulations.
CONTENTS OF VOLUME 1<br />
ARTSIMOVICH MEMORIAL LECTURE AND TOKAMAK EXPERIMENTS<br />
(Session A)<br />
Artsimovich Memorial Lecture (<strong>IAEA</strong>-CN-50/A-0) 3<br />
C. Maisonnier<br />
First experiments in Tore Supra (<strong>IAEA</strong>-CN-50/A-I-1) 9<br />
Equipe Tore Supra<br />
An overview of TFTR confinement with intense neutral beam heating<br />
(<strong>IAEA</strong>-CN-50/A-I-2) 27<br />
M.G. Bell, V. Arunasalam, C.W. Barnes, M. Bitter, H.-S. Bosch,<br />
N.L. Bretz, R. Budny, C.E. Bush, A. Cavallo, T.K. Chu, S.A. Cohen,<br />
P.L. Colestock, S.L Davis, D.L. Dimock, H.F. Dylla, P.C. Efihimion,<br />
A.B. Ehrhardt, R.J. Fonck, E.D. Fredrickson, H.P. Furth, G. Gammel,<br />
R.J. Goldston, G.J. Greene, B. Grek, L.R. Grisham, G. W. Hammett,<br />
R.J. Hawryluk, H.W. Hendel, K.W. Hill, E. Hinnov, J.C. Hosea,<br />
R.B. Howell, H. Hsuan, R.A. Hulse, K.P. Jaehnig, A.C. Janos,<br />
D.L. Jassby, F.C. Jobes, D.W. Johnson, L.C. Johnson, R. Kaita,<br />
C. Kieras-Phillips, 5.7. Kilpatrick, V.A. Krupin, P.H. LaMarche,<br />
W.D. hanger, B. LeBlanc, R. Little, A.I. Lysojvan, DM. Manos,<br />
D.K. Mansfield, E. Mazzucato, R.T. McCann, M.P. McCarthy,<br />
D.C. McCune, KM. McGuire, D.H. McNeill, DM. Meade,<br />
5.5. Medley, D.R. Mikkelsen, R.W. Motley, D. Mueller, Y. Murakami,<br />
J.A. Murphy, E.B. Nieschmidt, D.K. Owens, H.K. Park, A.T. Ramsey,<br />
M.H. Redi, A.L. Roquemore, P.H. Rutherford, T. Saito, N.R. Sauthoff,<br />
G. Schilling, J. Schivell, G.L. Schmidt, S.D. Scott, J.C. Sinnis,<br />
J.E. Stevens, W. Stodiek, B.C. Stratton, G.D. Tait, G. Taylor,<br />
J.R. Timberlake, H.H. Towner, M. Ulrickson, S. Von Goeler,<br />
RM. Wiel<strong>and</strong>, M.D. Williams, J.R. Wilson, K.-L. Wong, S. Yoshikawa,<br />
KM. Young, M.C. Zarnstorff, 5.7. Zweben<br />
Latest JET results <strong>and</strong> future prospects (<strong>IAEA</strong>-CN-5O/A-I-3) 41<br />
JET Team<br />
Recent progress in JT-60 experiments (<strong>IAEA</strong>-CN-50/A-I-4) 67<br />
JT-60 Team: H. Aikawa, N. Akaoka, H. Akasaka, M. Akiba, N. Akino,<br />
T. Ando, K. Annoh, I. Aoki, T. Aoyagi, T. Arai, K. Arakawa, M. Araki,<br />
M. Azumi, 5. Chiba, M. Dairaku, N. Ebisawa, T. Fujii, T. Fukuda,<br />
A. Funahashi, H. Furukawa, H. Gunji, K. Hamamatsu, M. Hanada,<br />
M. Hara, K. Haraguchi, H. Hiratsuka, T. Hirayama, S. Hiroki,<br />
K. Hiruta, M. Honda, M. Honda, H. Horiike, R. Hosoda, N. Hosogane,<br />
K. Ilda, T. lijima, Y. Ikeda, Y. Ikeda, T. Imai, T. Inoue, N. Isaji,<br />
M. Isaka, S. Ishida, K. Itami, N. Itige, T. ho, T. Kakizaki, Y. Kamada,
A. Kaminaga, T. Kaneko, T. Kato, M. Kawai, M. Kawabe,<br />
Y. Kawamata, Y. Kawano, K. Kawasaki, K. Kikuchi, M. Kikuchi,<br />
H. Kimura, T. Kimura, H. Kishimoto, S. Kitamura, A. Kitsunezaki,<br />
K. Kiyono, N. Kobayashi, K. Kodama, Y. Koide, T. Koike, M. Komata,<br />
I. Kondo, K. Konishi, S. Konoshima, H. Kubo, S. Kunieda,<br />
K. Kurihara, M. Kuriyama, T. Kushima, M. Kusaka, Y. Kusama,<br />
Y. Mabuti, S. Maehara, K. Maeno, T. Matoba, S. Matsuda,<br />
M. Matsukawa, T. Matsukawa, M. Matsuoka, Y. Matsuzaki, Y. Miura,<br />
N. Miya, K. Miyachi, Y. Miyo, M. Mizuno, K. Mogaki, M. Mori,<br />
S. Moriyama, M. Muto, M. Nagami, K. Nagase, A. Nagashima,<br />
K. Nagashima, T. Nagashima, S. Nagaya, O. Naito, H. Nakamura,<br />
Y. Nakamura, M. Nemoto, Y. Neyatani, H. Ninomiya, N. Nishino,<br />
T. Nishitani, H. Nobusaka, H. Nomoto, K. Obara, H. Obinata,<br />
K. Odazima, Y. Ogawa, N. Ogiwara, T. Ohga, Y. Ohara, K. Ohasa,<br />
H. Oohara, T. Ohshima, M. Ohkubo, K. Ohta, M. Ohta, S. Ohuchi,<br />
Y. Ohuchi, A. Oikawa, Y. Okumura, K. Omori, S. Omori, Y. Omori,<br />
T. Ozeki, M. Saegusa, N. Saitoh, K. Sakamoto, A. Sakasai, S. Sakata,<br />
T. Sasajima, K. Satou, M. Satou, M. Satou, M. Sawahata, T. Sebata,<br />
M. Seimiya, M. Seki, S. Seki, K. Shibanuma, R. Shimada, T. Shimada,<br />
K. Shimizu, M. Shimizu, Y. Shimomura, S. Shinozaki, H. Shirai,<br />
H. Shirakata, M. Shitomi, K. Suganuma, T. Sugawara, T. Sugie,<br />
H. Sunaoshi, K. Suzuki, M. Suzuki, N. Suzuki, S. Suzuki, Y. Suzuki,<br />
H. Tachibana, M. Takahashi, S. Takahashi, T. Takahashi, M. Takasaki,<br />
H. Takatsu, H. Takeuchi, A. Takeshita, T. Takizuka, S. Tamura,<br />
S. Tanaka, T. Tanaka, Y. Tanaka, K. Tani, M. Terakado, T. Terakado,<br />
K. Tobita, T. Tokutake, T. Totsuka, N. Toyoshima, T. Tsugita, S. Tsuji,<br />
Y. Tsukahara, M. Tsuneoka, K. Uehara, M. Umehara, Y. Uramoto,<br />
H. Usami, K. Ushigusa, K. Usui, J. Yagyu, M. Yamamoto,<br />
O. Yamashita, T. Yamazaki, K. Yokokura, H. Yokomizo, K. Yokoyama,<br />
M. Yoshikawa, H. Yoshida, R. Yoshino, Y. Yoshioka, I. Yonekawa,<br />
T. Yoneda, K. Watanabe, M.G. Bell, RJ. Bickerton, W. Engelhardt,<br />
R.J. Goldston, E. Kallne, J. Milne, H.W. Kugel, P.L. Mondino,<br />
F.X. Soldner, Y. Takase, P.R. Thomas, K.-L. Wong<br />
Stability of high beta discharges in the DIII-D tokamak<br />
(<strong>IAEA</strong>-CN-50/A-II-l) 83<br />
E.J. Strait, L.L. Lao, T.S. Taylor, M.S. Chu, J.K. Lee, A.D. Turnbull,<br />
S.L. Allen, N.H. Brooks, K.H. Burrell, R.W. Callis, T.N. Carlstrom,<br />
M.S. Chance, A.P. Colleraine, D. Content, J.C. DeBoo, J. Ferron,<br />
J.M. Greene, R.J. Groebner, W.W. Heidbrink, F.J. Helton, D.N. Hill,<br />
R.-M. Hong, N. Hosogane, W. Howl, C.L. Hsieh, G.L. Jackson,<br />
G.L. Jahns, A.G. Kellman, J. Kim, S. Kinoshita, E.A. Lazarus,<br />
P.J. Lomas, J.L. Luxon, M.A. Mahdavi, Y. Neyatani, T. Ohkawa,<br />
T.H. Osborne, D.O. Overskei, T. Ozeki, M. Perry, P.I. Petersen,
T.W. Petrie, J.C. Phillips, G.D. Porter, D.P. Schissel, J.T. Scoville,<br />
R.P. Seraydarian, M. Shimada, T.C. Simonen, R.T. Snider,<br />
R.D. Stambaugh, R.D. Stav, H. St. John, R.E. Stockdale, U. Stroth,<br />
R. Wood<br />
Initial results of the PBX-M experiment (<strong>IAEA</strong>-CN-50/A-II-2) 97<br />
M. Okabayashi, N. Asakura, R. Bell, S. Bernabei, K. Bol, R.A. Ellis, Jr.,<br />
R.J. Fonck, G. Gammel, A. Holl<strong>and</strong>, R. Kaita, S. Kaye, H. W. Kugel,<br />
B. LeBlanc, A. MacAulay, M. Ono, S. Paul, E. Powell, S. Preische,<br />
M. Reusch, S. Sesnic, H. Takahashi<br />
MHD activities <strong>and</strong> related impurity behaviour in JT-60 discharges<br />
(<strong>IAEA</strong>-CN-50/A-II-3) Ill<br />
H. Ninomiya, R. Yoshino, M. Akiba, T. Ando, K. Annoh, T. Aoyagi,<br />
K. Arakawa, M. Azumi, T. Fujii, T. Fukuda, A. Funahashi,<br />
K. Hamamatsu, T. Hirayama, M. Honda, H. Horiike, N. Hosogane,<br />
T. Hjima, Y. Ikeda, T. Imai, S. Ishida, K. Itami, T. Ito, Y. Kamada,<br />
Y. Kawano, M. Kikuchi, H. Kimura, T. Kimura, H. Kishimoto, Y. Koide,<br />
T. Koike, I. Kondo, S. Konoshima, H. Kubo, S. Kunieda, K. Kurihara,<br />
M. Kuriyama, Y. Kusama, S. Maehara, K. Maeno, T. Matoba,<br />
S. Matsuda, M. Matsukawa, T. Matsukawa, M. Matsuoka, Y. Matsuzaki,<br />
N. Miya, K. Miyachi, M. Mizuno, M. Nagami, A. Nagashima,<br />
K. Nagashima, T. Nagashima, 0. Naito, H. Nakamura, M. Nemoto,<br />
Y. Neyatani, N. Nishino, T. Nishitani, K. Odajima, N. Ogiwara,<br />
T. Ohga, M. Ohta, K. Omori, S. Omori, T. Ozeki, M. Saigusa,<br />
K. Sakamoto, A. Sakasai, M. Sato, M. Seimiya, M. Seki, S. Seki,<br />
K. Shimizu, M. Shimizu, Y. Shimomura, H. Shirai, H. Shirakata,<br />
T. Sugie, S. Takahashi, H. Takatsu, H. Takeuchi, S. Tamura, Y. Tanaka,<br />
K. Tani, K. Tobita, N. Toyoshima, S. Tsuji, M. Tsuneoka, K. Uehara,<br />
K. Ushigusa, I. Yonekawa, H. Yoshida<br />
Disruption modes <strong>and</strong> sawtooth analysis in the HL-1 tokamak<br />
(<strong>IAEA</strong>-CN-50/A-II-4) 121<br />
Qingdi Gao, Gancheng Guo, Yunwen Qin, Yongzhen Zheng, Jiafu Dong,<br />
Yunze Zhong, Zhanhe Wang, Qingwei Yang, Jiefu Chen, Hong Xiao, •<br />
Guangbi Xu, Deming Xu, Zhongchao Deng, Guangyang Zhang,<br />
Shikun Yang, Huichen Deng, Bo Fu, Dechang Gan, Kehua Li,<br />
Huazhi Li, Henian Zuo, Shubei Li, Peide Zhou, Wenxue Liang,<br />
Chengjie Yuan, Hongyin Zhang, Youyi Li, Gao Hu, Bingren Shi,<br />
Shangjie Qian<br />
Superlow density experiment on HT-6M tokamak (<strong>IAEA</strong>-CN-50/A-II-5-1) ... 131<br />
HT-6M Group<br />
Investigation of sawtooth behaviour <strong>and</strong> confinement with RHF on the<br />
HT-6B tokamak (<strong>IAEA</strong>-CN-50/A-II-5-2) 137<br />
Yuping Huo, Jikang Xie, Linzhong Li, Yexi He, Dequan Guo, Pinjain Qin,<br />
Guoxiang Li, Chuanbao Deng, Rang Huang, Qiliang Guo, Xingde Tong,<br />
Junyu Zhao
Improved confinement regimes with Ohmic <strong>and</strong> with counter-injection<br />
heating in ASDEX (<strong>IAEA</strong>-CN-50/A-III-l) 145<br />
G. Fussmann, O. Gruber, H. Niedermeyer, F.X. Soldner, A. Stabler,<br />
F. Wagner, G. Becker, M. Bessenrodt-Weberpals, B. Bomba, H.-S. Bosch,<br />
K. Brau, H. Bruhns, R. Buchse, A. Carlson, G. Dodel, A. Eberhagen,<br />
H.-U. Fahrbach, O. Gehre, K.W. Gentle, J. Gernhardt, L. Giannone,<br />
G. von Gierke, E. Glock, S. Von Goeler, G. Haas, W. Herrmann,<br />
J. Hofinann, E. Holzhauer, K. Hiibner, G. Janeschitz, A. Kallenbach,<br />
F. Karger, M. Kaufmann, O. Kltiber, M. Kornherr, K. Krieger,<br />
J. Kucinski, K. Lackner, R.S. Lang, G. Lisitano, M. Lorcher,<br />
H.M. Mayer, K. McCormick, D. Meisel, V. Mertens, E.R. Muller,<br />
H.D. Murmann, J. Neuhauser, R. Nolte, J.-M. Noterdaeme,<br />
W. Poschenrieder, L.B. Ran, D.E. Roberts, H. Rohr, J. Roth, A. Rudyj,<br />
F. Ryter, W. S<strong>and</strong>mann, F. Schneider, U. Schneider, E. Sevillano,<br />
G. Siller, E. Simmet, E. Speth, K.-H. Steuer, U. Stroth, N. Tsois,<br />
H. Verbeek, P. Vollmer, H. Wurz, H.R. Yang<br />
The JET H-mode at high current <strong>and</strong> power levels (<strong>IAEA</strong>-CN-50/A-III-2) ... 159<br />
JET Team<br />
Transport in TFTR supershots (<strong>IAEA</strong>-CN-50/A-III-3) 183<br />
M.C. Zarnstorff, V. Arunasalam, C.W. Barnes, M.G. Bell, M. Bitter,<br />
H.-S. Bosch, N.L. Bretz, R. Budny, C.E. Bush, A. Cavallo, T.K. Chu,<br />
S.A. Cohen, P.L. Colestock, S.L. Davis, D.L Dimock, H.F. Dylla,<br />
P.C. Efthimion, A.B. Ehrhardt, R.J. Fonck, E.D. Fredrickson,<br />
HP. Furth, G. Gammel, R.J. Goldston, G.J. Greene, B. Grek,<br />
L.R. Grisham, G.W. Hammett, R.J. Hawryluk, H.W. Hendel, K.W. Hill,<br />
E. Hinnov, J.C. Hosea, R.B. Howell, H. Hsuan, R.A. Hulse,<br />
K.P. Jaehnig, A.C. Janos, D.L. Jassby, F.C. Jobes, D.W. Johnson,<br />
L.C. Johnson, R. Kaita, C. Kieras-Phillips, SJ. Kilpatrick, V.A. Krupin,<br />
P.H. LaMarche, B. LeBlanc, R. Little, A.I. Lysojvan, D.M. Manos,<br />
D.K. Mansfield, E. Mazzucato, R.T. McCann, M.P. McCarthy,<br />
D.C. McCune, KM. McGuire, D.H. McNeill, D.M. Meade,<br />
S.S. Medley, D.R. Mikkelsen, R.W. Motley, D. Mueller, Y. Murakami,<br />
J.A. Murphy, E.B. Nieschmidt, D.K. Owens, H.K. Park, A.T. Ramsey,<br />
M.H. Redi, A.L. Roquemore, P.H. Rutherford, T. Saito, N.R. Sauthoff,<br />
G. Schilling, J. Schivell, G.L. Schmidt, S.D. Scott, J.C. Sinnis,<br />
J.E. Stevens, W. Stodiek, J.D. Strachan, B.C. Stratton, G.D. Tait,<br />
G. Taylor, J.R. Timberlake, H.H. Towner, M. Ulrickson, S. Von Goeler,<br />
R.M. Wiel<strong>and</strong>, M.D. Williams, J.R. Wilson, K.-L. Wong, S. Yoshikawa,<br />
K.M. Young, S.J. Zweben<br />
Energy confinement in auxiliary heated divertor <strong>and</strong> limiter discharges<br />
in the DIII-D tokamak (<strong>IAEA</strong>-CN-50/A-IH-4) 193<br />
K.H. Burrell, S.L. Allen, G. Bramson, N.H. Brooks, R.W. Callis,<br />
T.N. Carlstrom, M.S. Chance, M.S. Chu, A.P. Colleraine, D. Content,
J.C. DeBoo, R.R. Dominguez, S. Ejima, J. Ferron, R.L. Freeman,<br />
H. Fukumoto, P. Gohil, N. Gottardi, CM. Greenfield, R.J. Groebner,<br />
G. Haas, R.W. Harvey, W.W. Heidbrink, F.J. Helton, D.N. Hill,<br />
F.L. Hinton, R.-M. Hong, N. Hosogane, W. Howl, C.L. Hsieh,<br />
G.L. Jackson, G.L. Jahns, R.A. James, A.G. Kellman, J. Kim,<br />
S. Kinoshita, L.L. Lao, E.A. Lazarus, P. Lee, T. LeHecka, J. Lister,<br />
J.M. Lohr, P.J. Lomas, T.C. Luce, J.L. Luxon, M.A. Mahdavi,<br />
K. Matsuda, H. Matsumoto, M. Mayberry, C.P. Moeller, Y. Neyatani,<br />
T. Ohkawa, N. Ohyabu, T.H. Osborne, D.O. Overskei, T. Ozeki,<br />
W.A. Peebles, S. Perkins, M. Perry, P.I. Petersen, T.W. Petrie,<br />
R. Philipono, J.C. Phillips, R. Pinsker, P.A. Politzer, G.D. Porter,<br />
R. Prater, D.B. Remsen, M.E. Rensink, K. Sakamoto, M.J. Schaffer,<br />
D.P. Schissel, J.T. Scoville, R.P. Seraydarian, M. Shimada,<br />
T.C. Simonen, R.T. Snider, G.M. Staebler, B.W. Stallard,<br />
R.D. Stambaugh, R.D. Stav, H. St. John, R.E. Stockdale, E.J. Strait,<br />
P.L. Taylor, T.T. Taylor, P.K. Trost, A. Turnbull, U. Stroth,<br />
R.E. Waltz, R. Wood<br />
Confinement studies of the H-mode on JFT-2M (<strong>IAEA</strong>-CN-50/A-III-5) 207<br />
N. Suzuki, A. Aikawa, K. Hoshino, S. Kasai, T. Kawakami, H. Kawashima,<br />
T. Kondoh, H. Maeda, T. Matsuda, H. Matsumoto, Y. Miura, M. Mori,<br />
I. Nakazawa, K. Odajima, H. Ogawa, T. Ogawa, K. Ohasa, H. Ohtsuka,<br />
S. Sengoku, T. Shoji, H. Tamai, Y. Uesugi, T. Yamamoto, T. Yamauchi,<br />
K. Hasegawa, A. Honda, I. Ishibori, Y. Kashiwa, M. Kazawa,<br />
K. Kikuchi, H. Okano, E. Sato, T. Shibata, T. Shiina, K. Suzuki,<br />
T. Tani, T. Tokutake, S. Uno<br />
Heating of peaked density profiles produced by pellet injection in JET<br />
(<strong>IAEA</strong>-CN-50/A-IV-l) 215<br />
JET Team<br />
Pellet injection <strong>and</strong> improved plasma performance in ASDEX<br />
(<strong>IAEA</strong>-CN-50/A-IV-2) 229<br />
M. Kaufinann, K. Behringer, G. Fussmann, O. Gruber, K. Lackner,<br />
R.S. Lang, V. Mertens, R. Nolle, W. S<strong>and</strong>mann, K.-H. Steuer,<br />
G. Becker, H. Bessenrodt-Weberpals, B. Bomba, H.-S. Bosch, K. Brau,<br />
H. Bruhns, K. Buchl, R. Buchse, A. Carlson, G. Dodel, A. Eberhagen,<br />
H.-U. Fahrbach, O. Gehre, K.W. Gentle, J. Gernhardt, L. Giannone,<br />
G. von Gierke, E. Glock, S. Von Goeler, G. Haas, W. Herrmann,<br />
J. Hofinann, E. Holzhauer, K. Hiibner, G. Janeschitz, A. Kallenbach,<br />
O. Kardaun, F. Karger, O. Kliiber, M. Kornherr, K. Krieger, L. Lengyel,<br />
G. Lisitano, M. Lorcher, H.M. Mayer, K. McCormick, D. Meisel,<br />
E.R. Miiller, H.D. Murmann, J. Neuhauser, H. Niedermeyer,<br />
J.-M. Noterdaeme, W. Poschenrieder, D.E. Roberts, H. Rohr, A. Rudyj,<br />
F. Ryter, F. Schneider, U. Schneider, E. Sevillano, G. Siller, E. Simmet,<br />
F.X. Sbldner, E. Speth, A. Stabler, U. Stroth, N. Tsois, O. Vollmer,<br />
F. Wagner, H. Wiirz
Tokamak with strong magnetic field <strong>and</strong> adiabatic plasma compression<br />
(<strong>IAEA</strong>-CN-50/A-IV-3) 239<br />
E.A. Azizov, V.A. Chuyanov, G.G. Gladush, V.D. Pismennyj,<br />
A.A. Vedenov, E.P. Velikhov, V.A. Glukhikh, B.G. Karasev,<br />
V.A. Krylov, N.A. Monoszon, I. V. Mozin<br />
High temperature experiments <strong>and</strong> fusion product measurements in JET<br />
(<strong>IAEA</strong>-CN-50/A-IV-4) 247<br />
JET Team<br />
Fusion product measurements on TFTR (<strong>IAEA</strong>-CN-50/A-IV-5) 257<br />
J.D. Strachan, S.J. Zweben, C.W. Barnes, H.-S. Bosch, H.P. Furth,<br />
H.W. Hendel, D.L. Jassby, L.C Johnson, R.W. Motley, T. Murphy,<br />
E.B. Nieschmidt, T Saito, K.M. Young, M.G. Bell, M. Bitter,<br />
A. Cavallo, E.D. Fredrickson, K.W. Hill, H. Hsuan, U.K. Mansfield,<br />
D.R. Mikkelsen, H.K. Park, A.T. Ramsey, M.H. Redi, G. Taylor,<br />
<strong>and</strong> the TFTR Group<br />
Energy confinement with auxiliary heating in JT-60 (<strong>IAEA</strong>-CN-50/A-V-1) ... 265<br />
S. Tsuji, M. Akiba, T. Ando, K. Annoh, T. Aoyagi, K. Arakawa,<br />
M. Azumi, T. Fujii, T. Fukuda, A. Funahashi, K. Hamamatsu,<br />
T. Hirayama, M. Honda, H. Horiike, N. Hosogane, T. Iijima, Y. Ikeda,<br />
T. Imai, S. Ishida, K. Itami, T. ho, Y. Kamada, Y. Kawano, M. Kikuchi,<br />
H. Kimura, T. Kimura, H. Kishimoto, Y. Koide, T. Koike, 1. Kondo,<br />
S. Konoshima, H. Kubo, S. Kunieda, K. Kurihara, M. Kuriyama,<br />
Y. Kusama, S. Maehara, K. Maeno, T. Matoba, S. Matsuda,<br />
M. Matsukawa, T. Matsukawa, M. Matsuoka, Y. Matsuzaki, N. Miya,<br />
K. Miyachi, M. Mizuno, M. Nagami, A. Nagashima, K. Nagashima,<br />
T. Nagashima, O. Naito, H. Nakamura, M. Nemoto, Y. Neyatani,<br />
H. Ninomiya, N. Nishino, T. Nishitani, K. Odajima, N. Ogiwara,<br />
T. Ohga, M. Ohta, K. Omori, S. Omori, T. Ozeki, M. Saigusa,<br />
K. Sakamoto, A. Sakasai, M. Sato, M. Seimiya, M. Seki, S. Seki,<br />
K. Shimizu, M. Shimizu, Y. Shimomura, H. Shirai, H. Shirakata,<br />
T. Sugie, M. Takahashi, S. Takahashi, H. Takatsu, H. Takeuchi,<br />
S. Tamura, Y. Tanaka, K. Tani, K. Tobita, N. Toyoshima,<br />
M. Tsuneoka, K. Uehara, K. Ushigusa, I. Yonekawa, H. Yoshida,<br />
R. Yoshino<br />
Thermal wave investigation of anomalous transport by modulated ECRH<br />
<strong>and</strong> sawteeth (<strong>IAEA</strong>-CN-50/A-V-2-1) 275<br />
M. Ashraf, CM. Bishop, J. W. Connor, M. Cox, N. Deliyanakis,<br />
J. Hugill, H.W. Lean, P. Mantica, W. Millar, B.J. Parham, R.A. Pitts,<br />
D.C. Robinson, A. Simonetto, G. Vayakis<br />
Coupling of particle <strong>and</strong> heat transport measured via sawtooth<br />
induced pulse propagation (<strong>IAEA</strong>-CN-50/A-V-2-2) 281<br />
S.K. Kim, D.L. Brower, W.A. Peebles, N.C. Luhmann, Jr., M.S. Foster,<br />
S.C McCool
Density fluctuations <strong>and</strong> particle/thermal transport for ohmically <strong>and</strong><br />
auxiliary heated plasmas in the JIPP T-IIU tokamak<br />
(<strong>IAEA</strong>-CN-5O/A-V-3-1) 287<br />
K. Kawahata, K. Adati, R. Akiyama, A. Ando, R. Ando, T. Aoki,<br />
D.-G. Bi, J. Fujita, Y. Hamada, S. Hidekuma, S. Hirokura, K. Ida,<br />
H. Ikegami, K. Kadota, E. Kako, 0. Kaneko, A. Karita, Y. Kawasumi,<br />
S. Kitagawa, M. Kojima, T. Koumoto, S. Kubo, Y. Kubota,<br />
R. Kumazawa, T. Kuroda, K. Masai, H. Masumoto, A. Mohri, T. Mori,<br />
S. Morita, K. Narihara, A. Nishizawa, I. Ogawa, Y. Ogawa, K. Ohkubo,<br />
Y. Oka, S. Okajima, S. Okamura, T. Ozaki, A. Sagara, M. Sakamoto,<br />
M. Sasao, K. Sato, K.N. Sato, T. Sato, F. Shimbo, S. Tanahashi,<br />
Y. Taniguchi, K. Toi, T. Tsuzuki, T. Watari, H. Yamada<br />
Turbulence, transport <strong>and</strong> q measurements in TEXT<br />
(<strong>IAEA</strong>-CN-50/A-V-3-2) 293<br />
A.J. Wootton, M. Austin, R.D. Bengtson, J.A. Boedo, R.V. Bravenec,<br />
D.L. Brower, J. Chen, G. Cima, K.A. Conner, T.P. Crowley,<br />
P.H. Diamond, R. Durst, P.H. Edmonds, S.P. Fan, J.C. Forster,<br />
M.S. Foster, R.F. G<strong>and</strong>y, K.W. Gentle, G.A. Hallock, R.L. Hickok,<br />
L.K. Huang, W.C. Jennings, J.Y. Kim, S. Kim, H. Lin,<br />
N.C. Luhmann, Jr., S.C. McCool, W.H. Miner, A. Ouroua,<br />
D.M. Patterson, W.A. Peebles, P.E. Phillips, T.L. Rhodes, B. Richards,<br />
C.P. Ritz, D.W. Ross, W.L. Rowan, P.M. Schoch, D. Sing,<br />
E. Synakowski, P.W. Terry, D. Thomas, K. Wenzel, W.P. West,<br />
J. C. Wiley, D. Wroblewski, X.Z. Yang, X.H. Yu, Z. Zhang<br />
Comparative study of central confinement in the TJ-I tokamak<br />
with transport at the edge due to electrostatic fluctuations<br />
(<strong>IAEA</strong>-CN-50/A-V-3-3) 299<br />
B. Zurro, C. Hidalgo, C. Pardo, M.A. Pedrosa, F. Mompedn,<br />
A.P. Navarro, TJ-I Group<br />
Transport studies on TFTR utilizing perturbation techniques<br />
(<strong>IAEA</strong>-CN-50/A-V-4) 307<br />
P.C. Efthimion, M. Bitter, E.D. Fredrickson, R.J. Goldston,<br />
GW. Hammett, K.W. Hill, H. Hsuan, R.A. Hulse, R. Kaita,<br />
D.K. Mansfield, D.C. McCune, K.M. McGuire, S.S. Medley,<br />
D. Mueller, A.T. Ramsey, S.D. Scott, B.C. Stratton, K.-L. Wong,<br />
TFTR Group, H. Biglari, P.H. Diamond, Y. Takase, V.A. Vershkov<br />
Current driven turbulence <strong>and</strong> microturbulent fluctuations in the TORTUR<br />
<strong>and</strong> STOR-M tokamaks (<strong>IAEA</strong>-CN-50/A-V-5) 323<br />
A.J.H. Donne, C.J. Barth, B. De Groot, N.J. Lopes Cardozo,<br />
H. De Kluiver, G.J.J. Remkes, M. Emaami, A. Hirose, O. Mitarai,<br />
A. Sarkissian, H.M. Skarsgard, S.W. Wolfe, W. Zhang<br />
Recent TEXTOR results (<strong>IAEA</strong>-CN-50/A-VI-l) 331<br />
TEXTOR Team
Resonant isl<strong>and</strong> divertor experiments on TEXT (<strong>IAEA</strong>-CN-50/A-VI-2-1) 341<br />
J.S. DeGrassie, T.E. Evans, G.L. Jackson, N. Ohyabu, S.C. McCool,<br />
K. W. Gentle, W.L. Rowan, A.J. Wootton, F. Karger, G. Haas<br />
Resonant helical divertor experiment using large m/n = 3/1, 4/1 isl<strong>and</strong>s<br />
in the JIPP T-IIU tokamak (<strong>IAEA</strong>-CN-50/A-VI-2-2) 347<br />
T.E. Evans, K. Adati, A. Ando, D.R. Baker, J.S. DeGrassie,<br />
H.R. Garner, Y. Hamada, S. Hidekuma, A.M. Howald, K. Ida,<br />
O. Kaneko, K. Kawahata, S. Kitagawa, T. Kumazawa, T. Kuroda,<br />
A. W. Leonard, K. Masai, K. Matsuura, A. Mohri, S. Morita,<br />
Y. Ogawa, S. Okamura, T. Ozaki, L.S. Peranich, M. Sakamoto,<br />
K.N. Sato, S. Tanahashi, K. Toi, Y. Tomita, T. Watari, H. Yamada,<br />
K. Yamazaki, <strong>and</strong> the ICRF, NBI <strong>and</strong> NTX Operation Groups<br />
Investigations on the MT-1 tokamak (<strong>IAEA</strong>-CN-50/A-VI-3-1) 353<br />
J.S. Bakos, G. Burger, IB. Foldes, P.E. Giese, D. Hildebr<strong>and</strong>t,<br />
P.N. Igndcz, S. Kdlvin, L.N. Khimchenko, L. Koltai, F. Pdszti,<br />
G. Petravich, J. Szigeti, D. Venzke, L. Weixelbaum, V. Wenzel,<br />
S. Zoletnik<br />
Edge turbulence during the combined lower hybrid/Ohmic heating regimes<br />
on the CASTOR tokamak (<strong>IAEA</strong>-CN-50/A-VI-3-2) 359<br />
J. Stockel, L. Kryska, J. Badalec, F. Zdcek, J. Datlov, K. Jakubka,<br />
V. Kopecky, P. Magula, M. Valovic, S. Nanobashvili, M.G. Shats<br />
Global power balance <strong>and</strong> local heat transport in JET<br />
(<strong>IAEA</strong>-CN-50/A-VII-l) 367<br />
A. Taroni, B. Balet, G. Betello, V.P. Bhatnagar, J.P. Christiansen,<br />
J.G. Cordey, G. Corrigan, S. Corti, D.F. Duchs, R. Galvao, G. Gorini,<br />
N. Gottardi, M. von Hellerman, W. Han, J. Jacquinot, O. Kardaun,<br />
P.P. Lallia, L. Lauro-Taroni, P.J. Lomas, D. Muir, P.H. Rebut,<br />
C. Sack, G.L. Schmidt, P. Smeulders, D.F.H. Start, T.E. Stringer,<br />
P.R. Thomas, K. Thomsen, F. Tibone, M.L. Watkins, H. Weisen<br />
Sawtooth activity <strong>and</strong> current density profiles in JET<br />
(<strong>IAEA</strong>-CN-50/A-VII-2) 377<br />
D.J. Campbell, J.G. Cordey, A.W. Edwards, R.D. Gill, E. Lazzaro,<br />
G. Magyar, A.L. McCarthy, J. O'Rourke, F. Pegoraro, F. Porcelli,<br />
P. Smeulders, D.F.H. Start, P. Stubberfield, J.A. Wesson,<br />
E. Westerhof, D. Zasche<br />
Research on sawtooth oscillations <strong>and</strong> disruptions using soft X-ray<br />
tomography (<strong>IAEA</strong>-CN-50/A-VII-3) 387<br />
Y. Nagayama, S. Tsuji, K. Miyamoto, K. Kawahata, N. Noda,<br />
S. Tanahashi, J. Fujita<br />
Stability of TFTR plasmas (<strong>IAEA</strong>-CN-50/A-VII-4) 395<br />
J. Manickam, V. Arunasalam, C. W. Barnes, M. G. Bell, M. Bitter,<br />
H.-S. Bosch, N.L. Bretz, R. Budny, C.E. Bush, A. Cavallo, T.K. Chu,<br />
S.A. Cohen, P.L. Colestock, S.L. Davis, D.L. Dimock, H.F. Dylla,
P.C. Efthimion, A.B. Ehrhardt, R.J. Fonck, E.D. Fredrickson,<br />
H.P. Furth, G. Gammel, R.J. Goldston, G.J. Greene, B. Grek,<br />
L.R. Grisham, G.W. Hammett, R.J. Hawryluk, H.W. Hendel,<br />
K.W. Hill, E. Hinnov, J.C. Hosea, R.B. Howell, H. Hsuan, R.A. Hulse,<br />
K.P. Jaehnig, A.C. Janos, D.L. Jassby, F.C. Jobes, D.W. Johnson,<br />
J.L. Johnson, L.C. Johnson, R. Kaita, C. Kieras-Phillips,<br />
S.J. Kilpatrick, V.A. Krupin, G. Kuo-Petravic, P.H. LaMarche,<br />
W.D. Longer, B. LeBlanc, R. Little, A.I. Lysojvan, D.M. Manos,<br />
D.K. Mansfield, E. Mazzucato, R.T. McCann, M.P. McCarthy,<br />
D.C. McCune, K.M. McGuire, D.H. McNeill, D.M. Meade,<br />
S.S. Medley, D.R. Mikkelsen, A. Miller, D.A. Monticello, R.W. Motley,<br />
D. Mueller, Y. Murakami, J.A. Murphy, E.B. Nieschmidt, D.K. Owens,<br />
H.K. Park, W. Park, A.T. Ramsey, M.H. Redi, A.L. Roquemore,<br />
P.H. Rutherford, T. Saito, N.R. Sauthoff, G. Schilling, J. Schivell,<br />
G.L. Schmidt, S.D. Scott, J.C. Sinnis, J.E. Stevens, W. Stodiek,<br />
B.C. Stratton, G.D. Tait, G. Taylor, J.R. Timberlake, H.H. Towner,<br />
M. Ulrickson, S. Von Goeler, R.M. Wiel<strong>and</strong>, M.D. Williams,<br />
J.R. Wilson, K.-L. Wong, S. Yoshikawa, K.M. Young, M.C. Zarnstorff,<br />
S.J. Zweben<br />
Magnetic turbulence <strong>and</strong> resistive MHD instabilities in a 0.6 < q < 3<br />
poloidal divertor tokamak (<strong>IAEA</strong>-CN-50/A-VII-5) 409<br />
Y.Z. Agim, J.D. Callen, Z. Chang, R.N. Dexter, J.A. Goetz,<br />
D.E. Graessle, E. Haines, D. Kortbawi, M.A. LaPointe, R.A. Moyer,<br />
Z. Ning, S.C. Prager, T.D. Rempel, J.C. Sprott, I. Tan, E. Uchimoto<br />
Measurement of MHD instabilities in high beta tokamaks<br />
(<strong>IAEA</strong>-CN-50/A-VII-6) 415<br />
M.E. Mauel, T.H. Ivers, H.Y. Che, D. Chen, D. Gates, T.C. Marshall,<br />
G.A. Navratil, J. Wang, D.S. Darrow, M. Ono<br />
Study of plasma MHD stability in T-7 <strong>and</strong> T-10 tokamaks<br />
(<strong>IAEA</strong>-CN-50/A-VII-7) 423<br />
A. A. Bagdasarov, V.V. Chistyakov, A.N. Chudnovskij, N.V. Ivanov,<br />
A.M. Kakurin, P.P. Khvostenko, P.E. Kovrov, D.A. Martynov,<br />
N.L Vasin, V.V. Volkov<br />
Relaxation of q profile in a high beta very low q tokamak plasma in TPE-2<br />
(<strong>IAEA</strong>-CN-50/A-VII-8) 437<br />
H. Kiyama, K. Hayase, I. Hirota, S. Kiyama, Y. Maejima, Y. Sato,<br />
S. Takeda, E. Yahagi, H. Ashida, K. Sugisaki, K. Koyama,<br />
A.A.M. Oomens<br />
Disruption control in the tokamak (<strong>IAEA</strong>-CN-50/A-VII-9) 445<br />
T.C. Hender, J. Hugill, D.C. Robinson, T.N. Todd, S. Arshad,<br />
A.W. Morris, K. Grassie, K.S. Riedel
Particle removal capabilities of the toroidal pump limiter ALT-II — Poloidal<br />
asymmetries <strong>and</strong> ICR heating (<strong>IAEA</strong>-CN-50/A-VIMO) 453<br />
K.-H. Dippel, K.-H. Finken, A. Hardtke, G.H. Wolf, TEXTOR Team,<br />
W.J. Corbett, D.M. Goebel, R.W. Conn, R.A. Moyer, R.T. McGrath,<br />
J.G. Watkins, A. Miyahara, A. Sagara, ICRH Team<br />
The role of limiters <strong>and</strong> walls in impurity production<br />
(<strong>IAEA</strong>-CN-50/A-VII-ll) 461<br />
G.M. McCracken, G.F. Matthews, C.S. Pitcher, SJ. Fielding, J. Allen,<br />
R. Barnsley, D.H.J. Goodall, N. Hawkes, J. Hugill, P.C. Johnson,<br />
L.N. Khimchenko, P.C. Stangeby, A.M. Ternopol<br />
The plasma boundary in JET (<strong>IAEA</strong>-CN-50/A-VII-12) 467<br />
L. De Kock, P.E. Stott, S. Clement, S.K. Erents, P.J. Harbour,<br />
M. Laux, G.M. McCracken, C.S. Pitcher, M.F. Stamp, P.C. Stangeby,<br />
D.D.R. Summers, A.J. Tagle<br />
Investigation of limiter scrape-off layer on LIBTOR tokamak<br />
(<strong>IAEA</strong>-CN-5O/A-VII-13) 477<br />
V.M. Leonov, N.P. Malakhov, V.G. Zhukovskij, A.M. Alabyad,<br />
N.M. Bhieh, A.M. Hashkel, S.A. Seghayer<br />
Measurements of correlations between thermal <strong>and</strong> particle transport<br />
in JET (<strong>IAEA</strong>-CN-50/A-VII-14) 483<br />
A.D. Cheetham, A. Gondhalekar, J.C.M. De Haas, O.N. Jarvis,<br />
P.D. Morgan, J. O'Rourke, G. Sadler, M.L. Watkins<br />
Experimental results from initial operation of the Tokamak de Varennes<br />
(<strong>IAEA</strong>-CN-50/A-VII-15) 495<br />
R.A. Bolton, G. Abel, C. Belanger, A. Boileau, C. Boucher,<br />
J. Castracane, G. Chevalier, P. Couture, R. Decoste, Y. Demers,<br />
K. Dimoff, V. Glaude, B.C. Gregory, E. Haddad, C. Janicki,<br />
J. Kalnavarns, J.-L. Lachambre, G. LeClair, C. MacLatchy, H.H. Mai,<br />
C.R. Neufeld, G.W. Pacher, H.D. Packer, R. Paynter, D. Poirier,<br />
G. Ratel, N. Richard, G. Ross, R.A. Saint-Jacques, M. Saint-Onge,<br />
C. Simm, B.L. Stansfield, B. Terreault, D. Theriault, G. Veilleux,<br />
D. Whyte, W. Zuzak<br />
Characteristics of banana regime conductivity in JT-60<br />
(<strong>IAEA</strong>-CN-50/A-VII-16) 505<br />
M. Kikuchi, T. Hirayama, H. Kubo, M. Akiba, T. Ando, K. Annoh,<br />
T. Aoyagi, K. Arakawa, M. Azumi, T. Fujii, T. Fukuda, A. Funahashi,<br />
K. Hamamatsu, M. Honda, H. Horiike, N. Hosogane, T. Hjima,<br />
Y. Ikeda, T. Imai, S. Ishida, K. Itami, T. ho, Y. Kamada, K. Kawasaki,<br />
Y. Kawano, H. Kimura, T. Kimura, H. Kishimoto, Y. Koide, T. Koike,<br />
I. Kondo, S. Konoshima, S. Kunieda, K. Kurihara, M. Kuriyama,<br />
Y. Kusama, S. Maehara, K. Maeno, T. Matoba, S. Matsuda,<br />
M. Matsukawa, T. Matsukawa, M. Matsuoka, Y. Matsuzaki, N. Miya,<br />
K. Miyachi, M. Mizuno, M. Nagami, A. Nagashima, K. Nagashima,
T. Nagashima, O. Naito, H. Nakamura, M. Nemoto, Y. Neyatani,<br />
H. Ninomiya, T. Nishitani, K. Odazima, N. Ogiwara, T. Ohga,<br />
M. Ohta, K. Omori, S. Omori, T. Ozeki, M. Saigusa, K. Sakamoto,<br />
A. Sakasai, M. Sato, M. Seimiya, M. Seki, S. Seki, K. Shimizu,<br />
M. Shimizu, Y. Shimomura, H. Shirai, H. Shirakata, T. Sugie,<br />
S. Takahashi, H. Takatsu, H. Takeuchi, S. Tamura, Y. Tanaka,<br />
K. Tani, K. Tobita, N. Toyoshima, S. Tsuji, M. Tsuneoka,<br />
K. Uehara, K. Ushigusa, I. Yonekawa, H. Yoshida, R. Yoshino<br />
PLASMA HEATING AND CURRENT DRIVE (Session E)<br />
Study of density limit <strong>and</strong> low q(aL) regimes with ECRH on T-10<br />
(<strong>IAEA</strong>-CN-50/E-I-l-l) 513<br />
V. V. Alikaev, A. A. Bagdasarov, Yu. V. Balabanov, E.L. Berezovskij,<br />
A.B. Berlizov, G.A. Bobrovskij, A.A. Borshchegovskij, N.L. Vasin,<br />
V.A. Vershkov, V.P. Vlasov, V.V. Volkov, Yu.A. Gorelov,<br />
A.V. Gorshkov, S.A. Grashin, V.V. Dreval, MM. Dremin,<br />
S.M. Egorov, Yu.V. Esiptchuk, S.L. Efremov, V.A. Zhuravlev,<br />
V.S. Zaveryaev, N.V. Ivanov, V.I. Win, A.M. Kakurin,<br />
Yu.Yu. Karzhavin, Yu.N. Kilpio, A.Ya. Kislov, P.E. Kovrov,<br />
V.V. Kuznetsov, Yu.S. Maksimov, A.A. Medvedev, I.V. Miroshnikov,<br />
A.L. Nabatov, S.V. Neudachin, V.M. Novikov, G.E. Notkin,<br />
A.B. Pimenov, V.I. Poznyak, I.A. Popov, S.V. Popovichev,<br />
N.R. Potemkin, K.A. Razumova, I.G. Rodichkin, IN. Roj,<br />
P. V. Savrukhin, V. V. Sannikov, V. Yu. Sergeev, M.M. Sokolov,<br />
A.M. Solntsev, M.M. Stepanenko, V.S. Strelkov, A.V. Sushkov,<br />
A.V. Tarakanov, K.N. Tarasyan, V.V. Timonin, K.B. Titishov,<br />
V.M. Trukhin, V.L. Ygolev, A.N. Fyakhretdinov, A.V. Chankin,<br />
V.V. Chistyakov, D.Yu. Shugaev, A.F. Sherbak, G.S. Yaramishev,<br />
V.A. Markelov, B.V. Shishkin, S.A. Hokin<br />
Electron cyclotron heating experiments in the DIII-D tokamak<br />
(<strong>IAEA</strong>-CN-50/E-I-2) 527<br />
R. Prater, N.H. Brooks, K.H. Burrell, T.N. Carlstrom, M.S. Chance,<br />
M.S. Chu, D. Content, J.C. DeBoo, T. Edlington, J. Ferron,<br />
R. Freeman, P. Gohil, R.J. Groebner, R.W. Harvey, D.N. Hill,<br />
C.L. Hsieh, R.A. James, S. Janz, A.G. Kellman, L.L. Lao, J.M. Lohr,<br />
T.C. Luce, J.L. Luxon, M.A. Mahdavi, K. Matsuda, C.P. Moeller,<br />
T. Okazaki, T.H. Osborne, T. Ozeki, M. Perry, K. Sakamoto,<br />
T.C. Simonen, R.T. Snider, B.W. Stallard, R.D. Stambaugh,<br />
R.E. Stockdale, E.J. Strait, T. Taylor, R. Wood
Inside launch electron cyclotron heating <strong>and</strong> current drive on DITE<br />
(<strong>IAEA</strong>-CN-50/E-I-3) 541<br />
M. Ashraf, R. Barnsley, N. Deliyanakis, T. Edlington, S.J. Fielding,<br />
J. Hugill, P.C. Johnson, B. Lloyd, S. Manhood, P. Mantica,<br />
G.F. Matthews, W. Millar, M. O'Brien, R.A. Pitts, A.C. Riviere,<br />
D.C. Robinson, A. Simonetto, G. Vayakis<br />
High power ECRH <strong>and</strong> ICRF heating experiments in the Heliotron E<br />
<strong>and</strong> DR devices (<strong>IAEA</strong>-CN-50/E-I-4) 551<br />
O. Motojima, T. Mutoh, M. Sato, H. Zushi, H. Okada, N. Noda,<br />
H. Kaneko, T. Mizuuchi, K. Kondo, S. Sudo, Y. Takeiri, F. Sano,<br />
K. Itoh, S. Morimoto, K. Hanatani, K. Akaishi, T. Obiki, A. Iiyoshi,<br />
S. Morimoto, N. Yanagi, M. Sato, S. Besshou, S. Kobayashi, M. lima,<br />
K. Ichiguchi, M. Wakatani, T. Obiki, A. liyoshi<br />
RF current drive <strong>and</strong> MHD instability control by EC <strong>and</strong> LH waves<br />
on the WT-3 tokamak (<strong>IAEA</strong>-CN-50/E-I-5) 563<br />
S. Tanaka, Y. Terumichi, T. Maekawa, M. Nakamura, A. Ando, K. Ogura,<br />
H. Tanaka, M. Hda, S. Ide, K. Iwamura, A. Yamazaki, T. Itoh,<br />
M. Iwamasa, K. Hanada, R. Itatani, M. Fukao, T. Fujimoto,<br />
H. Suemitsu<br />
Heating <strong>and</strong> confinement studies with low field side ICRH in TEXTOR<br />
(<strong>IAEA</strong>-CN-50/E-II-l) 571<br />
R.R. Weynants, J.-M. Beuken, L. De Keyzer, T. Delvigne, P. Descamps,<br />
F. Durodie, M. Gaigneaux, M. Jadoul, R. Koch, D. Lebeau,<br />
A.M. Messiaen, J. Ongena, X.M. Shen, D. Van Eester,<br />
R. Van Nieuwenhove, G. Van Oost, G. Van Wassenhove,<br />
P.E. V<strong>and</strong>enplas, G. Bertschinger, P. Bogen, Y. Cao, H. Conrads,<br />
K.-H. Dippel, H.G. Esser, K.-H. Finken, G. Fuchs, B. Giesen,<br />
E. Graffmann, H. Hartwig, E. Hintz, F. Hoenen, K. Hothker,<br />
B. Kardon, L. Ko'nen, M. Korten, Y.T. Lie, A. Pospieszczyk,<br />
D. Rusbuldt, U. Samm, J. Schluter, B. Schweer, H. Soltwisch,<br />
F.L. Waelbroeck, G. Waidmann, P. Wienhold, J. Winter, G.H. Wolf,<br />
R.W. Conn, W.J. Corbett, D.M. Goebel<br />
Long pulse high power ion cyclotron resonance heating on ASDEX<br />
(<strong>IAEA</strong>-CN-50/E-II-2) 583<br />
J.-M. Noterdaeme, F. Ryter, F. Wesner, B. Bomba, H.-S. Bosch,<br />
M. Brambilla, K. BiXchl, A. Eberhagen, H.-U. Fahrbach, O. Gehre,<br />
O. Gruber, H. Herrmann, F. Hofineister, G. Janeschitz, O. Kliiber,<br />
M. Kornherr, R.S. Lang, V. Mertens, E.R. Miiller, H. Niedermeyer,<br />
W. S<strong>and</strong>mann, K.-H. Steuer, F. Wagner, J. Bdumler, G. Becker,<br />
W. Becker, K. Brau, F. Braun, H. Bruhns, R. Buchse, A. Carlson,<br />
B. De Sutler, G. Dodel, R. Fritsch, G. Fussmann, K. W. Gentle,<br />
J. Gernhardt, L. Giannone, G. von Gierke, E. Glock, S. Von Goeler,<br />
G. Haas, J. Hofinann, E. Holzhauer, K. Hiibner, A. Kallenbach,
F. Karger, M. Kaufmann, K. Krieger, K. Lackner, G. Lisitano,<br />
M. Lorcher, H.M. Mayer, K. McCormick, D. Meisel,<br />
H.D. Murmann, A.B. Murphy, J. Neuhauser, R. Nolle, Y. Ogawa,<br />
W. Poschenrieder, S. Puri, D.E. Roberts, H. Rohr, A. Rudyj,<br />
F. Schneider, U. Schneider, E. Sevillano, G. Siller, E. Simmet,<br />
F.X. Soldner, E. Speth, A. Stabler, K. Steinmetz, U. Stroth, N. Tsois,<br />
O. Vollmer, H. Wedler, H. WiXrz<br />
Experimental <strong>and</strong> theoretical studies of ion cyclotron heating on JET<br />
(<strong>IAEA</strong>-CN-5O/E-II-3) 593<br />
D.F.H. Start, V.P. Bhatnagar, D.A. Boyd, M. Bures, D.J. Campbell,<br />
J.P. Christiansen, P.L. Colestock, J.G. Cordey, W. Core,<br />
G.A. Cottrell, L.G. Eriksson, M.P. Evrard, T. Hellsten, J. Jacquinot,<br />
O.N. Jarvis, S. Kissel, S. Knowlton, H.W. Lean, P.J. Lomas, C. Lowry,<br />
A.L. McCarthy, P. Nielsen, J. O'Rourke, G. Sadler, A. Tanga,<br />
P.R. Thomas, K. Thomsen, B. Tubbing, P. Van Belle, J.A. Wesson<br />
Second harmonic ICRF heating experiments in JT-60<br />
(<strong>IAEA</strong>-CN-50/E-II-4) 605<br />
T. Fujii, H. Kimura, M. Saigusa, M. Akiba, T. Ando, K. Annoh,<br />
T. Aoyagi, K. Arakawa, M. Azumi, T. Fukuda, A. Funahashi,<br />
K. Hamamatsu, T. Hirayama, M. Honda, H. Horiike, N. Hosogane,<br />
T. lijima, Y. Ikeda, T. Imai, S. Ishida, K. Itami, T. ho, Y. Kamada,<br />
Y. Kawano, M. Kikuchi, T. Kimura, H. Kishimoto, N. Kobayashi,<br />
Y. Koide, T. Koike, I. Kondo, S. Konoshima, H. Kubo, S. Kunieda,<br />
K. Kurihara, M. Kuriyama, Y. Kusama, S. Maebara, K. Maeno,<br />
T. Matoba, S. Matsuda, M. Matsukawa, T. Matsukawa, M. Matsuoka,<br />
Y. Matsuzaki, N. Miya, K. Miyachi, M. Mizuno, S. Moriyama,<br />
M. Nagami, A. Nagashima, K. Nagashima, T. Nagashima, O. Naito,<br />
H. Nakamura, M. Nemoto, Y. Neyatani, H. Ninomiya, T. Nishitani,<br />
K. Odajima, N. Ogiwara, T. Ohga, M. Ohta, K. Omori, S. Omori,<br />
T. Ozeki, K. Sakamoto, A. Sakasai, M. Sato, M. Seimiya, M. Seki,<br />
S. Seki, K. Shimizu, M. Shimizu, Y. Shimomura, H. Shirai, H. Shirakata,<br />
T. Takizuka, T. Sugie, S. Takahashi, H. Takatsu, H. Takeuchi,<br />
S. Tamura, Y. Tanaka, K. Tani, K. Tobita, N. Toyoshima, S. Tsuji,<br />
M. Tsuneoka, K. Uehara, K. Ushigusa, M. Yamagiwa, I. Yonekawa,<br />
H. Yoshida, R. Yoshino<br />
Full-wave modeling of ion cyclotron heating in tokamaks<br />
(<strong>IAEA</strong>-CN-50/E-II-5) 611<br />
D.B. Batchelor, E.F. Jaeger, B.A. Carreras, V.E. Lynch, H. Weitzner,<br />
K. Imre, D.C. Stevens, V. Fuchs, A. Bers<br />
Lower hybrid experiments in JT-60 (<strong>IAEA</strong>-CN-50/E-III-l) 621<br />
K. Ushigusa, T. Imai, Y. Ikeda, M. Akiba, T. Ando, K. Annoh,<br />
T. Aoyagi, K. Arakawa, M. Azumi, T. Fujii, T. Fukuda, A. Funahashi,<br />
K. Hamamatsu, T. Hirayama, M. Honda, H. Horiike, N. Hosogane,
T. Hjima, S. Ishida, K. Itami, T. Ito, Y. Kamada, Y. Kawano,<br />
K. Kawasaki, M. Kikuchi, H. Kimura, T. Kimura, H. Kishimoto,<br />
Y. Koide, T. Koike, I. Kondo, S. Konoshima, H. Kubo, S. Kunieda,<br />
K. Kurihara, M. Kuriyama, Y. Kusama, S. Maehara, K. Maeno,<br />
T. Matoba, S. Matsuda, M. Matsukawa, T. Matsukawa, M. Matsuoka,<br />
Y. Matsuzaki, N. Miya, K. Miyachi, M. Mizuno, M. Nagami,<br />
A. Nagashima, K. Nagashima, T. Nagashima, O. Naito, H. Nakamura,<br />
M. Nemoto, Y. Neyatani, H. Ninomiya, T. Nishitani, K. Odajima,<br />
N. Ogiwara, T. Ohga, M. Ohta, K. Omori, S. Omori, T. Ozeki,<br />
M. Saigusa, K. Sakamoto, A. Sakasai, M. Sato, M. Seimiya, M. Seki,<br />
S. Seki, K. Shimizu, M. Shimizu, Y. Shimomura, H. Shirai, H. Shirakata,<br />
T. Sugie, S. Takahashi, H. Takatsu, H. Takeuchi, S. Tamura, Y. Tanaka,<br />
K. Tani, K. Tobita, N. Toyoshima, S. Tsuji, M. Tsuneoka, K. Uehara,<br />
I. Yonekawa, H. Yoshida, R. Yoshino<br />
Steady state current drive by lower hybrid wave in TRIAM-1M tokamak<br />
(<strong>IAEA</strong>-CN-50/E-III-2) 629<br />
S. Itoh, N. Hiraki, Y. Nakamura, K. Nakamura, A. Nagao, S. Moriyama,<br />
S. Kawasaki, E. Jotaki<br />
Lower hybrid heating in high density discharges in Frascati Tokamak<br />
(<strong>IAEA</strong>-CN-50/E-III-3) 637<br />
F. Alladio, E. Barbato, G. Bardotti, R. Bartiromo, F. Bombarda,<br />
G. Bracco, G. Buceti, P. Buratti, E. Caiaffa, A. Cardinali, R. Cesario,<br />
F. Crisanti, R. De Angelis, F. De Marco, M. De Pretis, D. Frigione,<br />
L. Gabellieri, R. Giannella, M. Grolli, S. Mancuso, M. Marinucci,<br />
G. Mazzitelli, F. Orsitto, L. Panaccione, V. Pericoli-Ridolfini,<br />
L. Pieroni, S. Podda, G.B. Righetti, F. Romanelli, D. Santi,<br />
F. Santini, S.E. Segre, G. Tonini, A.A. Tuccillo, O. Tudisco, V. Zanza<br />
Lower hybrid wave absorption <strong>and</strong> ion heating studies in the FT-2 tokamak<br />
(<strong>IAEA</strong>-CN-50/E-III-4) 645<br />
V.N. Budnikov, L.A. Esipov, M.A. Irzak, KM. Novik, A.Yu. Stepanov,<br />
V.O. Aleks<strong>and</strong>rov<br />
Current drive <strong>and</strong> confinement of angular momentum in TFTR<br />
(<strong>IAEA</strong>-CN-50/E-III-5) 655<br />
S.D. Scott, M. Bitter, R.J. Fonck, R.J. Goldston, R.B. Howell, H. Hsuan,<br />
K.P. Jaehnig, G. Pautasso, G. Schilling, B.C. Stratton, M.C. Zarnstorff,<br />
C.W. Barnes, M.G. Bell, H.-S. Bosch, C.E. Bush, A: Cavallo,<br />
H.F. Dylla, A.B. Ehrhardt, E.D. Fredrickson, G. Gammel, B. Grek,<br />
L.R. Grisham, G.W. Hammett, R.J. Hawryluk, H.W. Hendel, K.W. Hill,<br />
A.C. Janos, D.L. Jassby, F.C. Jobes, D.W. Johnson, S.J. Kilpatrick,<br />
B. LeBlanc, D.K. Mansfield, R.T. McCann, D.C. McCune,<br />
KM. McGuire, D.H. McNeill, S.S. Medley, D. Mueller, J.A. Murphy,<br />
D.K. Owens, H.K. Park, A.T. Ramsey, A.L. Roquemore, J. Schivell,<br />
J.E. Stevens, G.D. Tail, G. Taylor, J.R. Timberlake, H.H. Towner,
M. Ulrickson, R.M. Wiel<strong>and</strong>, M.D. Williams, K.-L. Wong, S.J. Zweben,<br />
<strong>and</strong> the TFTR Group<br />
DIII-D neutral beam current drive experiments at high beta poloidal<br />
(<strong>IAEA</strong>-CN-50/E-III-6) 669<br />
T.C. Simonen, M. Matsuoka, O.K. Bhadra, M.S. Chance, K.H. Burrell,<br />
R.W. Callis, M.S. Chu, A.P. Colleraine, J. Ferron, J.M. Greene,<br />
R.J. Groebner, R.W. Harvey, D.N. Hill, R.-M. Hong, R.A. James,<br />
A.G. Kellman, J. Kim, S. Kinoshita, L.L. Lao, J.M. Lohr, R.L. Miller,<br />
T.H. Osborne, P.I. Peter sen, P. A. Politzer, G.D. Porter, H. St. John,<br />
M.J. Schaffer, B.W. Stallard, R.D. Stambaugh, E.J. Strait, T.S. Taylor<br />
New current drive <strong>and</strong> confinement techniques for improved tokamak<br />
operation (<strong>IAEA</strong>-CN-50/E-III-7) 681<br />
T. Ohkawa, V.S. Chan, M.S. Chu, R.R. Dominguez, R.L. Miller<br />
ICRF heating on the TFTR tokamak for Prf up to 2.5 MW<br />
(<strong>IAEA</strong>-CN-50/E-IV-l) 691<br />
J.R. Wilson, M.G. Bell, A. Cavallo, P.L. Colestock, W. Borl<strong>and</strong>,<br />
W. Gardner, G.J. Greene, G. W. Hammett, R.J. Hawryluk, H. W. Hendel,<br />
D. Hoffman, J.C. Hosea, K.P. Jaehnig, F.C. Jobes, R. Kaita,<br />
C. Kieras-Phillips, A.I. Lysojvan, D.K. Mansfield, S.S. Medley,<br />
D. Mueller, D.K. Owens, D. Smithe, J.E. Stevens, D. Swain, G.D. Tail,<br />
G. Taylor, M. Ulrickson, K.-L. Wong, S.J. Zweben, <strong>and</strong> the TFTR Group<br />
Investigation of ICRH on the TUMAN-3 tokamak (<strong>IAEA</strong>-CN-50/E-IV-2) .... 699<br />
L.G. Askinasi, V.I. Afanas'ev, V.E. Golant, S.G. Goncharov,<br />
M.P. Gryaznevich, V.V. Dyachenko, A.B. Izvozchikov, A.A. Korotkov,<br />
S.V. Krikunov, S.V. Lebedev, B.M. Lipin, I. P. Pavlov,<br />
G.T. Razdobarin, V.V. Rozhdestvenskij, N.V. Sakharov, M.A. Khalilov,<br />
F.V. Chernyshev, KG. Shakhovets, O.N. Shcherbinin, S.P. Yaroshevich,<br />
Yu.A. Kosttsov, R.N. Litunovskij, O.A. Minyaev<br />
Conversion <strong>and</strong> cyclotron absorption of fast magnetosonic waves in a<br />
non-uniform magnetic field (<strong>IAEA</strong>-CN-50/E-IV-3) 707<br />
S.V. Kasilov, A.V. Longinov, S.S. Pavlov, A.I: Pyatak, K.N. Stepanov<br />
Full wave solutions of the lower hybrid wave propagation in Tore Supra<br />
(<strong>IAEA</strong>-CN-50/E-IV-4) 721<br />
D. Moreau, J.M. Rax, A. Samain<br />
Experiments on effectiveness of mode controlled ICRF for both<br />
axisymmetric mirrors <strong>and</strong> tokamaks (<strong>IAEA</strong>-CN-50/E-IV-5) 727<br />
Y. Yasaka, H. Takeno, S. Inoue, R. Itatani<br />
Improvement of RF current drive density limit in the JFT-2M tokamak<br />
(<strong>IAEA</strong>-CN-50/E-IV-6) 733<br />
T. Yamamoto, H. Aikawa, K. Hoshino, S. Kasai, T. Kawakami,<br />
H. Kawashima, T. Kondoh, H. Maeda, T. Matsuda, H. Matsumoto,<br />
Y. Miura, M. Mori, K. Odajima, H. Ogawa, T. Ogawa, K. Ohasa,<br />
H. Ohtsuka, S. Sengoku, T. Shoji, N. Suzuki, H. Tamai, Y. Uesugi,
T. Yamauchi, I. Nakazawa, K. Hasegawa, A. Honda, I. Ishibori,<br />
Y. Kashiwa, M. Kazawa, K. Kikuchi, H. Okano, E. Sato, T. Shibata,<br />
T. Shiina, K. Suzuki, T. Tani, T. Tokutake, S. Uno<br />
Non-inductive startup <strong>and</strong> current ramp-up scenario optimization<br />
for a tokamak reactor (<strong>IAEA</strong>-CN-50/E-IV-7) 739<br />
G. V. Pereverzev<br />
Access to second stability via profile control with RF current drive<br />
(<strong>IAEA</strong>-CN-50/E-IV-8) 747<br />
M. Porkolab, P.T. Bonoli, K.I. Chen, S. Coda, M. Gaudreau, M. Gerver,<br />
J. Kesner, R. Kirkwood, B. Lane, S. Luckhardt, R.S. Post, J. Ramos,<br />
J. Squire<br />
Electron cyclotron wave heating studies on the CT-6B tokamak<br />
(<strong>IAEA</strong>-CN-50/E-IV-9) 753<br />
Yaoquan Luo, Hongying Jiang, Long Wang, Size Yang, Xiazhi Qi,<br />
Zanliang Li, Wenshu Wang, Wenlai Li, Hua Zhao, Fuzhuan Tan,<br />
Jihui Tang, Zexiang Zhang<br />
Microwave heating <strong>and</strong> current drive in tokamaks (<strong>IAEA</strong>-CN-50/E-IV-10) ... 759<br />
B.I. Cohen, R.H. Cohen, G.D. Kerbel, B.G. Logan, Y. Matsuda,<br />
M.G. McCoy, W.M. Nevins, T.D. Rognlien, G.R. Smith, R.W. Harvey,<br />
A.H. Kritz, P.T. Bonoli, M. Porkolab<br />
Second electron cyclotron harmonic absorption at downshifted frequencies<br />
(<strong>IAEA</strong>-CN-50/E-IV-ll) 767<br />
S. Pesic<br />
Chairmen of Sessions <strong>and</strong> Secretariat of the Conference 775
Session A-I<br />
Session A-II<br />
Session A-III<br />
Session A-IV<br />
Session A-V<br />
Session A-VI<br />
Session A-VII<br />
(Posters)<br />
ARTSIMOVICH MEMORIAL LECTURE<br />
AND<br />
TOKAMAK EXPERIMENTS<br />
J. TACHON<br />
D.M. MEADE<br />
(Session A)<br />
Chairmen<br />
France<br />
United States of America<br />
Papers A-II-5-1 <strong>and</strong> A-H-5-2 were presented<br />
by Yuping Huo as Rapporteur<br />
B. COPPI<br />
K.M. McGUIRE<br />
B.B. KADOMTSEV<br />
United States of America<br />
United States of America<br />
Union of Soviet Socialist Republics<br />
Papers A-V-2-1 <strong>and</strong> A-V-2-2 were presented<br />
by W.A. Peebles as Rapporteur<br />
Papers A-V-3-1, A-V-3-2 <strong>and</strong> A-V-3-3 were presented<br />
by K. Kawahata as Rapporteur<br />
N. INOUE Japan
ARTSIMOVICH MEMORIAL LECTURE<br />
C. MAISONNIER<br />
Director of the Fusion Programme,<br />
Commission of the European Communities,<br />
Brussels<br />
Mr. Chairman, Ladies <strong>and</strong> Gentlemen,<br />
<strong>IAEA</strong>-CN-50/A-0<br />
The memory of Lev Andreevich Artsimovich certainly does not need to be kept<br />
alive by the lecture that I have the honour to deliver today. Indeed, Artsimovich's<br />
name is clearly engraved on two cornerstones of controlled thermonuclear fusion<br />
research: the tokamak, so far the most successful magnetic confinement concept, <strong>and</strong><br />
international co-operation.<br />
What better monument to his memory could be thought of than ITER, the international<br />
thermonuclear experimental tokamak reactor? Since April 1988, ITER conceptual<br />
design activities have been bound together under the auspices of the<br />
International Atomic Energy Agency as the work of four equal partners: the United<br />
States of America, the Soviet Union, Japan <strong>and</strong> the European Community, the latter<br />
including in its contribution Sweden <strong>and</strong> Switzerl<strong>and</strong> <strong>and</strong> now Canada.<br />
The ITER quadripartite initiative has become a reality not only because of support<br />
at the highest political level but also because of the proven ability of fusion scientists<br />
to work together concretely on complex tasks, which has been progressively <strong>and</strong><br />
successfully developed through a variety of schemes: from the setting up of an<br />
integrated European Fusion Programme (the masterpiece of my predecessor,<br />
Professor Palumbo) which made possible a large joint undertaking such as JET, to<br />
bilateral agreements between nations or groups of nations, to multilateral implementing<br />
agreements in the framework of the International Energy Agency (to quote only<br />
one, let me mention the agreement on the large tokamaks which has established<br />
strong links between TFTR, JET <strong>and</strong> JT-60), <strong>and</strong> through the INTOR Workshop.<br />
The Artsimovich Memorial Lectures are a most appropriate occasion for the<br />
fusion community worldwide to think over its work in a broad perspective.<br />
Why fusion?<br />
The world fusion effort evolves in an evolving world. The population on earth,<br />
now five billion, was about three billion when fusion research was first declassified<br />
<strong>and</strong> will be eight billion or more when fusion could start contributing substantial<br />
energy. What the world energy requirement will be then is hard to guess given the<br />
extremely uneven global distribution of primary energy consumption levels over the
4 MAISONNIER<br />
various economies. Depending on the degree <strong>and</strong> rate of levelling out of this distribution<br />
as well as on the extent of success in enhancing the efficiency of energy end use<br />
worldwide, the total energy needs could increase enormously.<br />
Whatever the quantity of energy which will be necessary, there will more <strong>and</strong><br />
more be the requirement of quality: energy must be produced in a manner that is not<br />
only economically but also environmentally acceptable, even if what is <strong>and</strong> will be<br />
environmentally acceptable is a moving target difficult to define. Every source of<br />
energy has its own economic, health <strong>and</strong> environmental costs <strong>and</strong> risks. Reliance on<br />
fossil fuels, apart from problems linked with global or local availability, carries the<br />
risk of global warming (the greenhouse effect) <strong>and</strong> acidification, which is perceived<br />
with increasing acuteness both in public opinion <strong>and</strong> at governmental level. A possible<br />
large scale use of the renewable energy sources (sunlight, biomass, etc.) depends<br />
on local conditions <strong>and</strong> seems to be confronted with high costs <strong>and</strong> substantial<br />
environmental consequences. <strong>Nuclear</strong> power from fission reactors is facing three<br />
main concerns: safety <strong>and</strong> accidental radioactive releases, waste disposal <strong>and</strong> nonproliferation.<br />
The degree of concern in these three areas will most probably be lower<br />
in the case of nuclear power from future fusion reactors, for which, however, it is<br />
too early to tell whether eventually they will be economically competitive.<br />
As to the question "When will the first fusion power plant be built?", Academician<br />
Velikhov reported that Artsimovich once gave the sibylline but probably sound<br />
reply: "When there is great need for it." Against the background of recent<br />
experiences, the need for the development of a diversity of widely accessible long<br />
term energy sources which show promise of being not only technologically feasible<br />
but also acceptable from the economic, safety, environmental <strong>and</strong> non-proliferation<br />
points of view is being perceived more <strong>and</strong> more acutely. It can be objectively<br />
argued, I think, that fusion has the potential of becoming one of these sources.<br />
The technological problems associated with deuterium-tritium fusion reactors,,<br />
which will have to breed their own fuel (tritium) in a lithium blanket surrounding the<br />
reacting plasma, have gradually been revealed by the many conceptual reactor<br />
designs produced within the world fusion community over more than a decade. These<br />
studies have also evidenced that the achievement of the potential environmental <strong>and</strong><br />
safety advantages of fusion will not materialize automatically but will depend to a<br />
large measure on designs specifically tailored to this end, in which the use of low<br />
activation materials could play an important role. The studies have also shown how<br />
economic competitiveness will depend on attaining plasma <strong>and</strong> engineering performances<br />
such as high beta, high wall loading <strong>and</strong> ease of maintenance — performances<br />
which are not yet assured.<br />
However, there are fundamental reasons why future fusion reactors have the<br />
potential to reach a high degree of passive safety <strong>and</strong> to have only a moderate impact<br />
on the environment:<br />
— The reacting chamber of a fusion plant will contain only that quantity of fuel<br />
which is required for immediate use (a few seconds). The energy content of the<br />
fuel will therefore be very small <strong>and</strong> the amount of energy which will be sus-
<strong>IAEA</strong>-CN-50/A-0 5<br />
ceptible to fast release in a fusion reactor in case of accident can in principle<br />
be reduced to very low levels by adequate design, as it is not linked with the<br />
fundamental process of energy production but only with auxiliary systems.<br />
— The radioactivity in a DT fusion plant arises only from the intermediate tritium<br />
fuel <strong>and</strong> from the interaction between neutrons <strong>and</strong> the structural materials of<br />
the plant; the reaction products themselves are not radioactive. The development<br />
of an environmentally benign DT fusion reactor is, therefore, a question<br />
of engineering aimed at maintaining a low tritium inventory <strong>and</strong>, together with<br />
materials development, at keeping the activation of structural materials to a low<br />
level; it has no basic limit due to the fundamental process of energy production<br />
itself. Moreover, one could even conceive of using, in a later stage, instead of<br />
the DT reaction, reactions such as deuterium-helium 3 (D- 3 He) which, at the<br />
cost of more dem<strong>and</strong>ing plasma parameters, would have the potential for<br />
removing most of the environmental concerns. The availability of 3 He, once<br />
considered an insuperable problem, might find solutions in the distant future.<br />
These potential advantages of future fusion reactors, together with the abundance<br />
<strong>and</strong> wide availability of the primary fuel (lithium), should, if properly understood,<br />
be of substantial weight in determining the public attitude towards fusion.<br />
Past achievements<br />
Let me now briefly consider our past achievements. Fusion research has only<br />
recently emerged from the intimacy of the laboratories into highly visible Big Science<br />
public programmes <strong>and</strong> is still mostly in a scientific stage of development, although<br />
a growing fraction of the R&D effort is being devoted to fusion technology.<br />
Successive generations of tokamaks continue to occupy the forefront of magnetic<br />
fusion research, thus contributing most of the papers at these conferences; new<br />
devices of this kind are still under construction. Wisely, however, the major fusion<br />
programmes have maintained the necessary breadth in the toroidal confinement<br />
approach by experimenting with alternative configurations — stellarators, reversed<br />
field pinches <strong>and</strong> others — which are complementary to the tokamaks <strong>and</strong> could<br />
potentially have intrinsic advantages over them for the ultimate reactor. And then<br />
there is the inertial approach to controlled fusion, which is also making good<br />
progress, as will be reported at this conference, but which belongs to a slightly different<br />
world, traditionally not covered by the Artsimovich Memorial Lectures.<br />
The most impressive result so far in controlled thermonuclear fusion research<br />
has been obtained with tokamaks. The value of the product of central ion temperature,<br />
central ion density <strong>and</strong> global energy confinement time, which is the best figure<br />
of merit on the way to the reactor, has increased by almost four orders of magnitude<br />
during the past twenty years. It is now only a factor of four away from breakeven<br />
<strong>and</strong> slightly more than an order of magnitude away from ignition, which is our longed<br />
for milestone marking the achievement of the proof of the scientific feasibility of<br />
fusion power.
6 MAISONNIER<br />
The principal key to such progress has been the increase in gross machine<br />
parameters, <strong>and</strong> it is the relative simplicity of the tokamak concept which has allowed<br />
us to build the large devices we have today. An example of the virtue of size, <strong>and</strong><br />
of course I do not mean only geometrical size, is given by JET, which is the largest<br />
tokamak in the world <strong>and</strong> which is, I think, second to none in scientific output.<br />
Progress has also been made using smaller devices. For instance, substantial<br />
insight into the complexity of cross-field diffusion in reactor relevant plasmas was<br />
brought about by the discovery of the H-mode in ASDEX with a divertor magnetic<br />
separatrix, pointing to the strong influence of edge localized phenomena on global<br />
confinement. Enhanced confinement regimes have also been achieved, with intense<br />
neutral beam heating <strong>and</strong> pellet injection, on tokamaks without divertors. But I cannot<br />
resist quoting the slightly provocative statement of Dr. Furth that' 'in this context of<br />
programmatic success, it is sobering to reflect that identification of the specific physical<br />
phenomena responsible for anomalous transport in toroidal configurations has not<br />
progressed decisively since 1956."<br />
Other reactor relevant critical physics issues are under intense investigation<br />
both in theory <strong>and</strong> in experiments; they concern limits to stable tokamak operation<br />
such as the elongation dependent plasma beta limit, the density limit <strong>and</strong> the control<br />
of disruptions, <strong>and</strong> also the so-called innovative ideas, such as current drive (demonstrated<br />
at the megampere scale in JT-60) <strong>and</strong> various impurity control schemes.<br />
The last untouched physics problem, alpha particle heating, should become<br />
accessible to experimentation about three years from now, when TFTR, JET <strong>and</strong> TSP<br />
(which is the new name of T-14) will enter into their phase of tritium operation.<br />
So we can say that, while mysteries still remain in some or most of these issues,<br />
the conclusion of the scientific phase of fusion is now in sight. It is therefore timely<br />
to plan for the Next Step device on the road towards a prototype reactor, a Next Step<br />
which should complete the demonstration of the scientific feasibility of fusion <strong>and</strong><br />
confront the problems linked with its technological feasibility.<br />
The Next Step<br />
The pace of the major fusion programmes, as they are geared at present, is such<br />
that in some three years from now we will, we hope, have a sufficient scientific <strong>and</strong><br />
technical basis to propose to our authorities the launching of the detailed design of<br />
one or more of the various possible incarnations of a Next Step device, national or<br />
international, with a view to its construction.<br />
Next Step devices are at present in the predesign phase both within the large<br />
fusion programmes (for example NET in the European Community, which is the one<br />
I am most familiar with) <strong>and</strong> in the quadripartite venture, ITER. ITER, whose definition<br />
phase will be formally concluded in November 1988, is conceived as a tokamak<br />
device which, to quote from its terms of reference, "will provide the database in<br />
physics <strong>and</strong> technology necessary for the design <strong>and</strong> construction of a demonstration
<strong>IAEA</strong>-CN-50/A-0 7<br />
fusion power plant." It is estimated that three decades of R&D will be required<br />
before such a demonstration reactor can become operational.<br />
With the Next Step, we should not only develop, test <strong>and</strong> demonstrate technologies<br />
applicable to future fusion reactors but also define safety st<strong>and</strong>ards for these<br />
reactors. And it will be only with the Next Step that we will establish a sufficient basis<br />
to evaluate with some certainty the overall potential of fusion as an energy source.<br />
As in the case of any major decision on high technology, the decision to embark<br />
on the detailed design of the Next Step will have a strong political component. By<br />
that time, the fusion community will have to be able to make a good case on three<br />
different grounds:<br />
— Firstly, we should have a sound scientific <strong>and</strong> technical basis. Work in progress<br />
makes us reasonably confident about this point. I am sure that at this conference<br />
we will have a good opportunity to confirm this confidence not only on the basis<br />
of outst<strong>and</strong>ing scientific results but also on the technological side, thanks, for<br />
instance, to the appearance of the first large superconducting tokamaks: Tore<br />
Supra, which is now in operation, <strong>and</strong> T-15, which is in the final stage of<br />
construction.<br />
— Secondly, we should be able to present convincing safety, environmental <strong>and</strong>,<br />
as far as possible, economic arguments in favour of fusion. So, already now,<br />
long before the characteristics of a practical reactor are known in any detail, it<br />
is essentiaj, even if very challenging, to undertake a systematic <strong>and</strong> continuous<br />
assessment of fusion's potential to achieve attractive combinations of environmental,<br />
safety <strong>and</strong> economic characteristics. International collaboration should<br />
be used to its maximum extent to make progress in these fields, where it could<br />
be particularly helpful. Indeed, first steps are already being taken in this direction<br />
in the framework of the International Energy Agency.<br />
— Thirdly, we should have concrete plans on how the major fusion programmes<br />
could take full advantage of a wide international co-operation, co-operation<br />
which could lead to a single device or to the joint planning of Next Step activities.<br />
Indeed, international co-operation will become more <strong>and</strong> more a necessity<br />
if we want to make the most efficient use of the resources of the world fusion<br />
community. These include, as a particularly precious element, a highly qualified<br />
staff, whose dedication will be a necessary condition for the success of the<br />
Next Step but whose full utilization requires that the Next Step be undertaken<br />
as soon as technically feasible.<br />
Now, at the end of my talk, I would like to stress that international co-operation,<br />
even if extrapolated to an unprecedented level, cannot substitute for strong 'domestic'<br />
programmes. The four large fusion programmes of the world are at present working<br />
together in the ITER conceptual design activities to provide, by the end of 1990, a<br />
design which will then be available for all ITER Parties to use, either in their own<br />
national programme or as part of a larger international co-operative programme.
8 MAISONNIER<br />
Some of the ITER Parties also have national plans to embark, at about the same time,<br />
on the detailed design of a similar Next Step. I will not attempt to make any prediction<br />
on the framework in which the Next Step(s) will eventually be built. What is clear<br />
to me is that we will have to work hard, keeping open all options, to prepare the<br />
ground for a decision to start the realization of the Next Step(s) early in the 1990s.
FIRST EXPERIMENTS IN TORE SUPRA<br />
EQUIPE TORE SUPRA<br />
(Presented by R. Aymar)<br />
CEA, Centre d'etudes nucleaires de Cadarache,<br />
Departement de recherche sur la fusion controlee,<br />
Association Euratom-CEA sur la fusion,<br />
Saint-Paul-lez-Durance,<br />
France<br />
Abstract<br />
<strong>IAEA</strong>-CN-50/A-I-1<br />
FIRST EXPERIMENTS IN TORE SUPRA.<br />
First plasma experiments in the large superconducting tokamak Tore Supra (R = 2.37 m;<br />
a = 0.8 m) are presented. During the first months of operation (April to July 1988) helium plasmas<br />
with nc = 2.5 x 10 19 m"\ Ip = 700 kA <strong>and</strong> BT = 2 T were routinely obtained, the first wall being<br />
baked (210°C) <strong>and</strong> carbonized.<br />
1. INTRODUCTION<br />
Tore Supra is a tokamak equipped with superconducting toroidal field coils. Its<br />
design parameters are listed in Table I. The project phase started in January 1977,<br />
<strong>and</strong> the decision for construction was taken in October 1981. The first plasma was<br />
obtained at the beginning of April 1988.<br />
Tore Supra's main objectives are oriented towards both technology <strong>and</strong> physics<br />
issues in hot, dense, quasi-steady-state plasmas. In particular, it is intended<br />
(a) to build <strong>and</strong> to operate a superconducting magnet large enough to be relevant<br />
to a tokamak reactor;<br />
(b) to integrate a large cryogenic system into the real environment of a tokamak;<br />
(c) to inject <strong>and</strong> to remove, at quasi-steady state, the tens of megawatts needed to<br />
heat the plasma;<br />
(d) to control the plasma density <strong>and</strong> plasma-wall interaction by active methods,<br />
i.e. pellet injectors, pump Hmiters <strong>and</strong> ergodic divertors;<br />
(e) to drive the plasma current by propagating waves, starting with lower hybrid<br />
waves.<br />
Besides the superconducting toroidal field coils (Nb-Ti superconductor cooled<br />
by pressurized superfluid helium at 1.8 K) [1], another special feature of Tore
10 EQUIPE TORE SUPRA<br />
TABLE I. TORE SUPRA DESIGN PARAMETERS<br />
Plasma major radius, Rg (m)<br />
Plasma minor radius, a (m)<br />
Toroidal magnetic field, BT (T)<br />
Plasma current, Ip (MA)<br />
Discharge duration (s)<br />
Flux swing, Fo (Wb)<br />
toroidal _<br />
field coils<br />
viewing,<br />
ports<br />
outer _<br />
vessel<br />
inner<br />
vessel<br />
80K<br />
thermal shields.<br />
magnetic circuit<br />
0 0.5 1m<br />
FIG. I. Tore Supra meridian cross-section.<br />
2.37<br />
0.8<br />
4.5<br />
1.7<br />
30<br />
21
<strong>IAEA</strong>-CN-50/A-I-1 11<br />
Supra is the first wall design consisting of (all elements being water cooled;<br />
Twater = 150-230°C, p < 3.6 MPa):<br />
(a) a low field side first wall (72 water cooled stainless steel panels covering<br />
60 m 2 );<br />
(b) a high field side first wall, which is, in fact, a complete bumper limiter (150°<br />
poloidal extension covered by 12 m 2 of brazed isotropic graphite tiles);<br />
(c) three isotropic graphite modular limiters (at present being replaced by a set of<br />
actively cooled pump limiters);<br />
(d) six ergodic divertor modules protected by graphite tiles.<br />
Figure 1 shows a meridian cross-section through the observation port region.<br />
2. MACHINE OPERATION<br />
2.1. Toroidal magnet operation<br />
In addition to the usual plasma vacuum vessel, a superconducting tokamak<br />
needs a second, outer, vacuum vessel enclosing the superconducting coils <strong>and</strong> radiation<br />
shields. Figure 2 shows the arrangement of the various nested structures, their<br />
material <strong>and</strong> their temperature. A very important requirement for magnet system<br />
operation is that the pressure in the cryogenic vacuum vessel should remain well<br />
below 10" 3 Pa, in order to avoid excessive thermal exchange between the coils <strong>and</strong><br />
their surroundings.<br />
material<br />
limiter.<br />
brazed C first wall<br />
or SS<br />
inner<br />
5 S vacuum<br />
4 vessel<br />
(silver plated)<br />
• . radiation<br />
S S shield "<br />
radiation<br />
SS shield<br />
(silver polishedj<br />
,. - r vacuum<br />
S S vessel<br />
plasma<br />
lor ior lor )oi<br />
K8<br />
temperature pressure<br />
plasma<br />
500 K vessel<br />
(water) m u u m<br />
500K<br />
80 K<br />
(He)<br />
supra conductor 1.8K cryogenic<br />
(super-fluid He) vacuum<br />
coil casing 4K<br />
(liquid He)<br />
WI \ I \ I \ I \7\7I 300 K atmosphere<br />
FIG. 2. Schematic cut view of Tore Supra components, from the plasma to the outer vacuum vessel.
12 EQUIPE TORE SUPRA<br />
13 flux<br />
measure<br />
-ments<br />
(saddle<br />
loops)<br />
time<br />
depen<br />
-dent<br />
matrix<br />
30x7)<br />
7 flux<br />
differences<br />
computed<br />
between 8<br />
boundary<br />
points<br />
plasma<br />
current<br />
compared<br />
to<br />
reference<br />
7 flux<br />
differences<br />
1<br />
plasma<br />
current<br />
difference<br />
2 coil<br />
current<br />
differences<br />
time<br />
derivation<br />
derived<br />
differences<br />
9 voltage<br />
values<br />
for 9<br />
thyristor<br />
converters<br />
proportional<br />
gain<br />
matrix<br />
(10x9)<br />
constant<br />
values<br />
+3 time<br />
dependent<br />
multiplying<br />
factors<br />
derived<br />
gain<br />
matrix<br />
(10x9)<br />
constant<br />
values<br />
+3 time<br />
dependent<br />
multiplying<br />
factors<br />
FIG. 3. Scheme of real lime feedback loop computer.<br />
Magnet cooling from room temperature to:<br />
• 80 K for the radiation shield,<br />
• 4.5 K for the coil casing, <strong>and</strong><br />
• 1.8 K for the Nb-Ti winding<br />
9<br />
proportional<br />
values<br />
9<br />
derived<br />
values<br />
9 programmed<br />
values<br />
additions<br />
term<br />
to term<br />
requires two weeks. It is worth noting that this has been achieved while baking the<br />
plasma vacuum vessel at 210°C.<br />
Once cooled down, the magnet system is within ten minutes energized to its<br />
working value before each experimental session.<br />
2.2. Poloidal field control<br />
The nine poloidal field coils are connected in parallel to the main power supply.<br />
The coil voltage differences necessary to adjust to the desired magnetic flux configuration<br />
are set by eight additional power supplies in series with eight out of nine coils.<br />
The plasma boundary <strong>and</strong> current are controlled through a digital feedback loop<br />
(based on the isoflux method) acting consistently on the nine power supplies of the
<strong>IAEA</strong>-CN-50/A-I-1 13<br />
poloidal field system [2]. The shape is defined by a matrix converting the magnetic<br />
field measurements at the first wall into flux values at eight points of the desired<br />
plasma surface. The control loop equalizes these eight fluxes. The plasma boundary<br />
is modified by changing the matrix coefficients. The operation of the real time poloidal<br />
feedback loop is schematically shown in Fig. 3. The loop cycle time is 1 ms.<br />
2.3. First wall conditioning<br />
As in all tokamaks, conditioning of the plasma vessel is a prerequisite for<br />
obtaining good plasmas; we have, therefore, tried to reach the following goals [3]:<br />
(a) desorption of water vapour <strong>and</strong> hydrocarbons by permanently baking the vessel<br />
at 210°C;<br />
(b) creation of an adequate metal surface (in particular, oxide free metal), on which<br />
a carbonization layer could be deposited.<br />
VESSEL<br />
TEMPERATURE —<br />
1 2 3 t 5 6 7 8 9 10 11 12 13 14 15 16 17 18<br />
time (day)<br />
FIG. 4. Time evolution of various partial pressures during first wall conditioning.
14 EQUIPE TORE SUPRA<br />
V5<br />
y on<br />
O<br />
Z<br />
a <<br />
<<br />
.3<br />
1a<br />
00<br />
c<br />
ivelf<br />
Time<br />
resolution<br />
UII <<br />
re<br />
tics<br />
Diagnos<br />
>. >,<br />
u on<br />
3 C<br />
tion<br />
3<br />
1<br />
res<br />
o<br />
^~-<br />
pE3 ! 'o o<br />
r-<br />
12 sets (<br />
poloidal<br />
i<br />
rent,<br />
;un<br />
o<br />
coils<br />
a.<br />
3<br />
pick-<br />
x:<br />
00<br />
c<br />
nee<br />
id interfere<br />
>res an<br />
j-><br />
1<br />
O<br />
E ?<br />
c<br />
700 n<br />
00-<br />
E<br />
-^t<br />
o<br />
r-<br />
2<br />
Ionization<br />
•a<br />
ters<br />
fil<br />
a<br />
II<br />
1<br />
Nl"<br />
visibl<br />
monil:ors<br />
rds<br />
cho<br />
horizontal<br />
<strong>and</strong> 3<br />
vertical<br />
m<br />
fluxes<br />
res<br />
optical fib<br />
<strong>and</strong> 9<br />
;lescope<br />
H<br />
E<br />
700 n<br />
0.03<br />
8<br />
E<br />
s<br />
Space <strong>and</strong><br />
o<br />
Visib<br />
specti<br />
u<br />
iden<br />
normal inc<br />
ipped<br />
ter<br />
MA equ<br />
a<br />
II<br />
les;<br />
O<br />
j —<br />
o .•<br />
> •<br />
§<br />
o<br />
o<br />
1 S<br />
i §<br />
<strong>IAEA</strong>-CN-50/A-I-1 15<br />
purity lines<br />
ted im<br />
preselec<br />
p<br />
15-1150<br />
m<br />
00<br />
s<br />
o<br />
o<br />
3<br />
Time evoli<br />
impurity li<br />
1<br />
|<br />
ator:<br />
idence<br />
19° inci<br />
II<br />
^<<br />
16 EQUIPE TORE SUPRA<br />
8<br />
w<br />
Remarks<br />
Wavelength<br />
frequency<br />
of energy<br />
Time<br />
resolution<br />
Space<br />
resolution<br />
Aim<br />
Diagnostics<br />
8 fission chamber, 2 3 He detectors<br />
e<br />
Fusion yield;<br />
runaway electrons<br />
Neutron<br />
monitors<br />
10 7 ns" 1 detection limit<br />
12 Fabry-Perot interferometers<br />
100-300 GHz<br />
(Af = 5 GHz)<br />
1 /xs<br />
(15 ms for<br />
profile)<br />
Electron<br />
cyclotron<br />
emission a<br />
12 venical points<br />
Interference filter spectrometers<br />
1.06 Mm (Nd-Yag<br />
laser,<br />
2 J, 27 Hz)<br />
20 ns<br />
6.3 cm<br />
Repetitive<br />
Thomson<br />
scattering 3<br />
3 spatial points of plasma periphery<br />
Interference filter<br />
spectrometers<br />
1.06 Mm (Nd-glass<br />
laser,<br />
20 J, single<br />
pulse)<br />
20 ns<br />
S<br />
CJ<br />
Tc(r) for plasma<br />
edge<br />
Low Te<br />
Thomson<br />
scattering"<br />
EIIB mass resolution<br />
5 spatial points<br />
> ><br />
Active CX (doping beam,<br />
50 kV)<br />
"^ ^ "^<br />
8 £ - a<br />
1 ]<br />
O O<br />
E<br />
10 cm<br />
(l'J)'l<br />
Neutral<br />
^article<br />
analyser a
i I<br />
•O OJ) —<br />
'5 c IS<br />
2<br />
HI<br />
1ZI<br />
_> o<br />
§•<br />
o<br />
> 1<br />
5 a<br />
8 .§<br />
II<br />
9 &<br />
o 3;<br />
<strong>IAEA</strong>-CN-50/A-I-1 17<br />
1 S<br />
1 "I<br />
I 1<br />
S 2<br />
•c «<br />
8. I<br />
4 ^<br />
a<br />
I,<br />
£ -S<br />
2<br />
£ 4J<br />
Eg U .£<br />
g a t<br />
Is ^<br />
( D O BO<br />
< D. 5<br />
§• « B-<br />
4J o<br />
OJQ O<br />
2 3<br />
o a<br />
i
18 EQUIPE TORE SUPRA<br />
Initial baking allowed approximately 3 X 10 24 H2O <strong>and</strong> 3 x 10 23 hydrocarbon<br />
molecules to be removed, thus lowering the water pressure in the plasma vacuum vessel<br />
by a factor of 100, as is shown in Fig. 4, which describes the evolution of the<br />
different pressures in the plasma vessel during baking (average vessel temperatures).<br />
Subsequently, 3 A-h-m" 2 of hydrogen glow discharges (p = 2.5 X 10"' Pa,<br />
I = 20-100 mA-m 2 ) decreased the CO <strong>and</strong> hydrocarbon production by a factor of<br />
20. This is estimated to correspond to the average removal of sixty monolayers from<br />
the torus surface.<br />
The plasma vessel was then carbonized by means of a 0.5 A-h-m" 2 glow discharge<br />
in H2 + 15% CH4, followed by He + 20% CH4, depositing about 1000<br />
monolayers. The process ended with He glow discharges, in order to decrease the<br />
hydrogen content of the carbonization layer. This was easily achieved within a few<br />
hours (the hydrogen desorption decay time being approximately two hours). This<br />
procedure has allowed a strong reduction of the hydrogen content of helium discharges,<br />
decreasing the neutral hydrogen to helium ratio (measured after a nondisruptive<br />
plasma) from 1 to less than 0.1.<br />
Thus from the first discharge in Tore Supra, the plasma-wall interaction consists<br />
mainly of plasma carbon interaction preventing any metal redeposition.<br />
2.4. Diagnostics<br />
The diagnostics systems available during the first experimental period, as well<br />
as those installed during the summer shutdown, are summarized in Table II.<br />
3. OPERATIONAL REGIME<br />
3.1. Plasma parameters<br />
During the first three months of operation, all experiments were performed with<br />
helium gas <strong>and</strong> a reduced magnetic field of 2 T. Three movable graphite limiters<br />
were installed at the top, bottom <strong>and</strong> low field sides of the vacuum vessel, allowing<br />
an 80 cm minor radius plasma to be accommodated. However, in these experiments<br />
the plasma was not in direct contact with the limiters since the discharges were leaning<br />
on the internal carbon wall, with their minor radius limited to 65 or 70 cm.<br />
After the initial discharge, the plasma current was rapidly increased above<br />
500 kA (Fig. 5). The maximum current obtained during this first experimental<br />
period was 740 kA (qcyl = 2.6; q^ = 3), with line averaged densities routinely up<br />
to 2.5 x 10 19 m" 3 , none of these values being limited by disruptions. The plasma<br />
voltage was in the range 0.7 to 1 V. The flux consumption needed to reach the current<br />
plateau followed an empirical law: $ (Wb) = $p + 4Ip (MA), with<br />
0.5 Wb < $ < 1.5 Wb (Fig. 6). Shot to shot variations in $p are attributed to<br />
different stray field configurations at breakdown.
5.' ' *[Wbl<br />
t.<br />
3.<br />
2.<br />
1.<br />
_<br />
_ X<br />
<strong>IAEA</strong>-CN-50/A-I-1 19<br />
3 4 5 6 7<br />
FIG. 5. Tore Supra first Ohmic discharges.<br />
* • •<br />
t<br />
•<br />
•<br />
1<br />
i<br />
i<br />
0.<br />
1 »•<br />
0. 2 .4 .6 .8 I.<br />
i<br />
i<br />
#<br />
IplMAl<br />
FIG. 6. Flux consumption needed to reach the current plateau as a Junction of this current.<br />
Figures 7 <strong>and</strong> 8 show the results of experiments in which the abrupt variations<br />
of the plasma radius were programmed through the poloidal field control system<br />
(with the discharge always leaning on the internal wall). Line a in Fig. 8 shows the<br />
line integrated electron density of the reference 70 cm radius discharge. Figure 7 <strong>and</strong><br />
line b in Fig. 8 refer to a 5 cm compression (to a 65 cm radius), whereas in line c<br />
in Fig. 8 a 65 cm radius plasma was exp<strong>and</strong>ed to 70 cm. The helium filling pressure<br />
of these three discharges was identical (5.6 x 10" 3 Pa). The plasma column settles<br />
into its new position within 30 ms. Figure 8 shows that, at a given current value, the<br />
line integrated electron density value is inversely proportional to the plasma radius,<br />
an indication that the total number of particles in the discharge does not change when<br />
the plasma radius is varied (the recycling coefficient for helium is close to one).
20 EQUIPE TORE SUPRA<br />
I PLASMA IMAI RADIUS ( cm)<br />
10 10<br />
V PLASMA ( VI VERTICAL DISPLACEMENT (cm)<br />
nl(10 20<br />
FIG. 7. Basic parameters for a shot (No. 569) characterized by a compression (70 to 65 cm radius)<br />
at the beginning of the current plateau.<br />
BETA
nl<br />
30<br />
.29<br />
.28<br />
.27<br />
26<br />
.25<br />
.24<br />
.23<br />
22<br />
O1<br />
-<br />
_<br />
-<br />
J<br />
J<br />
f<br />
[i0 20 m- 2 !<br />
fof<br />
J<br />
/w<br />
;^<br />
1<br />
!
22 EQUIPE TORE SUPRA<br />
Telr)<br />
(keV)<br />
1.5<br />
1.<br />
.5<br />
# 550<br />
r —•<br />
—<br />
• experimental (ECE<br />
(a.u.)<br />
\<br />
)<br />
\<br />
t 1<br />
\<br />
1 1 1 XI<br />
60 50 40 30 20 10 0 10 20 30 40 50 60 70 cm<br />
(<br />
FIG. 9. Electron temperature profile: comparison between MAKOKOT code predictions <strong>and</strong><br />
uncalibrated ECE data normalized at r = 0.<br />
a<br />
8.<br />
7. -<br />
6. -<br />
5. -<br />
4. -<br />
3.<br />
-<br />
-<br />
2. -<br />
1. -<br />
10 NEUTRONS/s<br />
tla \<br />
^<br />
• \<br />
/ time<br />
/I 1 1<br />
—NI—"<br />
N<br />
S<br />
;b<br />
synchrotron<br />
S<br />
M » /01V)<br />
1 1<br />
limit<br />
\ _<br />
-N—•<br />
1<br />
— - 40<br />
- 60<br />
- 80<br />
E max<br />
iMeVl<br />
- 140<br />
"111 111 .1 \<br />
- 20<br />
- 100<br />
- 120<br />
FIG. 10. Time evolution of photoneutron flux, plasma current <strong>and</strong> estimated runaway electron energy<br />
deduced from time integrated loop voltage (synchrotron limit 68 MeV).
<strong>IAEA</strong>-CN-50/A-I-1<br />
However, reasonable agreement, particularly with the Michelson relative electron<br />
temperature profile (Fig. 9), has been obtained for the following set of plasma<br />
characteristics: Ip = 590 kA, POhm = 450 kW, Zeff = 2.5, ne = 1.9 X 10 19 m" 3 ,<br />
q(0) = 0.8, TE = 0.125 s, Te(0) =1.6 keV. The impurity transport code [6], using<br />
plasma parameters <strong>and</strong> the evaluated light impurity content, shows the radiation<br />
losses to lie between 50 <strong>and</strong> 60 kW (depending on the assumed value of the transport<br />
coefficients).<br />
3.2. Runaway electrons (RE)<br />
Figure 10 shows the time evolution of the photoneutron signal due to runaway<br />
electrons lost in the limiter. The first neutrons are detected 50 ms after plasma breakdown,<br />
their flux then increasing during ~0.5 s, with a few short spikes related to<br />
the crossing of integer q surfaces at the plasma edge. Afterwards, the signal decreases<br />
with a time constant of 1 to 2 s. The total neutron emission per shot ranges between<br />
10 9 <strong>and</strong> 10", corresponding to a maximum RE current of -0.05% of the total<br />
current.<br />
5 -<br />
0 -<br />
FIG. 11. Time evolution of photoneutron flux <strong>and</strong> plasma current in terms of energy limit of confined<br />
runaways, at the end of a short discharge.<br />
23
24 EQUIPE TORE SUPRA<br />
Runaway electrons are probably created during the first milliseconds of the discharge;<br />
in fact, when the spikes on the neutron flux trace are large, all RE are lost<br />
with them, <strong>and</strong> no more neutrons are observed afterwards. They are subsequently<br />
accelerated by the induced electric field at a rate of 20 MeV-Wb" 1 . The top curve<br />
in Fig. 10 is the time integrated loop voltage after the initial 20 V peak, expressed<br />
as energy on an MeV scale. Because of the long discharge duration, RE could have<br />
reached the energy limit associated with the synchrotron radiation limit (i.e.<br />
68 MeV). Figure 10 shows that most photoneutrons are produced by electrons with<br />
an energy range between about 40 MeV <strong>and</strong> the synchrotron limit of 68 MeV.<br />
However, two independent observations suggest that the RE are lost with a somewhat<br />
lower energy:<br />
(a) Figure 11 shows the end of a short plasma discharge; the plasma current has<br />
been plotted on an MeV scale (4 kA-MeV"') to point out the energy limit<br />
associated with the drift orbit confinement of the RE remaining in the discharge.<br />
The time evolution of the neutron flux in Fig. 11 suggests an RE energy<br />
between 15 <strong>and</strong> 40 MeV (on the assumption that during the current decrease,<br />
the loop voltage being roughly zero, the RE energy remains constant).<br />
(b) A strong activation spot, occurring near the outer limiter, has been studied in<br />
particular. The RE stopped in this carbon limiter are a source of hard X-rays<br />
which undergo photonuclear reactions in the stainless steel vessel, thus<br />
producing many radioisotopes. A few 7 Be nuclei, produced in carbon via a<br />
26.3 MeV threshold reaction, show that some electrons have reached energies<br />
as high as —30 MeV. However, an RE distribution with a mean energy of<br />
25 MeV <strong>and</strong> a full width of less than 30 MeV must be assumed to explain the<br />
relative values of 54 Mn, 5l Cr, 56 Co <strong>and</strong> 48 V.<br />
A reason for this discrepancy of the RE energy value might be a scattering<br />
process modifying the RE pitch angle 6 [ 2 = (8 0 ) 2 is necessary], thus producing<br />
a drag effect due to enhanced synchrotron radiation which counteracts the energy<br />
gain due to the loop voltage.<br />
4. FUTURE EXPERIMENTS<br />
To implement the experimental programme outlined in the introduction, the<br />
following systems are being developed <strong>and</strong> will be installed in the near future:<br />
Additional heating<br />
Three neutral injectors, using a new conceptual design (electrostatic deflection<br />
<strong>and</strong> energy recovery of unneutralized ions), will deliver 11 MW of 100 kV neutral<br />
deuterium particles. Three ICRH antennas (using the resonant double loop concept<br />
developed in co-operation with the Oak Ridge National Laboratory, USA (ORNL),
<strong>IAEA</strong>-CN-50/A-I-1 25<br />
will make it possible to investigate several heating modes in the frequency range of<br />
35 to 80 MHz at the 12 MW power level. 8 MW harmonic heating of hydrogen at<br />
120 MHz will also be possible.<br />
Current drive<br />
Two 'multijunction grills' will couple lower hybrid waves at 3.7 GHz through<br />
256 waveguides. The launching parallel index can be adjusted in the range of 1.2 to<br />
2.3, the power delivered by sixteen klystrons being 8 MW.<br />
Fuelling, particle <strong>and</strong> energy exhaust<br />
A multipellet injector (developed by ORNL) will have the capability of injecting<br />
deuterium pellets at 1.2 km-s" 1 . Seven pump limiters (one on the outside, using<br />
pyrolitic graphite, <strong>and</strong> five at the bottom, using isotropic graphite), with actively<br />
cooled heads will control up to 8% of the recycling flux <strong>and</strong> extract half of the total<br />
injected power.<br />
An ergodic divertor will be used to create magnetic perturbations with poloidal<br />
<strong>and</strong> toroidal wavenumbers 24 <strong>and</strong> 6, respectively. It consists of six equally spaced<br />
modules. The ergodic layer (5 to 10 cm thick) should produce a dense, low temperature<br />
plasma at the wall, providing several benefits (decreased sputtering <strong>and</strong> impurity<br />
influx, etc.).<br />
The experimental programme described in this paper was interrupted on 8 July<br />
1988 by a fault in one of the eighteen toroidal field coils. It will be resumed in the<br />
near future at a toroidal magnetic field of 2 T with an improved set of diagnostics,<br />
two multijunction grills, two ICRH antennas <strong>and</strong> five pump limiters. Later on, Tore<br />
Supra will be shut down <strong>and</strong> the defective coil will be replaced by the available spare<br />
coil.<br />
ACKNOWLEDGEMENT<br />
Part of this work was carried out under an agreement for co-operation between<br />
the Association Euratom-CEA <strong>and</strong> the US Department of Energy.<br />
REFERENCES<br />
[1] AYMAR, R., et al., Tore Supra: Description Technique, Rep. EUR-CEA-FC-1276 (1985).<br />
[2] ANE, J.M., et al., in Proc. 15th SOFT, Utrecht, 1988.<br />
[3] WINTER, J., et al., J. Nucl. Mater. 128&129 (1984) 84.
26 EQUIPE TORE SUPRA<br />
[4] BLUM, J., GILBERT, J.C., THOORIS, B., Parametric Identification of the Plasma Current<br />
Density from the Magnetic Measurements <strong>and</strong> Pressure Profile, Rep. JET Contract JT3/90O8,<br />
JET Joint Undertaking (1985).<br />
[5] MERCIER, C, et al., Nucl. Fusion 21 (1981) 291.<br />
[6] TFR GROUP, Nucl. Fusion 23 (1983) 559.
<strong>IAEA</strong>-CN-50/A-I-2<br />
AN OVERVIEW OF TFTR CONFINEMENT WITH<br />
INTENSE NEUTRAL BEAM HEATING<br />
M.G. BELL, V. ARUNASALAM, C.W. BARNES 1 , M. BITTER,<br />
H.-S. BOSCH 2 , N.L. BRETZ, R. BUDNY, C.E. BUSH 3 , A. CAVALLO,<br />
T.K. CHU, S.A. COHEN, P.L. COLESTOCK, S.L. DAVIS,<br />
D.L. DIMOCK, H.F. DYLLA, P.C. EFTHIMION, A.B. EHRHARDT,<br />
R.J. FONCK, E.D. FREDRICKSON, H.P. FURTH, G. GAMMEL,<br />
R.J. GOLDSTON, G.J. GREENE, B. GREK, L.R. GRISHAM,<br />
G.W. HAMMETT, R.J. HAWRYLUK, H.W. HENDEL, K.W. HILL,<br />
E. HINNOV, J.C. HOSEA, R.B. HOWELL 1 , H. HSUAN, R.A. HULSE,<br />
K.P. JAEHNIG, A.C. JANOS, D.L. JASSBY, F.C. JOBES,<br />
D.W. JOHNSON, L.C. JOHNSON, R. KAITA, C. KIERAS-PHILLIPS,<br />
S.J. KILPATRICK, V.A. KRUPIN 4 , P.H. LAMARCHE, W.D. LANGER,<br />
B. LEBLANC, R. LITTLE, A.I. LYSOJVAN 5 , D.M. MANOS,<br />
D.K. MANSFIELD, E. MAZZUCATO, R.T. MCCANN,<br />
M.P. MCCARTHY, D.C. MCCUNE, K.M. MCGUIRE, D.H. MCNEILL,<br />
D.M. MEADE, S.S. MEDLEY, D.R. MIKKELSEN, R.W. MOTLEY,<br />
D. MUELLER, Y. MURAKAMI 6 , J.A. MURPHY, E.B. NIESCHMIDT 7 ,<br />
D.K. OWENS, H.K. PARK, A.T. RAMSEY, M.H. REDI,<br />
A.L. ROQUEMORE, P.H. RUTHERFORD, T. SAITO 8 ,<br />
N.R. SAUTHOFF, G. SCHILLING, J. SCHIVELL, G.L. SCHMIDT,<br />
S.D. SCOTT, J.C. SINNIS, J.E. STEVENS, W. STODIEK,<br />
B.C. STRATTON, G.D. TAIT, G. TAYLOR, J.R. TIMBERLAKE,<br />
H.H. TOWNER, M. ULRICKSON, S. VON GOELER, R.M. WIELAND,<br />
M.D. WILLIAMS, J.R. WILSON, K.-L. WONG, S. YOSHIKAWA,<br />
K.M. YOUNG, M.C. ZARNSTORFF, S.J. ZWEBEN<br />
Plasma Physics Laboratory,<br />
Princeton University,<br />
Princeton, New Jersey,<br />
United States of America<br />
' Los Alamos National Laboratory, Los Alamos, NM, USA.<br />
2 Max-Planck-Institut fur Plasmaphysik, Garching, Federal Republic of Germany.<br />
3<br />
Oak Ridge National Laboratory, Oak Ridge, TN, USA.<br />
4<br />
I.V. Kurchatov Institute of Atomic Energy, Moscow, USSR.<br />
5<br />
Institute of Physics <strong>and</strong> Technology, Khar'kov, USSR.<br />
6<br />
University of Tokyo, Tokyo, Japan.<br />
7<br />
EG&G Idaho Inc., Idaho Falls, ID, USA.<br />
8<br />
Japan Atomic Energy Research Institute, Naka-machi, Japan.<br />
27
28 BELL et al.<br />
Abstract<br />
AN OVERVIEW OF TFTR CONFINEMENT WITH INTENSE NEUTRAL BEAM HEATING.<br />
Significant extensions in the performance of TFTR have been achieved with plasma heating by<br />
up to 30 MW of balanced co- <strong>and</strong> counter-tangentially injected deuterium neutral beams. Ion temperatures<br />
up to 32 keV <strong>and</strong> ^(O^Ca^O) products up to 4.2 x 10 20 m" 3 -s-keV have been achieved in the<br />
supershot regime. A maximum QDD of (1.55 ± 0.4) x 10" 3 has been attained, which projects directly<br />
to QDT = 0.29 ± 0.07 in a deuterium-tritium plasma <strong>and</strong> would project to Q^T = 0.5 ± 0.13 when<br />
allowance is made for ion-mass effects <strong>and</strong> alpha-particle heating. A strong correlation is observed<br />
between the ratio of central to volume-average electron density of the plasma <strong>and</strong> the magnitude of<br />
QDD <strong>and</strong> the energy confinement time.<br />
1. Introduction<br />
During the past two <strong>and</strong> one-half years, experiments on the Tokamak<br />
Fusion Test Reactor (TFTR) have concentrated on exploiting the regime of<br />
enhanced energy confinement <strong>and</strong> fusion reactivity which can be obtained<br />
when high-power (> 10 MW) deuterium neutral beams are injected into lowdensity<br />
target plasmas [1,2]. Apart from their high D-D fusion reaction rate,<br />
the striking feature of these plasmas is an extreme peaking of the electron<br />
density profile <strong>and</strong> a relatively broad electron temperature profile. The<br />
operating space in TFTR where these characteristics are observed has been<br />
dubbed the "supershot regime". The basic physical distinction between<br />
this regime <strong>and</strong> the usual L-mode <strong>and</strong> H-mode plasma regimes is that the<br />
particle density is maintained by central, rather than edge, fuelling.<br />
One of the characteristics of the supershot regime in TFTR is that confinement<br />
depends on the balance between the tangentially co- <strong>and</strong> counterinjected<br />
beams (the directions are referenced to the plasma current), peaking<br />
with nearly equal power injected in the two directions [1,2]. With the<br />
configuration of neutral beam injectors installed in 1986 <strong>and</strong> 1987 (eight co<strong>and</strong><br />
three counter-injecting sources), the total power for effectively balanced<br />
injection was limited to 15 MW. Since the plasma confinement did not appear<br />
to degrade with increasing balanced injection power in the supershot<br />
regime, at least not until an apparent /3-limit was encountered, it was decided<br />
to add a twelfth beam source <strong>and</strong> to reverse the direction of one of<br />
the four neutral beam lines (three sources) to provide balanced injection at<br />
full power. This was accomplished during the latter half of 1987.<br />
During the reorientation of the neutral beam line, the movable limiter<br />
system, which was not intended to h<strong>and</strong>le the full input energy from<br />
the beams, was removed <strong>and</strong> other modifications were made in the vacuum<br />
chamber. The primary limiter remains the large-area axisymmetric
<strong>IAEA</strong>-CN-50/A-I-2 29<br />
inner belt limiter consisting of graphite tiles mounted on water-cooled Inconel<br />
plates. Two launchers for ion cyclotron resonance heating were installed<br />
on the large-major-radius side of the vessel. To protect the launchers<br />
from direct plasma bombardment, two partial ring limiters, spanning<br />
240° poloidally from the extremities of the inner belt limiter, were installed<br />
adjacent to the launchers. These limiters have modest energy deposition capability<br />
<strong>and</strong> currently restrict the major radius at which full neutral beam<br />
injection (NBI) power can be applied.<br />
With the increased balanced NBI power available (maximum injected<br />
power 30.5 MW, with a maximum beam voltage of 110 kV <strong>and</strong> pulse duration<br />
of 1 sec), experiments in 1988 have concentrated on increasing the<br />
plasma current at which the supershot characteristics of high fusion reactivity<br />
<strong>and</strong> improved confinement are obtained. In this paper, we will outline<br />
progress that has been made in extending the supershot regime in this direction<br />
<strong>and</strong> describe some of the phenomena observed with very high-power<br />
neutral beam injection. A characterization of the best plasma parameters<br />
achieved in the supershot regime will be presented in Sec. 2. Section 3 deals<br />
with the effects of profile peaking on confinement. The /3-limits applying<br />
in this regime are described in Sec. 4. The scaling of confinement <strong>and</strong> QDD<br />
with externally controlled conditions will be discussed in Sec. 5. Section 6<br />
reviews the operating space <strong>and</strong> presents projections for deuterium-tritium<br />
operation.<br />
In addition to the studies of the supershot regime, some other modes<br />
of operation have been investigated in recent experiments; the results are<br />
presented in companion papers. The observation of limiter H-modes in<br />
TFTR is described by Manickam et al. [3] while preliminary results with<br />
ion cyclotron resonance heating are discussed by Wilson el al. [4].<br />
2. Extension of the supershot regime<br />
Supershots in TFTR were originally observed at low plasma currents,<br />
lp < 1 MA, corresponding to qcyi > 6.6 at BT — 5.1 T, where target plasmas<br />
with a very low density could be produced. At these high values of g^i,<br />
attempts to increase the poloidal /?, ftp, beyond ~2 by increasing the heating<br />
power produced MHD activity that degraded confinement or resulted<br />
in disruptions [5]. However, with the maximum balanced co- <strong>and</strong> counterinjection<br />
power then available, 15 MW, increasing the plasma current to reduce<br />
j3P below its apparent limit resulted in broader density profiles <strong>and</strong> a<br />
degradation of confinement. In discharges with the plasma current held constant<br />
during the NBI pulse, the best performance was previously achieved<br />
at Ip = 1 MA.
30 BELL et al.<br />
With the increase in balanced neutral beam power up to 30 MW, supershots<br />
with confinement times up to 2.5 times the predictions of L-mode scaling<br />
[6] have been achieved at lp = 1.6 MA corresponding to qcyl = 4.1. (In<br />
all of the discharges discussed in this paper, 4.7 < By < 5.1 T, R = 2.45 m<br />
<strong>and</strong> a -••• 0.8 m.) At these higher plasma currents, the supershots are still<br />
characterized by high central ion temperatures (up to 32 keV), high centra]<br />
electron densities (8.7 x 10 19 mT 3 ) <strong>and</strong> high central electron temperatures<br />
(8.5 keV). The electron density profile is very peaked, with a ratio<br />
of central to volume-average electron density, ne(0)/, up to 3.1. The<br />
ion temperature profile is narrow, similar to the electron density profile,<br />
but the electron temperature profile is broader. The maximum value of<br />
ne(0)TE{a)Ti(0) that has been attained is 4.2 x 1O 20 m~ 3 -s-keV in a 1.4 MA<br />
discharge. The tangentially viewing measurement of visible bremsstrahlung<br />
yields Zeg = 2.6 for this discharge; the contribution to Zeg from iron <strong>and</strong><br />
nickel, the dominant metallic impurities, is estimated to be 0.7. The ratio<br />
of nD(0)/ne(0) is calculated to be 0.77.<br />
The behavior of the plasma during the heating pulse varies with power<br />
<strong>and</strong> plasma current. At modest heating powers, the stored energy <strong>and</strong><br />
neutron emission increase for ~0.5 sec <strong>and</strong> then remain essentially constant<br />
for the remainder of the neutral beam pulse, which has been up to 1 sec<br />
long in recent experiments. As the power is increased, there is an increasing<br />
tendency for the stored energy <strong>and</strong> neutron emission to reach a maximum<br />
at ~0.5 sec <strong>and</strong> then decrease sharply. The decrease is generally associated<br />
with the development of either severe MHD activity [3] or an influx of carbon<br />
into the plasma [7J. The power threshold for the onset of deleterious MHD<br />
activity increases with plasma current as will be discussed in Sec. 4. For<br />
Ip = 1.6 MA, degradation associated with carbon influx occurs increasingly<br />
frequently for PNBI > 25 MW. The influx of carbon is correlated with the<br />
heating of a small number of graphite tiles on the inner belt limiter. During<br />
the carbon influx, the radiated power increases from a level typically < 30%<br />
of the input power to nearly 100% in some cases.<br />
Figure 1 shows the variation with power of the peak total stored energy<br />
determined from magnetic measurements. This data set includes only discharges<br />
with constant plasma current throughout the beam pulse for which<br />
the magnetic analysis, including the effects of pressure anisotropy, is considered<br />
most reliable [8]. The data have not been tightly constrained with<br />
respect to the state of limiter conditioning <strong>and</strong> include discharges with varying<br />
degrees of co/counter-injection balance. Along the upper envelope of the<br />
data, the stored energy increases linearly with power at a slope corresponding<br />
to a confinement time of ~0.15 sec. The maximum stored energy has<br />
been achieved at the highest plasma current, 1.6 MA for constant-current
<strong>IAEA</strong>-CN-50/A-I-2 31<br />
0 10 20<br />
TOTAL POWER (MW)<br />
FIG. J. Scaling of the peak in the plasma stored energy determined by magnetic measurements with<br />
the total input power. Only discharges with constant current during the NBI pulse are included.<br />
discharges. The variation in stored energy at a given power is correlated<br />
with changes in the target plasma <strong>and</strong> the subsequent peakedness of the<br />
density profile during neutral beam injection as will be discussed in Sec. 3.<br />
The maximum neutron source-strength from D-D reactions during a<br />
pulse increases strongly with power as shown in Fig. 2. The maximum<br />
value of the neutron source-strength, 3.7 x 10 16 /sec (which corresponds to<br />
a total D-D reaction rate of ~ 7.0 X 10 16 /sec), is achieved at the highest<br />
power. For a given input power, the variations from shot to shot in the<br />
neutron emission <strong>and</strong> the stored energy are well correlated. Indeed, when<br />
the neutron source-strength Sneut is plotted against the stored energy Etoti<br />
it is found that 5^^ oc E^t for the data set of Figs. 1 <strong>and</strong> 2, as shown in<br />
Fig. 3. This scaling applies because most of the plasma stored energy is<br />
in the beam-injected (£*) <strong>and</strong> thermal (Et) ion components, <strong>and</strong> the energy<br />
dependencies of the three different components of the total D-D fusion<br />
reaction rate (ni,nt btt n% tt/2, nlbb/2) scale approximately<br />
proportionally to their respective contributions to E^ot (2EbEt, Ef, E^) in<br />
the parameter range of interest.<br />
3. Effects of density profile peaking<br />
Target plasma conditions were identified as critical for the supershot<br />
regime in the early TFTR experiments. A necessary condition for the
32 BELL et al.<br />
"5?<br />
A<br />
O<br />
3 _ - O<br />
D<br />
C 2 -<br />
1 --<br />
1<br />
1.0-<br />
1.2-<br />
1.4-<br />
1.6-<br />
I I<br />
1.1 MA<br />
1.3<br />
1.5<br />
1.7<br />
AAj<br />
I I<br />
D<br />
D ft<br />
i<br />
.§!<br />
c6<br />
S DD -<br />
" V i<br />
i<br />
0 10 20 30<br />
NEUTRAL INJECTION POWER (MW)<br />
FIG. 2. Scaling of the peak neutron flux from D-D fusion reactions with neutral beam injection power.<br />
Some discharges with current ramping during the NBI pulse are included.<br />
o<br />
Z. 2<br />
1 -<br />
A<br />
O<br />
_ o D<br />
1.0-<br />
1.2-<br />
1.4-<br />
1.6-<br />
i i<br />
1.1 MA<br />
1.3<br />
1.5<br />
1.7<br />
I I<br />
10<br />
(mag),2<br />
(E (MJ<br />
tot '<br />
2 )<br />
I<br />
I<br />
15 20<br />
F/G. 5. Scaling of the peak neutron flux with the square of the peak stored energy for the intersection<br />
of the data sets in Figs. 1 <strong>and</strong> 2.<br />
achievement of good confinement is a reduction in hydrogen isotope recycling<br />
at the limiter. In the degassing procedure described in Refs. [2], [7],<br />
<strong>and</strong> [9], low-density helium discharges at modest plasma current are used<br />
to remove deuterium from the surface layers of the graphite limiter. This<br />
degassing is evidenced by a drop in D/3 emission <strong>and</strong> a reduction in the de-
5<br />
DC<br />
LU<br />
LU<br />
3 -<br />
1 -<br />
Q<br />
Q<br />
A<br />
1<br />
A<br />
<strong>IAEA</strong>-CN-50/A-I-2 33<br />
1<br />
•<br />
1 1 1 1<br />
0 1 2 3 4 5<br />
LINE-AVERAGED DENSITY OF TARGET PLASMA (10 19 m 3 )<br />
1<br />
D<br />
a<br />
A<br />
I<br />
He<br />
• Total<br />
A Thermal<br />
L-mode E tot<br />
FIG. 4. Effects of variations in the line-averaged density of the target plasma on the total <strong>and</strong> the thermal<br />
(ion + electron) components of the stored plasma energy for discharges with 22 MW balanced NBI.<br />
The total energy is determined magnetically, the thermal component from measurements of the electron<br />
<strong>and</strong> ion profiles.<br />
cay time of the density to its equilibrium level following a small diagnostic<br />
deuterium gas puff (Ane < 1 x 10 18 m~ 3 ) into a reference discharge. The recent<br />
experiments have shown that while still necessary, this degassing is not,<br />
by itself, sufficient for good performance at high plasma current. Even in<br />
discharges with degassed walls, small variations in the line-average density<br />
of the target plasma result in major changes in the energy confinement time<br />
in the subsequent NBI phase. These variations in density are correlated<br />
with the influx of carbon [7]. Though a well-defined procedure has been<br />
developed for modifying the deuterium recycling, the variations in carbon<br />
recycling are not well controlled at this time. Recently, through a combination<br />
of the helium degassing discharges <strong>and</strong> extensive operation with NBI<br />
at higher plasma currents than previously used, the densities of the target<br />
plasmas at 1.4 <strong>and</strong> 1.6 MA have been reduced by ~ 25% from the levels<br />
achieved in 1986 <strong>and</strong> 1987.<br />
The effects of variations in the target plasma conditions on the total<br />
<strong>and</strong> thermal component of the stored energy are illustrated in Fig. 4. Data<br />
from discharges run under otherwise similar conditions in which the intrinsic<br />
changes in the state of conditioning produced changes in the target plasma<br />
density are supplemented by data from discharges with the same NBI power<br />
in which the overall recycling was increased by puffing helium into the target<br />
plasma. In the discharges without added helium, the deuterium content of<br />
•JP<br />
i<br />
-
34 BELL et al.<br />
3.5<br />
3.0 --<br />
2 2.5 -<br />
2.0<br />
1.5<br />
1.0<br />
1<br />
i<br />
i<br />
"• *y 1D<br />
1.0 1.5 2.0 2.5<br />
n8(0)/<br />
1<br />
a D<br />
1<br />
D<br />
• •<br />
1<br />
D<br />
1.4 MA 'D 1<br />
1.4 MA He -<br />
1.0 -1.6 MA'D 1<br />
1<br />
3.0 3.5<br />
FIG. 5. Relationship between the peaking of the electron density profile <strong>and</strong> the enhancement of the<br />
global confinement time over the prediction ofL-mode scaling. The confinement time is determined by<br />
magnetic measurements. The data from Fig. 4 are distinguished by the square symbols.<br />
the target plasmas was small <strong>and</strong> the Zeg high (~ 6), but Zeg falls to<br />
2 - 3 at the time of the maximum in Etot . For the plasmas with added<br />
helium, the Zeg was ~2 during injection. With increasing target density, the<br />
stored energy decreases, eventually approaching the value predicted by the<br />
L-mode scaling of Goldston [6] (note that no modification of the expression<br />
in Ref. [6] is made for the deuterium NBI used in these experiments). For<br />
all the discharges except the highest-density helium case, the line-average<br />
density at the time of maximum Etot is m the range (3.0 — 3.7) x 10 19 m~ 3 ;<br />
for the highest-density case it is 5 x 10 19 rrT 3 . A discussion of the variation<br />
of the plasma transport coefficients in this experiment is given by Zarnstorff<br />
et al. [10].<br />
A striking feature of the discharges in this experiment is the reduction in<br />
the peaking of the density profile as the target plasma density increases. The<br />
density profile peaking parameter ne(0)/ < ne > is deduced by Abel inversion<br />
of the data from a 10-channel infra-red interferometer. Figure 5 illustrates<br />
that the enhancement of the confinement, as characterized by the ratio of<br />
the measured confinement time, TE, to the prediction of L-mode scaling,<br />
TE \ increases strongly with the profile peaking parameter. By plotting<br />
on these axes, the data of Fig. 1 with PNBI > 10 MW covering the range<br />
of currents 1.0 - 1.6 MA reduce to a b<strong>and</strong> surrounding the data for the<br />
controlled experiment at 1.4 MA (Fig. 5). A similar relationship between<br />
confinement enhancement <strong>and</strong> density profile peaking has been observed in<br />
the ASDEX experiment [11].<br />
-
<strong>IAEA</strong>-CN-50/A-I-2 35<br />
The question arises whether the centrally peaked deposition of the tangentially<br />
injected neutral beams in a low-density target plasma is sufficient<br />
to explain the peaking of the density profile during NBI. Experiments, in<br />
which either the line-average density was decreased or the density profile<br />
was modified transiently prior to injection by changing the major radius or<br />
the current of the target plasma, did not show an increase in peaking or an<br />
improvement in plasma performance. In addition, when the target density<br />
was increased by puffing deuterium prior to injection, the confinement time<br />
did not change, as long as the recycling coefficient was not changed by an<br />
accumulation of the injected gas. These results suggest that the variation<br />
in ne(Q)/ is not simply due to changes in target density but is caused<br />
by changes in the underlying transport properties coupled to the edge recycling<br />
conditions. At each plasma current, the density achieved without<br />
additional gas fuelling is simply a. measure of the overall recycling level.<br />
4. /3-limits<br />
Supershots with qcyt /(B^/2fj,o). In terms of this parameter,<br />
supershots with extremely peaked pressure profiles <strong>and</strong> /3£ > (3T [3] have<br />
achieved (3*N = ft^/(Ip/aBT) = 3.9 which exceeds the upper bound for fi^<br />
calculated for the broad pressure profiles which have been found to optimize<br />
PN [12 - 14].<br />
The technique of increasing the plasma current during the heating pulse<br />
has previously been used [2] to avoid the /3-limit imposed by operating at low<br />
plasma current to control recycling. Although the recent success in raising<br />
the target plasma current at which supershot confinement will develop has<br />
reduced the emphasis placed on this technique, some further investigations<br />
of plasma current ramping have been carried out. In the recent experiments<br />
at high power {PNBI ~ 24 MW), the current was increased during the<br />
heating pulse from 1.6 to 1.9 MA, corresponding to a final g^ of 3.4 (q^, =<br />
4.1), <strong>and</strong> the confinement characteristics were found to be similar to those of
36 BELL et al.<br />
0.20<br />
0.15<br />
0.10<br />
0.05<br />
L-Mode :<br />
Scaling<br />
O<br />
10 20<br />
TOTAL POWER (MW)<br />
Rp=2.45m -<br />
a = 0.79 m<br />
BT=4.7-5.0T<br />
»jtitSS|l<br />
FIG. 6. Scaling of the energy confinement time with power for recent discharges with nearly balanced<br />
NBI <strong>and</strong> well-conditioned limiters. The upper bound of the L-mode region, which encompasses data for<br />
all currents in the data set, is determined by the 1.6 MA data.<br />
1.6 MA constant-current discharges. The experiments also indicated that<br />
if the current is ramped through rational g-values, q^, = 5 or 4, at high<br />
values of /3, then severe MHD activity develops which frequently results in<br />
a disruption. This behavior is quite different from low-/? discharges in which<br />
similar current ramps may produce short bursts of MHD activity while q is<br />
near rational values but without major degradation in plasma performance.<br />
Details of the MHD activity at high /3 are described by Manickam et al. [3].<br />
5. Scaling of energy confinement time <strong>and</strong> Q DD<br />
The scaling of the energy confinement time TE = Etoi/(Piot — dEtot/dt)<br />
determined by magnetic measurements is shown as a function of power in<br />
Fig. 6. The confinement times are sampled near the peak in the stored<br />
energy; the maximum value of (dEtot/di)jPtot is < 0.1. The confinement<br />
time is sampled after at least 0.4 sec of NBI heating in all cases. The data set<br />
was constrained to include only discharges with nearly balanced injection,<br />
-0.1 < (Pco — Pctr)/{Pco + Pctr) < 0.3 <strong>and</strong> with well-conditioned limiters as<br />
evidenced by the line-average density of the target plasma: the discharges<br />
were selected from the lower half of the distribution of target densities at<br />
each plasma current. The energy confinement time is seen to be largely<br />
insensitive to power although there is a spread in the values even for these<br />
well-constrained data. The predictions of L-mode scaling [6] are shown for<br />
30
0.20<br />
0.15<br />
0.10<br />
Rp= 2.45 m<br />
a = 0.79 m<br />
BT = 4.7-5.0T<br />
<strong>IAEA</strong>-CN-50/A-I-2 37<br />
0.05<br />
0.5 1.0 1.5<br />
PLASMA CURRENT (MA)<br />
O<br />
L-Mode<br />
Scaling<br />
FIG. 7. Scaling of the energy confinement time with plasma current for discharges with nearly<br />
balanced NBI <strong>and</strong> well-conditioned limiters. Data for lower current (< 1 MA) supershots from 1986 <strong>and</strong><br />
1987 are included. The upper bound of the L-mode region, which encompasses data for all NBIpowers<br />
in the data set, is determined by the lowest power at each current.<br />
comparison for the range of current <strong>and</strong> power in the data set; the upper<br />
boundary corresponds to discharges at 1.6 MA.<br />
The confinement time is shown in Fig. 7 as a function of plasma current.<br />
This data set includes not only the recent data (Fig. 6) but also data from<br />
1986 <strong>and</strong> 1987 to include the lower currents (/p < 1 MA). The constraints<br />
which were applied to the data shown in Fig. 6 were applied here. The<br />
local peak in the confinement time at 0.9 MA reflects the situation in 1986<br />
<strong>and</strong> 1987 when attempts to increase the plasma current resulted in a rapid<br />
degradation of performance. The improvement in conditioning in 1988,<br />
coupled with the higher balanced NBI power, has improved the performance<br />
at 1.4 <strong>and</strong> 1.6 MA (the currents at which experimental running has been<br />
concentrated) to levels comparable to that achieved in the early supershot<br />
experiments. The upper limit to the b<strong>and</strong> representing L-mode data is<br />
calculated for the minimum power included for each current.<br />
The QDD (= PDD/PNBI) for a subset of discharges satisfying the same<br />
constraints on co/counter-injection balance <strong>and</strong> target density is shown in<br />
Fig. 8 as a function of NBI power. As expected on the basis of Fig. 2, QDD<br />
increases strongly with power, but again there is no obvious scaling with<br />
current at each power level. There is a small but significant group of shots<br />
with QDD substantially higher than the envelope of the bulk of the data.<br />
These discharges occur at the lowest extremes of the target density range. It<br />
is possible, therefore, that further improvements in conditioning techniques<br />
will allow reliable access to these exceptional conditions.<br />
2.0
38 BELL et al.<br />
1.5<br />
1.0<br />
0.5<br />
0 10 20 30<br />
NEUTRAL INJECTION POWER (MW)<br />
FIG. 8. Scaling of the D-D fusion reaction power gain with NBI power for discharges with nearly<br />
balanced NBI <strong>and</strong> well-conditioned limiters. Discharges with current ramping during NBI are included.<br />
Calculations of the neutron flux with the time-dependent TRANSP code<br />
[15] , which includes a Monte Carlo simulation of the beam-ion slowing-down<br />
<strong>and</strong> beam-beam charge-exchange effects, are in good agreement (10%) with<br />
the measured flux for high-QoD cases. These calculations indicate that<br />
for the discharge with the highest value of QDD, 20% of the flux is due to<br />
beam-beam reactions, 56% due to beam-target <strong>and</strong> 24% due to thermonuclear<br />
reactions. In order to estimate the QDT which would be achieved with<br />
deuterium <strong>and</strong> tritium, the TRANSP calculations have been performed using<br />
the measured density <strong>and</strong> temperature profiles <strong>and</strong> assuming that two of<br />
the beam-lines inject tritium <strong>and</strong> two deuterium. The result of these calculations<br />
is that QDT I QDD — 180 — 200. Thus, the maximum value of QDT for<br />
present operating parameters is projected to be 0.29 =b 0.07; the error arises<br />
mainly from uncertainties in the absolute neutron calibration. No account<br />
has been taken here for the expected enhancements in QDT which would occur<br />
due to the combined effects of higher beam-power capability (~35 MW<br />
total) with two beam-lines injecting tritium, the effects of alpha-particle<br />
heating <strong>and</strong> a possible increase in the confinement time proportional to the<br />
square-root of the average mass of the plasma particles. Together, these<br />
effects would raise the expected performance Q*DT to 0.5 ± 0.13 based on<br />
our present scalings.<br />
'•
: . • • 1<br />
<strong>IAEA</strong>-CN-50/A-I-2 39<br />
10 20 30<br />
NEUTRAL BEAM POWER (MW)<br />
• • : . ; • - . • . " •<br />
Qoox2O0tP - Limit<br />
i<br />
i 1<br />
0 10 20 30<br />
I I<br />
FIG. 9. Operating regions in the space described by plasma current <strong>and</strong> NBIpower in which significant<br />
enhancements of the energy confinement time over L-mode scaling <strong>and</strong> high equivalent QDT are<br />
observed.<br />
6. Summary<br />
I<br />
W •m<br />
NEUTRAL BEAM POWER (MW)<br />
a<br />
F<br />
All Data<br />
Oor>0.15<br />
0 or >0.20<br />
Oor>0.25<br />
During the past year, substantial progress has been made in exp<strong>and</strong>ing<br />
the operating range of supershots of TFTR. High-power <strong>and</strong> high-current<br />
discharges have been achieved with values of TE/TJ^ ' of 2.5 - 3. The largest<br />
enhancements in the confinement time are achieved in highly peaked discharges<br />
which are near the /3-limit. The largest values of QDD <strong>and</strong> projected<br />
value of QDT are achieved at high power <strong>and</strong> current. These results are<br />
summarized in Fig. 9. By means of current ramps, it is possible to achieve<br />
enhancements in the confinement time <strong>and</strong> large values of QDD away from<br />
the /3-limit. The best results occur in discharges with a low initial target<br />
density in which a very peaked density profile develops during NBI. Values
40 BELL et al.<br />
of ne(0)TE(a)Ti(0) up to 4.2 x 1O 20 m- 3 -s-keV have been achieved. The maximum<br />
equivalent value of QDT ' S 0.29 ± 0.07 with present beam-power levels<br />
<strong>and</strong> plasma parameters. This performance projects to Q*DT — 0.5 ± 0.13 if<br />
expected enhancements in power <strong>and</strong> confinement with tritium operation<br />
are admitted. With plasma parameters corresponding to QDT — l/^> it will<br />
be possible to perform alpha-particle physics studies in TFTR at reactorrelevant<br />
parameters (see Strachan et al. [16]).<br />
Acknowledgments<br />
We wish to acknowledge the contribution of Dr. J.D. Strachan to this work.<br />
We thank all the staff of the TFTR project <strong>and</strong> particularly the Neutral<br />
Beam Group for their unstinting efforts to achieve reliable high-power operation<br />
which were so successful during the experiments. This work was<br />
supported by U.S. Department of Energy Contract No. DE-AC02-76-CHO-<br />
3073.<br />
REFERENCES<br />
[1] STRACHAN, J.D., et al., Phys. Rev. Lett. 58 (1987) 1004.<br />
[2] HAWRYLUK, R.J., et al., "TFTR plasma regimes", Plasma Physics <strong>and</strong> Controlled <strong>Nuclear</strong><br />
Fusion Research 1986 (Proc. 11th Int. Conf. Kyoto, 1986), Vol. 1, <strong>IAEA</strong>, Vienna (1987)51-64.<br />
[3] MANICKAM, J., et al., Paper <strong>IAEA</strong>-CN-50/A-VII-4, these Proceedings, Vol. 1.<br />
[4] WILSON, J.R., et al.. Paper <strong>IAEA</strong>-CN-50/E-IV-1, ibid.<br />
[5] McGUIRE, K., et al., "Coherent <strong>and</strong> turbulent fluctuations in TFTR", Plasma Physics <strong>and</strong> Controlled<br />
<strong>Nuclear</strong> Fusion Research 1986 (Proc. 11th Int. Conf. Kyoto, 1986), Vol. 1, <strong>IAEA</strong>,<br />
Vienna (1987) 421-431.<br />
[6] GOLDSTON, R.J., Plasma Phys. Control. Fusion 26 (1984) 87.<br />
[7] ULRICKSON, M., el al., Paper <strong>IAEA</strong>-CN-50/G-IH-l, these Proceedings, Vol. 1.<br />
[8] BELL, M.G., et al., Plasma Phys. Control. Fusion 28 (1986) 1329.<br />
[9] DYLLA, H.F., et al., Nucl. Fusion 27 (1987) 1221-1230.<br />
[10] ZARNSTORFF, M.C., et al., Paper <strong>IAEA</strong>-CN-50/A-III-3, these Proceedings, Vol. 1.<br />
[11] FUSSMANN, G., et al. Paper <strong>IAEA</strong>-CN-50/A-III-l, ibid.<br />
[12] TROYON, F., et al.. Plasma Phys. Control. Fusion 26 (1984) 209.<br />
[13] BOL, K., et al., Phys. Rev. Lett. 57 (1986) 1891.<br />
[14] STRAIT, E.J., et at., Paper <strong>IAEA</strong>-CN-50/A-II-l, these Proceedings, Vol. 1.<br />
[15] GOLDSTON, R.J., et al., I. Comput. Phys. 43 (1981) 61.<br />
[16] STRACHAN, J.D., et al., Paper <strong>IAEA</strong>-CN-50/A-IV-5, these Proceedings, Vol. 1.
LATEST JET RESULTS<br />
AND FUTURE PROSPECTS<br />
JET TEAM*<br />
(Presented by R.J. Bickerton)<br />
JET Joint Undertaking,<br />
Abingdon, Oxfordshire,<br />
United Kingdom<br />
Abstract<br />
<strong>IAEA</strong>-CN-50/A-I-3<br />
LATEST JET RESULTS AND FUTURE PROSPECTS.<br />
Following technical modifications to the machine the plasma current in JET has been<br />
increased to 7 MA for limiter-bounded plasmas <strong>and</strong> to 5 MA for single-null, magnetic<br />
separatrix operation. Additional heating power has been raised to 20 M W of neutral beam<br />
injection <strong>and</strong> 18 MW of ion cyclotron resonance heating. The maximum total plasma energy<br />
content has exceeded 10MJ. Ion temperatures up to 23keV, central densities up to<br />
1.8 x 10 20 m~ 3 <strong>and</strong> energy confinement times up to 1.2s are achieved in different discharges.<br />
Simultaneous ion <strong>and</strong> electron temperatures greater than lOkeV have been achieved,<br />
showing no deleterious effects on confinement. Plasma temperatures exceeding 5 keV have<br />
been maintained for 20 s in a 3 MA discharge heated by ion cyclotron resonance heating<br />
(ICRH). The level of carbon <strong>and</strong> oxygen impurities is a major problem with the ratio<br />
between deuterium <strong>and</strong> electron densities in the range 0.15-0.80 depending on conditions.<br />
Several features of a-particle physics have been studied, notably by the RF heating of<br />
minority ions to mean energies of order 1 MeV. The fast particles slow down <strong>and</strong> heat<br />
the plasma in broad agreement with expectation. Plasma conditions in deuterium plasmas<br />
corresponding to an equivalent D-T) thermonuclear Q = 0.1 <strong>and</strong> total Q = 0.25 (including<br />
non-thermal reactions) have been reached. Exploiting the full high current, high power<br />
capability of the equipment is expected to increase these figures to ~ 0.3 <strong>and</strong> 0.6, respectively.<br />
Still further increases can be expected when various changes <strong>and</strong> additions are implemented.<br />
These are designed to control profiles of density <strong>and</strong> current <strong>and</strong> at the same time reduce<br />
the impurity content. Extrapolating the JET confinement data to a reactor-scale plasma<br />
shows that there should not be a problem with energy confinement but rather with<br />
disruptions <strong>and</strong> the control of particles <strong>and</strong> impurities. Experiments on both these aspects<br />
are planned including fuelling by high-speed pellets <strong>and</strong> feedback stabilisation of the<br />
instabilities which precede disruptions.<br />
1. Introduction<br />
The Joint European Torus (JET) is a large tokamak [1>21 designed to study:<br />
(a) the scaling of plasma behaviour as parameters approach the reactor range,<br />
(b) the plasma wall interaction in these conditions,<br />
* See Appendix I.<br />
41
42 JET TEAM<br />
(c) plasma heating <strong>and</strong><br />
(d) a-particle production, confinement <strong>and</strong> consequent plasma heating.<br />
The JET tokamak started operation in June 1983 <strong>and</strong> has since been progressively<br />
upgraded <strong>and</strong> developed. This paper concentrates on the results of the last two<br />
years, indicates further planned changes <strong>and</strong> discusses the resulting future<br />
prospects.<br />
2. Machine Performance<br />
Following the 1986 <strong>IAEA</strong> Conference' 31 , substantial modifications <strong>and</strong> additions<br />
were made to JET. These included:<br />
(a) Installation of two water-cooled toroidal belt limiters above <strong>and</strong> below the<br />
mid-plane.<br />
(b) Installation of eight ion cyclotron resonance heating antennae [4] ,<br />
symmetrically placed around the torus on the low-field side between the<br />
upper <strong>and</strong> lower belt limiters. Each antenna is fed by an RF amplifier in<br />
the frequency range 23 -57MHz with 3 -4MW for nominal pulse lengths up<br />
to 20 s.<br />
(c) Installation of a second neutral injector box oriented in the same direction<br />
as the first, equipped with eight ion sources <strong>and</strong> designed to inject a power<br />
of 10MW, 80kV, deuterium (total of two boxes -20MW).<br />
(d) Improvements to the poloidal field system permitting more flexible<br />
operation. This gives the capability to use the available volt-seconds fully<br />
<strong>and</strong> to produce single null configurations at higher currents.<br />
(e) Improved vacuum vessel restraints to allow safe operation at higher currents<br />
in elongated plasmas.<br />
(f) Many diagnostic improvements, most notably the time-of-flight short laser<br />
pulse, Thomson scattering system giving radially resolved measurements<br />
of electron temperature <strong>and</strong> density (LIDAR) together with modifications<br />
to the multi-channel interferometer to permit measurements of Faraday<br />
rotation angle <strong>and</strong> hence the calculation of the poloidal field distribution.<br />
(g) Installation of a multi-pellet injector 15 ' 61 capable of injecting deuterium<br />
pellets of 2.7,4 or 6mm in diameter at speeds in the range 1-1.5 km/s. The<br />
injector was supplied <strong>and</strong> is operated as part of a collaborative programme<br />
with US-DOE.<br />
(h) Installation of 32 poloidal rings of carbon tiles as X-point energy dumps.<br />
All these technical elements have been brought into successful operation although<br />
not without difficulty. Some water-cooled parts inside the beam boxes <strong>and</strong><br />
antennae in the main torus have developed leaks as a result of thermal cycling,<br />
beam loading or disruption forces. The problems have been dealt with by changes<br />
in design.
Parameter<br />
Plasma major radius (Ro)<br />
Plasma minor radius<br />
horizontal (a)<br />
Plasma minor radius<br />
vertical (b)<br />
Toroidal field strength at Ro<br />
Plasma Current:<br />
Limiter mode<br />
Single null X-point<br />
Neutral beam (NB) power<br />
(80 kV, D)<br />
Ion Cyclotron Resonance<br />
Heating (ICRH)<br />
power to Plasma<br />
<strong>IAEA</strong>-CN-50/A-I-3<br />
Table I<br />
JET Parameters<br />
Design Values<br />
2.96 m<br />
1.25 m<br />
2.1 m<br />
3.45 T<br />
4.8 MA<br />
Not foreseen<br />
20 MW<br />
15MW<br />
Achieved Values<br />
2.5-3.4 m<br />
0.8-1.2m<br />
0.8-2.1 m<br />
3.45T<br />
7.0 MA<br />
5 MA<br />
21 MW<br />
18MW<br />
The JET rated performance <strong>and</strong> achievements are shown in Table I. The most<br />
striking features are the operation at 7 MA, about 45% higher than the design<br />
value <strong>and</strong> the flexibility of the apparatus which has permitted high current operation<br />
with magnetic separatrix-bounded plasmas, not foreseen in the original<br />
design.<br />
3. Operating Limits <strong>and</strong> Disruptions<br />
The conventional operating diagram in \/qc versus ne R/Bt space is shown in<br />
Fig. 1. Here \/qc is normalised plasma current defined as (l/qc) = TRI/ 5ABt<br />
where R is the plasma major radius (m), /the plasma current (MA), A the crosssectional<br />
area of the plasma (m 2 ) <strong>and</strong> Bt the toroidal field strength (T) at the<br />
major radius R. Fig. l(a) shows the flat-top parameters of non-disrupting<br />
discharges with ohmic heating only. Discharges fuelled by gas-puffing show a<br />
density limit given by h < \2B/Rqc x 10 19 m~\ while densities more than 2 times<br />
higher can be obtained with pellet fuelling. Fig. l(b) shows the results with<br />
additional heating where similar densities can be obtained without pellets both<br />
with RF <strong>and</strong> neutral beam heating. The density limit disruptions are consistent<br />
with a rise in the radiated power in the outer regions to close to 100% of the<br />
input, <strong>and</strong> a resulting narrowing of the current channel leading to MHD<br />
instability.<br />
43
44 JET TEAM<br />
5cr<br />
0.7<br />
0.6<br />
0.5<br />
0.4<br />
0.3<br />
0.2<br />
0.1<br />
0.0<br />
0.0<br />
OH pulses<br />
• indicates point (~0.1s)<br />
alter pellet injection<br />
' " v ' ' »<br />
• '• :'• ^jjjjj&i?' * •,'' • • •<br />
additional heating<br />
« NBI<br />
o RF<br />
D NBI + RF<br />
Fig. 1 Normalised plasma current, 1 /(^versus normalised density, nR/B,for non-disrupting<br />
discharges (a) with ohmic heating, (b) with additional heating.<br />
(a)
1500<br />
<strong>IAEA</strong>-CN-50/A-I-3 45<br />
2 4<br />
I, (MA)<br />
Fig. 2 Maximum dl/dt versus / for current quench phase of disruptions.<br />
The disruption process then proceeds in stages, a precursor period with<br />
externally detected growing m=2,n=l magnetic oscillations at ~ 500Hz. When<br />
the amplitude reaches ~ 10~ 3 T the mode locks <strong>and</strong> continues to grow. This is<br />
followed by an energy quench in which the major part of the plasma energy<br />
is lost in ~ 1 ms. Finally there is a current decay phase in which the plasma current<br />
falls to zero in a time which can be as short as 5 ms. The poloidal field energy<br />
is converted into radiation <strong>and</strong> runaway electrons (e.g. ~ 5 MJ of > 25 MeV<br />
electrons for a 5 MA disruption). Fig. 2 shows the maximum rate of current<br />
collapse versus current in JET. The eddy currents induced in the torus by the<br />
rapid current collapse lead to large forces on the vessel of order 20t/m 2 . The<br />
vacuum vessel mounting has been considerably strengthened to reduce the<br />
resulting displacements. Further measures to stiffen the torus by welding toroidal<br />
rings on to the inner wall are planned for the next shutdown.<br />
Apart from density limit disruptions the operating diagram also shows<br />
disruptions whenever the field line q at the boundary,
46 JET TEAM<br />
Experiments on the feedback stabilisation of the initial small amplitude magnetic<br />
oscillations will be carried out in a later phase of the JET programme.<br />
4. Discharge Types<br />
4.1 Operating Variables<br />
Discharges have been operated with different boundary conditions, heating<br />
scenarios, particle fuelling <strong>and</strong> pumping arrangements. Fig. 3 shows the poloidal<br />
flux plots for three cases: (a) with a limiter-bounded plasma; (b) <strong>and</strong> (c) with<br />
single <strong>and</strong> double null magnetic configurations.<br />
The fuelling variations include<br />
using gas-puffing at the boundary, injecting<br />
pellets or neutral injection to provide<br />
central fuelling. The particle pumping at<br />
the boundary can be varied by using different<br />
surfaces in the vacuum vessel <strong>and</strong> by<br />
conditioning those surfaces (eg. by helium<br />
discharges before the main pulse operation).<br />
The heating scenarios are variations<br />
<strong>and</strong> combinations of neutral beam (NB)<br />
<strong>and</strong> ion-cyclotron resonance heating<br />
(ICRH). The neutral beams have been<br />
operated entirely in co-injection mode with<br />
deuterium at 70-80kV. ICRH has been<br />
used with H or J He minority in D or 4 He<br />
plasmas. This heats the minority ions to<br />
energies in the range lOOkeV-1 MeV, above<br />
the critical energy, so that ultimately the RF<br />
power goes to the electrons. The deposition<br />
zone has typically a half-width of 30cm.<br />
The radial profiles of n, Te <strong>and</strong> T, for various<br />
discharges are obtained from the<br />
LIDAR Thomson scattering system <strong>and</strong><br />
charge exchange recombination spectros-<br />
copy. q -profiles are deduced by magnetic<br />
analysis of external signals, which is<br />
inaccurate in the centre except for the<br />
7 MA, monster sawtooth <strong>and</strong><br />
H-mode cases where Faraday rotation <strong>and</strong><br />
X-ray data have been combined with<br />
magnetic analysis.<br />
1 2 3 4<br />
Major Radius (m)<br />
Fig. 3 Poloidal flux contours for<br />
(a) 7 MA limiter-bounded plasmas,<br />
(b) 5.1 MA single null magnetic<br />
separatrix <strong>and</strong> (c) 3 MA double<br />
null separatrix.
<strong>IAEA</strong>-CN-50/A-I-3 47<br />
3.0 3.5<br />
Major radius (m)<br />
Pulse No: 17816<br />
High - Current<br />
Ip = 7 MA; t = 9.5s<br />
Fig. 4 Radial profiles of electron temperature, electron density <strong>and</strong><br />
safety factor in a 7MA plasma. From Faraday rotation measurements<br />
)=0.8±0.1. B=3.1T, ?,W = 8.5MW, Ze//=3J, rE =0.6s.<br />
4.2 Ohmic Discharges<br />
The radial profiles for a 7 MA ohmic discharge are shown in Fig. 4. This particular<br />
discharge had a short flat-top time of 2 s <strong>and</strong> was operated cautiously with<br />
moderate density to avoid disruption. Since q^ is low at 2.8, there is a large central<br />
volume inside the q=1 surface where the profiles of both density <strong>and</strong> temperature<br />
are flat. The central q value is 0.8 + 0.1 <strong>and</strong> the discharge is sawtoothing. To<br />
economise on volt-seconds <strong>and</strong> hence reach 7 MA, it was neccessary to use a<br />
helium prefill for the initial breakdown phase. For this reason, the Zeff was<br />
relatively high <strong>and</strong> the neutron yield low for the conditions of<br />
density <strong>and</strong> temperature.<br />
4.3 High Current, High Power Discharges<br />
Fig. 5 shows the radial profiles for a 6 MA, limiter-bounded high power discharge.<br />
Again, at this high current, there is a large radial zone in which the deduced<br />
value of q is less than unity <strong>and</strong> the gradients in electron temperature <strong>and</strong> density<br />
are low. With the electron temperature at ~ 5 keV, the neutral beams with energy<br />
4.0
48 JET TEAM<br />
i<br />
6<br />
4<br />
2<br />
0<br />
IA<br />
f 1<br />
s<br />
J•**<br />
~-— —<br />
T<br />
2.5 3.0 3.5<br />
Major radius (m)<br />
Pulse No: 18123<br />
Combined heating<br />
l = 6MA;t= 13.0s<br />
\ \<br />
\ \<br />
\ \<br />
\ /<br />
y •<br />
Fig. 5 Radial profiles of electron <strong>and</strong> ion temperatures, electron density <strong>and</strong><br />
safety factor in a 6MA discharge with 24MW of heating power.<br />
B=3.1T, />sf=6MW, PNB = \3MW, Ze//=4.8, r* = 0.33s.<br />
per nucleon of 40keV give their energy primarily to the ions. However, because<br />
of the high density the two temperatures are closely coupled by collisional<br />
equipartition.<br />
4.4 High Temperature Discharges<br />
Fig. 6 shows the profiles for a 3 MA discharge in which special measures were<br />
taken to keep the density low <strong>and</strong> hence to achieve high temperatures. There<br />
is a relatively small core where q
I<br />
15<br />
10<br />
5<br />
0<br />
<strong>IAEA</strong>-CN-50/A-I-3 49<br />
V<br />
\ /I<br />
- /-- \/ —T<br />
/ "<br />
/ \<br />
n e<br />
'e<br />
2.5 3.0 3.5<br />
A<br />
Major radius (m)<br />
Pulse No: 16066<br />
Low density<br />
l = 3MA;t= 12.0s<br />
/ - 3<br />
yV<br />
•2 g<br />
/<br />
\<br />
^- 1<br />
1 1 ^—^<br />
Fig. 6 Radial profiles of electron <strong>and</strong> ion temperatures, electron density <strong>and</strong> safety factor in<br />
a 3MA, low density discharge with 5=3.IT, PSF=8MW, PM = 8MW, Pror=16.5MW,<br />
Ze//=5.2, TE =0.4s.<br />
Pulse No: 15697<br />
Monster Sawtooth<br />
= 3MA;t = 10.0s<br />
3.0 3.5<br />
Major radius (m)<br />
Fig. 7 Radial profiles of electron temperature, electron density <strong>and</strong> safety factor in a 3 MA<br />
plasma during a long 'monster' sawtooth. From Faraday rotation measurements q(0)=0.8 ± 0.1.<br />
, Pro7-=14MW, Zef/=3.9, TE =0.38S.<br />
4.0<br />
30<br />
O
50 JET TEAM<br />
3.0 3.5<br />
Major radius (m)<br />
Pulse No: 17749<br />
Pellet discharge<br />
I = 3 MA; t = 4.2s<br />
4.0<br />
4 «<br />
2 0J<br />
r-<br />
Fig. 8 Radial profiles of electron <strong>and</strong> ion temperatures, electron density <strong>and</strong> safety factor in<br />
a 3MA, pellet-injected discharge with S=3.1T, PRF=l3MW, PNB = 5MW, Pro7-=19MW,<br />
Zf//=2.0, TE = 0.26s.<br />
Pulse No: 15894<br />
H - mode<br />
l = 3MA;t=16.0s<br />
3.0 3.5<br />
Major radius (m)<br />
Fig. 9 Radial profiles of electron <strong>and</strong> ion temperatures, electron density <strong>and</strong> safety factor in<br />
a 3MA, H-mode plasma. Faraday rotation measurements yield
<strong>IAEA</strong>-CN-50/A-I-3 51<br />
Magnetic measurements of Faraday rotation 171 show that during the period #(0)<br />
is progressively reduced to ~ 0.8+0.1. This is consistent with resistive diffusion<br />
calculations assuming neo-classical resistivity <strong>and</strong> the measured central electron<br />
temperature. The stabilising mechanism against m = \, n=\ MHD instabilities<br />
is still uncertain although there is the possibility 183 that an essential role is played<br />
by the fast minority particles. These 'monster' sawtooth discharges show the<br />
increase in reactivity coming from the profile peaking. However they are<br />
terminated by a crash in which -30% of the plasma energy is lost in a few<br />
milliseconds. They can be seen as evidence of what could be achieved in steady<br />
state with external control of the current distribution in the plasma.<br />
4.6 Pellet-Fuelled Discharges<br />
Fig. 8 shows the profiles for a discharge in which pellets are injected during the<br />
current rise phase to produce a highly peaked density distribution [6] . With ohmic<br />
heating alone, this decays slowly on a time scale of 2 - 3 s. Central ion cyclotron<br />
resonance minority heating increases the central electron <strong>and</strong> ion temperatures<br />
to ~10keV, while «/ <strong>and</strong> n then decay to 2 <strong>and</strong> 6xl0 19 nT 3 , respectively,<br />
in 1.5 s. Note that there are very steep pressure gradients in the core, <strong>and</strong> a very<br />
high pressure on the axis,<br />
4.7 H-mode Discharges<br />
Fig. 9 shows the profiles during the H-phase of a 3 MA discharge with 7MW<br />
of neutral beam injection. Striking features are the near-flat density profile <strong>and</strong><br />
the high electron temperature near the separatrix boundary. The confinement<br />
time is high as is the density. These H-modes [91 are characterised by increasing<br />
density <strong>and</strong> radiated fraction during the H-phase which is then terminated when<br />
the radiated fraction approaches unity. So far, attempts to couple RF power <strong>and</strong><br />
maintain H-modes have failed. Switching on the RF during a beam created Hmode<br />
caused a rapid termination of the mode due to increased radiation. It is<br />
clear that the high confinement of energy also extends to bulk ions <strong>and</strong> impurities<br />
<strong>and</strong> so brings its own problems.<br />
5. Impurities<br />
The main impurities are oxygen <strong>and</strong> carbon, with concentrations of 1 -10%.<br />
In addition, there is nickel with concentrations 10~ 5 -10~ 4 , higher values<br />
corresponding to RF heating from the nickel antennae. Fig. 10 shows Zeff<br />
versus n for a representative set of data. Clearly, there is an overall trend to lower<br />
Zeff as the density is raised.
52 JET TEAM<br />
fl 4<br />
2 3 4<br />
Average density(n)(x10"rrr 3 )<br />
C* H-mode<br />
C- L-mode<br />
Zeff=(2+2/n)<br />
Fig. 10 Effective ion charge Zeff versus average density for JET discharges. H-modes are identified<br />
separately. Line is the function Zp//=2 + 2/«l9 used later in predicting performance.<br />
Impurity accumulation is seen in some H-modes [9] . Accumulation is also seen<br />
in peaked density profile, pellet produced discharges. Curiously, accumulation<br />
is not seen in monster sawtooth cases despite the absence of sawteeth. Normal<br />
limiter bounded discharges with sawteeth do not show accumulation.<br />
Radiation profiles are generally hollow so that radiation does not play any<br />
significant role in the energy balance in the plasma interior. The primary effect<br />
of impurities is to deplete the density of hydrogen isotopes in the core. The ratio<br />
of deuteron density to electron density is reduced by the presence of impurity<br />
ions with charge Z, by, nc/n^iZi-Z^/iZ-X). With Z;=7, intermediate<br />
between carbon <strong>and</strong> oxygen, <strong>and</strong> with Ze//between 2 <strong>and</strong> 6, nD/ne is in the range<br />
0.8-0.15.<br />
This range of values is confirmed by neutron yield measurements. The highest<br />
values of nD/ne are for pellet-fuelled cases, intermediate are H-modes <strong>and</strong> lowest<br />
are low density, high temperature limiter discharges.<br />
6. Bootstrap Current<br />
A significant bootstrap current driven by the pressure gradient" 0 ' 201 is seen most<br />
clearly in H-mode discharges. Fig. 11 shows the time-dependence of the surface<br />
voltage which transiently reverses sign. The calculated voltages with <strong>and</strong> without<br />
the bootstrap current are shown. Only the case including the effect gives sign<br />
reversal <strong>and</strong> agreement with the experiment. The TRANSP code is used which
0.8<br />
0.6<br />
<strong>IAEA</strong>-CN-50/A-I-3 53<br />
-0.2 12 14 16<br />
Time (s)<br />
Fig. 11 Surface voltage versus time. Calculated voltage is shown for bootstrap <strong>and</strong> no bootstrap<br />
current. Bootstrap current is 850 k A. Total current is 3 MA. Discharge is in H-mode phase.<br />
solves the time dependent resistive diffusion equations incorporating the full<br />
neo-classical expression 1111 for the bootstrap current density as well as beam<br />
driven contributions (small here). In this case, 850 kA is bootstrap driven out<br />
of a total current of 3 MA.<br />
We can expect bootstrap currents of 1-2MA in 5MA discharges with the<br />
plasma energy content in the range 15-30MJ.<br />
7. Alpha-Particle Physics<br />
Some aspects of a-particle physics have been studied. Measurements on triton<br />
burn-up [191 show that the I MeV tritons produced in the D-D reaction slow down<br />
classically on the plasma electrons at the theoretical rate, within 20% experimental<br />
error. Other aspects of a-particle physics are simulated in ion cyclotron resonance<br />
heating of 3 He minority in deuterium plasmas. In these experiments 1121 , up to<br />
60 kW of fusion power in charged particles is produced <strong>and</strong> monitored by yrays<br />
from a low branching ratio nuclear reaction. The energy content in fast ions,<br />
as monitored by the difference between diamagnetic loop <strong>and</strong> magnetic<br />
equilibrium measurements, exceeds 1MJ. The fast particle parameters are<br />
displayed in Table II <strong>and</strong> compared with the expected a-particle numbers for<br />
a Q=l experiment on JET <strong>and</strong> for an ignited ITER type plasma.<br />
18
54 JET TEAM<br />
(nfast/ne)0<br />
(Pfast)o<br />
vf/vA<br />
Parameter<br />
efas, (MeV)<br />
Pi/Pn<br />
PJ/PLOSS<br />
(Pfl/fl)<br />
Table II<br />
Fast or «-Particle Parameters<br />
Achieved<br />
in JET<br />
1-3x10" 2<br />
1%<br />
1-2<br />
1<br />
10-50<br />
0.8<br />
0.2 (3 MA)<br />
JET Q =1<br />
10~ 3<br />
0.6%<br />
2<br />
2<br />
1<br />
0.17<br />
0.3 (5 MA)<br />
Expected Values<br />
Ignited ITER<br />
7x10~ 3<br />
2%<br />
2.8<br />
2<br />
1<br />
1<br />
0.07 (20 MA)<br />
In this table zy is the mean velocity of fast ions, vA the Alfven speed, e the mean<br />
energy of fast ions, Pf the power input from fast particles to the plasma, pt <strong>and</strong><br />
pn the perpendicular <strong>and</strong> parallel fast particle pressures, pe the fast particle gyro<br />
radius in the poloidal field at the plasma boundary. Fig. 12 shows the calculated<br />
3 He distribution function at various radii in a particular discharge. Also shown<br />
is the expected a-particle distribution function in a lOkeV plasma. Evidently<br />
the two distributions are very similar. Note that more than 30% of the fast<br />
particles inside the half-radius of the experiment are super-Alfvenic. The major<br />
difference is the high anisotropy of the fast 3 He distribution compared with<br />
the isotropy expected for a-particles. The anisotropic case would be expected<br />
to be more unstable to collective modes so that the classical behaviour observed<br />
can be expected to carry over to the a-particle case. The confinement behaviour<br />
of these discharges heated by fast particles is if anything slightly better than the<br />
normal L-mode scaling. There is clear evidence that sawteeth crashes cause the<br />
fast particle population to be transferred to the zone outside the inversion radius.<br />
Averaging over sawteeth, this serves to flatten the power deposition profile. Of<br />
course, thermal instabilities arising from the density <strong>and</strong> temperature dependence<br />
of a-particle production are not simulated in these experiments. However, modes
10<br />
0.5<br />
Pulse No: 15376<br />
n(He')/ne=1.5%<br />
Thermonuclear<br />
alpha-particles ^<br />
(r/ra)=0.55-*/<br />
<strong>IAEA</strong>-CN-50/A-I-3 55<br />
/<br />
/<br />
/ /<br />
/ /<br />
/ /<br />
/ /<br />
/<br />
/<br />
/<br />
1<br />
/<br />
1—<br />
^ — - ~<br />
/<br />
/<br />
/<br />
/-•—<br />
/<br />
/<br />
1<br />
1<br />
~—- (r/ra)=0.35<br />
— (r/ra)=0.15<br />
0.1 1 10<br />
Energy (E) (MeV)<br />
Fig. 12 Energy distribution function of heated (minority) 3 He ions at various plasma radii.<br />
For comparison the a-particle distribution function for a lOkeV plasma is shown.<br />
1<br />
o<br />
10;<br />
0.3<br />
0.1<br />
Q=0.05 Q=0.1 Q=0.2 Q=0.5<br />
\<br />
A Low n<br />
H H-mode<br />
* Pellets<br />
0 Others<br />
6 8 10 14 20<br />
T, (keV)<br />
Fig. 13 Experimental values of nD T-, TE versus tr Curves show the equivalent thermonuclear<br />
Q for a 50:50 deuterium plasma. They are calculated assuming Te = 7] <strong>and</strong> radial profiles similar<br />
to the experimental ones (ratio central to average pressure of 3).<br />
100
56 JET TEAM<br />
o<br />
6 •<br />
2 •<br />
H<br />
iifc<br />
1<br />
|K,H H<br />
91<br />
2 4 6<br />
H<br />
A<br />
H<br />
H<br />
H<br />
life<br />
1<br />
Peak density (fieXxi<br />
n<br />
Low n<br />
H-mode<br />
Pellets<br />
u iui<br />
v WH<br />
Fig. 14 Measured QDD versus mean density.<br />
of this type will not be seen in Q=1 deuterium-tritium experiments either, since<br />
there the a-power is only 17% of the total.<br />
8. Fusion Product <strong>and</strong> Q<br />
The experimental values of the fusion product (nD 7} TE) are plotted versus<br />
Tt in Figure 13. Also shown are the contours of constant thermonuclear Q, Qth<br />
calculated on the basis of a D-T mixture with the same hydrogen isotype density<br />
<strong>and</strong> with density <strong>and</strong> temperature profiles typical of JET experiments (pressure<br />
ratio p/(p)=3). It is assumed that Te = Tt at all radii. Correcting for<br />
impurities by taking only the deuteron density overestimates Qth because the<br />
energy content of the electrons associated with the impurities is not included<br />
in the losses. However for Zefj < 3, the maximum error is 30 %. From the figure<br />
it is clear that conditions close to Qth =0.1 have been achieved.<br />
Fig. 14 shows the directly measured values of QDD versus mean density. Here<br />
the highest values which are at low density are due to beam-plasma interactions.<br />
Scaling these to the planned deuterium beam energy (140keV), accounting for<br />
cross-section <strong>and</strong> yield changes, the equivalent Qtot for a 50:50 D-T plasma is 0.25.<br />
10
<strong>IAEA</strong>-CN-50/A-I-3 57<br />
5 10 15<br />
[Pt-dW/dt](MW)<br />
L-mode<br />
V 1.1MA<br />
D 2.0MA<br />
0 3.3MA<br />
0 5.0MA<br />
A 6.0MA<br />
7.0MA<br />
H-mode<br />
0 2.0MA<br />
0 3.0MA<br />
K4.0MA<br />
0 5.0MA<br />
Fig. 15 Global energy confinement time, rE , versus input power for the L-mode (curves are<br />
Goldston scaling for different currents) <strong>and</strong> H-mode (curves are 2 x Goldston scaling) cases.<br />
9. Confinement <strong>and</strong> Transport<br />
The global confinement times, defined as TE = W/(P-dW/dt), are shown in<br />
Fig. 15 as a function of input power for both the l^mode <strong>and</strong> H-mode case. These<br />
results can be equally well represented by the Goldston power law [131 :<br />
r£(G) = 3.7x 1(T 2 IR U75 a 0 - 37 K v * P"^<br />
or by an offset-linear law derived by Rebut <strong>and</strong> Lallia f141 ,<br />
TE (R-L) =3.7xlO" 2 M y i T v * n* B v > L ly * Z Vi P~ l +1.7X10' 2 M* 4 IL 3/l Z"" 2
58 JET TEAM<br />
where Mis the atomic mass, L 3 =Ra 2 K, K= elongation, n=density (10 19 m 3 ),<br />
Z = Zeff, <strong>and</strong> other units are MA, T, m, MW, <strong>and</strong> s. Fig. 16 <strong>and</strong> 17 show the JET<br />
data plotted against these laws. H-modes are clearly improved with respect to<br />
Goldston by ~ 2 <strong>and</strong> to Rebut-Lallia by slightly less.<br />
a<br />
4<br />
1.2 - o<br />
4<br />
1.0<br />
0.8 -<br />
0.6<br />
0.4<br />
0.2<br />
X<br />
" tt<br />
0<br />
0<br />
9<br />
/<br />
H-mode 2MA<br />
H-mode 3MA<br />
H-mode 4MA<br />
1MA<br />
2MA<br />
3MA<br />
4MA<br />
5MA rtfl _/<br />
6MA "yA<br />
Ratio = 2.8/<br />
/A<br />
/v<br />
/<br />
,A /<br />
2.0/<br />
0<br />
^<br />
0.0<br />
^<br />
i<br />
]<br />
1<br />
0.0 0.2 0.4 0.6 0.8<br />
Fig. 16 Comparison between the experimental values of global energy confinement time, TE<br />
<strong>and</strong> the predictions of Goldston (84) scaling' 131 .<br />
1.4<br />
D H-mode 2MA<br />
i H-mode 3MA<br />
1.2 - (? H-mode 4MA<br />
* 1MA<br />
X 2MA<br />
1.0<br />
tt 3MA<br />
f Q 4MA<br />
I 0.8 - 0 5MA<br />
e 6MA<br />
0.6<br />
0.4<br />
0.4<br />
TglSMR-L)<br />
Ratio = 2.8 2.0<br />
/<br />
0.6 0.8<br />
Fig. 17 Comparison between the experimental values of global energy confinement time, T£<br />
<strong>and</strong> the predictions of the Rebut-Lallia (88) scaling law" 41 .
10<br />
E<br />
X 4<br />
H-mode y<br />
0.2 0.4 0.6 0.8 1.0<br />
<strong>IAEA</strong>-CN-50/A-I-3<br />
1<br />
10<br />
Monster<br />
sawtooth<br />
. regime<br />
59<br />
(limiter)<br />
0.2 0.4 0.6 0.8 1.0<br />
Fig. 18 The single-fluid, thermal conductivity x versus normalised radius for various types<br />
of discharge.<br />
It seems unlikely that it will be possible to separate these two forms on JET.<br />
At high power the ratio of the two confinement times for Z = M=2 is:<br />
TE(G) /TE(R-L)=2.2 (R/a) l - 25 a-° A2 P~<br />
For JET dimensions, TE(G) <strong>and</strong> TE{R-L) are equal for P=45MW. Above<br />
45 MW, the offset linear law becomes more optimistic, below this power the combination<br />
of the offset <strong>and</strong> the incremental part is difficult to distinguish from<br />
the power law.<br />
Looking ahead to a reactor, note that degradation of the P~ 1/2 type will have<br />
to be forced if it does not occur naturally. Only in this way can a reactor be ignited<br />
at low power <strong>and</strong> then moved to its final high power operating point' 151 .<br />
Local transport analysis^ 161 of extensive JET data has shown in broad terms<br />
that the electron <strong>and</strong> ion thermal conductivities, xe <strong>and</strong> X;, are approximately<br />
equal while the particle diffusion coefficient D is typically (x
60 JET TEAM<br />
20<br />
P(MW)<br />
Fig. 19 Plasma energy content versus total power input. Curves are for constant thermonuclear<br />
Q assuming an average ion temperature greater than 7 keV. Density must be less than the critical<br />
value on the right h<strong>and</strong> ordinate for this to be the case.<br />
power deposition. These results taken together are not simply correlated with<br />
variations of -qe, ??, (=dlnT/dln.n). Critical temperature gradient (or equivalently<br />
heat-pinch) or critical pressure gradient models give a tolerable representation<br />
of both steady-state <strong>and</strong> transient profiles of temperature for most cases.<br />
However for the heated pellet case, an ad hoc reduction of x is required to fit<br />
the data [16] .<br />
10. Future Prospects<br />
For central ion temperatures > lOkeV <strong>and</strong> moderate profiles (yp =p/{p) ~ 3),<br />
the ratio, F, of a-particle power to the losses is given by:<br />
F=2xlO" 22 n TTE<br />
corresponding to an energy content W(MJ) in the plasma<br />
2.4 VF<br />
W = Yp
<strong>IAEA</strong>-CN-50/A-I-3 61<br />
where V is the plasma volume. For low values of F,. TE = W/P where P is the<br />
input power so that W= (2.4 VFP/-yp) Vl or in terms of thermonuclear Qth,<br />
For JET with a plasma volume of 140m 3 <strong>and</strong> yp =3<br />
W=l0.6 [%£l *<br />
This relation is shown in Fig. 19 for Qth =0.3,0.5 <strong>and</strong> 1.0. The right-h<strong>and</strong> ordinate<br />
shows the mean density scale corresponding to f- 7 keV. If for a given plasma<br />
energy, the density is higher than the figure given, then the central temperature<br />
will be too low, which invalidates the relation used between F <strong>and</strong> the fusion<br />
parameter. The present experimental data for W versus P is also shown on the<br />
figure. At first sight, the H-modes have the highest potential but the density<br />
is too high for optimum results.<br />
Qor<br />
1.0<br />
0.8<br />
0.6<br />
0.4<br />
0.2<br />
Zel,=2+2/n19<br />
T,=Te;7p=3<br />
/<br />
/<br />
y<br />
/<br />
V\<br />
Q.o. X<br />
-—<br />
L:<br />
H<br />
- Operating<br />
Range<br />
Average Density (n) (x10 19 m- 3 )<br />
\<br />
L-mode: 30 MW:<br />
H-mode:<br />
15MW:<br />
—>-<br />
H<br />
^s<br />
L<br />
T-<br />
TE<br />
*«.<br />
—<br />
=0.4s<br />
=0.8s<br />
.<br />
- _<br />
Fig. 20 Predicted thermonuclear <strong>and</strong> total Q values for H <strong>and</strong> L-mode cases with 15 MW of<br />
140 kV beams supplemented in the L-mode case by 15 MW of RF. The present operating density<br />
range under these conditions is marked.
62 JET TEAM<br />
A further assessment including beam-plasma reactions is shown in Fig. 20.<br />
Here, it is assumed that Zeff=(2 + 2/n19), which is an approximate representation<br />
of Fig. 10. The beams are taken to be the 140 kV, 15 M W deuterium, planned<br />
for the D-T phase. Assuming a realistic minimum average density of 5 x 10 19 nT 3<br />
at high current <strong>and</strong> high power shows a total Q ranging from 0.3 -0.6, as TE varies<br />
from 0.4-0.8s (range of L <strong>and</strong> H-mode predictions). The corresponding empower<br />
would be of the order 2MW.<br />
A number of technical improvements <strong>and</strong> additions to the apparatus are in<br />
h<strong>and</strong> which should enable higher performance to be reached. These are:<br />
(a) stiffening of the vacuum vessel to permit routine operation at the highest<br />
current level;<br />
(b) improved RF launching antennae with beryllium screens; this should<br />
increase reliability <strong>and</strong> facilitate coupling of RF power to H-modes;<br />
(c) 10MW, 3.7GHz lower hybrid current drive system to control the current<br />
density profile;<br />
(d) two pump-limiter modules to improve density control;<br />
(e) single, <strong>and</strong> subsequently, multiple high speed pellet injectors (~ 4 - 6 km/s)<br />
to enable central fuelling of higher temperature plasmas;<br />
(f) the replacement of carbon tiles on belt limiters <strong>and</strong> antennae protection by<br />
beryllium together with beryllium evaporators. This should reduce the oxygen<br />
content <strong>and</strong> substitute a lower Z element for carbon;<br />
(g) water cooled X-point dump plates with carbon fibre material facing the<br />
plasma;<br />
(h) saddle coils are being prepared to go inside the vacuum vessel for feedback<br />
control of the precursor instabilities which lead to disruptions;<br />
(i) upgrading of neutral beam energy to 140 kV, deuterium <strong>and</strong> eventually one<br />
of the two beam boxes to 160 kV, tritium;<br />
(j) tritium <strong>and</strong> remote-h<strong>and</strong>ling equipment is under intensive preparation for<br />
the deuterium tritium phase.<br />
11. Summary <strong>and</strong> Conclusions<br />
In summary, the main results achieved on JET have been:<br />
1. JET has operated with 7 MA in limiter mode <strong>and</strong> 5 MA with a single<br />
X-point configuration;<br />
2. Central ion temperatures of 23 keV, central electron temperatures of 12keV,<br />
central electron densities of 1.8xlO 2O m~ 3 <strong>and</strong> confinement times of 1.2s<br />
have been obtained in different discharges.<br />
3. Both electron <strong>and</strong> ion temperatures have simultaneously exceeded lOkeV<br />
during several confinement times. Most encouraging is that no further
<strong>IAEA</strong>-CN-50/A-I-3 63<br />
confinement degradation is observed in these conditions directly relevant<br />
to reactor operations.<br />
4. Plasma temperatures exceeding 5 keV have been maintained for 20 s during<br />
ICRH heating of 3 MA discharges.<br />
5. Plasmas with an equivalent thermonuclear Q of 0.1 <strong>and</strong> equivalent total<br />
Q (including non-thermal reactions) of 0.25 have been achieved.<br />
6. The high current capability combined with the full rated heating power has<br />
not yet been exploited. Technical difficulties with water cooled elements <strong>and</strong><br />
with disruption forces are progressively being overcome.<br />
7. Some aspects of a-particle physics have now been simulated notably in RF<br />
heating experiments with a 3 He minority in the plasma. The behaviour is<br />
as expected.<br />
8. Extrapolating from present results, taking into account the operating limits<br />
on density <strong>and</strong> impurities a total Q approaching 0.6 is predicted for D-T<br />
operation corresponding to an a-power of 2MW.<br />
9. Technical changes <strong>and</strong> additions to the apparatus now under preparation<br />
will give greater control of density <strong>and</strong> current profiles, reduce the impurity<br />
content <strong>and</strong> perhaps reduce the severity of disruptions. These should lead<br />
to significant improvements over the base-level performance predictions<br />
given above.<br />
In conclusion, extrapolation of JET confinement data using either Goldston<br />
or offset-linear scaling suggests that energy confinement itself will not be a<br />
problem in reactor-scaled devices such as PCSR [17] operating at the 20 MA level.<br />
Much more problematic are questions of fuelling, pumping <strong>and</strong> maintenance<br />
of a long burn plasma. JET is the machine with plasma parameters <strong>and</strong> geometry<br />
closest to those required. Therefore, it offers the possibility of developing the<br />
technical means <strong>and</strong> the experience in the delicate balance required between energy<br />
<strong>and</strong> particle (including impurities) confinement.
64 JET TEAM<br />
APPENDIX I<br />
THE JET TEAM<br />
JET Joint Undertaking, Abingdon, Oxon, OX14 3EA, UK<br />
J.M. Adams', H.Altmann.G. Appruzzese.W. Bailey, P.BaUantyne.B.Balet.D.V.Bartlett, L.R.Baylor",<br />
K.Behringer 13 , A. C. Bell, P.Bertoldi, E.Bertolini, L.G.Betello, V.Bhatnagar, R. J.Bickerton,<br />
A. J. Bickley, J. Bizarro 21 , S. Bliman", T. Bonicelli, S. J. Booth, G. Bosia, M. Botman, D. Boyd 30 , H. Brelen,<br />
H.Bririkschulte, M.Brusati, T.Budd, M.Bures, T.Businaro 4 , P.Butcher, H.Buttgereit, C.Caldwell-<br />
Nichols, D.J.Campbell, P. Card, J.Carwardine,G.Celentano,P.Chabert 16 ,C.D.ChalUs, A. Cheetham,<br />
J.Christiansen, C.Christodoulopoulos, P.Chuilon, R.CIaesen, S.Clement 29 , J.P.Coad, P.Colestock 6 ,<br />
S.Conroy 12 , M.Cooke, S.Cooper, J.G.Cordey, W.Core, G.Corrigan, S.Corti, A.E.Costley,<br />
G.Cottrell, M.Cox 7 , P.Cripwell 12 , D.Cross, H.deBlank", H.deEsch, J.deHaas 15 , L.deKock,<br />
E.Deksnis, G.B.Denne, G.Deschamps, G.Devillers, K. J.Dietz, J.Dobbing, A.Dombra, N.Dolgetta,<br />
S.E.Dorling, P.G.Doyle, D.F.Diichs, H.Duquenoy, A.Edwards, J. Ehrenberg", T.Elevant",<br />
W.Engelhardt, S.K.Erents 7 , L.G.Eriksson 3 , M.Evrard 2 , H.Fajemirokun 12 , H.Falter, J.Farthing,<br />
D.Flory.M.Forrest 7 , C.Froger, K.Fullard, M.Gadeberg, A.Galetsas, M.Galley, R.Galvao 8 , M.Garribba,<br />
R. Giannella, A. Gibson, R. D. Gill, A. Gondhalekar, G. Gorini, C. Gormezano, N. A. Gottardi, C. Gowers,<br />
B.J.Green, F.S.Griph, W.K.Guo 26 , R.Haange, G.Hammett 6 , W.Han', H.E.Han-Gonge 26 ,<br />
C. J.Hancock, P. J.Harbour, N.C. Hawkes 7 , P.Haynes 7 , J. Heikkinen 3 , T.Hellsten, J.L. Hemmerich,<br />
R.Hemsworth, F.B.Herzog, R.F.Herzog, J.Hoekzema, R.Hope, W.A.Houlberg", J.How,<br />
M.Huart, T.P.Hughes 31 , M.Hugon, M.Huguet, M.Irving, J.Jacquinot, O.N.Jarvis, F.Jensen,<br />
T.C.Jernigan 23 ,E.Joffrin,E.M. Jones. L.P.D.F. Jones, T.T.C. Jones, J.Kallne,O.Kardaun' 3 ,A.Kaye,<br />
B.E.Keen, M.Keilhacker, G.J.Kelly, A.Khare 14 , S.KnowIton, A.Konstantellos, M.Kovanen 20 ,<br />
P.Kupschus, P.Lallia, R.Lanza, R.Lasser, J.R.Last, L.Lauro-Tarbni, K.Lawson 7 , E.Lazzaro,<br />
M.Lennholm, B.Liley", X.LItaudon, P.Lomas, M.Lorentz-Gottardi 2 , C.Lowry, G.Maddison 7 ,<br />
G. Magyar, M. Malacarne, W. M<strong>and</strong>l 13 , V. Marchese, J.Mart, P. Massmann, G.McCracken 7 , J.Mendonca,<br />
P.Meriguet, P.Micozzi 4 , S.F.Mills, P.Millward, S.L.Milora 23 , A.Moissonnier, F.Mompean,<br />
P.L.Mondino, P.Morgan, G.Murphy, G.Newbert, M.Newman, P.Nielsen, P.Noll, W.Obert,<br />
D.O'Brien, J.O'Rourke, M.G.Pacco-Diichs. M.Pain, S.Papastergiou, D.Pasini", A.Peacock,<br />
N. Peacock 7 , D. Pearson 12 , F. Pegoraro, F. Petree, M. Pick, S. Pitcher 7 , J. Plancoulaine, J-P. Poffe, F.Porcelli,R.Prentice,T.Raimondi,<br />
C.Raymond, P-H.Rebut, J.Removille, F. Rimini, D.Robinson 7 , A.Rolfe,<br />
R.Romain, R.T.Ross,L.Rossi, R.Rushton, P.Rutter, H.C.Sack,G.Sadler,G.Saibene, N.Salmon 12 ,<br />
H.Salzmann 13 , A.Santagiustina, R.Sartori, D.Schissel 24 , P.H.Schild, M.Schmid, G.Schmidt 6 ,<br />
R.L.Shaw, K.Schimizu 17 , A.Sibley, R.Simonini, J.Sips", P.Smeulders, J.Snipes, S.Scmmers,<br />
L.Sonnerup, K.Sonnenberg,G.Sonnozaro, W.Stacey 28 , M.Stamp, P.Stangeby 18 , D.F.Start, C. A.Steed,<br />
D.Stork, P.E.Stott, T.E. Stringer, D.Stubberfield, D.Summers, H.Summers", J.Tagle 2 ', H.Tamnen,<br />
A.Tanga, A.Taroni, C.Tebaldi 22 , A.Tesini, P.R.Thomas, E.Thompson, K.Thomsen, J.M.Todd,<br />
P.Trevalion, B. Tubbing, F.Tibone, E. Usselmann, A. Vannucci, H. van der Beken, M. von Hellermann,<br />
T.Wade, C.Walker, M.Walravens, K.Walter, Z.Wang 27 , D.Ward, M.L.Watkins, H.Weisen 10 ,<br />
J. Wesson, D.H. Wheeler, J. Wilks, U. Willen", D. Wilson, T. Winkel, S. Wolfe, D. Wong, C. Woodward,<br />
M.Wykes, I.D. Young, L.Zannelli, D.Zasche 13<br />
PERMANENT ADDRESS<br />
1. UKAEA, Harwell, Didcol, Oxon. UK. 16. Commissiariat a L'Energie Atomique. F-92260<br />
2. EUR-EB Association, LPP-ERM/KMS, B-1040 Brussels, Fontenay-aux-Roses, France.<br />
Belgium. 17. JAERI, Tokai Research Eslablishmenl, Tokai-Mura,<br />
3. Technical Research Centre of Finl<strong>and</strong>, Helsinki, Finl<strong>and</strong>. Naka-Gun, Japan.<br />
4. ENEA-CENTRO Di Frascali, 1-00044 Frascati. Roma, Italy. 18. Institute for Aerospace Studies, University of Toronio,<br />
5. Chalmers University of Technology, Go'teborg, Sweden. Downsview, Onlario, Canada.<br />
6. Princeton Plasma Physics Laboratory, New Jersey, USA. 19. University of Strathclyde, 107 Rottenrow, Glasgow, G4 ONG,<br />
7. UKAEA Culham Laboratory, Abingdon, Oxfordshire, UK. UK.<br />
8. Plasma Physics Laboratory, Space Research Institute, Sao 20! <strong>Nuclear</strong> Engineering Laboratory, Lapeenranta University,<br />
Jose dos Campos, Brazil. Finl<strong>and</strong>.<br />
9. Institute of Mathematics, University of Oxford, UK. 21. JN1CT, Lisboa, Portugal.<br />
10. CRPP/EPFL, 21 Avenue des Bains, CH-1007 Lausanne, 22. Department of Mathematics, Univerisly of Bologna, Italy.<br />
Switzerl<strong>and</strong>. 23. Oak Ridge National Laboratory, Oak Ridge, Tenn., USA.<br />
11. Swedish Energy Research Commission, S-10072 Stockholm, 24. G.A. Technologies, San Diego, California,'USA.<br />
Sweden. 25. University of Waikato, Hamilton, New Zeal<strong>and</strong>.<br />
12. Imperial College of Science <strong>and</strong> Technology, 26. IPP, Academia Sinica, P.R.China.<br />
University of London, UK. 27. Southwestern Institute of Physics, Leshan, Sechuan,<br />
13. Max Planck Inslitm fur Plasmaphysik, D-8046 Garching bei P.R.China.<br />
Munchen, FRG. 28. University of Georgia, Atlanta, USA.<br />
14. Institute for Plasma Research, G<strong>and</strong>hinagar Bhal Gujrat, 29. Centro de Investigaciones Energelicas Medioambientales y<br />
India. Techalogicas, Spain.<br />
15 FOM Instituut voor Plasmafysica, 3430 Be Nieuwegein. 30. University or Maryl<strong>and</strong>, College Park, Maryl<strong>and</strong>, USA.<br />
The Netherl<strong>and</strong>s. 31. University of Essex, Colchester, UK.<br />
JCR8S
<strong>IAEA</strong>-CN-50/A-I-3 65<br />
References<br />
[1 ] Bertolini, E, Huguet, M. et al. Proc. 12th Symposium on Fusion Engineering<br />
(Monterey, USA) 1987. (also JET Report P(87)52).<br />
[2] Gibson A. <strong>and</strong> the JET Team, EPS Conference on Controlled Fusion <strong>and</strong> Plasma<br />
Heating, (Dubrovnik, Yugoslavia, to be published in Plasma Physics <strong>and</strong> Controlled<br />
Fusion, 1988).<br />
[3] Rebut P-H. <strong>and</strong> the JET Team, <strong>Nuclear</strong> Fusion Supplement, Plasma Physics <strong>and</strong><br />
Controlled Fusion Research, Vol. 1, p.31, (Kyoto, Japan) 1987.<br />
[4] Start D F H. et al, Paper <strong>IAEA</strong>-CN-50/E-11-3, this conference.<br />
[5] Kupschus P. et al, 15th EPS Conference on Controlled Fusion <strong>and</strong> Plasma Heating,<br />
Europhysics Conference Abstracts 12B, 143.<br />
[6] Schmidt G. <strong>and</strong> the JET Team, Paper <strong>IAEA</strong>-CN-50/A-1V-1, this conference.<br />
[ 7 ] O' Rourke J. et al, 15th EPS Conference on Controlled Fusion <strong>and</strong> Plasma Heating,<br />
(Dubrovnik, Yugoslavia) 1987. Europhysics Conference Abstracts Vol 12B, Part<br />
l.p.155.<br />
[8] Pegoraro F. et al, Paper <strong>IAEA</strong>-CN-50/D-1V-6, this conference.<br />
[9] Keilhacker M. <strong>and</strong> the JET Team, Paper, <strong>IAEA</strong>-CN-50/A-III-2 this conference.<br />
[10] Hawryluk R. J. et al, <strong>Nuclear</strong> Fusion Supplement, Plasma Physics <strong>and</strong> Controlled<br />
Fusion Research, Vol 1, p51, (Kyoto, Japan) 1987.<br />
[11] HirshmanS.P. <strong>and</strong> SigmarD.J., <strong>Nuclear</strong> Fusion, 21, 1079 (1981).<br />
[12] Thomas P. et al., Paper <strong>IAEA</strong>-CN-50/A-IV-4.1, this conference.<br />
[13] Goldston R.J. Plasma Physics <strong>and</strong> Controlled Fusion, 26, 87 (1984).<br />
[ 14] Rebut P-H, Lallia P., Watkins M.L. Paper <strong>IAEA</strong>-CN-50/D-4-1.<br />
[ 15 ] Roberts K. V. Invited Paper, 9th EPS Conference on Plasma Physics <strong>and</strong> Controlled<br />
Fusion, Oxford, 1979.<br />
[16] Taroni A. et al, Paper <strong>IAEA</strong>-CN-50/A-VII-l, this conference.<br />
[17] Spears W. NET Report EUR-FU/X11-80/86/67 (1986).<br />
[18] Behringer K. et al, 15th EPS Conference on Controlled Fusion <strong>and</strong> Plasma Heating<br />
(Dubrovnik, Yugoslavia, (1988). Europlasma Conference Abstracts. Vol 12B. p.338.<br />
[ 19] Batistoni P. et al, 15th EPS Conference on Controlled Fusion <strong>and</strong> Plasma Heating<br />
(Dubrovnik, Yugoslavia, 1988). Europlasma Conference Abstracts, Vol 12B. p.135.<br />
[20] Challis CD. et al, submitted to <strong>Nuclear</strong> Fusion (1988).
RECENT PROGRESS IN JT-60 EXPERIMENTS<br />
JT-60 TEAM<br />
(Presented by H. Kishimoto)<br />
<strong>IAEA</strong>-CN-50/A-I-4<br />
H. AIKAWA, N. AKAOKA, H. AKASAKA, M. AKIBA, N. AKINO,<br />
T. ANDO, K. ANNOH, I. AOKI, T. AOYAGI, T. ARAI, K. ARAKAWA,<br />
M. ARAKI, M. AZUMI, S. CHIBA, M. DA1RAKU, N. EBISAWA,<br />
T. FUJII, T. FUKUDA, A. FUNAHASHI, H. FURUKAWA, H. GUNJI 1 ,<br />
K. HAMAMATSU, M. HANADA, M. HARA, K. HARAGUCHI,<br />
H. HIRATSUKA, T. HIRAYAMA, S. HIROKI, K. HIRUTA,<br />
M. HONDA, M. HONDA, H. HOREKE, R. HOSODA, N. HOSOGANE,<br />
K. IIDA, T. miMA, Y. IKEDA, Y. IKEDA, T. IMAI, T. INOUE,<br />
N. ISAJI, M. ISAKA, S. ISHIDA, K. ITAMI, N. ITIGE, T. ITO,<br />
T. KAKIZAKI, Y. KAMADA, A. KAMINAGA, T. KANEKO 1 , T. KATO,<br />
M. KAWAI, M. KAWABE, Y. KAWAMATA, Y. KAWANO,<br />
K. KAWASAKI, K. KIKUCHI, M. KIKUCHI, H. KIMURA, T. KIMURA,<br />
H. KISHIMOTO, S. KITAMURA, A. KITSUNEZAKI, K. KIYONO,<br />
N. KOBAYASHI, K. KODAMA, Y. KOIDE, T. KOIKE, M. KOMATA,<br />
I. KONDO, K. KONISHI 1 , S. KONOSHIMA, H. KUBO, S. KUNIEDA,<br />
K. KURIHARA, M. KURIYAMA, T. KUSHIMA, M. KUSAKA,<br />
Y. KUSAMA, Y. MABUTI, S. MAEHARA, K. MAENO, T. MATOBA,<br />
S. MATSUDA, M. MATSUKAWA, T. MATSUKAWA, M. MATSUOKA,<br />
Y. MATSUZAKI, Y. MIURA, N. MIYA, K. MIYACHI, Y. MIYO,<br />
M. MIZUNO, K. MOGAKI, M. MORI, S. MORIYAMA, M. MUTO,<br />
M. NAGAMI, K. NAGASE, A. NAGASHIMA, K. NAGASHIMA,<br />
T. NAGASHIMA, S. NAGAYA, O. NAITO, H. NAKAMURA,<br />
Y. NAKAMURA, M. NEMOTO, Y. NEYATANI, H. NINOMIYA,<br />
N. NISHINO, T. NISHITANI, H. NOBUSAKA, H. NOMOTO, K. OBARA,<br />
H. OBINATA 2 , K. ODAZIMA, Y. OGAWA, N. OGIWARA, T. OHGA,<br />
Y. OHARA, K. OHASA, H. OOHARA, T. OHSHIMA, M. OHKUBO,<br />
K. OHTA, M. OHTA, S. OHUCHI, Y. OHUCHI, A. OIKAWA,<br />
Y. OKUMURA, K. OMORI, S. OMORI, Y. OMORI, T. OZEKI,<br />
M. SAEGUSA, N. SAITOH, K. SAKAMOTO, A. SAKASAI, S. SAKATA,<br />
T. SASAJIMA, K. SATOU, M. SATOU, M. SATOU, M. SAWAHATA,<br />
T. SEBATA 1 , M. SEIMIYA, M. SEKI, S. SEKI, K. SHIBANUMA,<br />
R. SHIMADA, T. SHIMADA 1 , K. SHIMIZU, M. SHIMIZU,<br />
Y. SHIMOMURA, S. SHINOZAKI, H. SHIRAI, H. SHIRAKATA,<br />
M. SHITOMI, K. SUGANUMA, T. SUGAWARA, T. SUGIE,<br />
H. SUNAOSHI, K. SUZUKI, M. SUZUKI, N. SUZUKI, S. SUZUKI,<br />
Y. SUZUKI, H. TACHIBANA, M. TAKAHASHI, S. TAKAHASHI,<br />
T. TAKAHASHI, M. TAKASAKI, H. TAKATSU, H. TAKEUCHI,<br />
A. TAKESHITA, T. TAKIZUKA, S. TAMURA, S. TANAKA,<br />
67
68 JT-60 TEAM<br />
T. TANAKA, Y. TANAKA, K. TANI, M. TERAKADO, T. TERAKADO,<br />
K. TOBITA, T. TOKUTAKE, T. TOTSUKA, N. TOYOSHIMA,<br />
T. TSUGITA, S. TSUJI, Y. TSUKAHARA, M. TSUNEOKA,<br />
K. UEHARA, M. UMEHARA, Y. URAMOTO, H. USAMI,<br />
K. USHIGUSA, K. USUI, J. YAGYU, M. YAMAMOTO,<br />
O. YAMASHITA, T. YAMAZAKI, K. YOKOKURA, H. YOKOMIZO,<br />
K. YOKOYAMA, M. YOSHIKAWA, H. YOSHIDA, R. YOSHINO,<br />
Y. YOSHIOKA 1 , I. YONEKAWA, T. YONEDA, K. WATANABE,<br />
M.G. BELL 3 , R.J. BICKERTON 4 , W. ENGELHARDT 4 ,<br />
R.J. GOLDSTON 3 , E. KALLNE 4 , J. KALLNE 4 , H.W. KUGEL 3 ,<br />
P.L. MONDINO 4 , F.X. SOLDNER 5 , Y. TAKASE 6 , P.R. THOMAS 4 ,<br />
K.-L. WONG 3<br />
Naka Fusion Research Establishment,<br />
Japan Atomic Energy Research Institute,<br />
Naka-machi, Naka-gun, Ibaraki-ken,<br />
Japan<br />
Abstract<br />
RECENT PROGRESS IN JT-60 EXPERIMENTS.<br />
The paper describes recent progress in confinement, heating <strong>and</strong> current drive experiments on<br />
JT-60. The performance of JT-60 has been extended with replacement of the first wall by graphite tiles,<br />
addition of a new diveVtor coil, installation of a multiple pellet injector, enhancement of the power supply<br />
capability <strong>and</strong> high power, long pulse operation of neutral beam <strong>and</strong> radiofrequency heating systems<br />
up to 30 MW in combined power. The best parameter values achieved is the product ne(0)TET;(0) =<br />
6 x 10 19 m~ 3 -s-keV for a hydrogen limiter plasma at a plasma current of 3.2 MA. An offset linear<br />
relation for the energy confinement is confirmed for limiter, outside divertor <strong>and</strong> lower single-null<br />
divertor discharges. An improvement of energy confinement was observed in the lower single-null<br />
divertor experiments for high heating power. Efficient acceleration of high energy beam ions was<br />
achieved in combined neutral beam <strong>and</strong> radiofrequency heating of low density plasmas. Pellet fuelled<br />
high density plasmas could be heated effectively by a lower hybrid wave without occurrence of parametric<br />
instabilities. Plasma current drive up to 2 MA <strong>and</strong> ramp-up experiments by a lower hybrid wave<br />
were performed successfully. The current drive efficiency was optimized for plasma <strong>and</strong> wave<br />
parameters. A further enhancement programme for JT-60 is in progress.<br />
1 Seconded.<br />
2 Kyushu University, Fukuoka, Japan.<br />
3 Plasma Physics Laboratory, Princeton University, Princeton, NJ, USA.<br />
4 JET Joint Undertaking, Abingdon, Oxfordshire, United Kingdom.<br />
5 Max-Planck-Institut fur Plasmaphysik, Garching, Federal Republic of Germany.<br />
6 Massachusetts Institute of Technology, Cambridge, MA, USA.
1. INTRODUCTION<br />
<strong>IAEA</strong>-CN-50/A-I-4 69<br />
JT-60 [1] constitutes a focus of the Japanese fusion development programme.<br />
Its main objective is to investigate plasma confinement <strong>and</strong> heating in reactor-grade<br />
plasmas <strong>and</strong> to conduct an integrated test of associated fusion technologies. The original<br />
feature of JT-60 [2] is a long pulse tokamak device with a plasma of circular<br />
cross-section <strong>and</strong> a poloidal divertor placed radially outside. A new divertor coil has<br />
been installed recently to produce a non-circular cross-section divertor plasma with<br />
a single null at the bottom.<br />
The present paper concentrates on experiments <strong>and</strong> advances during the last two<br />
years with intense neutral beam (NBI) <strong>and</strong> radiofrequency (RF) wave injection.<br />
Major experimental issues are: (i) particle <strong>and</strong> impurity control by divertor <strong>and</strong> pellet<br />
injection; (ii) energy confinement study for limiter <strong>and</strong> divertor discharges;<br />
(iii) combined NBI <strong>and</strong> RF heating; <strong>and</strong> (iv) RF current drive. The RF system has<br />
a lower hybrid range of frequency (LHRF) <strong>and</strong> an ion cyclotron range of frequency<br />
(ICRF). The status of JT-60 is described in the next section. Experimental results <strong>and</strong><br />
future development are presented <strong>and</strong> discussed in later sections.<br />
2. STATUS OF THE DEVICE<br />
Machine conditions have progressively been improved during the operation<br />
phase <strong>and</strong> during the shutdown periods. Achieved parameters are compared with<br />
design values in Table I.<br />
TABLE I. MAIN PARAMETERS OF JT-60<br />
Parameter<br />
Plasma current<br />
Limiter<br />
Outside divertor<br />
Lower divertor<br />
Toroidal field<br />
(at R = 3 m)<br />
Heating power<br />
(into torus)<br />
NBI<br />
LHRF<br />
ICRF<br />
Wall material<br />
Pellet<br />
Design<br />
2.7 MA<br />
2.1 MA<br />
2.2 MA<br />
4.5 T<br />
20 MW<br />
15 MW<br />
5 MW<br />
TiC-Mo<br />
1.3 km-s" 1<br />
3.8 mm<br />
Achieved<br />
3.2 MA<br />
2.7 MA<br />
2.0 MA<br />
4.8 T<br />
25 MW<br />
11 MW<br />
3.1 MW<br />
TiC-Mo (before March 1987)<br />
Graphite (after June 1987)<br />
1.5 knvs" 1<br />
3.8 mm (diameter) x 3.8 mm (length)
Ip = 3.2 MA lp = 2.7 MA<br />
JT-60TEAM<br />
R = 3.0 m R = 3.1 m<br />
a = 0.91 m a =0.87 m<br />
(a) LIMITER Ib) OUTSIDE DIVERTOR<br />
FIG. 1. Magnetic field configurations ofJT-60.<br />
Divertor Coil<br />
Ip = 2.0 MA<br />
R = 3.1 m<br />
0.68x0.85m<br />
LOWER SINGLE-<br />
NULL DIVERTOR<br />
A toroidal magnetic field of 4.8 T has been generated, exceeding its design<br />
value of 4.5 T. The plasma current in limiter discharges has been increased to<br />
3.2 MA beyond the design value by enhancement of the poloidal field power<br />
supplies. Coil supports for a divertor coil <strong>and</strong> a quadrupole field coil have been<br />
strengthened in order to increase the plasma current in the outside divertor discharges<br />
from the design value of 2.1 MA to 2.7 MA. A new divertor coil was installed in<br />
early 1988 to obtain lower single-null divertor discharges. Three typical configurations,<br />
i.e. limiter, outside divertor (O-DFV) <strong>and</strong> lower single-null divertor (L-DIV),<br />
are shown in Fig. 1.<br />
All TiC coated Mo limiters <strong>and</strong> divertor plates were replaced by graphite tiles<br />
during the April <strong>and</strong> May shutdown period of 1987. The surface area of the graphite<br />
wall corresponds to half the vacuum vessel area. The residual is covered by the TiC<br />
coated Inconel liners. The vacuum vessel is usually operated with wall temperatures<br />
of 200-300°C in the present experiment.<br />
The operation of the NBI <strong>and</strong> the RF heating systems has been improved successively<br />
to increase the heating power <strong>and</strong> to extend the pulse length [3, 4]. The NBI<br />
system has been operated regularly with an injected power of about 20 MW at a<br />
hydrogen beam energy of 75 keV. The RF heating system consists of two schemes:<br />
three units of the LHRF system operated in a frequency range of 1.7-2.2 GHz <strong>and</strong><br />
one unit of the ICRF system in a frequency range of 110-130 MHz. The frequency<br />
of this ICRF system corresponds to the second harmonics of the hydrogen ion cyclotron<br />
frequency in a toroidal magnetic field of about 4.5 T.
<strong>IAEA</strong>-CN-50/A-I-4 71<br />
A pneumatic pellet injector was installed in early 1988. This injector produced<br />
three hydrogen pellets with a velocity of 1.5 km-s" 1 <strong>and</strong> with cylindrical sizes of<br />
2.7 mm (diameter) X 2.7 mm (length) to 3.8 mm (diameter) x 3.8 mm (length).<br />
3. DISCHARGE CONTROL AND OPERATIONAL REGIME<br />
Experiments on JT-60 have been conducted in different configurations: limiter<br />
<strong>and</strong> divertor with outside or lower single null. Various heating methods have been<br />
used, ranging from Ohmic heating alone to combinations of Ohmic, NBI, ICRF <strong>and</strong><br />
LHRF. Fuel has been supplied by gas puffing <strong>and</strong>/or pellet injection.<br />
Various techniques have been introduced into the discharge control for obtaining<br />
high density <strong>and</strong> high current (low q) plasmas as shown in Fig. 2. The LH current<br />
drive (f = 2 GHz, No = 1.7, PLH = 1.5 MW) was used in the current ramp-up<br />
phase to save the flux swing of the Ohmic power supply. Subsequently, a long pulse<br />
NBI was necessary to suppress a serious, m = 3/n = 1 locked mode [5]. This mode<br />
grew at qeff = 2.8-3.0 <strong>and</strong> a required NBI power of more than 13-15 MW for<br />
stabilization. After passing through the dangerous unstable zone of the locked mode,<br />
a density increase by additional gas puffing became possible with the aid of high<br />
power NBI. The plasma current <strong>and</strong> the line averaged electron density reached<br />
Ip = 3.2 MA (qeff = 2.2) <strong>and</strong> n^ = 1.0 x 10 20 nr 3 , respectively, in the flat-top<br />
phase. The NBI was required still in the current termination phase to prevent hard<br />
disruptions.<br />
The operation regime of JT-60 is shown in Fig. 3. In limiter discharges with<br />
graphite wall, a high density (n
72 JT-60TEAM<br />
E5695<br />
0 1 2 3 4 5 6 7 8 9 10<br />
TIME (s)<br />
FIG. 2. Typical profiles of high current <strong>and</strong> high density limiter discharge.<br />
0.51 i i . i , i . i i i<br />
•LIM<br />
°D!V [OUTSIDE)<br />
^DIVILOWERl<br />
*0IV( LOWER; PELLET!<br />
0 2 4 6<br />
neR/BT(xl0 l9 m 2 -r')<br />
FIG. 3. Hugill diagram ofJT-60 discharges.
<strong>IAEA</strong>-CN-50/A-I-4 73<br />
•L1M<br />
oDIV (OUTSIDE)<br />
*DIV( LOWER)<br />
*0IV( LOWER; PELLET)<br />
GRAPHITE WALL<br />
f iC/Mo<br />
(LIMITER)<br />
TIC/Mo (DIVERTOR)<br />
01 2 3 4 5 6 7 8 9 10 11 12<br />
n^ (xio 19 m" 3 )<br />
FIG. 4. Effective ion charge number Zeg versus line averaged electron density ne for various discharge<br />
conditions.<br />
It was found that the neutral hydrogen pressures in the divertor chamber, PD,<br />
<strong>and</strong> around the main plasma edge, PM, increased proportionally with n^ of the main<br />
plasmas. The compression ratio of the neutral hydrogens defined by PD/PM reached<br />
about 45 in the outside divertor discharges. A Zr-Al pumping system with a pumping<br />
speed of 6.8 m 3 • s~\ provided to the outside divertor chamber, was sufficient at high<br />
density (n 6 x 10 19 m" 3 ) to exhaust particles with a pumping rate of more than<br />
3 Pa-m 3 -s-' [6].<br />
Heat exhaust <strong>and</strong> energy control are other essential functions of the divertor.<br />
It was found that a major fraction of the absorbed power (80-90%) was exhausted<br />
towards the divertor chamber both in the outside <strong>and</strong> in the lower divertor<br />
discharges. Then, the plasma-wall interaction was really localized near the divertor<br />
plates.<br />
5. ENERGY CONFINEMENT<br />
Energy confinement of JT-60 plasmas [4, 7] has been studied in discharges with<br />
limiter, outside divertor <strong>and</strong> lower single-null divertor with NBI, RF <strong>and</strong> combined<br />
NBI <strong>and</strong> RF heating. The relation between the plasma stored energy W <strong>and</strong> the<br />
absorbed heating power Pabs is given in Fig. 5(a) for a variety of plasma currents Ip.<br />
The plasma stored energy was determined by diamagnetic <strong>and</strong> confirmed by kinetic<br />
measurements. The heating power in Fig. 5 was estimated from the combined Ohmic<br />
<strong>and</strong> NBI power. The values of W increase with Ip <strong>and</strong> reach 3.0 MJ at Ip = 3.2 MA<br />
with Pabs = 23 MW. These W-Pabs characteristics were slightly influenced by the
74 JT-60TEAM<br />
3 :<br />
LIH<br />
*3.1HA<br />
2.8HA<br />
A 2 HA<br />
• 1 HA<br />
DIV(OUTSIDE)<br />
MA<br />
1 HA<br />
OIV(LOHER)<br />
• 1 HA<br />
FIG. 5. (a) Plasma stored energy W versus absorbed heating power Pabs <strong>and</strong> (b) global energy confinement<br />
time T£ versus P^s.<br />
electron density including its radial profiles. No significant difference in the stored<br />
energy was observed among the different configurations (limiter, outside divertor <strong>and</strong><br />
lower single-null divertor) although the lower single-null discharges have a smaller<br />
plasma volume than the other configurations (by 40%).<br />
A simple offset linear relationship, W = Wo + if c Pabs, can be deduced from<br />
the experimental data. The offset value Wo is increased with Ip, while the incremental<br />
energy confinement time, rjf (=AW/APabs), is about 0.054 s; it is likely to be<br />
independent of Ip. The energy confinement time can be estimated from the equation<br />
rE = W/(Pabs - dW/dt). The relationship of TE with Pabs is shown in Fig. 5(b). The<br />
confinement time degrades with Pabs <strong>and</strong> is improved with Ip. The offset linear<br />
scaling of W yields the relationship TE = if 0 + W0/Pabs at dW/dt = 0. Further<br />
investigations are being carried out on confinement scaling including size effects.
2<br />
0<br />
1P-2MA<br />
W(MJ) /""<br />
25 PNB(MW) j<br />
0<br />
4<br />
0<br />
e<br />
0<br />
9<br />
0<br />
0.2b<br />
. . . . i . . J\ . . .<br />
ne (lO 19 m 3 )<br />
'H« MAIN {arb.)<br />
.H« 0lv (arb.)<br />
-<br />
n<br />
... .i.i,.<br />
H<br />
II<br />
II,.<br />
. . . . ' j , .<br />
II<br />
lij -' 'fr '<br />
. H-PHASE<br />
\<br />
<strong>IAEA</strong>-CN-50/A-I-4<br />
E5721<br />
. . . i . . . .<br />
D T N EDGE —~<br />
2 a<br />
K- :<br />
n<br />
0 o<br />
.,,,,,^r<br />
4.0 « 5.0 55 60 6.5 7.0<br />
TIME(S)<br />
(a) OUTSIDE DIVERTOR<br />
250S<br />
Jo 5<br />
4.0 4.5 5.0 5.5 6.0 65 7.0<br />
TIME(S)<br />
(b) LOWER SINGLE-NULL DIVERTOR<br />
FIG. 6. (a) H-mode phase of hydrogen discharges in outside divertor <strong>and</strong> (b) in lower single-null divertor,<br />
where P^d' N , P%$, H% A1N <strong>and</strong> if^ are the radiation losses <strong>and</strong> the Ha intensities from the main<br />
<strong>and</strong> divertor plasmas, respectively.<br />
6. IMPROVEMENT OF ENERGY CONFINEMENT<br />
Some experimental effort has been devoted to an improvement of the confinement<br />
by H-mode discharges in JT-60 [4]. An initial study has been conducted on the<br />
outside divertor configuration. A short H-mode discharge period was observed as is<br />
shown in Fig. 6(a) at Ip = 2 MA <strong>and</strong> He = 2 x 10 19 nr 3 with an NBI power of<br />
21 MW. Sharp rises of stored energy, electron density <strong>and</strong> soft X-ray signals are<br />
associated with a decrease in Ua line radiations from the main plasma edge <strong>and</strong><br />
from the divertor chamber. During the H-phase, the density profile broadens. These<br />
observations indicate an improvement of particle confinement. This H-mode phase<br />
could not be sustained longer than 50 to 100 ms so that energy confinement did not<br />
improve significantly in the outside divertor discharges.<br />
Lower single-null divertor discharges produced frequent edge localized modes<br />
(ELM) [5] near the main plasma edge <strong>and</strong> in the divertor region as is shown in<br />
Fig. 6(b). The plasma stored energy <strong>and</strong> the electron density increased during the<br />
ELM-free H-phase, which continued only 200 ms <strong>and</strong> again did not allow significant<br />
improvement of the energy confinement.<br />
A different type of discharge with improved confinement has been found in the<br />
lower single-null divertor [7]. The detailed behaviour of this discharge is shown in<br />
Fig. 7. The improved confinement started after 1.2 s of NBI <strong>and</strong> continued up to the<br />
end of NBI. The plasma stored energy <strong>and</strong> the electron density increased slowly<br />
while a sharp rise occurred in the Ha intensity <strong>and</strong> in the radiation power from the<br />
divertor plasma region. The radiation power from the main plasma decreased <strong>and</strong> the<br />
75
76 JT-60TEAM<br />
4.5 5.0 5.5 6.0 6.5 7.0 7.5<br />
TIME(S)<br />
• IMPROVED I—>• IMPROVED<br />
4.5 5.0 5.5 6.0 65 70 7.5<br />
TIME(s)<br />
FIG. 7. Development of improved confinement discharge (E6950) compared with L-mode divertor discharge<br />
(E6956).<br />
central electron temperature was sustained. These features of the improved confinement<br />
phase indicate enhanced particle recycling <strong>and</strong> strong radiation cooling of the<br />
divertor plasmas, causing a favourable reduction of the heat load on the divertor<br />
plates.<br />
Improved confinement was attained for high heating power exceeding 13 to<br />
15 MW as is shown in Fig. 8. The stored energy was increased by 20 to 30% in the<br />
improved confinement phase of the 1 MA discharges <strong>and</strong> by 15 to 20% in that of the<br />
1.5 MA discharges.<br />
Effective heating of pellet fuelled plasmas was obtained by NBI with a medium<br />
range of power around 10 MW, <strong>and</strong> the plasma stored energy was increased by 50%<br />
over that of gas puffing plasmas.<br />
7. RF HEATING AND COMBINED RF AND NBI HEATING<br />
RF heating with ICRF or LHRF has been performed for Ohmic heating (OH)<br />
<strong>and</strong> NBI heating plasmas. A 2 x 2 loop antenna array was used to optimize second<br />
harmonic heating in a frequency range of 120 to 130 MHz. The peak of the k| spectrum<br />
could be changed from zero to 10 m~ l with phasing from the (0,0) to the (TT,O)<br />
mode (designating the toroidal <strong>and</strong> poloidal phase differences). The RF heating rates
2.0<br />
1.5<br />
1.0<br />
0.5<br />
Ip<br />
IMA<br />
1.5MA<br />
<strong>IAEA</strong>-CN-50/A-I-4 77<br />
L-MODE<br />
•<br />
•<br />
1.5 HA<br />
IMPROVED<br />
0<br />
1 MA<br />
O<br />
_l i i |_<br />
10 15 20 25<br />
(MW)<br />
FIG. 8. Plasma stored energy versus absorbed heating power for improved confinement discharges in<br />
lower single-null divertor configuration.<br />
measured by the incremental energy confinement time, T| C (=yDWRF/APRF), are<br />
given in Fig. 9(a) [4, 8]. The ICRF heating of hydrogen OH plasmas in the (ir.O)<br />
mode was superior to that in the (0,0) mode. The heating rate for the (0,0) mode<br />
could be improved in helium plasmas with minority hydrogen ions (less than 10%)<br />
<strong>and</strong> also in pellet fuelled plasmas with a peaked density profile. The ICRF wave<br />
injected into NBI plasmas effectively accelerated the beam ions at the plasma centre,<br />
<strong>and</strong>, consequently, a high heating rate (T£° = 200 ms) was attained in the low density<br />
region of fie < 4 x 10 19 m" 3 as is indicated in Fig. 9(a).<br />
LHRF heating at f = 1.74 GHz has been performed for hydrogen OH plasmas<br />
produced with gas puffing or pellet injection [9]. This wave frequency was near the<br />
lower hybrid frequency (f « fLH) at n,. = 1 X 10 20 m" 3 <strong>and</strong> BT = 4.5 T. In the low<br />
density region with gas puffing, electron heating was dominant, <strong>and</strong> its heating rate<br />
measured by rj? 0 decreased rapidly with increasing n,,. The pellet fuelled plasmas<br />
with a peaked density profile were favourable for central ion heating by the present<br />
LH wave. It is shown in Fig. 9(b) that the heating rate of pellet fuelled plasmas<br />
increases with Re up to 1 X 10 20 m" 3 <strong>and</strong> reaches a level comparable to that of NBI<br />
plasmas at high density. Parametric instabilities were suppressed in the low density<br />
plasma surrounding the high density core.<br />
When LHRF with f = 2 GHz <strong>and</strong> NB = ±1.9 at the spectrum peak was<br />
applied to NBI plasmas [4], the wave energy was transferred mainly to the beam ions.<br />
The heating rate was above the level of the NBI heating alone at a low density of<br />
n
78 JT-60TEAM<br />
250 "(a)<br />
200<br />
150<br />
50<br />
n<br />
100<br />
I<br />
ICRF?<br />
+ '<br />
NBI 7<br />
1O<br />
O<br />
0<br />
*• /<br />
•<br />
/<br />
• • NBI<br />
ICRF ONLY<br />
i i i t<br />
ip = 1.5MA-LIMITER -<br />
PN8- IO~2OMVY<br />
PlC = 0.7 - 3.1 MW<br />
o : CRFC/t, 0) + NBI<br />
ICRFU, 0)<br />
• : ICRF(0, 0)<br />
• : ICRF(0.0)<br />
WITH PELLET<br />
A : ICRF(0, 0)<br />
FOR MINORITY H<br />
IN He PLASMA<br />
ONLY<br />
i . i<br />
0 1 2 3 4 5 6<br />
TTe (xio l9 m- 3 )<br />
(b)<br />
LHRF+NBI<br />
PHB = 20 MW<br />
6 MW,<br />
Ip (MA)<br />
1.5<br />
2.0<br />
1.T4GHZ LHRF ON IMA L-DIV PLASMA<br />
-<br />
0-0IV<br />
o<br />
•<br />
LIM<br />
•<br />
•<br />
0 1 2 3 4 5 6 7 8 9 10<br />
TTe (xio I9 rrr 3 )<br />
FIG. 9. Incremental energy confinement time T]J? C versus average electron density ne for<br />
(a) ICRF <strong>and</strong> (b) LHRF heating in the two cases of RF alone <strong>and</strong> combined RF <strong>and</strong> NBI heating.<br />
8. LOWER HYBRID CURRENT DRIVE<br />
The LH current drive experiments in JT-60 have been conducted with launchers<br />
with a phase difference of A = 90°; the N| spectrum has a broad or a narrow profile<br />
as is shown in Fig. 10. A plasma current of up to 2 MA was driven at<br />
Se = 3.2 X 10 18 m" 3 with an LH power of 3 MW. The current drive efficiency,<br />
r;CD(=iie(10 19 irr 3 )^ (MA) R(m)/PLH (MW)), reached 2.65 without NBI <strong>and</strong> 2.9<br />
with NBI in lower single-null divertor discharges as is shown in Fig. 10. The narrow<br />
spectrum peaked near N| = 1 could have a larger ?jCD than the broad spectrum in<br />
the low density region of n^ < 8 x 10 18 m" 3 . Low Zeff <strong>and</strong> high electron temperature<br />
plasmas yield high r;CD- A scaling ijCD oc /(5 + Zeff) was well confirmed,<br />
where
E<br />
01<br />
O<br />
•<br />
a<br />
lp<br />
[MA)<br />
1<br />
1<br />
1<br />
1<br />
li<br />
<strong>IAEA</strong>-CN-50/A-I-4 79<br />
LIM<br />
DIV<br />
DIV<br />
OIV<br />
mi<br />
DIV<br />
SP6CT<br />
-HUM<br />
B<br />
a<br />
N<br />
B<br />
B<br />
1 2<br />
P[_H (MW)<br />
J7G. 70. LH current drive characteristics.<br />
Current ramp-up by the LH wave [3] has been investigated in low density divertor<br />
discharges, <strong>and</strong> the plasma current was ramped up from 0.46 to 0.60 MA<br />
in 6.4 s at r^ = 0.3 X 10 19 m" 3 with an injected LH power of 1.6 MW. It is estimated<br />
for this discharge that about 5 % of the LH wave energy is transferred to the<br />
poloidal field energy of the driven current.<br />
Current profile modification is another important aspect of current drive [10].<br />
Improved confinement exceeding L-mode scaling has been observed for flattened<br />
current profiles induced by LH wave injection, when the change in the internal inductance<br />
reached A*- « -0.1.<br />
9. FUTURE PROGRAMME OF JT-60<br />
A major role to be played by JT-60 in the future is the improvement of the tokamak<br />
plasma performance so that the Japanese fusion programme can be advanced to<br />
reach the next step ignition device. The JT-60 upgrade programme [11] has started<br />
already; in this programme, the vacuum vessel <strong>and</strong> the poloidal field coil will be<br />
replaced completely in order to allow high current discharges with 6 MA in a divertor<br />
<strong>and</strong> with 7 MA in a limiter configuration.<br />
Deuterium beams will be injected into deuterium instead of hydrogen plasmas<br />
in the upgrade experiment. In conjunction with the change in the beam species, the<br />
beam power is expected to increase up to 40 MW at a beam energy of 120 keV. An<br />
RF heating system such as LHRF <strong>and</strong> ICRF will also be set up with some improvements<br />
in various devices.
80 JT-60 TEAM<br />
The further development of the non-inductive current drive scheme is another<br />
important issue of the JT-60 future programme, aiming at an exploration of steady<br />
state tokamak operation <strong>and</strong> profile control. An LH launcher with recent improvements<br />
for current drive will soon be installed. Studies are now under way to design<br />
a high density current drive system, including negative ion beam injectors <strong>and</strong> a new<br />
RF system (fast or LH wave).<br />
10. CONCLUSIONS<br />
During the past few years, substantial progress has been made in discharge control,<br />
confinement, heating <strong>and</strong> current drive experiments on JT-60. The main results<br />
are:<br />
(1) High current (Ip = 3.2 MA, qeff = 2.2) <strong>and</strong> high density (fie = 1.2 X 10 20 irr 3 )<br />
discharges have been obtained with the help of LH current ramp-up <strong>and</strong> NBI<br />
stabilization of MHD activity.<br />
(2) A maximum product of ne(0)TETi(0) = 6 x 10 19 m~ 3 -s-keV has been achieved<br />
in hydrogen discharges with high power NBI heating<br />
(PNB = 21 MW) of high density plasmas at high Ip.<br />
(3) Essential divertor functions have been demonstrated experimentally for impurity<br />
control <strong>and</strong> particle <strong>and</strong> heat exhaust during high power heating.<br />
(4) An offset linear confinement property has been confirmed for limiter, outside<br />
divertor <strong>and</strong> lower single-null divertor.<br />
(5) Lower single-null divertor discharges have demonstrated an improvement in<br />
confinement with high recycling of particles <strong>and</strong> strong radiation cooling in the<br />
divertor region.<br />
(6) Strong high energy beam ion acceleration <strong>and</strong> a high heating rate have been<br />
achieved in combined NBI <strong>and</strong> ICRF heating of low f^ plasmas.<br />
(7) Effective ion heating in the plasma core has been observed for LH wave injection<br />
into pellet fuelled high density plasmas of up to ii,, = 1 X 10 20 m~ 3 . The<br />
LH wave injected into NBI heated plasmas has preferentially been absorbed by<br />
beam ions.<br />
(8) An LH current drive of up to 2 MA has been realized with high efficiency, <strong>and</strong><br />
a simple relation for the current drive efficiency has been confirmed,<br />
i.e. T?CD OC /(5 + Zeff).<br />
ACKNOWLEDGEMENTS<br />
The authors wish to thank the members of JAERI who have contributed to the<br />
JT-60 project throughout its progress. The authors also wish to express their gratitude<br />
to Drs S. Mori <strong>and</strong> K. Tomabechi for continued support <strong>and</strong> encouragement.
<strong>IAEA</strong>-CN-50/A-I-4 81<br />
REFERENCES<br />
[1] YOSHIKAWA, M., et al., Nucl. Eng. Des. Fusion (Special Issue) 5 (1987).<br />
[2] YOSHIKAWA, M., et al., in Plasma Physics <strong>and</strong> Controlled <strong>Nuclear</strong> Fusion Research 1986<br />
(Proc. 11th Int. Conf. Kyoto, 1986), Vol. 1, <strong>IAEA</strong>, Vienna (1987) 11.<br />
[3] JT-60 TEAM, Plasma Phys. Contrail. Fusion 29 (1987) 1377.<br />
[4] JT-60 TEAM, in Controlled Fusion <strong>and</strong> Plasma Heating (Proc. 15th Eur. Conf. Dubrovnik,<br />
1988), Vol. 12B, European Physical Society (1988), to be published in Plasma Phys. Controll.<br />
Fusion.<br />
[5] NINOMIYA, H., et al., Paper <strong>IAEA</strong>-CN-50/A-II-3, these Proceedings, Vol. 1.<br />
[6] JT-60 TEAM, in Plasma-Surface Interactions in Controlled Fusion Devices (Proc. 8th Int. Conf.<br />
Julich, 1988), to be published.<br />
[7] TSUJI, S., et al., Paper <strong>IAEA</strong>-CN-50/A-V-1, these Proceedings, Vol. 1.<br />
[8] FUJn, T., et al., Paper <strong>IAEA</strong>-CN-50/E-II-4, these Proceedings, Vol. 1.<br />
[9] USHIGUSA, K., et al., Paper <strong>IAEA</strong>-CN-50/E-III-l, these Proceedings, Vol. 1.<br />
[10] JT-60 TEAM, in Plasma Physics <strong>and</strong> Controlled <strong>Nuclear</strong> Fusion Research 1986 (Proc. 1 lth Int.<br />
Conf. Kyoto, 1986), Vol. 1, <strong>IAEA</strong>, Vienna (1987) 563.<br />
[11] KIKUCHI, M., et al., in Symposium on Fusion Technology (Proc. 15th Symp. Utrecht, 1988),<br />
to be published.
STABILITY OF HIGH BETA DISCHARGES<br />
IN THE DIII-D TOKAMAK*<br />
<strong>IAEA</strong>-CN-50/A-II-l<br />
E.J. STRAIT, L.L. LAO, T.S. TAYLOR, M.S. CHU, J.K. LEE,<br />
A.D. TURNBULL, S.L. ALLEN 1 , N.H. BROOKS, K.H. BURRELL,<br />
R.W. CALLIS, T.N. CARLSTROM, M.S. CHANCE 2 ,<br />
A.P. COLLERAINE, D. CONTENT 3 , J.C. DeBOO, J. FERRON,<br />
J.M. GREENE, R.J. GROEBNER, W.W. HEIDBRINK 4 , F.J. HELTON,<br />
D.N. HILL 1 , R.-M. HONG, N. HOSOGANE 5 , W. HOWL, C.L. HSIEH,<br />
G.L. JACKSON, G.L. JAHNS, A.G. KELLMAN, J. KIM,<br />
S. KINOSHITA 6 , E.A. LAZARUS 7 , P.J. LOMAS 8 , J.L. LUXON,<br />
M.A. MAHDAVI, Y. NEYATANI 5 , T. OHKAWA, T.H. OSBORNE,<br />
D.O. OVERSKEI, T. OZEKI 5 , M. PERRY 3 , P.I. PETERSEN,<br />
T.W. PETRIE, J.C. PHILLIPS, G.D. PORTER 1 , D.P. SCHISSEL,<br />
J.T. SCOVILLE, R.P. SERAYDARIAN, M. SHIMADA 5 , T.C. SIMONEN,<br />
R.T. SNIDER, R.D. STAMBAUGH, R.D. STAV, H. St. JOHN,<br />
R.E. STOCKDALE, U. STROTH 9 , R. WOOD 1<br />
General Atomics,<br />
San Diego, California,<br />
United States of America<br />
Abstract<br />
STABILITY OF HIGH BETA DISCHARGES IN THE DUI-D TOKAMAK.<br />
An operational beta limit of (3 £ 3.5 I/aB has been encountered in neutral beam heated H-mode<br />
divertor discharges in DIII-D, scaling linearly with I/aB over a factor of 3 in I/aB <strong>and</strong> beta. Carefully<br />
prepared discharges have run stably very close to this limit, with |8 > 3 I/aB having been sustained for<br />
more than 1 s. The maximum beta in such discharges is limited by hard disruptions which are attributed<br />
to the ideal 2/1 kink mode. Before reaching this limit, most discharges experience a saturation or slow<br />
collapse of beta associated with low-n MHD instabilities which are consistent with stability calculations<br />
for resistive pressure-driven modes. As beta increases, MHD instabilities appear in part or all of a<br />
* This is a report of work sponsored by the US Department of Energy under Contract No.<br />
DE-AC03-84ER51044.<br />
' Permanent address: Lawrence Livermore National Laboratory, Livermore, CA, USA.<br />
2<br />
Permanent address: Plasma Physics Laboratory, Princeton University, Princeton, NJ, USA.<br />
3<br />
Permanent address: Johns Hopkins University, Baltimore, MD, USA.<br />
4<br />
Permanent address: University of California at Irvine, Irvine, CA, USA.<br />
5<br />
Permanent address: Japan Atomic Energy Research Institute, Japan.<br />
6<br />
Present address: Hitachi Ltd, Japan.<br />
7<br />
Permanent address: Oak Ridge National Laboratory, Oak Ridge, TN, USA.<br />
8<br />
Permanent address: JET Joint Undertaking, Abingdon, Oxfordshire, United Kingdom.<br />
9<br />
Permanent address: Max-Planck-Institut fur Plasmaphysik, Garching, Federal Republic of<br />
Germany.<br />
83
84 STRAIT et al.<br />
sequence having mode numbers m/n = 5/4, 4/3, 3/2, <strong>and</strong> 2/1. The n = 2 mode is associated with a<br />
moderate degradation of confinement, while the n = 1 mode causes a complete loss of plasma energy<br />
<strong>and</strong> disruption of the discharge. The observed beta limit is well below the maximum beta allowed by<br />
ideal high-n ballooning modes for optimized profiles, but the pressure gradient at the center <strong>and</strong> edge<br />
of the discharge is calculated to be near the marginally stable value, <strong>and</strong> ballooning modes may influence<br />
the pressure profile in these regions. The maximum beta reached to date, 6.8%, occurred in a discharge<br />
which was well away from both predicted <strong>and</strong> operational beta limits <strong>and</strong> ran stably with 0 > 6% for<br />
800 ms.<br />
1. INTRODUCTION<br />
Various pressure driven instabilities may limit the maximum<br />
achievable beta, the ratio of plasma pressure to confining magnetic field<br />
pressure, in a tokamak. Theoretically predicted limits due to ideal MHD<br />
instabilities can be approximated by the simple scaling law<br />
/? < CI/aB (1)<br />
where I is the plasma current, a the minor radius of the plasma, <strong>and</strong> B the<br />
toroidal magnetic field. Values of C range from 2.8%/(MA/m/T) for ideal<br />
n = 1 kink modes with no wall stabilization [1] to 4.4%/(MA/m/T) for<br />
ideal infinite-n ballooning modes [2], where n is the toroidal mode number.<br />
Results from several beam-heated tokamak experiments, including<br />
Doublet III, PDX, ASDEX, ISX-B, PBX, <strong>and</strong> TFTR, are in reasonably<br />
good agreement with this scaling law.<br />
Important questions for the next generation of tokamak experiments<br />
include the exact value of the coefficient C for divertor H—mode discharges,<br />
the mechanism responsible for the beta limit, <strong>and</strong> whether operation close<br />
to the beta limit is possible in steady state or only transiently. This<br />
paper describes the scaling of the operational beta limit in DIII-D <strong>and</strong><br />
the MHD activity encountered at that limit. The stability <strong>and</strong> duration of<br />
the highest beta discharges are discussed. Based on observations of beta<br />
limit phenomena <strong>and</strong> stability calculations, a mechanism for the beta limit<br />
is proposed.<br />
2. DIII-D PARAMETERS AND DIAGNOSTICS<br />
Equation (1) [with I/aB ~ eg -:1 (l + K 2 )-K/^O] implies that the most<br />
favorable discharges for maximizing beta are those with large vertical<br />
elongation «, large inverse aspect ratio e = a/R, <strong>and</strong> low safety factor q.<br />
The DIII-D tokamak [3] is well-suited for high beta experiments, having
<strong>IAEA</strong>-CN-50/A-II-l 85<br />
a typical plasma elongation of K — 2.0 <strong>and</strong> inverse aspect ratio e = 0.4,<br />
with the major <strong>and</strong> minor radii of the vacuum vessel aperture being 1.69<br />
<strong>and</strong> 0.67 m, respectively. Discharges stable over many energy confinement<br />
times have been operated with elongation « = 2.0 at g95 = 2.0 in a divertor<br />
configuration <strong>and</strong> qg5 = 2.1 in a limiter configuration. (Because q<br />
becomes formally infinite at the separatrix of a divertor plasma, we use the<br />
parameter 395, the safety factor at the flux surface enclosing 95% of the<br />
poloidal flux of the separatrix.) For the high beta experiments reported<br />
here, single null divertor discharges in deuterium were heated with up to<br />
12 MW of neutral beams from eight 80 kV ion sources, typically with six<br />
hydrogen beams <strong>and</strong> two deuterium beams or all eight hydrogen.<br />
Plasma energy (or beta) can be determined either from magnetic<br />
data or from kinetic profile data. The non-circular cross-section of DIII-D<br />
discharges permits the separation of beta <strong>and</strong> internal inductance i\ in<br />
equilibrium fits to external magnetic measurements, using the equilibrium<br />
code EFIT [4]. Electron temperature <strong>and</strong> density profiles are measured by<br />
Thomson scattering. Line-integrated density measured by four CO2 laser<br />
interferometer chords provides further density profile information <strong>and</strong> normalization<br />
of the Thomson scattering data. Ion temperature profiles are<br />
measured with a charge exchange recombination spectrometer viewing two<br />
of the heating beams. These measurements, <strong>and</strong> the calculated beam ion<br />
deposition profile, can be used in the MHD equilibrium code to obtain an<br />
equilibrium which is consistent with both magnetic <strong>and</strong> kinetic data [5,6].<br />
3. DISCHARGES AT HIGH (3 <strong>and</strong> HIGH fa<br />
3.1. Operational (3 Limit<br />
An operational beta limit at fa = /3/(I/aB) < 3.5%/(MA/m/T) has<br />
been encountered in neutral beam heated, single-null divertor,<br />
H-mode discharges in DIII-D (Fig. 1). The maximum achievable beta<br />
scales linearly with IN = I/aB over a factor of 3 in IN, corresponding<br />
to 9 > ^95 > 3. The same scaling of the beta limit was found in Doublet<br />
III [6], where a coefficient of 3.5 was found in both divertor <strong>and</strong> limiter<br />
discharges at minor radii of 0.39 to 0.44 m, <strong>and</strong> elongations of 1.0 to 1.6.<br />
The agreement of DIII-D <strong>and</strong> Doublet III results lends support to the<br />
minor radius scaling <strong>and</strong> lack of explicit elongation dependence in Eq. (1).<br />
As fa increases a discharge may evolve in one of three ways: stable<br />
operation, sudden disruption, or saturation of beta (sometimes followed<br />
by a slow but complete collapse of beta). When degradation of energy
86<br />
0.5 1 1.5 2 2.5<br />
l/aB (MA/m/T)<br />
STRAIT et al.<br />
-1.6<br />
0.9 1.7<br />
R(m)<br />
F/G. 7. fol fieta vermr I/aBfor all DIII-D beam heated divertor discharges. Also shown is the operational<br />
limit o//3 = 5.5 I/aB; (b) equilibrium flux plot (magnetic data) at (S = 6.8% (typical shape for<br />
most high beta discharges). Vertical line indicates the Thomson scattering chord.<br />
confinement at high /?N occurs, it is correlated with the presence of low-n<br />
MHD instabilities. The type of behavior, <strong>and</strong> the beta value at which<br />
it appears, can vary between otherwise identical discharges, suggesting a<br />
sensitive dependence on discharge conditions which are difficult to control.<br />
These three types of behavior are discussed below in Section 4.<br />
3.2. Maximum (3 Discharges (Stable)<br />
Beta > 6% has been obtained in discharges with IN ranging from<br />
1.7 to 2.5 MA/m/T. The highest beta discharges at IN > 2 are below the<br />
anticipated beta limit of (3 = 3.5 IN, as seen in Fig. 1, <strong>and</strong> they show no<br />
signs of beta-related loss of confinement.<br />
The maximum beta achieved to date [7] is 6.8%, in a discharge where<br />
/? > 6% was sustained for 0.8 seconds or about 18 energy confinement<br />
times (Fig. 2). This was a 0.9 MA deuterium H-mode divertor discharge<br />
at a toroidal field of 0.6 T, with q95 = 2.2, IN = 2.5, <strong>and</strong> elongation « = 2.<br />
In this discharge, the Thomson scattering laser was fired about 300 msec<br />
before the time of peak beta. At that time, there was very good agreement<br />
between beta values using magnetic data only <strong>and</strong> magnetic plus kinetic<br />
data, with f3 (magnetic) = 5.9% <strong>and</strong> /? (kinetic) = 6.2%. Careful stability<br />
analysis [8] of a similar discharge with kinetic data at 0 = 6.2% shows it to<br />
2.5
0.5-<br />
0-<br />
0.8-<br />
0.4-<br />
0.0-<br />
<strong>IAEA</strong>-CN-50/A-IM 87<br />
rTe 6.0%<br />
for 800 ms.<br />
be well below the stability limit for ideal kink modes <strong>and</strong> ideal infinite-n<br />
ballooning modes, as expected. The disruption during the rampdown of<br />
plasma current <strong>and</strong> heating power is unrelated to beta. Similar discharges<br />
in the same series, which reached comparable beta values for a shorter time<br />
<strong>and</strong> consequently had a more gentle rampdown, did not disrupt.<br />
Values of beta high enough to test the beta limit scaling at q95 < 3<br />
have not been obtained because of a failure of energy confinement to scale<br />
proportionately to plasma current at values of qgs below 3. This effect<br />
depends on q but not on beta <strong>and</strong> thus is not related to the MHD limits<br />
on total beta. It may be related to the interaction between the large<br />
ELM's <strong>and</strong> large sawteeth which develop at low values of qss [9].<br />
4. STABILITY AT THE (3 LIMIT<br />
Detailed stability analysis of the operational beta limit has concentrated<br />
on a set of discharges with IN = 1.7 MA/m/T, 995 = 3.1 <strong>and</strong><br />
/? < 6.0%, for which good kinetic pressure profile data are available. Based<br />
on the stability calculations which are discussed below, we can identify the<br />
instabilities responsible for various aspects of the observed beta limit.<br />
4.1. Stable Operation Near the /3 Limit<br />
Under the proper conditions, it is possible for a discharge to run<br />
stably very close to the operational limit. For example, in one discharge<br />
-1<br />
0.6
88 STRAIT et al.<br />
9 12.0<br />
10.0 -<br />
8.0-<br />
6.0-<br />
o. 4.0-<br />
2.0-<br />
0.0<br />
predicted limit<br />
/?N=3.5, after ELM<br />
K=3X before ELM<br />
0N=2-O. after ELM<br />
/?N=1.3, L mode<br />
ballooning limit<br />
measured profiles \<br />
0 0_2_ 0.4 0.6 0.8 1<br />
v VN (equiv. to radius)<br />
FIG. 3. Ballooning mode stability: measured pressure gradient profiles are compared to the calculated<br />
marginally stable profile for the discharge with highest fiN. Radial co-ordinate is ~/Pn, where Vn is<br />
the normalized flux surface volume.<br />
where /3N > 3 was sustained for more than 1 second <strong>and</strong> reached a maximum<br />
of 3.45 during that time, the only observed MHD activity related to<br />
high beta operation was a few small-amplitude bursts of oscillations with<br />
toroidal mode numbers n = 3 <strong>and</strong> 4 (discussed further in Section 4.2).<br />
At the maximum /?N in this discharge, the pressure gradient p' has<br />
reached marginal stability for ideal high-n ballooning modes over the inner<br />
half of the minor radius, as calculated with MBC [10] <strong>and</strong> shown in Fig. 3.<br />
The plasma edge is also near marginal stability for ballooning modes; this<br />
is related to the ELM (Edge Localized Mode) instability [9,11] <strong>and</strong> is<br />
not unique to discharges with high volume-averaged beta. However, the<br />
value of /?N == 3.5 is well below the maximum ballooning-stable /3N of 4.7,<br />
obtained by setting pt equal to the marginally stable value everywhere.<br />
High-n ballooning modes near the center of the discharge would not<br />
be detectable by magnetic or soft X-ray diagnostics due to their short<br />
wavelength. If present they could cause enhanced transport resulting in<br />
saturation of the pressure gradient pt at the marginally stable value. The<br />
resultant profile broadening could be consistent with the observed decrease<br />
in internal inductance as beta increases.<br />
However, if high-n ballooning modes are present, they have no effect<br />
on the total energy confinement time. In this discharge <strong>and</strong> others, in the
<strong>IAEA</strong>-CN-50/A-IM 89<br />
absence of the low-n MHD modes associated with the beta saturation <strong>and</strong><br />
collapse phenomena (to be discussed below), there is little or no change<br />
in the incremental confinement time dW/dP during the H-mode phase as<br />
/?N increases from 1.5 to 3.5.<br />
4.2. /3 Saturation <strong>and</strong> Collapse<br />
The most common type of behavior near the beta limit is a saturation<br />
or slow collapse of beta associated with a sequence of MHD<br />
modes of low toroidal mode number n, where n decreases as beta <strong>and</strong><br />
time increase [12]. As beta increases above about half the limiting value<br />
(/?N W 1>8) bursts of MHD oscillations with low toroidal mode numbers<br />
(n = 3 to 5) appear. These have typical amplitudes at the outboard vessel<br />
wall of Bg/Bg < 0.1%, <strong>and</strong> there is no detectable effect on energy<br />
confinement. As beta increases further (/?N * 2.4 or greater) the n = 3<br />
mode may become nearly continuous, with a small decrease in energy<br />
confinement. More commonly, a larger burst of n = 3 oscillation leads<br />
to the onset of an n = 2 mode. A typical saturated amplitude for this<br />
mode is Bg/Be > 0.5%, <strong>and</strong> a 20%—40% decrease in energy confinement<br />
is observed. In some cases, the n = 2 mode is then followed by a slowly<br />
growing n = 1 mode. Most of the plasma energy is lost on a time scale<br />
of ~100 msec as the mode amplitude grows to Bg/Bg > 1%. A plasma<br />
current disruption then terminates the discharge.<br />
A typical beta collapse discharge having most of these features is<br />
shown in Fig. 4. At first beta rises as the heating power increases, with<br />
the transition to H-mode occurring at t = 1870 msec. The beta collapse<br />
begins at t = 2550 msec, with a large burst of n = 3 apparently acting<br />
as the trigger. As the plasma energy decreases the mode rotation velocity<br />
slows, reaching zero at t = 2640 msec. Charge exchange recombination<br />
measurements in similar discharges also show the plasma rotation stopping<br />
at about the same time. At this time the presence of a nonrotating<br />
("locked") n = 1 mode becomes detectable with external saddle loops.<br />
Magnetic <strong>and</strong> soft X—ray measurements indicate that the primary<br />
mode numbers for these instabilities are m/n = 5/4, 4/3, 3/2, <strong>and</strong> 2/1.<br />
Soft X-ray <strong>and</strong> Thomson scattering measurements indicate that during<br />
this sequence of modes the disturbance propagates outward in minor radius.<br />
The different toroidal mode numbers observed during this sequence<br />
evidently represent different instabilities, since the amplitudes develop<br />
differently in time <strong>and</strong> the frequencies are not in general harmonically<br />
related. These instabilities are clearly related to beta, since similar discharges<br />
with lower beta run quite stably, <strong>and</strong> coherent oscillations with<br />
n > 2 are only seen at large values of /?N-
90 STRAIT et al.<br />
central soft x-ray<br />
emission (a.u.)<br />
1400 1800 2200 2600<br />
TIME (ms)<br />
Be AMPLITUDE SPECTRUM (SHOT 55771)<br />
n-3 BURST<br />
PRECEDES<br />
GROWTH OF<br />
n-2 MODE<br />
10 20 30 40<br />
FREQUENCY {kHz)<br />
FIG. 4. (a) Time traces for a typical beta collapse associated with low-n MHD activity (discharge<br />
55771). B = 0.9 T, I = 1.0 MA, q9S = 3.1, 0 < 5.3%; (b) time-dependent amplitude spectra of %<br />
from a Mirnov loop at the outer wall midplane.<br />
3000
s.o<br />
• .5<br />
(a)<br />
<strong>IAEA</strong>-CN-50/A-II-l 91<br />
360<br />
0 60 120 180 2*0 300 360<br />
POLOIDAL ANGLE (DEGREES)<br />
FIG. 5. Resistive mode calculation for n = 1 beta collapse (55791): (a) calculated perturbation of<br />
poloidal magnetic flux; (b) phase <strong>and</strong> amplitude of Mirnov oscillations versus poloidal angle, comparing<br />
measured (•) <strong>and</strong> calculated (o) values.<br />
The low-n modes which cause beta saturation <strong>and</strong> collapse cannot<br />
be attributed to ideal modes. Their growth rates are slow (typically<br />
r ~ 10 4 TAifven) <strong>and</strong> they can persist unchanged for times approaching the<br />
resistive time of the plasma. Ideal stability calculations using GATO [13]<br />
(discussed further below) show that the point where the n = 4, 3, <strong>and</strong> 2<br />
modes are first observed is usually far from the kink mode stability limit.<br />
These low-n modes are most consistent with pressure driven resistive<br />
instabilities. The three-dimensional resistive code CART—II [14] was used<br />
to analyze a discharge similar to that of Fig. 4, at a time during the large<br />
n = 1 oscillation. The nonlinear calculation predicts a predominantly<br />
?n = 2/n = 1 instability, as shown in Fig. 5. The predicted mode structure<br />
agrees well with soft X-ray <strong>and</strong> magnetic fluctuation measurements,<br />
including the coupling to higher poloidal mode numbers which dominates<br />
the structure along the inboard wall. The nonlinear calculation was halted<br />
when the calculated value of Bg/Be at the outer wall was 1%, equal to<br />
the measured value at the time when the n = 1 mode in the discharge of<br />
Fig. 4 stopped rotating <strong>and</strong> the rate of energy loss accelerated. At this<br />
point, the width of the 2/1 isl<strong>and</strong> was calculated to be 11 cm <strong>and</strong> flux<br />
surfaces outside of the q = 2 surface had started to become stochastic.
92 STRAIT et al.<br />
The observed cascade of modes toward larger q = mfn <strong>and</strong> smaller<br />
n suggests that each mode destabilizes the next. This process may begin<br />
with undetected high-ra ballooning modes near the center of the discharge.<br />
Then as each mode appears it contributes to enhanced transport in the<br />
central region, which causes the pressure gradient <strong>and</strong> current density gradient<br />
to steepen outside of that region <strong>and</strong> thus destabilizes the next mode<br />
at larger minor radius. Evidence for this process includes, the observed<br />
gradual decrease of internal inductance £{ as beta increases, <strong>and</strong> the larger<br />
decreases of £+ which occur at the onset of large n = 3 <strong>and</strong> n = 2 modes.<br />
It may also be possible to explain the decreasing sequence of toroidal<br />
mode numbers directly from resistive stability calculations. At low beta<br />
the linear growth rates calculated by CART—II increase with the toroidal<br />
mode number. However, as /?N increases to the experimental limit of<br />
3.5, the growth rates for higher mode numbers begin to decrease (an<br />
effect similar to the "second stability" of high-n ballooning modes). Finite<br />
Larmor radius stabilization also affects the higher number modes more<br />
strongly. The addition of a simple model for this effect [15] causes the<br />
toroidal mode number with the largest calculated linear growth rate to<br />
decrease to 3, 2, <strong>and</strong> then 1 as /?N increases to 3.5.<br />
4.3. High (3 Disruptions<br />
A few discharges avoid the beta saturation <strong>and</strong> collapse described<br />
above <strong>and</strong> reach slightly higher beta. Here the maximum beta seems<br />
to be limited by sudden disruptions. In these discharges, a nonrotating<br />
n = 1 mode appears within 50 microseconds after a sawtooth fall. This<br />
mode is evidently distinct from the rotating sawtooth precursor, as one or<br />
two cycles of the rotating mode can be seen after the nonrotating mode<br />
appears. A two-dimensional array (toroidal <strong>and</strong> poloidal) of soft X-ray<br />
detectors shows a dominantly m = 2 poloidal structure for the nonrotating<br />
mode. A rapid loss of plasma energy occurs in the presence of this mode,<br />
beginning at the edge of the plasma <strong>and</strong> becoming complete within 1 to<br />
2 msec.<br />
These sudden disruptions which occur in some discharges with high<br />
/?N may be caused by an ideal kink mode. The 2/J mode which precedes<br />
the disruption grows in a much shorter time (r < 10 2 TAifven) than the<br />
2/1 mode associated with the beta collapse, closer to an ideal mode time<br />
scale. Ideal kink mode stability was calculated using GATO for a set<br />
of discharges with (fa increasing to 3.5. Toroidal mode numbers n = 2,<br />
3, <strong>and</strong> 4 were calculated to be stable in all cases. The equilibrium with<br />
the highest fa was predicted to be stable to the 2/1 kink mode with a
<strong>IAEA</strong>-CN-50/A-II-l 93<br />
stability limits:<br />
swall at r = 1.5 a<br />
(disruption)<br />
0.7 0.8 0.9 1.0 1.1 1.2<br />
/. (internal inductance)<br />
v<br />
FIG. 6. Predicted ideal kink mode stability versus /3W <strong>and</strong> (it compared to experimental data points.<br />
Also shown is the trajectory of a high beta disruption discharge (60383).<br />
conducting wall at a radius of 1.5 times the plasma's minor radius, but<br />
unstable without the wall. Although the resistive vacuum vessel should<br />
act as a conducting wall at the typical mode rotation frequency of a few<br />
kHz, the stability calculations may be consistent with the fact that the<br />
2/1 mode which precedes the disruption does not rotate. A model was<br />
invoked for disruptions at the Doublet III beta limit [16] in which central<br />
ballooning modes caused profile broadening, after which the additional<br />
broadening due to a sawtooth fall triggered a 2/1 tearing or kink mode.<br />
A similar mechanism may trigger the high beta disruptions in Dili—D.<br />
In order to investigate the role of the current profile, stability calculations<br />
were made for a two-parameter family of profiles which allowed<br />
variation of beta <strong>and</strong> £i while go (safety factor on axis), boundary shape,<br />
<strong>and</strong> total plasma current were kept fixed. The results are compared in<br />
Fig. 6 to experimental data from equilibrium fits using magnetic data<br />
only. The profiles for the stability calculations were consistent with these<br />
equilibria. As £i decreases the maximum stable beta is predicted to increase,<br />
until at low ti either a current driven stability limit is encountered<br />
or an equilibrium cannot be found with this profile parameterization. In<br />
experimental discharges, the internal inductance ii decreases as beta increases,<br />
but the decrease is not rapid enough to avoid the kink instability.<br />
In this plot the observed beta limit at /3N = 3.5 is above the calculated<br />
limit without wall stabilization, <strong>and</strong> seems to agree well with the limit for<br />
a conducting wall at 1.5 a. When more realistic profiles consistent with<br />
kinetic pressure profile measurements are used, the predicted limit with<br />
the wall at 1.5 a becomes somewhat larger.
94 STRAIT et al.<br />
5. CONCLUSIONS<br />
An operational beta limit of/? < 3.5 I/aB has been reached in singlenull<br />
H—mode divertor discharges in Dili—D. This limit was found over<br />
a factor of 3 in I/aB, for ggs between 9 <strong>and</strong> 3 <strong>and</strong> beta up to 6.0%.<br />
The maximum beta reached to date is 6.8% in a discharge with I/aB =<br />
2.5 MA/m/T <strong>and</strong> qa5 = 2.2. This discharge was well below anticipated<br />
stability limits <strong>and</strong> ran stably at high beta for 0.8 sec.<br />
The maximum beta achieved in the experiment is limited by the<br />
ideal 2/1 kink mode, which causes a sudden disruption of the discharge.<br />
Most discharges do not reach this limit, but experience a saturation or<br />
slow collapse of beta, caused by a cascade of pressure driven resistive<br />
modes evolving from n = 3—5 ton = 1. The maximum beta allowed by<br />
high-n ballooning modes for optimized profiles is never reached, but these<br />
instabilities may constrain the pressure profile near the center <strong>and</strong> the<br />
edge of the discharge, <strong>and</strong> thus influence the discharge's stability to low-n<br />
modes.<br />
Stable operation is possible quite close to the beta limit, with /?N ><br />
3.0%/(MA/m/T) having been sustained for over 1 second. The fact that<br />
this has been done at all suggests that with some form of profile control<br />
such as rf heating it may be possible to obtain such discharges more reproducibly.<br />
The slow growth rate of the n = 3 <strong>and</strong> n = 2 modes associated<br />
with beta saturation <strong>and</strong> collapse might allow the use of feedback control<br />
to suppress these modes.<br />
REFERENCES<br />
[1] TROYON, R., GRUBER, R., SAURENMANN, H., SEMENZATO,<br />
S., SUCCI, S., Plasma Physics <strong>and</strong> Controlled Fusion 26 (1984) 209.<br />
[2] SYKES, A., TURNER, M.F., PATEL, S., in Controlled Fusion <strong>and</strong><br />
Plasma Physics (Proc. 11th European Conf., Aachen, 1983), Europhysics<br />
Conference Abstracts, Vol. 7D, Part II, 363.<br />
[3] LUXON, J., etal., in Plasma Physics <strong>and</strong> Controlled <strong>Nuclear</strong> Fusion<br />
Research (Proc. 11th Int. Conf., Kyoto, 1986), Vol. I, <strong>IAEA</strong>, Vienna<br />
(1987) 159.<br />
[4] LAO, L.L., St. JOHN, H., STAMBAUGH, R.D., KELLMAN, A.G.,<br />
PFEIFFER, W., <strong>Nuclear</strong> Fusion 25 (1985) 1611.<br />
[5] LAO, L.L., St. JOHN, H., GROEBNER, R.J., HOWL, W., TAY-<br />
LOR, T.S., in Proc. 12th Conf. on the Numerical Simulation of<br />
Plasmas, San Francisco, 1987.
<strong>IAEA</strong>-CN-50/A-II-l 95<br />
[6] STAMBAUGH, R.D., MOORE, R.W., BERNARD, L.C., KELL-<br />
MAN, A.G., STRAIT, E.J., etal., in Plasma Physics <strong>and</strong> Controlled<br />
<strong>Nuclear</strong> Fusion Research (Proc. 10th Int. Conf., London, 1984),<br />
Vol. I, <strong>IAEA</strong>, Vienna (1985) 217.<br />
[7] STAMBAUGH, R.D., ALLEN, S., BRAMSON, G., BROOKS, N.,<br />
BURRELL, K.H., etal., in Plasma Physics <strong>and</strong> Controlled Fusion<br />
(Proc. 15th European Conf., Dubrovnik, 1988), to be published.<br />
[8] TAYLOR, T.S., STRAIT, E.J., LAO, L.L., KELLMAN, A.G., OS-<br />
BORNE, T.H., etal., General Atomics Report GA-A19134, submitted<br />
to Phys. Rev. Letters.<br />
[9] BURRELL, K.H., ALLEN, S.L., BRAMSON, G., BROOKS, N.H.,<br />
etal., This conference; <strong>IAEA</strong>-CN-50/A-III-4.<br />
[10] MOORE, R.W., General Atomics Report GA-A16243 (1981).<br />
[11] LAO, L.L., STRAIT, E.J., TAYLOR, T.S., CHU, M.S., OZEKI, T.,<br />
etal., General Atomics Report GA-A19247, submitted to Plasma<br />
Physics <strong>and</strong> Controlled Fusion; Gohil, P., etal., General Atomics<br />
Report GA-A19035, submitted to Phys. Rev. Letters.<br />
[12] STRAIT, E.J., LAO, L.L., KELLMAN, A.G., OSBORNE, T.H.,<br />
SNIDER, R., etal., General Atomics Report GA-A19214, submitted<br />
to Phys. Rev. Letters.<br />
[13] BERNARD, L.C., HELTON, F.J., MOORE, R.W., Comput. Phys.<br />
Comm. 24 (1981) 377.<br />
[14] LEE, J.K., <strong>Nuclear</strong> Fusion 26 (1986) 955.<br />
[15] HASEGAWA, A., WAKATANI, M., Phys. Fluids 26 (1983) 2770.<br />
[16] CHU, M.S., GREENE, J.M., KIM, J.S., LAO, L.L., SNIDER, R.T.,<br />
etal., <strong>Nuclear</strong> Fusion 28 (1988) 399.
<strong>IAEA</strong>-CN-50/A-II-2<br />
INITIAL RESULTS OF THE PBX-M EXPERIMENT*<br />
M. OKABAYASHI, N. ASAKURA, R. BELL, S. BERNABEI, K. BOL,<br />
R.A. ELLIS, Jr., R.J. FONCK, G. GAMMEL, A. HOLLAND, R. KAITA,<br />
S. KAYE, H.W. KUGEL, B. LeBLANC, A. MacAULAY, M. ONO,<br />
S. PAUL, E. POWELL, S. PREISCHE, M. REUSCH, S. SESNIC,<br />
H. TAKAHASHI<br />
Plasma Physics Laboratory,<br />
Princeton University,<br />
Princeton, New Jersey,<br />
United States of America<br />
Abstract<br />
INITIAL RESULTS OF THE PBX-M EXPERIMENT.<br />
The Modified Princeton Beta Experiment (PBX-M) is designed to provide access to the second<br />
stability regime by utilizing the stabilizing properties of operation with minimum B <strong>and</strong> strong indentation.<br />
The distinctive features of PBX-M as compared to its predecessor device, PBX, are the ability to<br />
operate at higher indentations (up to 30%) <strong>and</strong> the presence of conducting passive stabilizer plates almost<br />
completely surrounding the plasma surface. The purpose of the plates is to stabilize ideal n = 1 surface<br />
modes which are believed to be partially responsible for the first regime /3-limit. In addition, PBX-M<br />
can operate in a closed divertor mode, thus allowing for H-mode operation with enhanced confinement<br />
properties that will aid in the goal of second stability. Plasmas with indentations of up to 25 % have been<br />
successfully formed during the initial period of operation. Furthermore, disruption-free operation could<br />
be carried out to c^ values down to 2.0 even with indentations > 15%. Distinctive observed MHD<br />
phenomena included long period sawteeth in Ohmic <strong>and</strong> NBI plasmas without strong current ramps, <strong>and</strong><br />
a lower power threshold for transition into the H-mode. These preliminary results suggest some beneficial<br />
effects of operation with higher indentation <strong>and</strong> passive stabilizers.<br />
I) Introduction<br />
Recent successes [1,2] in confinement <strong>and</strong> reactivity in approaching the<br />
ignition regime have stimulated a re-examination of the magnetic properties of<br />
toroidal confinement devices in order to optimize the tokamak concept from the<br />
viewpoint of a commercial reactor. This examination has focussed on utilizing<br />
the stability properties of magnetic shear <strong>and</strong> a magnetic well in order to<br />
operate in the second regime of stability at economically attractive values of p.<br />
MHD stabilization <strong>and</strong> the attainment of second stability can be approached by<br />
strongly shaping the plasma <strong>and</strong> by modifying the current, pressure, <strong>and</strong><br />
density profiles as well as by raising q(0). The bean-shaped configuration in<br />
* The PBX-M project is supported by US Department of Energy Contract No.<br />
DE-AC02-76-CHO-3073.<br />
97
98 OKABAYASHI et al.<br />
PBX-M maximally utilizes the advantage of strong bean shaping. Current<br />
profile control during the initial period of operation is confined to that produced<br />
by strong current ramps, which were used to lengthen the sawtooth period <strong>and</strong><br />
achieve high-p in PBX [3]. The second phase of the experiment will include 2<br />
MW of Lower Hybrid Current Drive (4.65 GHz), 4 MW of Ion Bernstein<br />
Wave Heating (40 MHz), <strong>and</strong> pellet injection for current <strong>and</strong> pressure profile<br />
modification, respectively. To aid the attainment of second stability, PBX-M<br />
is equipped with close fitting conducting plates almost entirely surrounding the<br />
plasma in order to stabilize the n = 1 ideal surface modes believed to be<br />
responsible in part for the first regime limit. In addition, the presence of upper<br />
<strong>and</strong> lower divertor chambers will allow for closed divertor H-mode operation<br />
with resulting broader pressure profiles <strong>and</strong> enhanced confinement which will<br />
also help achieve second stability.<br />
In addition to exhibiting enhanced stability to MHD modes, plasmas<br />
approaching <strong>and</strong> in the second stability regime should benefit from the<br />
suppression of microinstabilities. Calculations have shown that as p increases<br />
<strong>and</strong> second stability is approached, the growth rate of various drift wave<br />
instabilities, such as the trapped electron or Tji-modes which are believed to be<br />
a significant cause of anomalous energy loss, decreases towards zero [4]. In<br />
addition, the broader pressure profiles associated with second stability lend<br />
themselves towards enhanced stability to these modes by effectively moving<br />
the destabilizing pressure gradients out of the confinement region of the plasma<br />
towards the edge. Recent calculations [5] have even shown that shear, such as<br />
that resulting from separatrix operation, can help stabilize these modes further<br />
at the edge of the plasma. The combination of these effects indicate effective<br />
suppression of these modes as second stability is approached.<br />
II) PBX-M Device<br />
The predecessor PBX demonstrated successful operation with plasmas in<br />
the bean shaped configuration [3]. However, the PBX device had several<br />
shortcomings, among them 1) the lack of flexibility in the shaping field pattern<br />
produced, 2) the slow response of the poloidal field power supplies, 3) the<br />
short distance between the stagnation point to the vessel wall in separatrix<br />
plasmas, <strong>and</strong> 4) open divertor operation. Additionally, the low-q, high-P<br />
disruptions in PBX were related to n = 1 surface kink modes, <strong>and</strong> it appeared<br />
that p-values beyond the Troyon limit could not be achieved without<br />
stabilization of these modes. Theoretical analysis indicated that these ideal<br />
modes could be stabilized by close fitting passive stabilizer plates on the outer<br />
major radius side of the plasma.
<strong>IAEA</strong>-CN-50/A-II-2 99<br />
In PBX-M, 90% of the plasma surface is surrounded by five pairs of<br />
passive stabilizing plates, which effectively form a close fitting conducting<br />
shell around the entire poloidal cross-section with the exception of a 40 cm gap<br />
on the outer midplane. Two pairs of plates located to the outboard side (i.e.,<br />
the larger major radius side) provide suppression of the n = 1 mode, with the<br />
outermost pair connected at ten toroidal locations to allow the induced n = 1<br />
currents to flow from plate to plate. This induced current is monitored by<br />
Rogowski coils on the ten connection leads. The remaining three sets of plates<br />
on the inboard major radius side are for suppression of the n = 0 vertical<br />
instability. These plates are connected in a saddle coil arrangement <strong>and</strong>,<br />
therefore, do not carry any net toroidal current. In addition to the installation<br />
of these passive plates, the modification included installation of upper <strong>and</strong><br />
lower divertor chambers. Shifting the plasma major radius to 165 cm allows<br />
for closed divertor operation. Finally, four pairs of trimming coils, an<br />
additional pair of divertor coils, <strong>and</strong> five additional independently programmed<br />
power supplies were added to enable fine scale adjustments of the plasma<br />
shape.<br />
We report here initial observations of plasma behavior in this modified<br />
device. The operation in this first phase of the program has concentrated on<br />
plasma production <strong>and</strong> control of this highly shaped plasma with this closefitting<br />
conducting shell, <strong>and</strong> initial evaluation of the effects of this shell on<br />
plasma behavior. All the results reported here pertain to discharges with ohmic<br />
<strong>and</strong> moderate neutral injection heating (Pjnj < 2.5 MW, D° -> H + ), <strong>and</strong><br />
usually moderate indentations of about 15% <strong>and</strong> elongations of 1.6 to 2.0.<br />
The formation of bean shaped plasmas in PBX-M is similar to that in<br />
PBX. The discharge is initiated with a circular plasma, but is then quickly<br />
deformed into a Dee shape in order to carry larger current. Current from the<br />
pusher coil then acts to indent the plasma <strong>and</strong> also serves to increase the<br />
plasma current due to a large mutual coupling. The equilibrium flux plot of a<br />
particularly well indented PBX-M plasma is shown in Fig. 1. The plasma<br />
parameters for this plasma were Ip = 550 kA, Bt = 1.2 T, indentation = 25%,<br />
tlmhd = 3-7, ne = 5 x lO 1 ^ cm'3 <strong>and</strong> a plasma current ramp rate of 0.5MA/sec.<br />
This level of indentation already exceeds the levels attained in PBX, where the<br />
maximum values were usually < 20%.<br />
Levels of internal shaping of the plasma flux surfaces which are<br />
significantly higher than that achieved in PBX are indicated by observations of<br />
the internal plasma shape via a tangentially viewing soft X-ray pinhole camera.<br />
For example, Fig.2 shows the poloidal emissivity distribution for a mildly<br />
indented discharge with i ~ 15% <strong>and</strong> K ~ 1.8 on the outer flux surfaces. Since<br />
the X-rays are emitted from the hotter plasma core region, the shape appears<br />
more Dee shaped than bean shaped, which is more characteristic of only the<br />
outer flux surfaces when there is no current ramp in the discharge.
100<br />
1 .0<br />
.6<br />
.0<br />
-.2<br />
-.4<br />
-.6<br />
1.11<br />
CO CO<br />
OKABAYASHI et al.<br />
[iux coniouns<br />
X (UCIRtS)<br />
FIG. 1. Magnetic equilibrium flux surfaces for a highly indented PBX-M plasma.<br />
Ill) MHD: Sawtooth Characteristics<br />
In the PBX experiment, it was found that a significant fraction of the<br />
plasma energy could be lost at the time of a sawtooth crash; it was thus<br />
essential to avoid sawteeth, or increase the period between crashes, in order to<br />
reach high |3. The highest P shots in PBX were obtained with these long<br />
sawteeth modes, with periods of 100 to 140 msec, which were produced with<br />
current profiles broadened by fast plasma current ramp rates of 1.0-<br />
1.5MA/sec. This initial documentation period of PBX-M plasmas focussed on<br />
detailing the operating conditions that modified the sawtooth characteristics.<br />
There are several distinctive differences between PBX-M <strong>and</strong> PBX ohmic<br />
sawteeth. Firstly, the sawtooth period in PBX-M is correlated with indentation<br />
<strong>and</strong> density. As shown in the Fig.3, the sawtoothperiod was initially two to<br />
four msec, but reached a maximum of 40 msec at the highest indentation <strong>and</strong><br />
B
<strong>IAEA</strong>-CN-50/A-II-2 101<br />
FIG. 2. Soft X-ray emission contours showing the internal flux surface shape for a moderately indented<br />
discharge.<br />
density. The period decreased as the indentation <strong>and</strong> density decreased. In<br />
another discharge, the sawtooth period became shorter as the density<br />
decreased, although the indentation was kept constant (15%). Periods of 40<br />
msec were never achieved in PBX ohmic plasmas; the only difference between<br />
the two operating scenarios was the lower indentation in PBX. These results<br />
indicate that conditions of both higher density <strong>and</strong> indentation need to be<br />
satisfied in order to lengthen the sawtooth period. The sharp spikes in the soft<br />
X-ray signal at the sawtooth crash in Fig. 3 indicate that some electrons were<br />
accelerated to higher energies during the long sawtooth <strong>and</strong> were lost at the<br />
time of the crash.<br />
Secondly, very few precursor oscillations appeared in PBX-M except<br />
before the first sawtooth event which expelled the impurities that accumulated<br />
during the discharge initiation. Precursors were, however, observed in PBX.<br />
Another distinction of PBX-M was the frequent appearance of a sawtooth<br />
successor oscillation with a maximum perturbation near the inversion radius;<br />
these oscillations were not observed on PBX. The m = 1/n = 1, one to two<br />
kHz successor oscillation set in immediately after a sawtooth crash, <strong>and</strong> it<br />
moved slightly outward during the four to six msec that it was observed. The<br />
outer midplane Mirnov probes sometimes showed a simultaneous n = 1, 6 kHz<br />
oscillation. This faster magnetic oscillation was not initiated by the crash,<br />
although its amplitude increased for the time period immediately after the crash.<br />
Since both MHD modes were n = 1 <strong>and</strong> existed simultaneously, it is<br />
impossible to interpret them as a consequence of rigid toroidal rotation. Either<br />
the rotation profile was sheared so that there were higher rotation velocities at
102<br />
0.5<br />
OKABAYASHI et al.<br />
Indentation (%)<br />
t \ H t<br />
4 6 10 16 9<br />
200 300 400 500 600 700<br />
TIME (ms)<br />
FIG. 3. Central chord soft X-ray intensity (IJ, plasma current (Ip) <strong>and</strong> line averaged density for a<br />
long sawtooth mode discharge.<br />
the edge than the center, or one or both of the modes were not tied to the<br />
plasma rotation.<br />
In contrast to the sawteeth in ohmic discharges, those in neutral beam<br />
heated discharges in PBX-M often exhibited an m = 1/n = 1 precursor. The<br />
successor oscillation was observed often, <strong>and</strong> its frequency was higher than<br />
that in ohmic discharges. The sawtooth period in PBX-M NBI plasmas was<br />
also greater than corresponding ones in PBX. Even without strong current<br />
ramps, sawtooth periods of up to 90 msec were achieved, values that could be<br />
attained only with current ramps of 1.0 to 1.5 MA/sec on PBX. The difference<br />
between the two devices, again, were higher indentations <strong>and</strong> the close fitting<br />
passive plates in PBX-M.<br />
The sawtooth precursor <strong>and</strong> successor oscillations showed a strong<br />
dependence on poloidal position, as seen by a poloidal array of Mirnov coils.<br />
The precursor activity to both the sawtooth <strong>and</strong> the disruption was strongly<br />
dependent on the poloidal position. Mirnov coils on the outboard side showed<br />
the few kHz precursor oscillation with little successor activity, while those on<br />
the inboard side, especially near the midplane, showed little precursor activity<br />
but strong, 40-60 kHz, broadb<strong>and</strong> successor activity.<br />
In PBX-M, the sawtooth period with NBI varies depending upon the<br />
condition, <strong>and</strong> is monitored with the usual diagnostics plus Rogowski coils to<br />
measure the induced current on the passive stabilizers. Figure 4 shows an<br />
example of the sawtooth behavior reflected in the currents measured in two<br />
passive plates separated by 180° toroidally. The amplitude <strong>and</strong> time behavior<br />
were similar, but the phase difference between the two signals of 180°<br />
indicates an n = 1 helical current pattern. The measured current corresponds to
<strong>IAEA</strong>-CN-50/A-II-2 103<br />
444 446<br />
TIME (ms)<br />
448 450<br />
FIG. 4. Central soft X-ray intensity, Mirnov signal, <strong>and</strong> currents induced in the outermost passive<br />
plates at two toroidal locations separated by 180°.<br />
the line current density of Jpoloidal = 250A/m in the outer horizontal plane. If it<br />
is assumed that the induced current direction inside the passive stabilizer is<br />
tilted, since the perturbed current follows along the image of the field line due<br />
to the long wavelength perturbation, the total current density is given by Jtotai<br />
= Jpoloidal x I B 1/ B poloidal- The current density of Jpoloidal = 250A/m can<br />
produce the 12 to 15 G of total poloidal field using |B |/BpoIoidai = 4-5 at the<br />
outer major radius side, which is comparable to the perturbed poloidal B field<br />
measured by Mirnov coils located on the surface of the passive stabilizer. It is<br />
thus reasonable to assume that the onset of sawtooth crash is being modified<br />
by the effect of the passive stabilization.<br />
IV) Disruptions<br />
The ability to operate PBX-M at low-q is markedly different from that of<br />
PBX. In the predecessor device, the discharges almost always disrupted if<br />
Qmhd decreased to values less than 3.3, <strong>and</strong> there were relatively few<br />
discharges that survived to q values less than 2.8. Figure 5 shows the<br />
distribution of PBX-M discharge q values. Values of qmhd from over 300<br />
discharges, both ohmic <strong>and</strong> neutral beam heated with indentations from 5 to<br />
=20%, were used to construct this graph. As is clear from the graph, there<br />
was little problem in operating plasmas at q values less than 3. In fact, a<br />
significant number of plasmas at q < 3 survived without disruption (about 20%<br />
of these non-disruptive shots were neutral beam heated). The ease of access to<br />
this low-q regime in these strongly shaped plasmas may indicate the beneficial<br />
effect of operating with the close fitting shell.
104 OKABAYASHI et al.<br />
40<br />
30<br />
I I I I I I T I<br />
Disruptive<br />
tw-»-l Non-Disruptive<br />
1.8 2.2 2.6 3.0 3.4 3.8 4.2 4.6 5.0 5.4 5.8<br />
q mhd<br />
FIG. 5. Distribution of accessible qmM in PBX-M for plasmas with indentations <strong>and</strong> a flux difference measurement<br />
indicating n = 0 vertical motion. In this example a low frequency (2 to 3 kHz)<br />
n = 1 oscillation was seen to grow at 525 msec. The oscillation was seen on<br />
the soft X-rays, Mirnov, <strong>and</strong> passive plates. The Ha trace shows an increase,<br />
indicating enhanced interaction with the wall during the time of the n = 1 mode.<br />
The mode appeared to begin to lock near 530 msec, <strong>and</strong> then grew, resulting in<br />
another n = 1 helical perturbation, as seen on the plate currents, <strong>and</strong> a rapid<br />
decrease in the central SXR emissivity <strong>and</strong> a further increase in the plasma/wall<br />
interaction. Some fluctuations were seen on the plasma current trace, although<br />
the current did not start to decrease until about one to two msec later, when the
0.5-<br />
0<br />
1.0<br />
1<br />
<strong>IAEA</strong>-CN-50/A-H-2 105<br />
ii 1<br />
I A.<br />
i<br />
—
106 OKABAYASHI et al.<br />
§1<br />
•a J<br />
i§ "1<br />
1 |<br />
•It<br />
I*
<strong>IAEA</strong>-CN-50/A-H-2 107<br />
lowermost inboard passive plates. In these early experiments, usually the open<br />
divertor geometry has been used with neutral beam heating.<br />
In general, clear transitions to the H-mode are observed in PBX-M<br />
discharges which have the separatrix either inside or very near the surface of<br />
the limiters on the passive stabilizers. These are confirmed by a sudden drop<br />
in the Ha emission in both the divertor <strong>and</strong> main plasma regions, a<br />
simultaneous rise in the electron density, <strong>and</strong> a sudden sharpening of the edge<br />
plasma in visible television pictures of the discharge. For example, Fig. 7<br />
shows the waveforms from several diagnostics for a beam heated discharge<br />
exhibiting the H-mode transition in PBX-M. At t =475msec, the characteristic<br />
drop in Ha occurs, <strong>and</strong> persists for some 90 msec until the injected power is<br />
lowered. At the same time, rapid increases in the line averaged density <strong>and</strong><br />
central chord intensities of both the visible bremsstrahlung <strong>and</strong> soft X-ray<br />
signals. The transition often occurs about 2 msec after a sawtooth crash, but a<br />
sawtooth crash is not necessary to trigger an H-mode transition. With<br />
indentations of 15% <strong>and</strong> the plasma limited mainly by the magnetic separatrix,<br />
the threshold absorbed power for transition to the H-mode is as low as<br />
1.1MW, considerably below the approximately 2MW threshold required in the<br />
predecessor PBX device.<br />
The confinement properties of these H-mode plasmas are similar to those<br />
observed in PBX with an open divertor geometry. That is, the improvement in<br />
the particle confinement is always evident while the improvement in the energy<br />
confinement is often marginal. This is presumably due to both the facts that^to<br />
date, these discharges have been formed with only the open divertor<br />
configuration <strong>and</strong> that the working gas was H+ with DO beam species. For<br />
several discharges with Pjn: ranging from 1.1 to 2.5 MW, the total energy<br />
confinement time averages about 1.2 times the typical L-Mode values given by<br />
Kaye-Goldston scaling. With further control over the separatrix location,<br />
operation in the closed divertor geometry, <strong>and</strong> DO->D + injection, it is<br />
reasonable to expect improvement in this enhancement factor to the 1.5-2.0<br />
range. At these powers levels, there was no indication of impurity<br />
accumulation in the plasma core during the H-phase, unlike the experience with<br />
PBX, where H-mode plasmas typically exhibited strong accumulation of both<br />
low-Z <strong>and</strong> high-Z impurities.<br />
Changes in the MHD activity across the H-mode transition were observed<br />
by the poloidal <strong>and</strong> toroidal Mirnov coil arrays. An increase in broad-b<strong>and</strong><br />
activity (30-200kHz) is observed across the transition on the plasma midplane,<br />
while this activity decreased in the region of the X-point, as seen in Fig. 8. Of<br />
particular interest is the virtual absence of the edge relaxation perturbations<br />
which give rise to the Ha spikes often observed in H-mode discharges.<br />
Whether the absence of these edge modes reflects a stabilizing influence of the<br />
nearby conducting wall or is a reflection of the moderate quality of these H-
108 OKABAYASHI et al.<br />
-2<br />
1 • • • • • • • • • • '<br />
Time (ms)<br />
FIG. 8. Raw signals from two Mirnov coils showing the change in broadb<strong>and</strong> activity across the<br />
H-mode transition. The top trace is from a Mimov coil on an upper passive plate near the x-point, <strong>and</strong><br />
the lower trace is from a coil situated in the midplane.<br />
mode plasmas must be investigated as the injected power is increased in the<br />
near future.<br />
VI) Summary <strong>and</strong> Conclusions<br />
Even these early results from PBX-M at low- <strong>and</strong> moderate-p have<br />
produced tantalizing suggestions of the effects of the close fitting passive<br />
plates. The overall MHD properties in PBX-M plasmas appear to be improved<br />
from those in PBX in that operation in the present device routinely extends to<br />
such lower q-values at moderate indentations (15%) without strong current<br />
ramps. Other indications of this are the long period sawteeth, seen in PBX-M<br />
without current ramps, while the long period sawteeth seen in PBX could be<br />
produced only with strong current ramps. Additionally, the power threshold to<br />
the H-mode has been reduced by about a factor of two going from PBX to<br />
PBX-M. While currents induced on the passive plates by n = 1 magnetic<br />
perturbations are indeed comparable in strength to those seen by the nearby<br />
Mimov coils, these fluctuations are nevertheless still seen in the plasma core on
<strong>IAEA</strong>-CN-50/A-II-2 109<br />
the soft X-rays. It is reasonable to believe, however, that the modes seen in<br />
the plasma during this time are modified from those that would have been<br />
observed in the absence of the plates. Some of the disruption characteristics,<br />
such as the slow growth <strong>and</strong> locking of low frequency modes just prior to the<br />
disruption, appear to be resistive in nature, <strong>and</strong> the separation between the<br />
passive plates <strong>and</strong> the plasma edge must be reduced closer to the design value<br />
of a few cm in order to suppress these "resistive" instabilities.<br />
While the MHD activity at low P has not yet been fully explored <strong>and</strong><br />
controlled, these early results suggest positive benefits of the new geometry to<br />
attain <strong>and</strong> study very high-(3 tokamak plasmas.<br />
After optimization of plasma parameters with large current ramping <strong>and</strong><br />
strong shaping, the future addition of RF techniques shold allow the fine scale<br />
control of the plasma pressure <strong>and</strong> current profiles to optimize access to the<br />
second stability regime.<br />
ACKNOWLEDGEMENT<br />
The authors are pleased to acknowledge discussions with N. Suzuki.<br />
REFERENCES<br />
[1] GREENWALD, M., et ah, Phys. Rev. Lett. 53 (1984) 352.<br />
[2] STRACHAN, J., Phys. Rev. Lett 58 (1987) 1004.<br />
[3] BOL, K., et al., Phys. Rev. Lett. 57 (1986) 1891.<br />
[4] REWOLDT, G., TANG, W.M., HASTIE, R.J., Phys. Fluids 30 (1987) 807.<br />
[5] REWOLDT, G., Princeton Univ., personal communications, 1988.
MHD ACTIVITIES AND RELATED IMPURITY<br />
BEHAVIOUR IN JT-60 DISCHARGES<br />
<strong>IAEA</strong>-CN-50/A-II-3<br />
H. NINOMIYA, R. YOSHINO, M. AKIBA, T. ANDO, K. ANNOH,<br />
T. AOYAGI, K. ARAKAWA, M. AZUMI, T. FUJII, T. FUKUDA,<br />
A. FUNAHASHI, K. HAMAMATSU, T. HIRAYAMA, M. HONDA,<br />
H. HORIIKE, N. HOSOGANE, T. IIJIMA, Y. IKEDA, T. IMAI,<br />
S. ISHIDA, K. ITAMI, T. ITO, Y. KAMADA, Y. KAWANO,<br />
M. KIKUCHI, H. KIMURA, T. KIMURA, H. KISHIMOTO, Y. KOIDE,<br />
T. KOIKE, I. KONDO, S. KONOSHIMA, H. KUBO, S. KUNIEDA,<br />
K. KURIHARA, M. KURIYAMA, Y. KUSAMA, S. MAEHARA,<br />
K. MAENO, T. MATOBA, S. MATSUDA, M. MATSUKAWA,<br />
T. MATSUKAWA, M. MATSUOKA, Y. MATSUZAKI, N. MIYA,<br />
K. MIYACHI, M. MIZUNO, M. NAGAMI, A. NAGASHIMA,<br />
K. NAGASHIMA, T. NAGASHIMA, O. NAITO, H. NAKAMURA,<br />
M. NEMOTO, Y. NEYATANI, N. NISHINO, T. NISHITANI,<br />
K. ODAJIMA, N. OGIWARA, T. OHGA, M. OHTA, K. OMORI,<br />
S. OMORI, T. OZEKI, M. SAIGUSA, K. SAKAMOTO, A. SAKASAI,<br />
M. SATO, M. SEIMIYA, M. SEKI, S. SEKI, K. SHIMIZU, M. SHIMIZU,<br />
Y. SHIMOMURA, H. SHIRAI, H. SHIRAKATA, T. SUGIE,<br />
S. TAKAHASHI, H. TAKATSU, H. TAKEUCHI, S. TAMURA,<br />
Y. TANAKA, K. TANI, K. TOBITA, N. TOYOSHIMA, S. TSUJI,<br />
M. TSUNEOKA, K. UEHARA, K. USHIGUSA, I. YONEKAWA,<br />
H. YOSHIDA<br />
Naka Fusion Research Establishment,<br />
Japan Atomic Energy Research Institute,<br />
Naka-machi, Naka-gun, Ibaraki-ken,<br />
Japan<br />
Abstract<br />
MHD ACTIVITIES AND RELATED IMPURITY BEHAVIOUR IN JT-60 DISCHARGES.<br />
An m = 3 non-rotating mode has been observed at safety factors slightly below three during the<br />
current ramp-up phase. The maximum plasma current of the OH plasma is restricted to approximately<br />
2.4-2.45 MA by disruptions, which are preceded by this locked mode. The locked mode is stabilized<br />
by high power NB heating; a maximum plasma current of 3.2 MA has been attained routinely. The<br />
characteristics of this locked mode suggest that it is kink-like. A periodic m = 1 burst mode similar<br />
to a fishbone has been observed. The mode frequency depends on the plasma rotation frequency; it is<br />
shown that this result is consistent with the theoretical prediction. Magnetic oscillations with narrow<br />
b<strong>and</strong>width at a frequency higher than 10 kHz are excited by NB injection into divertor discharges. A<br />
c<strong>and</strong>idate for an instability due to this excitation is discussed. Frequent edge localized modes (ELMs)<br />
have been observed in lower X-point discharges, <strong>and</strong> it is found that frequent ELMs occur in the regime<br />
of (3p/qcff a 0.25.<br />
Ill
112 NINOMIYA et al.<br />
1. INTRODUCTION<br />
Auxiliary heating experiments have been performed on JT-6O in limiter, outer<br />
X-point <strong>and</strong> lower X-point configurations. This paper discusses the following four<br />
characteristics of MHD activities <strong>and</strong> related impurity behaviour in these discharges:<br />
(1) a non-rotating, large m = 3 mode during the current ramp-up phase in Ohmic<br />
discharges <strong>and</strong> its stabilization by NBI for obtaining low-q <strong>and</strong> high-Ip discharges;<br />
(2) a periodic m = 1 burst mode; (3) high frequency magnetic oscillations with<br />
narrow b<strong>and</strong>width in NB heated divertor plasmas, <strong>and</strong> (4) frequent edge localized<br />
modes (ELMs) in lower X-point discharges.<br />
2. LOCKED MODE<br />
To maximize the plasma parameters <strong>and</strong> the fusion product ne7ETi, confinement<br />
was improved by increasing the plasma current on JT-60 in 1987 [1]. In these<br />
experiments, a non-rotating m = 3/n = 1 mode has been observed to grow abruptly<br />
after the safety factor at the surface, q^, has crossed the value of 3 during the<br />
current ramp-up phase of high-Ip <strong>and</strong> low-q discharges (Ip > 2.4 MA <strong>and</strong> q^ :£ 3).<br />
The amplitude of the mode reaches 6Be/B0 = 0.5 — 1.0% in discharges without<br />
NBI, <strong>and</strong> plasmas are terminated by a major disruption, which limits the maximum<br />
plasma current to less than about 2.45 MA (q^ a; 2.8) in OH discharges. This<br />
locked mode is stabilized by NB heating [2], <strong>and</strong> stable discharges of<br />
Ip = 2.6-3.2 MA <strong>and</strong> q^ = 2.2-2.7 are obtained.<br />
The characteristics of the locked mode during the current ramp-up phase in<br />
JT-60 are summarized as follows [2]:<br />
(1) The mode occurs most frequently at q^ = 2.82-2.96 in OH <strong>and</strong> NB heated<br />
limiter discharges. Here, the error in the q^ value is less than +0.05.<br />
(2) In both OH discharges <strong>and</strong> NB heated discharges, this mode grows abruptly.<br />
No Mirnov oscillation or no slowing down of Mirnov oscillation is observed<br />
just before the onset of the mode.<br />
(3) The amplitude tends to increase with the rate of plasma ramp-up.<br />
These features of the locked mode suggest that the mode is a kink mode driven by<br />
the pedestal current profile formed by the fast current ramp-up. A rough estimate of<br />
the internal inductance 4 is 1.0 to 1.1 at the onset of the locked mode. The m = 3<br />
kink mode is usually stable for the regime of ^ ^ 1.0 in plasmas with normal<br />
current profile, but linear stability analysis shows that the kink mode is unstable even<br />
for ^ 2 1.0 if the current profile has some pedestal. Figure 1 shows the stable<br />
region of the m = 3 kink mode, where 5 indicates the fraction of the pedestal current<br />
profile. The unstable regime increases with 5. Moreover, a non-linear simulation of
0.5<br />
<strong>IAEA</strong>-CN-50/A-H-3 113<br />
FIG. 1. Stability regime of m = 3 kink mode with pedestal current profile.<br />
the kink mode in the cylindrical geometry by using the reduced set of MHD equations<br />
shows that the mode grows in the same azimuthal phase as the externally applied<br />
m = 3 resonant error field, when the amplitude of the error field becomes large<br />
(Kg. 2).<br />
3. PERIODIC m = 1 BURST MODE<br />
NB power up to 20 MW is injected by eight co- <strong>and</strong> six counter-injection units<br />
with nearly perpendicular angle (approximately 78° to the magnetic axis). A periodic<br />
m = 1 burst mode similar to the 'fishbone' has been observed in NB heated divertor<br />
discharges with low /3p value (/Jp S 0.5 <strong>and</strong> j8t S 0.3%). This m = 1 mode has<br />
also been observed by a combination of low ICRF <strong>and</strong> NB heating power. The effect<br />
of the plasma rotation on the periodic m = 1 burst mode has been examined because<br />
the toroidal precession frequency (fpre) <strong>and</strong> the toroidal rotation frequency (frot) of<br />
the co-injection case in JT-60 are of the same order. Figure 3 shows the relation<br />
between the observed mode frequency (fm = {) normalized by the toroidal precession<br />
frequency <strong>and</strong> the net co-injection input power normalized by plasma density. fm = [<br />
has almost the same value as fpre in the case of balance injection, but becomes<br />
approximately twice fpre in the case of co-injection. Doppler shift measurement<br />
shows that frot cases A <strong>and</strong> B in Fig. 3 is about 1 <strong>and</strong> 3 kHz, respectively. On the<br />
other h<strong>and</strong>, fpre is about 2.8 kHz <strong>and</strong> fm = i of cases A <strong>and</strong> B is about 4 <strong>and</strong> 6 kHz,<br />
respectively. These results show fm = , ~ fpre + frot. Although the rotation speed of<br />
other cases is not measured, it is expected that the rotation speed is proportional to<br />
the net co-injection input power normalized by plasma density [3].
114 NINOM1YA et al.<br />
plasma surface<br />
200 300<br />
FIG. 2. Time evolution of perturbed magnetic energy <strong>and</strong> phase of isl<strong>and</strong> for 8By/B, ~ W 5 <strong>and</strong> I0~ 4 ,<br />
where 6BV is the error field, B, the toroidal magnetic field <strong>and</strong> rpA the poloidal Alfven time. Upper<br />
figures show flux contour of the bBv/B, = IO~ 4 case.<br />
When toroidal rotation exists, the radial electric field Er is obtained from the<br />
neoclassical theory as follows:<br />
c e \ n: dr dr<br />
where U;* is the ion rotation velocity <strong>and</strong> a; is the neoclassical coefficient. The<br />
observed mode frequency is enhanced by frot through this radial electric field. This<br />
result is consistent with the experiment.<br />
Another feature of the periodic m = 1 burst mode in JT-60 is that the mode<br />
sometimes undergoes a transition to a continuous m = 1 mode during the later phases<br />
of the sawtooth, as is shown in Fig. 4. The transition condition is not yet clear, but<br />
this result suggests the possibility of fishbone controllability.
0)<br />
a.<br />
II<br />
E<br />
<strong>IAEA</strong>-CN-50/A-H-3 115<br />
1 1<br />
lp=0.5,1.0MA<br />
.Bt = 2.1-4.5T<br />
qeff = 2.7-5.2<br />
I<br />
"I<br />
• I A<br />
i • 1<br />
i<br />
I<br />
B<br />
1<br />
no toroidal<br />
rotation<br />
(MW/10 19 m"* 3 )<br />
FIG. 3. Relation between observed mode frequency normalized by toroidal precession frequency<br />
fm = i(fpre a "d net co-injection input power normalized by plasma density (Pco - PcmMer)/nr<br />
6.3 6.35 6.4 6.45<br />
Time(s)<br />
FIG. 4. Typical example of periodic m = I burst mode <strong>and</strong> transition to continuous m = 1 mode.
116 NINOMIYA et al.<br />
Limiter<br />
Divertor , , Divertor<br />
6.0 6.5 7.0<br />
Time (s)<br />
FIG. 5. Time evolution of magnetic fluctuation Be <strong>and</strong> intensity of O VI in the case of outer X-point<br />
discharge. The configuration is changed in the sequence divertor-limiter-divertor.<br />
4. HIGH FREQUENCY MAGNETIC OSCILLATION<br />
The frequency of the Mirnov oscillations is, typically, 2 to 4 kHz <strong>and</strong> the<br />
frequency of the internal m = 1 mode is lower than 3 kHz in JT-60 NB heated<br />
discharges. In comparison with these frequencies, higher frequency magnetic<br />
oscillations with narrow b<strong>and</strong>width are always excited by NB injection in the case<br />
of outer X-point discharges; these oscillations continue during the NB heating phase.<br />
The frequency of the oscillations is higher than 16 kHz; the typical b<strong>and</strong>width is<br />
about 1 kHz. The amplitude of these oscillations is reduced by a factor of about 6<br />
at the H-mode transition [4]. On the other h<strong>and</strong>, no high frequency magnetic<br />
oscillations are observed in limiter discharges or in the case of accidental light<br />
impurity contamination, even in divertor discharges. Figure 5 shows the time<br />
evolution of the magnetic fluctuation Be <strong>and</strong> the intensity of the O VI line in the<br />
1.5 MA outer X-point discharge, where the configuration was changed in the<br />
sequence divertor-limiter-divertor during" the NB heating phase. High frequency<br />
magnetic oscillations were excited by NB injection <strong>and</strong> decreased to the usual level<br />
of the OH phase when the divertor configuration turned into a limiter configuration<br />
(t = 6.3 s). The oscillation appeared again when the limiter configuration turned into<br />
the divertor configuration (t = 6.5 s).<br />
7.5
<strong>IAEA</strong>-CN-50/A-II-3 117<br />
These observations imply that the high frequency oscillations are sensitive to the<br />
details of the peripheral plasma. The narrow frequency spectrum also suggests the<br />
possibility of these oscillations being excited by a localized mode. Linear stability<br />
analyses of ideal <strong>and</strong> resistive localized modes in the divertor configuration show that<br />
the ideal interchange mode <strong>and</strong> the ideal ballooning mode are stable, because of the<br />
strong shear stabilization effect. The resistive ballooning mode <strong>and</strong> the high-m<br />
tearing mode are usually unstable but they have a broad frequency spectrum in the<br />
normal profile of the plasma parameters. The resistive interchange mode is unstable<br />
near the X-point because of the bad toroidal curvature effect in the case of the outer<br />
X-point configuration.<br />
High frequency magnetic oscillations (~ 10 kHz) have also been observed in<br />
the case of lower X-point discharges, but these oscillations often disappear during the<br />
NB heating phase. It is not clear by now whether these high frequency oscillations<br />
in lower X-point discharges are the same as those that are observed in outer X-point<br />
discharges. The resistive interchange mode is usually stable in the case of lower<br />
X-point configurations, but is marginally unstable for the lower X-point configuration<br />
of JT-60.<br />
5. FREQUENT ELMs<br />
In the case of lower X-point discharges, frequent ELMs have been observed in<br />
plasmas with high NB heating power [1, 5], similar to high beta discharges or<br />
hydrogen H-mode discharges in DIII-D [6]. Frequent bursts of Ua radiation <strong>and</strong><br />
soft X-ray signals near the peripheral region have been observed with bursts of<br />
magnetic fluctuation. Figure 6 shows the regime of frequent ELMs in qeff - /3p<br />
space, where qeff is the effective safety factor. It is found that frequent ELMs occur<br />
in the regime of /3p/qeff s 0.25. A similar criterion (j3p/qeff > 0.17) for H-mode<br />
transition is seen in D-III deuterium discharges [7].<br />
In discharges without the frequent ELMs, a decrease in the oxygen lines <strong>and</strong><br />
an increase in the carbon lines in the later phases of NBI have been observed, as is<br />
shown in Fig. 7. A similar behaviour is often seen in NB heated limiter discharges<br />
[8]. One possibility of increase in the carbon lines in these discharges is the<br />
increase in the heat flux onto the divertor plate or the limiter. In contrast to these<br />
discharges, a different impurity behaviour has been observed in the discharges with<br />
the frequent ELMs. The intensities of the carbon <strong>and</strong> Ti XX lines are reduced to a<br />
small level as compared with those in the no-ELM discharges, as is shown in Fig. 7.<br />
On the other h<strong>and</strong>, the emissivity of the O VIII line is higher than that in no-ELM<br />
discharges <strong>and</strong> decreases during the later phase of ELMs. The emissivity of the<br />
O VI line (1032 A), which corresponds to an oxygen influx, remains almost constant<br />
in discharges with the frequent ELMs. These results suggest that the frequent ELMs<br />
work as an impurity exhaust <strong>and</strong> the enhanced plasma-wall interactions due to<br />
particles swept out by the ELMs affect the oxygen influx.
118 NINOMIYA et al.<br />
2.4<br />
2.2<br />
2.0<br />
1.8<br />
1.6<br />
1.4<br />
L<br />
1.0<br />
0.8<br />
0.6<br />
0.4<br />
0.2<br />
-<br />
_<br />
I I I<br />
• ELM<br />
o NO ELM<br />
t J<br />
,6«» 2<br />
c<br />
o<br />
~ o<br />
I I I<br />
8.<br />
\<br />
8<br />
I I I<br />
/<br />
/<br />
/ ftp<br />
I I I<br />
I i<br />
#<br />
o,4 -<br />
Oo<br />
_<br />
/q.if - 0.25<br />
o —<br />
0 1 2 3 4 5 6 7 8 9<br />
q.ri<br />
FIG. 6. Operation regime of frequent ELMs in qeff - /3p space.<br />
(A.UJ<br />
5 6<br />
Time (s)<br />
FIG. 7. Time evolution of carbon <strong>and</strong> oxygen lines in discharges with <strong>and</strong> without frequent ELMs.<br />
Plasma current is 1 MA <strong>and</strong> plasma density is almost the same in both discharges.<br />
—
6. CONCLUSIONS<br />
<strong>IAEA</strong>-CN-50/A-II-3 119<br />
Studies of the locked mode, the periodic m = 1 burst mode, the high frequency<br />
magnetic oscillations <strong>and</strong> the frequent ELMs are being carried out in JT-60. The<br />
results are summarized as follows:<br />
(1) Locked modes are a serious problem for high-Ip <strong>and</strong> low-q operation of the<br />
present large tokamaks <strong>and</strong> the next step tokamaks. It is found that the locked<br />
mode during the current ramp-up phase is stabilized by high power NB heating<br />
<strong>and</strong> the stable Ip = 2.6-3.2 MA <strong>and</strong> q^ = 2.2-2.7 discharge has been<br />
attained. The characteristics of this mode during the current ramp-up phase in<br />
JT-60 suggest that the mode is kink-like.<br />
(2) A periodic m = 1 burst mode similar to a fishbone has been observed. The<br />
mode frequency increases with the toroidal rotation frequency. This result is<br />
consistent with the theoretical prediction that the observed mode frequency is<br />
enhanced by the toroidal rotation frequency over the toroidal precession<br />
frequency, when toroidal rotation exists.<br />
(3) In divertor discharges, magnetic oscillations with narrow b<strong>and</strong>width at high<br />
frequency are excited by NB injection, <strong>and</strong> it is shown that the resistive<br />
interchange mode is one c<strong>and</strong>idate for exciting the oscillations.<br />
(4) Frequent ELMs have been observed in lower X-point discharges, <strong>and</strong> it is found<br />
that the frequent ELMs occur in the regime of /Sp/qeff > 0.25.<br />
ACKNOWLEDGEMENTS<br />
The authors wish to thank the members of JAERI who have contributed to the<br />
JT-60 project throughout its progress. They also wish to express their gratitude to<br />
Drs S. Mori, K. Tomabechi <strong>and</strong> M. Yoshikawa for continued encouragement <strong>and</strong><br />
support.<br />
REFERENCES<br />
[1] JT-60 TEAM, Paper <strong>IAEA</strong>-CN-50/A-I-4, these Proceedings, Vol. 1.<br />
[2] NINOMIYA, H., et al., Nucl. Fusion 28 (1988) 1275.<br />
[3] ISHIDA, S., et al., Nucl. Fusion 28 (1988) 2225.<br />
[4] JT-60 TEAM, Bull. Am. Phys. Soc. 32 (1987) 1362.<br />
[5] TSUJI, S., et al., Paper <strong>IAEA</strong>-CN-50/A-V-1, these Proceedings, Vol. 1.<br />
[6] STAMBAUGH, R., et al., in Controlled Fusion <strong>and</strong> Plasma Heating (Proc. 15th Eur. Conf.<br />
Dubrovnik, 1988), Vol. 12B, European Physical Society (1988).<br />
[7] K1TSUNEZAKI, A., et al., in Plasma Physics <strong>and</strong> Controlled <strong>Nuclear</strong> Fusion Research 1984<br />
(Proc. 10th Int. Conf. London, 1984), Vol. 1, <strong>IAEA</strong>, Vienna (1985) 57.<br />
[8] NISHINO, N., et al., in Proc. 8th Int. Conf. on Plasma-Surface Interaction, Jiilich, 1988, to be<br />
published in J. Nucl. Mater.
DISRUPTION MODES AND SAWTOOTH<br />
ANALYSIS IN THE HL-1 TOKAMAK<br />
Qingdi GAO, Gancheng GUO, Yunwen QIN, Yongzhen ZHENG,<br />
Jiafti DONG, Yunze ZHONG, Zhanhe WANG, Qingwei YANG,<br />
Jiefu CHEN, Hong XIAO, Guangbi XU, Deming XU,<br />
Zhongchao DENG, Guangyang ZHANG, Shikun YANG,<br />
Huichen DENG, Bo FU, Dechang GAN, Kehua LI, Huazhi LI,<br />
Henian ZUO, Shubei LI, Peide ZHOU, Wenxue LIANG,<br />
Chengjie YUAN, Hongyin ZHANG, Youyi LI, Gao HU,<br />
Bingren SHI, Shangjie QIAN<br />
Southwestern Institute of Physics,<br />
Leshan, Sichuan,<br />
China<br />
Abstract<br />
<strong>IAEA</strong>-CN-50/A-II-4<br />
DISRUPTION MODES AND SAWTOOTH ANALYSIS IN THE HL-1 TOKAMAK.<br />
Disruption modes <strong>and</strong> precursory fluctuations during current startup <strong>and</strong> plateau phase in the<br />
HL-1 tokamak are explored in detail. The disruptive behaviour in the startup phase can be divided into<br />
two stages the first of which is characterized by a sequence of positive spikes on the loop voltage <strong>and</strong><br />
is attributed to runaway electrons. The operation regime of HL-1, in which there are two MHD areas,<br />
is bounded on the high sides of both n^/Bj <strong>and</strong> l/qa by mild disruptions. During the disruption phase,<br />
frequently regular relaxation phenomena similar to sawtooth oscillations occur. The sawtooth oscillations<br />
are studied, <strong>and</strong> the propagation of heat pulses induced by internal disruptions has been used to<br />
determine the local heat conduction coefficient, yielding xe ~ 2m 2 -s~', with typical discharge<br />
parameters.<br />
1. INTRODUCTION<br />
Since the first experiments on the HL-1 tokamak [1], the machine conditions<br />
have been improved considerably. Programmed gas puffing <strong>and</strong> Ti gettering are used<br />
routinely. Gas puffing refuelling has extended the operation regime significantly,<br />
attaining a density limit of n^nr 3 ) = 8.0 X 10 19 BT(T)/qaR(m) in gettered discharges.<br />
Discharges with low Zeff have been achieved by using Ti gettering,<br />
in which the intensities of O V = 193 A, C IV = 312 A, C III = 372 A,<br />
Mo XIII = 341 A <strong>and</strong> Cr XIII = 328 A were reduced by factors of 10, 7, 4, 2 <strong>and</strong><br />
1.5, respectively. A movable limiter covered with carbon tiles has replaced the stainless<br />
steel limiter used before.<br />
121
122 GAO et al.<br />
With hydrogen plasma, the main parameters attained up to date are as follows:<br />
Parameters Ref. [1] To date<br />
Plasma current, Ip (kA)<br />
Central electron density, ne (10 19 m" 3 )<br />
Central electron temperature, Te (keV)<br />
Central ion temperature, f; (keV)<br />
Global energy confinement time, rE (ms)<br />
Effective ionic charge, Zeff<br />
2. DISRUPTION MODES<br />
0.7<br />
0.3<br />
150<br />
4.2<br />
(average)<br />
(average)<br />
13<br />
2.5<br />
200<br />
9.0<br />
1.8<br />
0.8<br />
16-18<br />
1.5<br />
In the operation of the past two years, very few major disruptions terminating<br />
the discharge have been observed as had been the case before [1],<br />
2.1. Startup phase<br />
During the startup phase, two stages of disruptive behaviour can be identified.<br />
In the first stage, when the plasma current is relatively low, a sequence of positive<br />
spikes appears on the loop voltage. These perturbations disturb the vertical rather<br />
than the horizontal plasma displacement <strong>and</strong> have no effect on the plasma current,<br />
implying that the radial component of the magnetic field shows a correlated disturbance.<br />
In the discharges with higher filling pressure of the working gas, the positive<br />
spikes disappear. From the fact that the breakdown voltage is rather high, it is concluded<br />
that the runaway electrons are responsible for the disruptions in the first stage.<br />
As plasma current rises, normal disruptions appear, producing negative spikes on the<br />
loop voltage.<br />
As the rising rate of the current is very high (fp « 10-20 kA-ms" 1 ), the<br />
development of the MHD perturbation is associated with changes in this high current<br />
rising rate. For discharges with longer current rising time (Ip ~ 10 kA-ms" 1 ), the<br />
usual mode transition phenomena have been observed [2]. For discharges with very<br />
high current rising rate (Ip ~ 20 kA-ms" 1 ), the m = 4 <strong>and</strong> m = 3 modes grow to<br />
the maximum simultaneously, <strong>and</strong> no obvious development of m = 2 fluctuations is<br />
observed. However, in high density discharges with the same current rising rate,<br />
obviously the m = 2 mode develops, <strong>and</strong> the frequency of the mode oscillation is<br />
much lower than that in the low density case.<br />
2.2. Operational regime<br />
The operational regime of HL-1 is shown in Fig. 1, which is bounded on the<br />
high sides of both (neR/BT) <strong>and</strong> l/qa by mild disruptions. These mild disruptions
<strong>IAEA</strong>-CN-50/A-II-4 123<br />
FIG. 1. Hugill plot of explored parameters with typical discharge trajectories.<br />
which often occur when the plasma current begins to fall can be divided into two<br />
categories, A <strong>and</strong> B, according to the perturbation range in the plasma. Category A<br />
disruption causes obvious changes in Ip, while category B disruptions do not affect<br />
Ip <strong>and</strong> only show up in Vp fluctuations. B disruptions can take place alone, but<br />
sometimes they develop into A disruptions. In the operational regime, there are two<br />
MHD activity areas. As is shown in Fig. 1, soft disruption occurs when the discharge<br />
trajectory in the Hugill plot crosses area I during the current decay phase (trajectory<br />
a), or when the plasma current ramps up to area II with a lower rising rate<br />
(trajectory b). However, between these two areas, there appears to be a narrow<br />
window (5.8 < n,,R/BT < 6.6 x 10 18 nr 2 -T" 1 ), through which discharges can pass<br />
pass into the low qa value region (trajectory c). By controlling the current rising rate<br />
carefully, stable discharges at qa = 2.5 can be obtained by passing through this<br />
window.<br />
2.3. Sawtooth-like relaxation<br />
For category B disruptions, frequently regular relaxation phenomena similar to<br />
sawtooth oscillations occur. These events that are observed on soft X-ray signals have<br />
slowly rising <strong>and</strong> fast falling periods, <strong>and</strong> the modulation of the central soft X-ray<br />
signal is weaker; it resembles a subordinate oscillation in a compound sawtooth. The<br />
inversion radius of the relaxation is much larger than the radius of the q = 1 surface,<br />
but cannot be determined by the present array of X-ray diodes, although occasionally<br />
inverted signals are observed [3]. Figure 2 shows the soft X-ray signals for sawtoothlike<br />
relaxation <strong>and</strong> the response of the m = 2 frequency <strong>and</strong> amplitude to it. Both
124 GAO et al.<br />
P—3.0<br />
r—8.5<br />
SHOT: 4931<br />
165.0 167.0 169.0 171.0 173.0 175.0<br />
t (ms)<br />
FIG. 2. Soft X-ray emission as a function of time during disruption. The top signal is the MHD mode<br />
oscillation.<br />
the frequency <strong>and</strong> the amplitude of the mode rise <strong>and</strong> fall in phase with each other.<br />
This is in contrast with the behaviour seen on other kinds of disruptions. A similar<br />
behaviour of the mode modulation in the normal sawtooth case has been observed<br />
on the Tokoloshe tokamak [4]. By examining the phase of the modes superimposed<br />
on the relaxation, it is found that they usually have an m = 2 structure, with the<br />
isl<strong>and</strong> on the high field side being wider. Sometimes, however, they show a different<br />
structure at the centre.<br />
The sawtooth-like phenomena only take place in non-gettered discharges with<br />
a loop voltage of Vp = 3 to 4 V. This indicates that accumulation of impurities may<br />
be a c<strong>and</strong>idate for explaining the relaxation phenomena. In particular, a similar<br />
relaxation phenomenon with the modulation of the soft X-rays from the central<br />
channel being nearly 100%, has occasionally been observed. This shows that discharges<br />
in HL-1 can be repeated after rather pronounced disruptions.<br />
The characteristics of the disruptions in HL-1 are related to the cold boundary<br />
region of the plasma. According to measurements with Langmuir probes, the temperature<br />
at the plasma edge is comparatively low (e.g. 15 eV at a distance of 1 cm from<br />
the limiter) <strong>and</strong> rises slowly near the edge (dTe/dr < 10 eV-cm" 1 ). From other<br />
experimental data [5], we may conclude that there is a cold plasma blanket at the<br />
plasma boundary. For non-gettered discharges, on the basis of experimental evidence<br />
on the position of the q = 1,2 surfaces, combined with the cold blanket, a rather<br />
peaked current profile is used in a quasi-linear calculation of the tearing mode instability.<br />
The calculated relation between the magnitude of the perturbed poloidal field<br />
<strong>and</strong> the safety factor seems to fit the experimental results rather well [2]. As the<br />
plasma radius is reduced by moving the limiter, the minimum qa for stable discharge
<strong>IAEA</strong>-CN-50/A-II-4 125<br />
decreases significantly, e.g. qa = 3.8 at a = 0.2 m <strong>and</strong> qa = 2.6 at a = 0.16 m in<br />
non-gettered discharges. This indicates that the cold blanket is related to the interaction<br />
of the plasma with the wall <strong>and</strong> is possibly produced by enhanced recycling. With<br />
the Ti gettered vessel, stable discharges with qa = 3 at a = 0.2 m were obtained.<br />
As to the m = 2 mode, the frequency decreases linearly with increasing amplitude<br />
when the fluctuation level is low, but saturates when the fluctuation grows up<br />
to a level that causes disruptions [2]. Sometimes, the oscillating growing MHD<br />
precursors are interrupted <strong>and</strong> spatially locked before the disruption. Locked modes<br />
usually correlate with an outward shift of the plasma column. An interaction of the<br />
growing oscillating mode with the thick copper shell in HL-1 may be responsible for<br />
this phenomenon.<br />
2.4. Major disruption<br />
In discharges with strong gas puffing, a major disruption terminating the plasma<br />
current occurs. Before the disruption, the sawtooth oscillations grow with time in<br />
both amplitude <strong>and</strong> period while the inversion radius remains nearly constant<br />
(Fig. 3(a)). A simulation for the evolution of the plasma temperature <strong>and</strong> density<br />
profiles has been made with a one-dimensional transport code, showing that during<br />
gas puffing the temperature profile shrinks with a modest reduction of the plasma<br />
temperature (Fig. 3(b)) <strong>and</strong> a corresponding large increase of the plasma density; the<br />
latter causes a growth of the sawteeth. The shrinkage of the plasma column leads to<br />
thermal instability, with, as a consequence, a major disruption which terminates the<br />
discharge.<br />
3. SAWTEETH<br />
Sawtooth oscillations — sometimes compound sawteeth — were observed with<br />
an array of 20 X-ray diodes viewing the plasma vertically. The array covers a range<br />
of about half the plasma diameter.<br />
The radius of the q = 1 surface as determined from the sawtooth inversion<br />
scales as rs/a oc l/qa (Fig. 4). For discharges with a = 0.2 m, rs/a is usually<br />
smaller than 1/4. This is related to the fact that qa is rather high for stable discharges,<br />
because of the cold plasma blanket. The sawtooth period rs increases with<br />
the plasma density, but its exact dependence on the plasma parameters is difficult to<br />
determine. In discharges with rather low density (r^ < 2.5 x 10 19 m~ 3 ), it changes<br />
almost linearly with n,./BT. During the current decrease, an increasing rs with<br />
decreasing rs has been observed. This is in contradiction to the sawtooth period<br />
scalings given before. The waveforms of the soft X-ray signals show that the soft<br />
X-ray profile becomes increasingly peaked with time. The change in the plasma<br />
profile may affect the trigger conditions for the sawtooth crash.
126 GAO et al.<br />
a)<br />
M<br />
><br />
0.25<br />
0.15<br />
<strong>IAEA</strong>-CN-50/A-H-4 127<br />
0.2 0.3<br />
FIG. 4. Sawtooth inversion radius versus l/qa.<br />
By using sawtooth oscillations as a heat pulse source, the electron thermal<br />
conductivity, Xe> can be deduced from an approximate formula [6]:<br />
At, = Ar 2 /9Xe<br />
The linearized cylindrical heat conduction equation for a small, sawtooth induced<br />
electron temperature perturbation Te(r,t) was solved with a modified initial condition<br />
[7]. The heat pulse propagation is measured by the soft X-ray imaging system<br />
in HL-1. As is shown in Fig. 5, the propagation time of the heat pulse is quadratic<br />
in the radius, which demonstrates the diffusive characteristics of a heat pulse in the<br />
plasma. Using Eq. (1), we find x,. = 1.\ m 2 -s~' for the shot shown in Fig. 5. This<br />
value is about twice the electron thermal conductivity as deduced from the global<br />
energy confinement time.<br />
4. CONCLUSIONS<br />
(1) A large amount of experimental evidence shows that during disruptions discharges<br />
in HL-1 do not easily break down completely. The possible reasons for<br />
this are that there appears to be a cold plasma blanket in the peripheral region,<br />
<strong>and</strong> the thick copper shell in HL-1 prevents the plasma position from changing<br />
too much during the disturbance. This offers us good conditions for a detailed<br />
exploration of various disruptive phenomena.<br />
(1)
128 GAO et al.<br />
0.6<br />
0.3<br />
0.0<br />
50 100<br />
r ! (cm ! )<br />
FIG. 5. Measured arrival time of heat pulse peak on low (full circles) <strong>and</strong> high (open circles) field side<br />
(2) Both the edge q-limit <strong>and</strong> the density limit are bounded by mild disruptions,<br />
which cause a modest interruption or even have no effect at all on the plasma<br />
current.<br />
(3) The sawtooth inversion radius scales as rs oc a/qa <strong>and</strong> its period increases with<br />
increasing plasma density. The electron thermal conductivity as deduced from<br />
heat pulse propagation is about twice the value deduced from the energy confinement<br />
time in the plasma confinement region.<br />
ACKNOWLEDGEMENTS<br />
The results described in this paper were obtained by a large team making use<br />
of the helpful advice offered by Professor Zhengwu Li. The authors would like to<br />
thank the engineering group for satisfactory operation of the machine. The soft X-ray<br />
measurements were partially supported by <strong>IAEA</strong> Contract No. 4550/RB.<br />
REFERENCES<br />
[1] HL-l TOKAMAK GROUP, in Plasma Physics <strong>and</strong> Controlled <strong>Nuclear</strong> Fusion Research 1986<br />
(Proc. 11th Int. Conf. Kyoto, 1986), Vol. 1, <strong>IAEA</strong>, Vienna (1987) 399.<br />
[2] GAO, Qingdi, et al., in Controlled Fusion <strong>and</strong> Plasma Physics (Proc. 14th Eur. Conf. Madrid,<br />
1987), Vol. 11D, Part I, European Physical Society (1987) 291.<br />
[3] GUO, Gancheng, et al., ibid., p. 292.<br />
[4] ROBERTS, D.E., et al., Nucl. Fusion 26 (1986) 785.<br />
150
<strong>IAEA</strong>-CN-50/A-II-4 129<br />
[5] QIN, Yunwen, et al., in Controlled Fusion <strong>and</strong> Plasma Physics (Proc. 14th Eur. Conf. Madrid,<br />
1987), Vol. 11D, Part I, European Physical Society (1987) 235.<br />
[6] FREDRICKSON, E.D., et al., Nucl. Fusion 26 (1986) 849.<br />
[7] XIAO, Hong, GAO, Qingdi, GUO, Gancheng, WANG, Zhanhe, CHEN, Jiefu, Nucl. Fusion<br />
Plasma Phys. 8 (1988) 223 (in Chinese).
SUPERLOW DENSITY EXPERIMENT<br />
ON HT-6M TOKAMAK<br />
HT-6M GROUP<br />
(Written by Shuping FAN)<br />
Institute of Plasma Physics,<br />
Academia Sinica,<br />
Hefei, Anhui,<br />
China<br />
Abstract<br />
<strong>IAEA</strong>-CN-50/A-II-5-1<br />
SUPERLOW DENSITY EXPERIMENT ON HT-6M TOKAMAK.<br />
The HT-6M tokamak can be operated stably in the superlow density region with a few overhot<br />
electrons, by some specific methods. The main parameters are Ne = (0.2-0.6) x 10 13 cm" ,<br />
Ip = 60-80 kA, V, = 0.7-2.0 V, B = 7-10 kG, a = 18 cm, R = 63 cm. — In these discharges, the<br />
plasma density was determined entirely by limiter <strong>and</strong> wall outgassing; it was totally independent of the<br />
initial hydrogen pressure, PQ. The plasma was quiescent, with very small sawteeth. MHD instabilities<br />
(m = 2, 3) only appeared in the current decay stage. The plasma had a peaked Te(r) <strong>and</strong> a flat Ne(r)<br />
profile. The energy confinement time (re = 1-2 ms) was about two to four times the value calculated<br />
from the Alcator scaling law.<br />
1. ENTERING THE SUPERLOW DENSITY REGION<br />
(1) The outgassing rate of the limiter <strong>and</strong> the wall could be reduced substantially<br />
by 400 Hz discharge cleaning [1].<br />
(2) Effective compensation of the stray field (Bs/Bt < 0.05%) enabled<br />
the HT-6M tokamak to build up a plasma at extremely low electric field<br />
(E, = \y2irR < 2.5 x 10" 2 V-cm" 1 ) <strong>and</strong> avoided the generation of a great number<br />
of runaway electrons (Fig. l(a)) [2].<br />
(3) Plasma displacement was carefully controlled during the current startup<br />
stage in order to prevent excessive outgassing due to plasma-wall interaction.<br />
(4) If it were difficult to produce a plasma at Vf = 10 V, DC glow discharge<br />
cleaning should be used to improve the vacuum wall condition for 0.5-4 h.<br />
(5) The initial hydrogen pressure Po was gradually reduced from 8 X 10" 5<br />
to 3 x 10" 5 (slightly changing after each four or five shots). N changed from<br />
1.0 x 10 13 cm" 3 down to 0.4 x 10 13 cm" 3 . Once the superlow density (SLD) region<br />
was reached, Po did not have any influence on Ne, but definitely affected the<br />
breakdown.<br />
(6) We provided a hot filament <strong>and</strong> a microwave source (35 GHz, 20 kW) for<br />
pre-ionization.<br />
131
132<br />
(V)<br />
4.0<br />
1.0<br />
(a)<br />
HT-6M GROUP<br />
ratil<br />
0 10 20 30 40 50 (ms)<br />
FIG. 1. (a) Loop voltage; (b) m = 2 MHD fluctuation; (c) m = 3 MHD fluctuation.<br />
dP/dE<br />
(a.u.)<br />
1000 —<br />
100 _<br />
2. EXPERIMENTAL RESULTS<br />
0 -2.0 4.0 6.0 E(keV)<br />
FIG. 2. Soft X-ray energy spectrum.<br />
(1) The SLD experiment was a typical tokamak discharge with a few runaway<br />
electrons:<br />
(a) Only negative irregular, but not positive peaks appeared on the loop<br />
voltage curve (Fig. l(a)); the value of V, at the plateau was 0.7-2.0 V,<br />
i.e. larger than 0.3 V (which is the value in the runaway discharge).
<strong>IAEA</strong>-CN-50/A-n-S-l 133<br />
(b) Hard X-rays only appeared in the initial <strong>and</strong> the disruption phases (after<br />
35 ms) [2].<br />
(c) On the plateau, a Maxwellian distribution spectrum of Te =<br />
600-1000 eV appeared from the signal of the soft X-ray pulse height<br />
analyser (PHA) (Fig. 2).<br />
(d) Zeff as computed from Te(r) (measured by PHA <strong>and</strong> Langmuir probes),<br />
Vf <strong>and</strong> Ip, by using Spitzer resistivity, was 3.3, in agreement with the<br />
directly measured value (from impurity spectrum <strong>and</strong> line radiation measured<br />
by PHA).<br />
(2) In SLD, Ne was determined from the outgassing rate. It was more difficult to<br />
control the wall surface conditions than gas puffing. So, the parameters were<br />
dispersive. We chose about 300 similar shots from the data of more than<br />
1000 discharges:<br />
Ne = (0.2-0.4) x 10 13 cm<br />
Ip = 65 kA<br />
Vf = 0.7-1.4 V<br />
Bt = 9.4 kG<br />
In addition, we assumed:<br />
Ne(r) = Ne [1 - (r/a) 2 ]
134 HT-6M GROUP<br />
3. DISCUSSION<br />
(keV)<br />
1.0<br />
0.8<br />
0.6<br />
0.4<br />
0.2<br />
n n<br />
. i l i .<br />
/<br />
/<br />
IT/-J»T--.<br />
1<br />
Te(r)<br />
/<br />
/<br />
, . 1 . , . 1 , ill it Nil r<br />
-20 -10 0.0 10 20 (cm)<br />
FIG. 3. Profile of electron temperature.<br />
30 32 34 (ins)<br />
FIG. 4. Sawteeth from soft X-ray diodes.<br />
(1) It is a main feature of SLD that Ne is only determined by the wall surface conditions<br />
<strong>and</strong> is independent of Po. This was also our criterion for deciding<br />
whether the discharge had entered the SLD region or not.<br />
(2) Compared with continuous gas filling in normal density discharges, Te(r) was<br />
peaked (Fig. 5(a)) <strong>and</strong> Ne(r) was flat (Fig. 5(b)) in SLD. Thus, the properties<br />
were similar to those of gas puffing <strong>and</strong> consistent with the fact that the plasma<br />
was entirely maintained by neutral gas diffusing from the wall.<br />
(3) Owing to the suppression of sawteeth <strong>and</strong> MHD instabilities, the transport was<br />
improved, a stable hot core was maintained <strong>and</strong> TE was increased to two to<br />
four times the value given by Alcator scaling.
<strong>IAEA</strong>-CN-SO/A-n-5-l 135<br />
0 0.2 0.4 0:6 0.8 1.0 r/a<br />
FIG. 5. (a) Normalized profile of electron temperature; (b) normalized profile of electron density.<br />
4.0<br />
2.0 -<br />
0 5.0 10.0 15.0 r(cm)<br />
FIG. 6. q profile with Spitzer conductivity <strong>and</strong> Zeg = 3.3.
136 HT-6M GROUP<br />
(4) Zeff was constant; the q(r) profile was derived from Spitzer conductivity<br />
(Fig. 6); q(0) = 0.8 was obtained (as opposed to q(0) = 0.46 from neoclassical<br />
conductivity). It seemed very strange that in this case the sawteeth were still<br />
very small. The value of q(0) was also supported by the fact that L; = 1.8, i.e.<br />
the current profile was peaked. It is well known that sawtooth collapse could<br />
be delayed even for 2 s in the monster sawtooth process reported for JET [3],<br />
but in JET the process occurred under conditions of normal density. In SLD,<br />
on the HT-6M tokamak, the collapse seemed to be weakened or even<br />
suppressed. Zeff
<strong>IAEA</strong>-CN-50/A-D-5-2<br />
INVESTIGATION OF SAWTOOTH BEHAVIOUR<br />
AND CONFINEMENT WITH RHF<br />
ON THE HT-6B TOKAMAK<br />
Yuping HUO, Jikang XIE, Linzhong LI, Yexi HE, Dequan GUO,<br />
Pinjain QIN, Guoxiang LI, Chuanbao DENG, Rong HUANG,<br />
Qiliang GUO, Xingde TONG, Junyu ZHAO<br />
Institute of Plasma Physics,<br />
Academia Sinica,<br />
Hefei, Anhui, China<br />
Abstract<br />
INVESTIGATION OF SAWTOOTH BEHAVIOUR AND CONFINEMENT WITH RHF ON THE<br />
HT-6B TOKAMAK.<br />
The paper presents experimental results on resonant helical field (RHF) effects on sawtooth<br />
behaviour <strong>and</strong> plasma confinement in the HT-6B tokamak. The RHF results in a decrease in electron<br />
thermal conductivity, broadening of the temperature profile, increase of the plasma density <strong>and</strong> enhancement<br />
of impurity radiation, <strong>and</strong> at the same time results in an intensification of sawtooth oscillations<br />
(in amplitude, period, rising slope <strong>and</strong> inversion radius) <strong>and</strong> suppression of m = 2, 3, 4 modes. It is<br />
shown that the discharge transforms to a new discharge state.<br />
1. INTRODUCTION<br />
Investigation of the external helical magnetic perturbation effect on MHD<br />
modes has been of extensive interest since the first result was obtained on the Pulsator<br />
tokamak. Experimental results on HT-6B indicating that a weak resonant helical field<br />
(RHF) suppresses MHD modes (m = 2, 3, 4, 5) were reported in Refs [1-3]. The<br />
suppression was explained by a resonant mechanism <strong>and</strong> a strong global correlation<br />
between different modes. It was observed that the RHF also affects sawtooth<br />
behaviour. Recent experimental results showed that these effects are accompanied by<br />
an improvement of plasma confinement. This made the picture more complicated.<br />
2. SAWTOOTH BEHAVIOUR WITH RHF<br />
On the HT-6B tokamak, sawtooth behaviour was influenced by RHF over a<br />
wide range of operation parameters, such as r^ = (0.6-3) X 10 13 cm" 3 , q = 2.6-5.<br />
The optimal amplitude <strong>and</strong> configuration (I = 2 or 3) of the RHF depended on the<br />
operation conditions. Nevertheless the RHF was always lower than 1% of the<br />
poloidal field. Experimental results were given in two categories according to the<br />
plasma densities.<br />
137
138 HUO et al -<br />
In the first case, at low density (n,, < 1.5 X 1O 13 cm" 3 ), sawteeth in a normal<br />
discharge would be amplified by a pulsed DC RHF. Figure l(a) shows the signals<br />
of the soft X-ray diode array <strong>and</strong> m = 3 magnetic perturbation versus time. For comparison<br />
we also show the amplified sawteeth together with the former ones on an<br />
exp<strong>and</strong>ed time co-ordinate in Fig. l(b).<br />
When the RHF was turned on, at 12 ms, sawteeth were increased in amplitude,<br />
period <strong>and</strong> fluctuation slope. The fluctuation magnitudes increased by a factor of<br />
2.5 up to about one third of the mean value of the soft X-ray signal of the central<br />
chord. The periods increase from 230 ^s to 320 ^is. The ramp-up slope increased<br />
from 0.9 V/ms to 1.5 V/ms <strong>and</strong> the collapse slope from 3.6 V/ms to 7.6 V/ms.<br />
In the case of n 1.5 x 10 13 cnr 3 , discharges normally had strong Mirnov<br />
oscillations. That magnetic perturbation was about 1% of the poloidal field. In<br />
Fig. 2(a), soft X-ray signals at different radii <strong>and</strong> Mirnov probe signals were modulated<br />
by 24 kHz oscillations. At 8 ms, when the RHF was turned on, Mirnov oscillations<br />
transformed into sawteeth. These sawteeth had larger amplitudes than those in<br />
Fig. 1. In some discharges the sawtooth fluctuation might spread over the plasma<br />
volume, which could be observed on the diode signal at 10 cm, oh the hard X-ray<br />
signal (collimated to the limiter) <strong>and</strong> on Mirnov probe signals.<br />
Figures 2(b) <strong>and</strong> (c) show the time exp<strong>and</strong>ed curves around the moments where<br />
the RHF was turned on <strong>and</strong> off, respectively. One can see that with the RHF on, the<br />
24 kHz oscillation decreases <strong>and</strong> sawteeth appear from centre to edge <strong>and</strong> enlarge to<br />
an amplitude saturated at a higher level. The inverse process took place when the<br />
RHF was turned off. The relaxation times of these two processes were near 1 ms,<br />
which was close to the energy confinement time TE ( — 0.7 ms).<br />
In both cases, the 24 kHz Mirnov oscillations were identified as m = 1 mode<br />
at r < 4 cm <strong>and</strong> m = 2, 3 in the r > 6 cm region. The suppression of modes <strong>and</strong><br />
the occurrence of sawteeth kept the same pace. This raised a question about the<br />
driving force of the sawtooth collapse. It seemed that the suppressed small m = 1<br />
mode could not be capable of driving the intensive collapse at the plasma hot core.<br />
3. PLASMA CONFINEMENT IMPROVEMENT BY RHF<br />
Electron thermal conductivity was derived from calculation of the time delay<br />
between sawtooth collapses at different radii [4]. The result is given in Table I. With<br />
the RHF in effect xe decreased to 3/4 in the core <strong>and</strong> to 2/3 in the outer region. The<br />
reduction of xe was in good agreement with the increment of the sawtooth ramp-up<br />
slope.<br />
The electron temperature profile Te(r) was derived from soft X-ray measurements.<br />
As is shown in Fig. 3, the profile became broader. Te in the outer region<br />
(r > rs) increased <strong>and</strong> Te (average over sawteeth) at the centre became a bit lower.<br />
This cooling effect on the plasma centre might be attributable to the large sawtooth<br />
perturbations. Considering the fluctuation, the large sawteeth made Te fluctuate to a
0.14<br />
0.10<br />
0.09<br />
0.08<br />
0.05<br />
0.04<br />
0.03<br />
0.09<br />
-0.05<br />
-0.18<br />
-0.28<br />
10.0<br />
<strong>IAEA</strong>-CN-50/A-II-5-2 139<br />
16.0<br />
0.04<br />
16.0 18.4<br />
(a)<br />
(b)<br />
FIG. I. (a) Sawtooth amplification by RHF starting from 12 ms. From top to bottom: soft<br />
X-ray signals at 2, 6 <strong>and</strong> 8 cm, m = 3 <strong>and</strong> helical current (inverted), (b) Sawteeth with (top) <strong>and</strong> without<br />
(bottom) RHF.<br />
higher maximum <strong>and</strong> a deeper minimum. In our experiments, line averaged electron<br />
density n
140 HUO et al.<br />
2.20<br />
1.48<br />
1.98<br />
0.78<br />
1.44<br />
0.74<br />
1.98<br />
1.18<br />
0.88<br />
-0.28<br />
-0.82<br />
-0.84<br />
1.80<br />
1.70<br />
1.90<br />
1.10<br />
1.18<br />
0.08<br />
1.20<br />
1.10<br />
-0.02<br />
-0.10<br />
-0.81<br />
•0.82<br />
-0.83<br />
2.10<br />
2.00<br />
1.90<br />
i.yo<br />
1.10<br />
1.20<br />
0.90<br />
1.80<br />
1.40<br />
0.80<br />
-0.20<br />
-0.82<br />
4.0<br />
\^J*0*^^<br />
* ^ # A A ^<br />
8.0 8.5 9.0<br />
ms<br />
-0.84<br />
13.5 14.0 14.5<br />
ms<br />
13.0 16.0<br />
9.5<br />
L ,V , 1 IX<br />
f\ ft A \ AM<br />
/<br />
/<br />
10.0<br />
15.0 15.5<br />
(a)<br />
(b)<br />
(c)<br />
FIG. 2. (a) Discharge transformation from 24 kHz oscillation to large sawteeth by RHF. From top<br />
to bottom: soft X-ray signals at 2, 4, 6 <strong>and</strong> 8 cm, m = 3 <strong>and</strong> RHF current (inverted),<br />
(b, c) Signals with exp<strong>and</strong>ed time-scale for moments at which RHF is turned on <strong>and</strong> off,<br />
respectively.
TABLE I. REDUCTION OF Xe (m 2 -s') BY RHF<br />
<strong>IAEA</strong>-CN-50/A-II-5-2 141<br />
Shot 11 176 r = 0 cm r = 7.6 cm<br />
Without RHF<br />
With RHF<br />
180<br />
3.38 ± 0.49<br />
2.37 ± 0.38<br />
No. 880415D20<br />
2.0 4.0<br />
r(cm)<br />
FIG. 3. Te(r) derived from soft X-ray measurement broadening with RHF.<br />
6.0<br />
7.76 + 0.15<br />
4.30 ± 0.30<br />
Figure 4 gives the measurement results of line emissions. The lines of O(III)<br />
(3759.9 A), C(III) (4647.4 A) <strong>and</strong> Ha (6563 A) were monitored with a multifibre<br />
channel monospectrometer with 0.6 cm space resolution. It could be seen that the line<br />
emissions of light impurities held a plateau during the time the RHF was on, from<br />
8 to 14.2 ms. Its level was about half its original value. The rising <strong>and</strong> falling<br />
processes were synchronized with the sawtooth transformation processes shown in<br />
Figs 2(b) <strong>and</strong> (c). These plateaus appeared on channels of the spectroscopic viewing<br />
chords over the whole plasma, even at 11 cm radius. The phenomenon could not be<br />
easily explained. It should be sensitive to temperature <strong>and</strong> density rise <strong>and</strong> impurity<br />
accumulation. The rising <strong>and</strong> falling time is of the order of 1 ms. It is too short to<br />
be explained by neoclassical accumulation <strong>and</strong> diffusion of impurities. There is a<br />
need for more accurate diagnostics <strong>and</strong> a careful calculation.
142 HUO et al.<br />
O.O7<br />
0.04<br />
0.19<br />
0.06<br />
0.13<br />
0.07<br />
0.17<br />
0.08<br />
0.18<br />
0.08<br />
0.07<br />
0.04<br />
-0.82<br />
•0.85<br />
5.0 7.0 9.0 11.0<br />
ms<br />
13.0 15.0 17.0<br />
FIG. 4. From top to bottom: line emission signals of O(III) (at 1.5 <strong>and</strong> 8.7 cm), C(III) (at 1.5 <strong>and</strong><br />
8.7 cm) <strong>and</strong> Ha (at 1.5 <strong>and</strong> 8.7 cm), <strong>and</strong> RHF current (inverted).<br />
In Fig. 4, Ha radiation behaved differently from impurities. It rose in the first<br />
2 ms <strong>and</strong> immediately decayed to its original value, without significant change when<br />
the RHF was turned off. This showed that there was no greatly intensified hydrogen<br />
influx during that period.<br />
The above results showed that the weak RHF magnetic perturbation would<br />
change the MHD instabilities <strong>and</strong> the sawtooth behaviour, as well as the plasma confinement.<br />
On the other h<strong>and</strong>, the effectiveness of the RHF depended on the discharge<br />
conditions. The RHF was not effective in high Zeff discharges. The RHF configuration<br />
(£ = 2 or 3) had to be chosen for discharges with different q values <strong>and</strong> profiles.<br />
The optimal RHF current was related to plasma density. This meant that the mechanism<br />
of the RHF could not be simply considered as a direct magnetic interaction with<br />
MHD mode.<br />
4. SUMMARY<br />
The main experimental results can be summarized as follows:<br />
(1) The RHF could reduce energy <strong>and</strong> particle losses <strong>and</strong> improve plasma confinement.<br />
RHF discharges have higher density <strong>and</strong> broader temperature profile.<br />
(2) The RHF produced large sawteeth characterized by their amplitudes, periods<br />
<strong>and</strong> slopes <strong>and</strong> the range over which the sawteeth spread. The large amplitude<br />
sawteeth with strong collapses decreased the mean value of the temperature at<br />
the plasma core. It is unclear why the driving force of the collapses was intensified<br />
<strong>and</strong> what the nature of the driving force is.
<strong>IAEA</strong>-CN-50/A-II-5-2 143<br />
(3) The line emissions of light impurities increased over the whole plasma. They<br />
showed a plateau when the RHF was on, which was different from the successive<br />
growth of iie.<br />
(4) The DC RHF could suppress the Mirnov oscillation <strong>and</strong> improve the confinement,<br />
but could also amplify the sawteeth <strong>and</strong> enhance impurity radiation, etc.<br />
It is quite difficult to underst<strong>and</strong> all these phenomena from a physical picture<br />
of usual tokamak discharges. The plasma seems to be a new state of tokamak<br />
plasma.<br />
REFERENCES<br />
[1] ZHAO, Qingchu, et ah, "Suppression of tearing modes in tokamaks by a helical magnetic field",<br />
Plasma Physics <strong>and</strong> Controlled <strong>Nuclear</strong> Fusion Research 1984 (Proc. 10th Int. Conf. London,<br />
1984), Vol. 1, <strong>IAEA</strong>, Vienna (1985) 345-352.<br />
[2] XIE, Jikang, et al., "Studies of MHD modes <strong>and</strong> high frequency fluctuations on the HT-6B <strong>and</strong><br />
HT-6M tokamaks", Plasma Physics <strong>and</strong> Controlled <strong>Nuclear</strong> Fusion Research 1986 (Proc. 11th<br />
Int. Conf. Kyoto, 1986), Vol. 1, <strong>IAEA</strong>, Vienna (1987) 317-323.<br />
[3] XIE, Jikang, et al., "Modification of sawtooth behavior using RHF on HT-6B tokamak", Controlled<br />
Fusion <strong>and</strong> Plasma Physics (Proc. 14th Eur. Conf. Madrid, 1987), Vol. 11D, Part I,<br />
European Physical Society (1987) 221.<br />
[4] CALLEN, J.D., JAHNS, G.L., Phys. Rev. Lett. 38 (1977) 491.
IMPROVED CONFINEMENT REGIMES<br />
WITH OHMIC AND WITH<br />
COUNTER-INJECTION HEATING IN ASDEX<br />
<strong>IAEA</strong>-CN-50/A-III-l<br />
G. FUSSMANN, O. GRUBER, H. NIEDERMEYER,<br />
F.X. SOLDNER, A. STABLER, F. WAGNER, G. BECKER,<br />
M. BESSENRODT-WEBERPALS, B. BOMBA, H.-S. BOSCH,<br />
K. BRAU 1 , H. BRUHNS, R. BUCHSE, A. CARLSON,<br />
G. DODEL 2 , A. EBERHAGEN, H.-U. FAHRBACH, O. GEHRE,<br />
K.W. GENTLE 3 , J. GERNHARDT, L. GIANNONE,<br />
G. VON GIERKE, E. GLOCK, S. VON GOELER 4 , G. HAAS,<br />
W. HERRMANN, J. HOFMANN, E. HOLZHAUER 2 ,<br />
K. HUBNER 5 , G. JANESCHITZ, A. KALLENBACH,<br />
F. KARGER, M. KAUFMANN, O. KLUBER, M. KORNHERR,<br />
K. KRIEGER, J. KUCINSKI 6 , K. LACKNER, R.S. LANG,<br />
G. LISITANO, M. LORCHER, H.M. MAYER,<br />
K. McCORMICK, D. MEISEL, V. MERTENS, E.R. MULLER,<br />
H.D. MURMANN, J. NEUHAUSER, R. NOLTE,<br />
J.-M. NOTERDAEME, W. POSCHENRIEDER, L.B. RAN 7 ,<br />
D.E. ROBERTS 8 , H. ROHR, J. ROTH, A. RUDYJ,<br />
F. RYTER, W. SANDMANN, F. SCHNEIDER, U. SCHNEIDER,<br />
E. SEVILLANO 9 , G. SILLER, E. SIMMET, E. SPETH,<br />
K.-H. STEUER, U. STROTH, N. TSOIS 10 , H. VERBEEK,<br />
O. VOLLMER, H. WURZ 11 , H.R. YANG 7<br />
Max-Planck-Institut fur Plasmaphysik,<br />
Euratom-IPP Association,<br />
Garching, Federal Republic of Germany<br />
1<br />
Massachusetts Institute of Technology, Cambridge, MA, USA.<br />
2<br />
University of Stuttgart, Stuttgart, Federal Republic of Germany.<br />
3<br />
University of Texas at Austin, Austin, TX, USA.<br />
4<br />
Princeton University, Princeton, NJ, USA.<br />
5<br />
University of Heidelberg, Heidelberg, Federal Republic of Germany.<br />
6<br />
Institute for <strong>Nuclear</strong> Studies, Otwock-Swierk, Pol<strong>and</strong>.<br />
7<br />
Southwestern Institute of Physics, Leshan, Sichuan, China.<br />
8<br />
Atomic Energy Corporation of South Africa, Pretoria, South Africa.<br />
9 General Atomics, San Diego, CA, USA.<br />
10 <strong>Nuclear</strong> Research Centre Demokritos, Attiki, Greece.<br />
" Kernforschungszentrum Karlsruhe, Karlsruhe, Federal Republic of Germany.<br />
145
146 FUSSMANN et al.<br />
Abstract<br />
IMPROVED CONFINEMENT REGIMES WITH OHMIC AND WITH COUNTER-INJECTION<br />
HEATING IN ASDEX.<br />
The modification of the divertor configuration of ASDEX gave rise to major changes in confinement.<br />
(1) Under Ohmic conditions <strong>and</strong> with deuterium as working gas the confinement time rE no<br />
longer saturates at high density but continues to increase up to the density limit. TE values up to 140 ms<br />
are observed in comparison with 80 ms for the previous saturated conditions. (2) Counter-neutral injection<br />
leads to superior confinement under conditions where co-injection would lead to degraded L-mode<br />
behaviour. TE rises slightly above Ohmic values for PNI < 1.2 MW. A common feature of the two<br />
regimes of improved confinement is gradual peaking of the density profile. Transport code calculations<br />
indicate a reduction to the neoclassical values of the ion heat conduction losses in both regimes.<br />
Improved particle confinement causes an accumulation of high Z impurities in the core. As the correlation<br />
between energy <strong>and</strong> particle transport seems to be a rather fundamental property of tokamak transport,<br />
impurity transport is discussed in detail. In the absence of sawteeth, high Z impurity transport can<br />
be described by neoclassical transport laws.<br />
INTRODUCTION<br />
Major tasks in tokamak research are the exploration of good confinement<br />
regimes <strong>and</strong> the development of auxiliary heating methods compatible with the conditions<br />
for good confinement. Both under Ohmic heating (OH) conditions <strong>and</strong> with<br />
auxiliary heating, there are degraded confinement regimes. For OH conditions the<br />
confinement time TE saturates towards higher densities <strong>and</strong> with auxiliary heating TE<br />
degrades with heating power. In this paper we report (1) improved Ohmic confinement<br />
(IOC) at densities which normally lead to the saturated Ohmic confinement<br />
regime (SOC) <strong>and</strong> (2) improved confinement with counter-neutral injection (ctr-NI)<br />
under plasma conditions which lead to degraded L-mode confinement with co-NI.<br />
Previous attempts to improve the OH confinement at high density were only successful<br />
with pellet instead of gas puff refuelling [1] <strong>and</strong> no distinct improvement was<br />
achieved with ctr-NI over the usual L-regime results as obtained with co-heating.<br />
Further improved confinement regimes were obtained after the divertor configuration<br />
of ASDEX was changed. The major modifications are the reduction of the<br />
volume of the divertor chamber, resulting in a reduction of the area of gas absorbing<br />
surfaces in the divertor chamber, <strong>and</strong> a change of the material of the target plates<br />
from titanium to copper [2]. These changes have strongly affected recycling; about<br />
a factor of 2 less gas is required to reach the same constant density in the plateau<br />
phase.<br />
THE IOC REGIME<br />
Improved Ohmic confinement is obtained upon reduction of the external gas<br />
feed at high densities [3] where roll-over <strong>and</strong> saturation of TE are otherwise
2 I<br />
o<br />
Q- ic<br />
3<br />
O<br />
x<br />
Q.<br />
CO.<br />
0.4-<br />
0.2-<br />
<strong>IAEA</strong>-CN-50/A-III-l 147<br />
uequ<br />
IOC<br />
#24420<br />
0 1 2 3<br />
t (s)<br />
F/G. i. Temporal evolution of plasma parameters during a discharge passing from LOC through SOC<br />
to the IOC regime. $gas is the external gas flux (arbitrary units), POH is the Ohmic input power, Isx is<br />
the soft X-ray intensity along a chord through the plasma centre <strong>and</strong> Da is measured in the main<br />
plasma chamber at the X-point.<br />
observed. The development of the IOC regime out of the SOC regime is shown in<br />
Fig. 1. Two density plateau phases during the current flat-top phase are<br />
preprogrammed. With the first step at n
148 FUSSMANN et al.<br />
150-<br />
100-<br />
50-<br />
0-<br />
1.8-<br />
1.6-<br />
1.4-<br />
4<br />
(a )<br />
o # r<br />
E<br />
T +• t=<br />
~ E<br />
qa<br />
)j<br />
LOC<br />
C»<br />
= 2.75<br />
+<br />
o <<br />
•<br />
kin<br />
•<br />
IOC *<br />
.** soc<br />
A fresh carbonization<br />
o n9 - ramp-up D2<br />
• n9 • Mat-top<br />
<strong>IAEA</strong>-CN-50/A-UI-l 149<br />
— #25717 H°-D + clr<br />
— #25720 H°-D + CO<br />
0.8 1.0 1.2 1.4 1.6<br />
FIG. 3. Temporal evolution of plasma parameters for two discharges with co-NI <strong>and</strong> ctr-Nl, respectively.<br />
Ip = 420 kA, B, = 2 T, qa = 2.26, PN1 = 0.9 MW, H° - D + .<br />
ramped up during the OH phase by feedback controlled gas puffing to n, =<br />
4.2 x 10 13 cm" 3 . At 1.2 s the external gas flux was reduced to a lower <strong>and</strong> fixed<br />
value. The density behaviour is markedly different in the two cases: for co-NI, h^<br />
slightly decreases, whereas for ctr-NI it increases continuously throughout the ctr-NI<br />
phase, even after the external gas flux has been reduced. This indicates better particle<br />
confinement in the case of ctr-NI, as already noted on ISX [5]. On ASDEX, however,
150 FUSSMANN et al.<br />
UJ<br />
100-<br />
50-<br />
+<br />
2 3<br />
j<br />
• 2<br />
3 4<br />
f soc<br />
LOC<br />
••<br />
n-<br />
1.2 1.4 1.6<br />
Qn =<br />
j 3<br />
_^.<br />
24 3<br />
IOC<br />
4<br />
radiation<br />
dominated<br />
OH<br />
+ H2<br />
. D2<br />
Counter - Nl<br />
1: PN, = 0.3 MW<br />
2: PN, = 0.6 MW<br />
3: PN, = 0.89MW<br />
4: PN, = 1.16MW<br />
1.8<br />
-,/ <br />
FIG. 4. Energy confinement time T'E versus density profile factor Qn for OH <strong>and</strong> Nl heated plasmas.<br />
LOC, SOC, IOC: lp = 380kA, B, = 2.17 T, qa = 2.75; ctr-NI: Ip = 420 kA, B, = 2 T, qa = 2.26.<br />
the energy confinement is also improved, as seen from the continuous increase of<br />
/3P. Initially, the difference between co- <strong>and</strong> ctr-NI is small but, triggered by the<br />
reduction of the external gas flux at 1.2 s, the energy content of the ctr-NI heated<br />
plasma rises again to a significantly higher value.<br />
At low beam power TE values as high as in the IOC regime are achieved, as<br />
seen in Fig. 4. As in the IOC regime, the slow transition to improved confinement<br />
is correlated with a peaking of the density profile, as seen from the gradual rise of<br />
Qn. The soft X-ray signal exhibits a distinctly different behaviour for ctr- <strong>and</strong> coinjection.<br />
Already during the initial injection phase the soft X-ray level as well as the<br />
sawtooth modulations of the ctr-heated plasma exceed those of co-NI. The sawtooth<br />
amplitude <strong>and</strong> period continue to increase during the ctr-NI phase <strong>and</strong> finally the sawtooth<br />
activity disappears completely. In this late phase large impurity radiation losses<br />
from the plasma core lead to a roll-over of /3p.<br />
DISCUSSION<br />
The role of plasma edge conditions. Both in the IOC regime <strong>and</strong> with ctr-NI the<br />
modified particle transport seems to be governed by the edge conditions. The peaking<br />
2.0
8-<br />
4-<br />
8-<br />
4-<br />
<strong>IAEA</strong>-CN-50/A-III-l 151<br />
o SOC t = 1.!4s tf23349-57<br />
• IOC t = 1.60 s # 23349-57<br />
' ctr-NI I = 1.46s #25717<br />
• ctr-NI t = 1.16s #25717<br />
o co.-NI I = 1.15s #25720<br />
40 20 0 20<br />
r (cm)<br />
/7G. 5. Radial profiles of electron density ne(r) comparing SOC/IOC regimes <strong>and</strong> co-lctr-Nl, ion<br />
temperature T,(r)for SOC/IOC <strong>and</strong> the toroidal rotation velocity v$(r) for co-/ctr-NI.<br />
of the ne(r) profile is initiated at the moment the external gas flux is reduced (see<br />
Figs 1 <strong>and</strong> 3). For both regimes, the detrimental effect of strong gas puffing has been<br />
noted. The IOC regime does not develop when n
152 FUSSMANN et al.<br />
In both regimes the peaking of the n^r) profile correlates with the observed<br />
improvement in confinement. In Fig. 4 TE is plotted versus the profile factor Qn for<br />
all regimes discussed in this paper. In the SOC regime <strong>and</strong> with co-NI the ne(r)<br />
profiles stay flat with Qn « 1.2-1.3 for H + <strong>and</strong> «1.3-1.4 for D + . With IOC or<br />
ctr-NI (up to the highest power levels) peaked nn decreases in the case of enforced density rise.<br />
Transitions between confinement regimes. The development of the improved<br />
confinement regimes presented above may be tentatively described as follows. Upon<br />
reduction of $gas, the particle confinement improves <strong>and</strong> the n
2 /s)<br />
I.OH<br />
O.I-<br />
10-<br />
Im 2 /sl<br />
10-<br />
0.1<br />
<strong>IAEA</strong>-CN-50/A-m-l 153<br />
soc<br />
#17 529 co-NI(L)<br />
# 23 349 -57<br />
1.8-2.1 s<br />
#21621<br />
t = 1.715 s<br />
ctr .<br />
05 r/a 10 0 0.5 r/a<br />
FIG. 6. Radial profiles of electron <strong>and</strong> ion heat diffusivities \e <strong>and</strong> Xifrom transport code calculations<br />
for regimes of degraded confinement (SOC, co-NI) <strong>and</strong> of improved confinement (IOC, ctr-NI).<br />
L-periods. After a transition, ne rises throughout the H-phase; j3p, however, rises<br />
only transiently <strong>and</strong> decreases thereafter. These observations suggest that the advantage<br />
of peaked n^r) profiles cannot be maintained after the H-transition as the<br />
H-mode broadens n,.(r).<br />
Transport studies. In a comparison study the transport in the IOC <strong>and</strong> SOC<br />
regimes <strong>and</strong> with co- <strong>and</strong> ctr-NI, respectively, has been analysed using the TRANSP<br />
code [6]. The radial variation of xe is determined such that agreement with the<br />
measured plasma parameters <strong>and</strong> profiles is obtained. The ion heat conductivity<br />
coefficient XJ is taken from theory <strong>and</strong> put into the model.<br />
The Xi models used are either the neoclassical XCH as given in Ref. [7], or the<br />
sum of XCH an d X^i a s given in Ref. [8]. These assumptions were based on<br />
experience in analysing previous SOC <strong>and</strong> L-mode co-NI cases on one h<strong>and</strong>, <strong>and</strong><br />
pellet refuelled plasmas with peaked density profiles on the other [9]. Radial profiles<br />
of the heat diffusivities are shown in Fig. 6 for the degraded <strong>and</strong> improved confinement<br />
regimes. The low confinement cases with broad density profiles can consistently<br />
be described with an anomalous ion heat diffusivity due to ion temperature<br />
gradient (ITG) driven turbulence. For the cases of peaked density profiles the<br />
parameter r;, = d In T/d In r^ is strongly reduced to values near or even below 1,<br />
over most of the plasma cross-section. Under this condition ITG modes should be<br />
stabilized. In fact, in TRANSP calculations these cases can be described with<br />
neoclassical ion heat transport only. Additionally, the electron transport seems to be<br />
IOC
154 FUSSMANN et al.<br />
reduced. With ctr-NI the energy loss is dominated by neoclassical ion heat conduction<br />
<strong>and</strong> radiation. Therefore, the xe values derived are subject to large uncertainties.<br />
The transport studies show that ITG turbulence provides an appropriate<br />
mechanism to describe the change in transport properties for the whole class of<br />
improved confinement regimes characterized by peaked n,,(r) profiles. In this<br />
respect, the IOC regime, ctr-NI <strong>and</strong> pellet refuelled discharges <strong>and</strong> their counterparts<br />
are governed by the same ion transport mechanisms.<br />
Particle <strong>and</strong> angular momentum confinements are improved together with<br />
energy confinement in all these regimes. Local values of the particle diffusion<br />
coefficient Dp <strong>and</strong> the inward drift velocity vin were determined with gas oscillation<br />
experiments [10]. Going from the SOC to the IOC regime, a drop Dp = 0.5 —•<br />
0.06 m 2 /s is found in the outer plasma region. The impurity confinement time<br />
increases. The decay time of a Ti(XX) line (introduced by laser blow-off) rises from<br />
55 ms in SOC to 185 ms in IOC. In spite of the increase of the momentum of inertia<br />
due to the density rise during ctr-NI, the toroidal rotation velocity V* increases<br />
continuously. Figure 5 compares the rotation velocity for the co- <strong>and</strong> ctr-NI cases<br />
described above. The momentum confinement time T$ roughly doubles <strong>and</strong> is<br />
comparable with the energy confinement time in both cases.<br />
IMPURITY ACCUMULATION<br />
A close link between energy <strong>and</strong> particle transport is observed at the transitions<br />
from SOC to IOC <strong>and</strong> from co- to ctr-NI. As this correlation has also been observed<br />
at the transition from L- to H-mode we conclude that it is a fundamental characteristic<br />
of tokamak transport. A consequence of this link is the accumulation of high Z impurities<br />
in the plasma core in good confinement regimes. Only in the IOC regime does<br />
the central impurity concentration saturate at a tolerable level owing to non-vanishing<br />
sawtooth activity.<br />
In the following we will concentrate on ctr-NI, where the accumulation<br />
phenomena are strongly pronounced <strong>and</strong> highly reproducible. In the late phase sawteeth<br />
are damped out <strong>and</strong> the intrinsic impurity transport prevails. During this phase<br />
bolometer array measurements reveal strong peaking of the radiation profiles; the<br />
central radiation density increases by, typically, a factor of 6 within 0.2 s, finally<br />
reaching values as high as pra(j(O) ~ 1.2 W/cm 3 , which largely exceed the total<br />
heating power density of ~0.4 W/cm 3 . This pronounced peaking of the total radiation<br />
is caused by the accumulation of Cu, the dominant metallic impurity [11]. Light<br />
impurities (C, O) contribute to this core radiation only about 0.05 W/cm 3 . It is<br />
therefore possible to determine the Cu density from the total radiation density by<br />
taking prad = LCu nCu n^. The radiation rates LQ, have been obtained from code<br />
calculations. These calculated rates are nearly unaffected by particle transport <strong>and</strong><br />
depend only weakly on temperature in the range of interest Te0 = 0.7-1.2 keV<br />
(LCu = (1.7-1.9) x 10- 26 W-cm 3 ). Central Cu concentrations ncu(0)/ne(0) deter-
10<br />
.1 8<br />
I 6<br />
o<br />
^ 4<br />
(0<br />
c:<br />
O<br />
-<br />
)0<br />
<strong>IAEA</strong>-CN-50/A-IH-l 155<br />
t = 1 545 s<br />
20<br />
r (cm)<br />
30<br />
12<br />
•0.8 5<br />
g.<br />
0.4 J<br />
• ^ '<br />
y<br />
Experiment<br />
Theory<br />
Cu (%o)<br />
« 25602<br />
1.1 1.2 1.3 1.4 1.5 1.6<br />
Time (s)<br />
FIG. 7. Development of the central concentrations for C <strong>and</strong> Cu during ctr-NI (D° — D + , 0.9 MW).<br />
Experimental values (solid lines) are derived from bolomelry for Cu <strong>and</strong> CXR spectroscopy for C <strong>and</strong><br />
compared with numerical results (dotted lines) from transport code calculations. The insert shows<br />
measured <strong>and</strong> calculated radiation profiles at the end of the accumulation phase.<br />
mined in this way are shown in Fig. 7. The final concentration obtained during the<br />
radiation collapse phase (t > 1.5 s) is ~0.7%. These results are consistent with<br />
infrared bremsstrahlung measurements. There an increase of Zeff{0) from 2.1 (for<br />
t < 1.3 s) to 3.3 at t = 1.45 s is observed, corresponding to an increment of<br />
Ancu(0)/ne(0) = 0.4%. In contrast to this marked increase of Zeff in the plasma<br />
centre, no changes are observed in the outer region (Zeff (r/a = 5/8) = 2.3).<br />
In addition, direct measurements of the C-density at four different radii (r = 5,<br />
15, 25, 35 cm; a = 40 cm) have been performed by means of CX spectroscopy. The<br />
temporal variations of the C-concentrations nc/n,. are found to be surprisingly small<br />
at all radii. The trace for the innermost position, r = 5 cm, is also shown in Fig. 7.<br />
Obviously there is no indication of accumulation of C from these measurements. It<br />
should be noted that the absolute value of the plotted C-concentration has been determined<br />
from Zeff{0) measurements at early times (t ~ 1.2 s) assuming an oxygen/<br />
carbon ratio of 2/1 as measured in the boundary region. The absolute values obtained<br />
from CX measurements are about two times higher. They depend, however, sensitively<br />
on the proper recombination cross-sections <strong>and</strong> ion f-mixing collisions.<br />
In order to assess whether our experimental results can be understood in terms<br />
of neoclassical transport they are compared with corresponding code predictions. Our<br />
basic concept is the assumption that under normal low confinement conditions the<br />
stationary state is characterized by a balance between neoclassical inward fluxes <strong>and</strong><br />
anomalous diffusive outward fluxes. Turbulence enhances the anomalous diffusion<br />
coefficient under low confinement conditions to values of about Dan ~ 0.6 m 2 /s, so<br />
that the relatively large neoclassical inward convective drift of the order of 1.3 m/s<br />
at r = a/2 is compensated. In cases of improved confinement, Dan is decreasing,
156 FUSSMANN et al.<br />
<strong>and</strong> consequently steeper gradients in the impurity density develop to compensate for<br />
the neoclassical inward fluxes. Pure neoclassical transport will prevail if Dan drops<br />
below the typical neoclassical values of 0.05-0.1 m 2 /s.<br />
A satisfactory description of the impurity evolution is obtained when the<br />
homogeneous anomalous diffusion coefficient of 0.6 m 2 /s within an inner region of<br />
r/a < 0.75 is ramped down during a period of 100 ms starting 50 ms after the<br />
beginning of NI heating <strong>and</strong> is then kept fixed at a base level of 0.05 m 2 /s. In these<br />
code simulations we use the measured iie(r,t) <strong>and</strong> Te(r,t) profiles <strong>and</strong> adopt the<br />
neoclassical transport terms specified in Ref. [12]. Furthermore, a constant particle<br />
impurity influx from the boundary is assumed. This influx essentially determines the<br />
level of impurity density, but otherwise is not a sensitive parameter, since the major<br />
contribution to accumulation is from the particles already in the plasma. The numerical<br />
results obtained for the central Cu- <strong>and</strong> C-concentrations are also depicted in<br />
Fig. 7 (dotted curves). The agreement with the experimental curves for Cu is quite<br />
satisfactory, but not for C. In the latter case, an increase by a factor of ~4 is<br />
predicted, but is not confirmed by the CX measurements. On the other h<strong>and</strong>, the<br />
calculated Cu radiation profiles also reproduce fairly well the progressive peaking of<br />
the measured ones. Both profiles are shown in the insert of Fig. 7 for the final<br />
accumulation stage at t = 1.50 s.<br />
CONCLUSIONS<br />
On ASDEX we have established further good confinement regimes which can<br />
be fully controlled by the external parameters. They are characterized by peaked<br />
density profiles. The evidence for reduced ion transport under these circumstances<br />
has increased. The importance of recycling control — familiar from H-mode studies<br />
— is further stressed <strong>and</strong> seems a common requirement for all good confinement<br />
regimes [13]. This clearly emphasizes the need to underst<strong>and</strong> the role of the edge<br />
effects for confinement to be in a position to optimize the divertor geometry.<br />
It is not yet clear whether recycling directly affects the transport conditions at<br />
the edge [14] or whether it determines the confinement through its impact on edge<br />
parameters. In the H-mode, Dp is sharply reduced at the edge, as is clearly indicated<br />
by density fluctuation studies <strong>and</strong> the reduction of the density fall-off length in the<br />
SOL. No comparable changes are observed in the IOC regime or with ctr-NI.<br />
In the transition from L- to H-mode, ii,, <strong>and</strong> Te increase within a few centimetres<br />
inside the edge; in the transition from SOC to IOC, n
<strong>IAEA</strong>-CN-50/A-in-l 157<br />
assumed that this link is due to turbulent effects which provide anomalous contributions<br />
to heat conductivity <strong>and</strong> particle diffusion. A reduction of turbulence has a<br />
beneficial effect on energy confinement but is detrimental in particular with respect<br />
to impurity confinement because of the suppression of outward diffusive fluxes.<br />
Comparing experimental radiation profiles with numerical simulations we find<br />
that neoclassical transport can explain — at least approximately — the temporal <strong>and</strong><br />
spatial development of the accumulation of metal impurities. In this context it is<br />
important to note that it is sufficient for severe accumulation problems to occur if<br />
neoclassical transport prevails within an inner region of r/a < 0.5 only. The<br />
pronounced peaking of the proton density profile is predicted to enhance accumulation<br />
significantly. On the other h<strong>and</strong>, flat or even hollow proton profiles would be<br />
required to avoid accumulation problems completely.<br />
The situation for the light impurities (C, O) is still controversial. Substantial<br />
accumulation is postulated for these low Z particles by neoclassical theory as well.<br />
The predicted concentrations for the core region ( — 8%) are rather large, <strong>and</strong> substantial<br />
proton dilution effects should occur. No indications, however, are found from<br />
CX measurements for such a strong accumulation in the case of C.<br />
REFERENCES<br />
[1] KAUFMANN, M., et al., Nucl. Fusion 28 (1988) 827-848.<br />
[2] NIEDERMEYER, H., et al., in Controlled Fusion <strong>and</strong> Plasma Heating (Proc. 15th Eur. Conf.<br />
Dubrovnik, 1988), Vol. 12B, European Physical Society (1988); to be published in Plasma Phys.<br />
Control. Fusion.<br />
[3] SOLDNER, F.X., et al., Phys. Rev. Lett. 61 (1988) 1105.<br />
[4] GEHRE, O., et al., Phys. Rev. Lett. 60 (1988) 1502.<br />
[5] MURAKAMI, M., et al., "Beta scaling experiments in ISX-B", Plasma Physics <strong>and</strong> Controlled<br />
<strong>Nuclear</strong> Fusion Research 1982 (Proc. 9th Int. Conf. Baltimore, 1982), Vol. 1, <strong>IAEA</strong>, Vienna<br />
(1983) 57-72.<br />
[6] GOLDSTON, R.J., et al., J. Comput. Phys. 43 (1981) 61.<br />
[7] CHANG, C.S., HINTON, F.L., Phys. Fluids 29 (1986) 3314.<br />
[8] LEE, S.C., DIAMOND, P.H., Phys. Fluids 29 (1986) 3291.<br />
[9] GRUBER, O., et al., in Controlled Fusion <strong>and</strong> Plasma Heating (Proc. 15th Eur. Conf.<br />
Dubrovnik, 1988), Vol. 12B, European Physical Society (1988); to be published in Plasma Phys.<br />
Control. Fusion.<br />
[10] GENTLE, K.W., RICHARDS, B., WAELBROECK, F., Plasma Phys. 29 (1987) 1077.<br />
[11] JANESCHITZ, G., et al., in Proc. 8th Int. Conf. on Plasma-Surface Interactions in Controlled<br />
Fusion Devices, Julich, 1988, to be published.<br />
[12] FUSSMANN, G., et al., ibid.<br />
[13] DYLLA, H.F., et al., Nucl. Fusion 27 (1987) 1221-1230.<br />
[14] THAYER, D.R., DIAMOND, P.H., Phys. Fluids 30 (1987) 3724.
THE JET H-MODE AT HIGH CURRENT<br />
AND POWER LEVELS<br />
JET TEAM*<br />
(Presented by M. Keilhacker)<br />
JET Joint Undertaking,<br />
Abingdon, Oxfordshire,<br />
United Kingdom<br />
Abstract<br />
<strong>IAEA</strong>-CN-50/A-HI-2<br />
THE JET H-MODE AT HIGH CURRENT AND POWER LEVELS.<br />
H-mode operation in JET single-null X-point configuration has been extended to plasma<br />
currents of 5MA, toroidal fields of 3.4T<strong>and</strong> neutral beam powers of 20MW (80keV deuterium<br />
injection). Characteristic of JET H-mode discharges is the absence or very low<br />
level of ELM activity resulting in a continuous rise in plasma density <strong>and</strong> a concomitant<br />
increase in bulk plasma radiation which finally terminates the H-phase (longest H-phase<br />
so far, 4s). The global energy confinement time, TE , of these H-mode discharges is a factor<br />
of 2-3 larger than in comparable limiter discharges. The confinement increases roughly<br />
linearly with plasma current (provided q95 > 3) <strong>and</strong> to a lesser extent with toroidal magnetic<br />
field but decreases with increasing neutral beam heating power (roughly
160 JET TEAM<br />
in the main equilibrium coils has allowed H-mode operation in the single null<br />
X-point configuration to be extended to plasma currents of 5 MA, full toroidal<br />
fields of 3.4T <strong>and</strong> neutral beam powers of 20MW. With the global energy confinement<br />
time, TE, increasing roughly linearly with current (provided the safety<br />
factor at the 95 % flux surface, q95 s 3)TE values in the range 0.8-1 s <strong>and</strong> stored<br />
plasma energies of more than 10MJ have been achieved with 12MW of additional<br />
heating. H-modes have also been obtained in the double null configuration<br />
with currents up to 3 MA (technical limit :S4MA).<br />
The present discussion of JET H-mode plasmas is restricted to NBI heating<br />
(80keV deuterium injection) of deuterium plasmas in a single null X-point configuration.<br />
Following a brief discussion of the operational limits for achieving<br />
H-modes (section 2) the paper addresses the characteristic features of these<br />
plasmas (section 3). Section4 is devoted to their energy confinement while<br />
section 5 addresses particle control <strong>and</strong> future prospects for H-mode operation.<br />
2.0<br />
1.0<br />
g><br />
f 0<br />
o<br />
•c<br />
><br />
-1.0<br />
-2.0<br />
Pulse No: 18683<br />
I = 5MA<br />
Inner wall -<br />
1.0<br />
2.0 3.0<br />
Major radius (m)<br />
Target<br />
plates<br />
Lower<br />
belt limiter<br />
Fig. 1 Poloidal flux contours for a 5 MA single null X-point discharge.<br />
2. Operational Limits for H-mode<br />
Fig. 1 shows poloidal flux contours for a 5 MA single null X-point discharge<br />
together with a schematic view of the vacuum vessel, the upper <strong>and</strong> lower toroidal<br />
belt limiters <strong>and</strong> the target plates at the top <strong>and</strong> bottom of the vessel. To
<strong>IAEA</strong>-CN-50/A-IH-2<br />
achieve an H-mode, minimum separations of the separatrix from the inner wall,<br />
bIW, <strong>and</strong> from the lower belt limiter, bBL, are required. The precise clearances<br />
required depend on vessel conditioning, plasma parameters <strong>and</strong>, in particular,<br />
on the heating power used. Typical values are<br />
bBL a: 0.05 m bIW 3:0.05 -0.08 m<br />
The separation of the X-point position from the target plates was, for most experiments,<br />
in the range of a few centimetres, but it can be reduced practically to zero.<br />
The most stringent requirement for achieving an H-mode is a certain level<br />
of heating power. In JET, this threshold power, Pthr, increases with toroidal magnetic<br />
field, BT, as shown in Fig. 2 for 3 MA single null X-point discharges. Typical<br />
values with NBI are<br />
for£r=2.0-2.4T<br />
for£T=3.0-3.4T<br />
A low density limit is set for H-modes by the appearance of locked modes.<br />
The edge plasma density at the start of NBI has to be > 1.2x 10 19 m~ 3 (see also<br />
discussion in section 3.3).<br />
PNB<br />
(MW)<br />
20<br />
16<br />
12<br />
I = 3MA<br />
Single null<br />
• *<br />
******<br />
***<br />
i<br />
* *<br />
A *<br />
2.0 2.5<br />
BT(T)<br />
*<br />
3.0 3.5<br />
Fig. 2 H-mode threshold power as a function of toroidal magnetic field<br />
is determined by distinguishing H-mode (*) <strong>and</strong> L^mode (A) discharges<br />
at 3 MA, single null X-point.<br />
161
162 JET TEAM<br />
3. H-mode Characteristics<br />
3.1 Time evolution of H-mode discharges<br />
The characteristic time evolution of various plasma parameters for JET H-mode<br />
discharges is shown in Fig. 3 for a 3 MA discharge (# 15894). Characteristic of<br />
most JET H-modes is the absence or very low level of ELM activity throughout<br />
the whole H-mode phase. This results in a continuous rise in plasma density<br />
<strong>and</strong> a concomitant increase in bulk plasma radiation which finally terminates<br />
the H-mode (longest H-phase — 4 s) when the bulk radiation reaches about 60%<br />
of the input power. The increase in the total energy content of the plasma, W,<br />
during the H-phase results largely from the plasma density increase, while the<br />
central electron temperature, Teo, is roughly constant or even decreasing slightly<br />
with time.<br />
>
6.0<br />
40<br />
2.0<br />
(a) 0l=.<br />
5.0<br />
(c) 0<br />
Pulse No: 15894<br />
J t= 16.0s<br />
ne(LIDAR) (*' V-.<br />
Te (LIDAR)<br />
2.0 2.4 2.8 3.2 3.6 4.0<br />
Major radius (m)<br />
2.0 2.4 2.8 3.2 3.6<br />
Major radius (m)<br />
<strong>IAEA</strong>-CN-50/A-III-2 163<br />
5.0 -<br />
4.0<br />
3.0<br />
2.0<br />
1.0 -<br />
0<br />
\A / A<br />
\ y»A/S~^<br />
_ t =<br />
A_,=<br />
i<br />
3.0<br />
i<br />
3.4<br />
i<br />
3.8<br />
Major radius (m)<br />
\<br />
\<br />
14s<br />
2.6<br />
A<br />
0.4 0.6 0.8<br />
x = r/a<br />
Fig. 4 Radial profiles of (a) electron density, ne, electron temperature, Te, <strong>and</strong> ion temperature,<br />
T-,\ (b) Zeff\ (c) bulk plasma radiation, Pg^p (bulk), <strong>and</strong> (d) current density during<br />
the H-phase of the discharge shown in Fig. 3. The dashed lines in Fig. 4a indicate the radius<br />
of the 95% flux surface.<br />
\<br />
\<br />
16s
164 JET TEAM<br />
This occurs, however, at the expense of simultaneously reducing the energy confinement<br />
time (see discussion in section 5).<br />
3.2 Evolution of plasma profiles<br />
Typical radial profiles of ne, Te, Th Zeff, PRAD <strong>and</strong> j during the H-mode phase<br />
are shown in Fig. 4 for discharge # 15894. Fig. 4a shows radial profiles of electron<br />
density neir) <strong>and</strong> temperature Te(r) at t=16.0s (1.25 s into the H-phase),<br />
as measured by the LIDAR-Thomson scattering system' 61 . The most characteristic<br />
feature of these profiles are the very steep temperature <strong>and</strong> density gradients<br />
at the plasma edge (giving rise to so-called pedestals) which form at the L->H<br />
transition. Flat or even slightly hollow density profiles are a common feature<br />
of both JET limiter (particularly at low values of qcyj) <strong>and</strong> X-point discharges' 71<br />
employing NBI heating. In the case of an H-mode the density increases continuously,<br />
the profile shape changing little. The electron temperature profile is<br />
also broad <strong>and</strong> changes little with time. Fig. 4a also displays the central ion temperature<br />
profile as determined from charge-exchange spectroscopy' 81 on the CVI<br />
(8-»7) line. Within the accuracy of the measurements the two temperatures are<br />
equal.<br />
Fig. 4b displays radial profiles of Zejj determined from chord measurements<br />
of the visible bremsstrahlung emission at 523.5 nm using a 15-telescope array' 91<br />
together with ne(f) <strong>and</strong> Te(f) profiles from the LIDAR diagnostic. During the<br />
limiter phase that precedes the X-point phase (not shown in Fig. 4b) the profile<br />
Zeff(r) is peaked on axis, with an average value Zeffoi ~ 2.5. Following the formation<br />
of the X-point, Zef/f) becomes hollow on axis (profile at /=14.0s)<br />
without much change in Zeff. The second profile pertains to the H-phase at<br />
/=16.0s. Zef/r) remains hollow, but Zeff has increased to ~3.3, due to the<br />
improvement in impurity <strong>and</strong> particle confinement.<br />
The evolution of the radiated power profile is shown in Fig. 4c for /=15.0,<br />
16.0 <strong>and</strong> 17.0s. Again the profiles are hollow throughout the H-phase but tend<br />
to fill in somewhat with time. Most of this radiation is emitted by light impurities,<br />
the major contribution coming from oxygen. The observed profiles of<br />
radiated power <strong>and</strong> Zej!rindicate hollow profiles of the light impurity densities' 101 .<br />
This is substantiated by charge-exchange spectroscopy measurements. Typical<br />
concentrations on axis are 1 - 3 % of the electron density for O <strong>and</strong> for C <strong>and</strong><br />
10~ 5 -10~ 4 for Ni. The deuterium density is typically ~0.6ne due to dilution<br />
by (light) impurities.<br />
Fig. 4d shows the evolution of the current profile determined from the multichannel<br />
FIR polarimeter [ul . During the H-phase the current density at the<br />
plasma periphery rises markedly. This is expected since (a) the resistivity is
<strong>IAEA</strong>-CN-50/A-III-2 165<br />
reduced in the edge region due to the increased edge electron temperature <strong>and</strong><br />
(b) a large bootstrap current' 121 develops due to the increased edge pressure gradient.<br />
A concomitant decrease of the central current density is also observed,<br />
although experimental uncertainties preclude any definitive conclusion being<br />
drawn.<br />
To determine the bootstrap current, a magnetic field diffusion analysis has<br />
been completed using the TRANSP code' 131 . It is found that the bootstrap current<br />
contributes 0.8 MA to the total current of 3 MA <strong>and</strong> most of the change<br />
in the current profile (see Fig. 4d) comes from the development of the bootstrap<br />
current rather than changes in the plasma resistivity. The existence of the bootstrap<br />
current in 'supershots' [14] <strong>and</strong> H-modes [15] has important consequences<br />
for future high temperature tokamaks. The most beneficial effect is that it reduces<br />
the volt-second consumption required to maintain a given current. The broad<br />
profile of the bootstrap current may also stabilise the m/n=1/1 sawtooth oscillation.<br />
3.3 Edge plasma<br />
The plasma edge parameters play a decisive role in the transition to an H-mode<br />
<strong>and</strong> in the resulting improved confinement properties of the plasma. The simultaneous<br />
measurement of ne <strong>and</strong> rc-profiles at the plasma edge using the LIDAR<br />
diagnostic allows a critical assessment. Fig. 5 shows a plot of Tedge versus nedge<br />
for 3 MA single null X-point discharges (BT=2.2T). Tedge <strong>and</strong> nedge are the temperatures<br />
<strong>and</strong> densities taken at the surface determined by equilibrium analysis<br />
to enclose 95 % of the total magnetic flux enclosed by the separatrix. The measurements<br />
are at various times during OH, L <strong>and</strong> H-phases determined by the<br />
timing <strong>and</strong> frequency of the laser pulse (0.5Hz). The domain of edge parameters<br />
for an H-mode displays a well-defined lower density limit of ~2xl0 19 m" 3<br />
(increasing to ~ 3 x 10 19 m~ 3 at BT=3.0- 3.5T) <strong>and</strong> a minimum edge temperature<br />
of ~0.5keV.<br />
These boundaries may be interpreted in terms of the collisionality of the edge<br />
plasma <strong>and</strong> the requirement to limit edge cooling by ionisation of neutral particles<br />
re-entering the plasma from the wall (see also discussion in section 3.5).<br />
The former condition, namely that the ion neoclassical collisionality parameter<br />
Vj* < 1, is plotted in Fig. 5, <strong>and</strong> shows that H-modes correspond to low collisionality<br />
in the plasma edge. The latter condition requires that the ionisation<br />
mean-free path of incoming neutrals, X,-^, be small compared to the thickness<br />
of the edge layer, 8B. The boundary X,-^ = 8B is a l so plotted in Fig. 5, where<br />
8B is taken as the width of an ion banana orbit <strong>and</strong> X,-^ is evaluated for 5eV<br />
deuterium atoms.
166 JET TEAM<br />
1.5<br />
1.0<br />
0.5<br />
X(D5eV) «5B<br />
* * *<br />
\A* ^ ^ ***? **- ** *<br />
Pulse Nos:<br />
15600-18674<br />
I = 3MA, B = 2.2T<br />
" 0 2 4 6<br />
<strong>IAEA</strong>-CN-50/A-HI-2 167<br />
near the first stability boundary. These preliminary results suggest that the pressure<br />
gradients are lower than would be required by the bifurcation model of<br />
Bishop [17] . Nevertheless they indicate that the edge pressure gradients in the<br />
H-mode are sufficiently steep that ideal ballooning stability becomes relevant.<br />
Furthermore the current density parameter A is found to be consistent with the<br />
critical value needed for coalescence.<br />
3.5 Divertor plasma<br />
The plasma in the vicinity of the X-point target plates (divertor plasma) has<br />
been investigated with an array of eight Langmuir probes mounted in the target<br />
plates (see inset in Fig. 6), with a reciprocating Langmuir probe (at R=3.25 m),<br />
<strong>and</strong> with a 2-dimensional view of the radiation from the divertor region.<br />
Fig. 6 shows profiles of density, temperature <strong>and</strong> ion saturation current in front<br />
of the target plates for a 4.6 MA discharge (OH <strong>and</strong> H-phase with PNBI=14 MW).<br />
Although a single-null discharge, the inner divertor plasma is colder <strong>and</strong> denser<br />
than the outer. More power is carried to the outer divertor, suggesting that the<br />
main source of power flow into the scrape-off layer is in the vicinity of the outer<br />
mid^plane, ie, closer to the outer divertor target. The unequal temperatures lead<br />
to thermo-electric currents in the scrape-off layer [18 l Current densities<br />
g 10 5 AnT 2 have been measured during the H-phase (see Fig. 6) corresponding<br />
to more than 10% of the mean current density in the discharge. The scrape-off<br />
layer current flows from outer to inner divertor <strong>and</strong> returns through the target<br />
plates, thus flowing in the same direction as the plasma current.<br />
The power estimated to be carried by plasma to the target plates increases<br />
from 0.8MW in the ohmic phase to 1.9MW at the end of the H-phase. For most<br />
of the discharge, i.e. L <strong>and</strong> H-phases, this is about 15% of (Ptotal-dWdia/df)<br />
but about 25% during the ohmic phase.<br />
Profiles with the reciprocating probe in the scrape-off layer agree reasonably<br />
well with those at the divertor target. Preliminary results for two or three pulses<br />
show that the radial electric field, just inside the separatrix, Er = - (d Vp/asma)/dr<br />
is negative in the ohmic phase <strong>and</strong> about + 5 kVnT 1 with H-mode. This result,<br />
if substantiated, would agree with the prediction of Itoh <strong>and</strong> Itoh [19] .<br />
The collisionality of the divertor plasma may have a bearing on whether an<br />
H-mode can be achieved. Two aspects of collisionality are considered: Coulomb<br />
collisions with electrons, <strong>and</strong> ionisation of neutral particles in the divertor plasma.<br />
For Coulomb collisions, the Coulomb mean free path, Xee, is compared with<br />
the distance Ln in the divertor measured along a field line from the target to<br />
the X-point. With the X-point typically 0.10m from the target <strong>and</strong> a pitch angle<br />
of the field lines of ~ 1°, Ln«6m. Fig.7 shows probe measurements of Te<br />
plotted against ne on a logarithmic scale. The straight line represents Xee = 6 m:
168 JET TEAM<br />
— 100<br />
50-£<br />
20<br />
10<br />
5<br />
10<br />
-5<br />
•5 -<br />
><br />
'I<br />
\ H<br />
' CO<br />
L<br />
/<br />
• (<br />
c<br />
1<br />
o<br />
1<br />
s<br />
X<br />
separat<br />
\<br />
T<br />
1<br />
0<br />
100<br />
• i<br />
i i<br />
^P2_P3<br />
P1<br />
1/ Xpt. \<br />
200mm:<br />
i<br />
i i<br />
H<br />
OH<br />
#18341<br />
I i i i i<br />
P1 P2 P3 P4 P5 P6 P7 P8<br />
Probe number (see inset)<br />
A<br />
•<br />
IIII<br />
10<br />
5<br />
2<br />
1 E<br />
0.5 E<br />
Fig. 6 Profiles of density, temperature <strong>and</strong> ion saturation current in front of the target plates,<br />
measured with Langmuir probes mounted in these plates.<br />
• OH (11.5s)<br />
• 1-1(12.8- 13.6s)<br />
P1...P8; probe positions (see Fig.6)<br />
-0.2<br />
Fig.7 Collisionality of the plasma in the vicinity of the X-point target plates.
<strong>IAEA</strong>-CN-50/A-III-2 169<br />
plasmas with parameters above (below) this line are collisionless (collisional).<br />
The parameters for the probes PI to P8 are shown for OH <strong>and</strong> H phases. The<br />
inner scrape-off layer is cold enough to be highly collisional. The outer scrapeoff<br />
layer is collisional during the ohmic phase <strong>and</strong> marginally collisional during<br />
the H phase. Discharges at lower currents tend to be slightly less collisional<br />
<strong>and</strong> vice-versa.<br />
The ionisation of neutrals in the divertor plasma fan is assessed by comparing<br />
the ionisation mean free path of neutrals, X^, with the dimensions of the<br />
divertor plasma which is typically O.I m. Fig. 7 shows a curve corresponding<br />
to X,^ for 5eV deuterium atoms, typical of dissociation energies. During the<br />
H-phase the majority of 5eV atoms would be ionised in the divertor plasma<br />
but some of those from further out in the divertor scrape-off layer might escape.<br />
Thus during the H-phase the plasma is highly recycling in the divertor, especially<br />
near the separatrix.<br />
These results suggest that flows in the scrape-off layer have a low Mach number,<br />
or are nearly stagnant, near the sepaFatrix but are stronger <strong>and</strong> towards the divertor<br />
further away from the separatrix. As discussed in ref. [20,21 ] flow reversal<br />
occurs near the separatrix <strong>and</strong> plasma also leaves the divertor. This outflow from<br />
the divertor, which is stronger during the H-phase, might correspond to an influx<br />
of deuterium into the bulk plasma. This would lead to a density increase, as<br />
observed in JET <strong>and</strong> other tokamaks during the H-phase. Additional impurity<br />
flow from the divertor could ensue.<br />
4. Energy Confinement<br />
4.1. Scaling of global energy confinement<br />
The dependence of global energy confinement on plasma current <strong>and</strong> heating<br />
power is discussed for ELM-free H-modes in single null X-point configurations.<br />
Fig. 8 shows the plasma energy f-Ffrom diamagnetic measurements (Fig. 8a) <strong>and</strong><br />
global energy confinement time TE = W/(Ptot - d W/dt) (Fig. 8b) as a function<br />
of the total net input power (Ptot—d W/dt) for plasma currents of 2, 3, 4 <strong>and</strong><br />
5 MA. The limited amount of data at the highest current of 5 MA were obtained<br />
during the last week of operation <strong>and</strong> the discharges were probably not fully<br />
optimised. In all experiments the power range in which ELM-free H-modes could<br />
be obtained was limited to Ptot = (PNB + POH)^14MW (see section 5).<br />
The data shown in Fig. 8 exhibit two main trends: a roughly linear increase<br />
of W<strong>and</strong> TE with plasma current <strong>and</strong> a degradation of confinement with heating<br />
power. Part of this degradation with power can be attributed to increased<br />
impurity radiation <strong>and</strong> poor beam penetration at the higher densities concomitant<br />
with higher neutral beam powers. The data at 3 MA <strong>and</strong> 4MA which span
170<br />
10<br />
1.0<br />
H-mode<br />
JET TEAM<br />
5 10<br />
[Ptot-dW/dt] (MW)<br />
..---"2 MA<br />
a 2MA B2.5T<br />
H-mode<br />
W/P2.5T<br />
5 10 15<br />
[Pt0, - dW/dt] (MW)<br />
Fig. 8 (a) Plasma energy <strong>and</strong> (b) global energy confinement time in ELM-free H-mode<br />
plasmas versus total net input power for currents of 2, 3,4 <strong>and</strong> 5 MA. The dashed lines correspond<br />
at each current to (a) off-set linear fits to the data <strong>and</strong> (b) twice Goldston scaling.<br />
15
I<br />
3s<br />
H-mode<br />
8
172 JET TEAM<br />
time scales with current as TE~I 12±0A . The constant is fitted at /=3MA,<br />
B=2.5T, =4x 10 19 m" 3 <strong>and</strong> P=10MW. It was assumed in this analysis that<br />
the variables Wdia, I, B, <strong>and</strong> P have been measured with constant relative<br />
(r<strong>and</strong>om) errors of 10%, 1 %, 1 %, 5% <strong>and</strong> 5% respectively. Fig. 10 shows<br />
the observed versus fitted energy confinement times. In deriving such scaling<br />
laws it has to be kept in mind, of course, that the plasma confinement depends<br />
also on hidden parameters, such as vessel conditioning, which are difficult to<br />
assess.<br />
1.5<br />
1.0<br />
H-mode<br />
W/P
<strong>IAEA</strong>-CN-50/A-HI-2 173<br />
The steep temperature <strong>and</strong> density gradients at the plasma edge (pedestals)<br />
characteristic of H-phase suggest the separation of the edge <strong>and</strong> central confinement<br />
properties. To this end the kinetic energy of the plasma has been split<br />
into the contributions from the edge pedestal<br />
<strong>and</strong> from the plasma core Wc=W-Wp, where Vp is the plasma volume inside<br />
a certain radius rp, chosen to be 0.95a.<br />
Fig. 11 shows the result of this analysis for 3 MA H-mode discharges.Wwhen<br />
plotted against (Ptot - d W/dt), Wc -W-Wp, like W, is of offset linear form,<br />
indicating degradation with input power. The pedestal energy WP(Q.95),<br />
however, shows no offset indicating little or no degradation with heating power.<br />
Thus, H-mode confinement (at least up to 12MW heating powers) may be considered<br />
in terms of a power independent contribution from the plasma edge <strong>and</strong><br />
a power dependent contribution (degraded, L^mode like confinement) from the<br />
plasma core.<br />
10<br />
H-mode<br />
3MA<br />
5 10<br />
[P,o,-dW/dt](MW)<br />
W<br />
W-Wp<br />
...--i" Wp(0.95)<br />
Fig. 11 Plasma energy in pedestal, Wp, <strong>and</strong> plasma core, Wc = W— Wp, respectively, versus total<br />
net input power for 3 MA H-mode discharges {BT< 2.7 T).<br />
15
174 JET TEAM<br />
4.2. Local transport analysis<br />
The time dependent energy balance code, TRANSP 1131 has been used to determine<br />
the total heat flux through surfaces in the interior of the plasma during<br />
the OH-, L- <strong>and</strong> H-phases of a number of JET pulses. The input comprises the<br />
magnetic flux surface geometry, temporal variation of the electron density profile<br />
(Abel inverted FIR Interferometer data, checked against LIDAR data when available),<br />
electron temperature profile (ECE, checked against LIDAR data when<br />
OH<br />
.1<br />
E 4-<br />
p = 0.75<br />
p = 0.5<br />
13<br />
6-<br />
E_ 4<br />
E. 4<br />
x<br />
6--<br />
2<br />
L<br />
I L<br />
I<br />
_ Vl/L<br />
14 15<br />
Time (s)<br />
i<br />
16<br />
H<br />
1<br />
t = 14.7s/ /<br />
,'/<br />
/ 1<br />
/; /<br />
// 1<br />
// / /<br />
' /<br />
t = 14.3S/V'<br />
2-<br />
t=/i63s<br />
\ ^~ 7" "\x<br />
t=13.2s<br />
t= 16.3s<br />
-^ t = 14.3s<br />
t = 14.7s<br />
t^-t:<br />
1<br />
^•^•^-^^^-^Jl^-^t^ii^a<br />
"~~ r 1— 1 I i '•• ,<br />
0.2 0.3 0.4 0.5 0.6 0.7 0.8 0.9<br />
P<br />
Fig. 12 TRANSP results for (a) the temporal variation of the effective, power balance heat<br />
diffusivity, xe// (b) the spatial profiles of xeJ?-<strong>and</strong> the spatial profiles of the electron heat diffusivity,<br />
xe (assumed equal to xi) for JET pulse #15894.<br />
(a)<br />
(b)<br />
(c)
<strong>IAEA</strong>-CN-50/A-III-2 175<br />
available), radiated power profile (Abel inverted bolometer data), the plasma<br />
current, loop voltage, Zeff (visible bremsstrahlung, checked against neutron yield<br />
estimates of the deuterium to electron density ratio) <strong>and</strong> edge particle confinement<br />
time (Da monitors). Neutral beam heating <strong>and</strong> neutron yields are calculated<br />
by Monte Carlo methods.<br />
The ion temperature profile is calculated, for example, by assuming an ion<br />
thermal diffusivity proportional to the electron thermal diffusivity. With \i = Xe<br />
(i.e. strongly anomalous ion transport) good agreement is obtained with the<br />
diamagnetic measurement of the total stored energy, with the total neutron yield<br />
<strong>and</strong>, when available, with measured ion temperature profiles from Charge<br />
Exchange Spectroscopy. Since the electron <strong>and</strong> ion temperatures are well coupled<br />
to within the experimental uncertainties it is not possible to determine x/xe<br />
better than to within a factor 2. Accordingly, the transport losses are first<br />
represented in terms of the effective, power balance, xe/f- Q/ne v kTeS, defined<br />
as the ratio of total heat flux (including the effects of energy equipartition <strong>and</strong><br />
convection) across a surface of area, S, to «e V kTe S.<br />
Typical results are illustrated by the analysis of JET Pulse # 15894. The temporal<br />
variation of xe/f ai - radial positions p = 0.5 <strong>and</strong> 0.75 is shown in Fig. 12a.<br />
As the neutral beam heating phase begins, xe// increases above its ohmic value,<br />
<strong>and</strong> then decreases continuously to a level close to its ohmic value at the transition<br />
to the H-phase. Xejj is maintained close to this level during the H-phase<br />
(see also discussion in Ref l23] ).<br />
The spatial profiles of xeff ai selected times throughout the discharge are shown<br />
in Fig. 12b. Again it is seen that xe//^ s similar in the transport dominated region<br />
(0.3
176 JET TEAM<br />
v><br />
0><br />
J£<br />
rt'<br />
1<br />
E<br />
8 o<br />
X<br />
1U<br />
c<br />
O<br />
5<br />
2 -<br />
1<br />
0.5<br />
0.2<br />
0.1<br />
Q = 0.05<br />
H<br />
- H '<br />
-<br />
\<br />
\<br />
\ \<br />
H<br />
H<br />
1<br />
0<br />
0<br />
(\ • ;<br />
\ \<br />
}§ V :!Al^<br />
%
<strong>IAEA</strong>-CN-50/A-III-2 177<br />
(xi0 19 m 3 )<br />
Fig. 14 Fusion amplification factor versus volume-averaged electron density at fixed values<br />
of TE for 140kV deuterium injection-at a total power of 15 MW <strong>and</strong> a 50:50 D -T plasma with<br />
Zej7-=2+2xlO'V. The dotted lines are the thermal contribution.<br />
11 13 14<br />
Time(s)<br />
Fig. 15 Time evolution of Da intensity /(Da), energy confinement time TE , neutral beam power<br />
PNB, total plasma radiation P/UD' volume-averaged plasma density <strong>and</strong> intensity of Nixxvi<br />
line for a 3 MA H-mode discharge with ELMs which keep the density (<strong>and</strong> radiation) approximately<br />
constant (until an ELM-free H-mode develops at t= 14.7 s).<br />
15
178 JET TEAM<br />
So far, the plasma density has been controlled only by the provocation of sufficient<br />
ELM-activity by reducing the separation between the plasma <strong>and</strong> the inner<br />
wall <strong>and</strong>/or the outer belt limiter. As shown in Fig. 15 this allows the density,<br />
, total plasma radiation, Prad, <strong>and</strong> concentration of metal impurities in the<br />
plasma centre (as exemplified by the intensity of a Nixxvi line) to be kept approximately<br />
constant for 1 or 2 seconds, but at the expense of a considerable reduction<br />
in the energy confinement time, jE.<br />
Attempts to improve central heating by using ICRH have, so far, been unsuccessful.<br />
In the double null configuration up to 8 MW ICRH (hydrogen minority<br />
heating at 33.5MHz, monopole phasing of the antennae) has been coupled to<br />
the plasma both alone <strong>and</strong> in combination with a similar level of NBI. A strong<br />
increase in radiation resulting from enhanced impurity influxes (mainly nickel,<br />
possibly also oxygen) has allowed only short, or very ELMy, H-modes with confinement<br />
times close to those typical of I^mode plasmas. To overcome these<br />
difficulties it is planned to replace the present nickel antenna screens by beryllium<br />
screens in the summer of 1989. The introduction of beryllium as a limiter<br />
material will also reduce radiation <strong>and</strong>, possibly, Zeff.<br />
In the first half of 1989 one NBI box will be upgraded to 140kV/D (the second<br />
NBI box will subsequently be upgraded to 140kV/D or 160kV/T). This will give<br />
better penetration <strong>and</strong> will inject fewer particles.<br />
To maximise the prospects for JET, however, it may remain necessary to exercise<br />
active particle control. First, sweeping the X-point position to help reduce the<br />
particle <strong>and</strong> impurity influxes will be examined. Ultimately, however, it may be<br />
necessary to consider pumping in the vicinity of the X-point where the particle<br />
flows are most concentrated.
<strong>IAEA</strong>-CN-50/A-III-2 179<br />
APPENDIX I<br />
THE JET TEAM<br />
JET Joint Undertaking, Abingdon, Oxon, 0X14 3EA, UK<br />
J. M. Adams', H.Altmann.G.Appruzzese, W. Bailey, P. Ballantyne,B.Balet,D.V.Bartlett, L.R.Baylor",<br />
K.Behringer", A.C.Bell, P.Bertoldi, E.Bertolini, L.G.Betello, V.Bhatnagar, R.J.Bickerton,<br />
A. J. Bickley, J. Bizarro 21 , S. Bliman",T. Bonicelli, S. J. Booth, G. Bosia, M.Botman, D. Boyd w , H.Brelen,<br />
H.BrinkschuIte, M.Brusati, T.Budd, M.Bures, T.Businaro 4 , P.Butcher, H.Buttgereit, C.Caldwell-<br />
Nichols, D.J.Campbell, P.Card, J.Carwardine.G.Celentano, P.Chabert 16 , CD.Challis, A.Cheetham,<br />
J.Christiansen, C.Christodoulopoulos, P.Chuilon, R.Claesen, S.Clement 29 , J.P.Coad, P.Colestock 6 ,<br />
S.Conroy 12 , M.Cooke, S.Cooper, J.G.Cordey, W.Core, G.Corrigan, S.Corti, A.E.Costley,<br />
G.Cottrell, M.Cox 7 , P.Cripwell 12 , D.Cross, H.deBlank 15 , H.deEsch, J.deHaas 15 , L.deKock,<br />
E. Deksnis, G.B.Denne, G. Deschamps, G. Devillers, K. J. Dietz, J. Dobbing, A. Dombra, N. Dolgetta,<br />
S.E.Dorling, P.G.Doyle, D.F.Duchs, H.Duquenoy, A.Edwards, J. Ehrenberg 13 , T.Elevant",<br />
W.Engelhardt, S.K.Erents 7 , L.G.Eriksson 3 , M.Evrard 2 , H.Fajemirokun 12 , H.Falter, J.Farthing,<br />
D.Flory, M.Forrest 7 , C.Froger, K.Fullard, M.Gadeberg, A.Galetsas, M. Galley, R.Galvao 8 ,M.Garr.ibba,<br />
R. Giannella, A. Gibson, R. D. Gill, A. Gondhalekar, G. Gorini, C. Gormezano, N. A. Gottardi, C. Gowers,<br />
B.J.Green, F.S.Griph, W.K.Guo", R.Haange, G.Hammed 6 , W.Han 9 , H.E.Han-Gonge 26 ,<br />
C. J.Hancock, P. J. Harbour, N.C.Hawkes 7 , P.Haynes', J. Heikkinen 3 , T. Hellsten, J. L.Hemmerich,<br />
R.Hemsworth, F.B.Herzog, R.F.Herzog, J.Hoekzema, R.Hope, W.A.Houlberg 23 , J.How,<br />
M.Huart, T.P..Hughes 31 , M.Hugon, M.Huguet, M.Irving, J.Jacquinot, O.N.Jarvis, F.Jensen,<br />
T. C. Jernigan", E. Joffrin, E. M. Jones, L. P. D. F. Jones, T. T. C. Jones, J. Kallne, O. Kardaun 13 , A. Kaye,<br />
B.E.Keen, M.Keilhacker, G.J.Kelly, A.Khare' 4 , S.Knowlton, A.Konstantellos, M.Kovanen 20 ,<br />
P.Kupschus, P.Lallia, R.Lanza, R.Lasser, J.R.Lasl, L.Lauro-Taroni, K.Lawson 7 , E.Lazzaro,<br />
M.Lennholm, B.Liley 25 , X.Litaudon, P.Lomas, M.Loreniz-Gottardi 2 , C.Lowry, G.Maddison 7 ,<br />
G. Magyar, M. Malacarne, W. M<strong>and</strong>l 13 , V. Marchese, J.Mart, P.Massmann, G. McCracken 7 , J. Mendonca,<br />
P.Meriguet, P.Micozzi 4 , S.F. Mills, P.Millward, S. L.Milora 23 , A.Moissonnier, F.Mompean,<br />
P.L.Mondino, P.Morgan, G.Murphy, G.Newbert, M.Newman, P.Nielsen, P.Noll, W.Obert,<br />
D.O'Brien, J.O'Rourke, M.G.Pacco-Duchs, M.Pain, S.Papastergiou, D.Pasini", A.Peacock,<br />
N. Peacock 7 , D. Pearson 12 , F. Pegoraro, F. Petree, M. Pick, S. Pitcher 7 , J. Plancoulaine, J-P. Poffe, F. Porcelli,<br />
R.Prentice, T. Raimondi, C. Raymond, P-H. Rebut.M. Removille, F. Rimini, D.Robinson 7 , A. Rolfe,<br />
R.Romain, R.T.Ross, L.Rossi, R.Rushton, P.Rutter, H.C.Sack, G.Sadler,G.Saibene, N.Salmon 12 ,<br />
H.Salzmann 13 , A.Santagiustina, R.Sartori, D.Schissel 24 , P.H.Schild, M.Schmid, G.Schmidt 6 ,<br />
R.L.Shaw, K.Schimizu 17 , A.Sibley, R.Simonini, J.Sips' 5 , P.Smeulders, J.Snipes, S.Sommers,<br />
L.Sonnerup, K.Sonnenberg, G.Sonnozaro, W.Stacey 28 , M.Stamp, P.Stangeby' 8 , D.F.Start, C. A.Steed,<br />
D.Stork, P.E.Stott, T. E.Stringer, D.Stubberfield, D.Summers, H.Summers 19 , J.Tagle 29 , H.Tamnen,<br />
A.Tanga, A.Taroni, C.Tebaldi 22 , A.Tesini, P.R.Thomas, E.Thompson, K.Thomsen, J.M.Todd,<br />
P.Trevalion.B.Tubbing, F.Tibone.E.Usselmann, A.Vannucci, H.v<strong>and</strong>er Beken, M.vonHellermann,<br />
T.Wade, C.Walker, M.Walravens, K.Walter, Z.Wang",. D.Ward, M.L.Watkins, H.Weisen 10 ,<br />
J. Wesson, D. H. Wheeler, J. Wilks, U. Willen", D. Wilson, T. Winkel, S. Wolfe, D. Wong, C. Woodward,<br />
M.Wykes, I. D. Young, L.Zannelli, D.Zasche 13<br />
PERMANENT ADDRESS<br />
1. UKAEA, Harwell, Didcol, Oxon. UK. 16. Commissiariai a L'Energie Atomique, F-92260<br />
2. EUR-EB Association. LPP-ERM/KMS, B-1040 Brussels. Fontenay-aux-Roses, France.<br />
Belgium. 17. JAERI, Tokai Research Establishment, Tokai-Mura,<br />
3. Technical Research Centre of Finl<strong>and</strong>. Helsinki, Finl<strong>and</strong>. Naka-Gun, Japan.<br />
4. ENEA-CENTRO Di Frascali, 1-00044 Frascali, Roma, Italy. 18. Institute Tor Aerospace Studies. University of Toronto,<br />
5. Chalmers University of Technology. Goleborg, Sweden. Downsview, Ontario, Canada.<br />
6. Princeton Plasma Physics Laboratory, New Jersey, USA. 19. University of Strathclyde, 107 Rotlenrow. Glasgow, G4 0NG,<br />
7. UKAEA Culham Laboratory, Abingdon, Oxfordshire, UK. UK.<br />
8. Plasma Physics Laboratory, Space Research Institute, Sao 20. <strong>Nuclear</strong> Engineering Laboratory, Lapeenranta University,<br />
Jose dos Campos, Brazil. Finl<strong>and</strong>.<br />
9. Instituteof Mathematics, University of Oxford, UK. 21. JNICT, Lisboa, Portugal.<br />
10. CRPP/EPFL, 21 Avenue des Bains, CH-1007 Lausanne, 22. Department of Mathematics, Univeristy of Bologna, Italy.<br />
Switzerl<strong>and</strong>. • 23. Oak Ridge National Laboratory, Oak Ridge, Tenn., USA.<br />
11. Swedish Energy Research Commission, S-10072 Stockholm, 24. G.A. Technologies, San Diego, California, USA.<br />
Sweden. 25. University of Waikato, Hamilton, New Zeal<strong>and</strong>.<br />
12. Imperial College or Science <strong>and</strong> Technology, 26. IPP, Academia Sinica, P.R.China.<br />
University of London, UK. 27. Southwestern Institute of Physics, Leshan, Sechuan,<br />
13. Max Planck Inslitut fur Plasmaphysik, D-8046 Garching bei P.R.China.<br />
Munchen, FRG. 28. University of Georgia, Atlanta. USA.<br />
14. Institute for Plasma Research, G<strong>and</strong>hinagar Bhat Gujrat, 29. Centro de Investigaciones Energeticas Medioambientales y<br />
India. Techalogicas, Spain.<br />
15. FOM Insliiuut voor Plasmafysica, 3430 Be Nieuwegein, 30. University of Maryl<strong>and</strong>, College Park, Maryl<strong>and</strong>, USA.<br />
The Netherl<strong>and</strong>s. 31. University of Essex, Colchester, UK.<br />
J CR 8819.1A (rev. 30/11/68)
180 JET TEAM<br />
References<br />
[ 1 ] Wagner, F., et al., 'Regime of improved confinement <strong>and</strong> high beta in neutral-beamheated<br />
divertor discharges of the ASDEXtokamak', Phys. Rev. Lett. 49(1982) 1408.<br />
[2] Kaye, S.M., et al., 'Attainment of high confinement in neutral beam heated divertor<br />
discharges in the PDX tokamak', J. Nucl. Mat. 121 (1984) 115.<br />
[3] Luxon, J., et al., 'Initial results from the DIII-D tokamak', Plasma Phys. <strong>and</strong> Contr.<br />
Nucl. Fus. Res. 1(1987) 159.<br />
[ 4 ] Odaj ima, K., et al., 'Confinement studies of additionally heated plasma in the JFT-2M<br />
tokamak', Plasma Phys. <strong>and</strong> Contr. Nucl. Fus. Res. (Proc. 1 lth Int. Conf., Kyoto,<br />
1986) 1(1987) 151.<br />
[ 5 ] Tanga, A., et al., 'Experimental studies in JET with magnetic separatrix', Plasma Phys.<br />
<strong>and</strong> Contr. Nucl. Fus. Res. (Proc. 1 lth Int. Conf., Kyoto, 1986) 1 (1987) 65.<br />
[6] Salzmann, H.M., et al., (Invited paper at the APS Topical Conference on Plasma<br />
Diagnostics, Napa Valley, Calif, USA), (1988).<br />
[7] Smeulders, P., etal., 'Hollow profiles <strong>and</strong> high-{i effects during H-mode in JET', JET<br />
Internal Report JET-IR(88)11, JET Joint Undertaking, (1988).<br />
[8] Boileau, A., etal., 'The deduction oflow-Zion temperature <strong>and</strong> densities in the JET<br />
tokamak using charge exchange recombination spectroscopy', JET Preprint JET-<br />
P(87)44, JET Joint Undertaking, (1987). To be published in Plasma Phys.<br />
[9] Morgan,P.D., 'TheevolutionofZef/r)profilesinJETplasmas',(Pro.c. 15thEurop.<br />
Conf. on Contr. Fus. <strong>and</strong> Plasma Heating, Dubrovnik) 12B (I) (1988) 139.<br />
[10] Behringer, K., etal., 'Impurity transport in JET during H-mode, monster sawteeth,<br />
<strong>and</strong> after pellet injection', (Proc. 15th Europ. Conf. on Contr. Fus. <strong>and</strong> Plasma Heating,<br />
Dubrovnik) 12B (I) (1988) 338.<br />
[11] O'Rourke, J., et al., 'Polarimetric measurements of the q-profile', (Proc. 15thEurop.<br />
Conf. on Contr..Fus. <strong>and</strong> Plasma Heating, Dubrovnik) 12B (I) (1988) 155.<br />
[12] Bickerton, R.J., Connor, J.W., Taylor, J.B., 'Diffusion driven plasma currents <strong>and</strong><br />
bootstrap tokamak', Nat. Phys. Sc. 229 (1971) 110.<br />
[13] Goldston, R.J., etal., 'New techniques for calculating heat <strong>and</strong> particle source rates<br />
due to neutral beam injection in axisymmetric tokamaks', J. Comput. Phys. 43 (1981)<br />
61.<br />
[14] Zarnstorff, M.C.etal., 'Non-ohmic currents in TFTR\ Phys. Rev. Lett. 60(1988)<br />
1306.<br />
[ 15] Challis, C, etal., 'Non inductively driven currents in JET, JET Preprint JET-P(88)38,<br />
JET Joint Undertaking, (1988). To be published in Nucl. Fus.
<strong>IAEA</strong>-CN-50/A-IH-2 181<br />
[16] Bishop, CM., 'Stability oflocalised MHD modes in divertor tokamaks:a picture of<br />
theH-mode', Nucl. Fus. 26 (1986) 1063.<br />
[ 17] Bishop, CM., 'Bifurcated temperature profiles <strong>and</strong> theH-mode', Nucl. Fus. 27(1986)<br />
1765.<br />
[18] Harbour, P. J., Workshop on Plasma Edge Theory in Fusion Devices, Augustusburg,<br />
GDR, 26-30 April 1988. To be published in 'Contributions to Plasma Physics',<br />
(Akademie-Verlag, Berlin, GDR).<br />
[ 19] Itoh, S.I. <strong>and</strong> Itoh, K., 'Modelof H/L transition in tokamak', Phys. Rev. Lett. 60<br />
(1988) 2276.<br />
[20] Harbour, P.J., et al., (8th Int. Conf. on Plasma Surface Interactions in Contr. Fus.<br />
Devices, 2-6 May 1988, Jiilich, FRG). To be published in J. Nucl. Mat.<br />
[21] deKock,L.,etal., 'The plasma boundary in JET', Paper <strong>IAEA</strong>-CN-50/A-VII-12/2.<br />
This conference.<br />
[ 22 ] Goldston, R. J., 'Energy confinement scaling in tokamaks: some implications of recent<br />
experiments with ohmic<strong>and</strong>strong auxiliary heating', Plasma Phys. <strong>and</strong> Contr. Fus.<br />
26 (1984) 87.<br />
[23 ] Keilhacker, M., et al., 'Studies of energy transport in JETH-modes', (Proc. 15th Europ.<br />
Conf. Fus. <strong>and</strong> Plasma Heating, Dubrovnik) 12B (I) (1988) 231.
TRANSPORT IN TFTR SUPERSHOTS<br />
<strong>IAEA</strong>-CN-50/A-III-3<br />
M.C. ZARNSTORFF, V. ARUNASALAM, C.W. BARNES 1 , M.G. BELL,<br />
M. BITTER, H.-S. BOSCH 2 , N.L. BRETZ, R. BUDNY, C.E. BUSH 3 ,<br />
A. CAVALLO, T.K. CHU, S.A. COHEN, P.L. COLESTOCK,<br />
S.L. DAVIS, D.L. DIMOCK, H.F. DYLLA, P.C. EFTHIMION,<br />
A.B. EHRHARDT, R.J. FONCK, E.D. FREDRICKSON, H.P. FURTH,<br />
G. GAMMEL, R.J. GOLDSTON, G.J. GREENE, B. GREK,<br />
L.R. GRISHAM, G.W. HAMMETT, RJ. HAWRYLUK, H.W. HENDEL,<br />
K.W. HILL, E. HINNOV, J.C. HOSEA, R.B. HOWELL 1 , H. HSUAN,<br />
R.A. HULSE, K.P. JAEHNIG, A.C. JANOS, D.L. JASSBY, F.C. JOBES,<br />
D.W. JOHNSON, L.C. JOHNSON, R. KAITA, C. KIERAS-PHILLIPS,<br />
SJ. KILPATRICK, V.A. KRUPIN 4 , P.H. LAMARCHE,<br />
B. LEBLANC, R. LITTLE, A.I. LYSOJVAN 5 , D.M. MANOS,<br />
D.K. MANSFIELD, E. MAZZUCATO, R.T. MCCANN,<br />
M.P. MCCARTHY, D.C. MCCUNE, K.M. MCGUIRE, D.H. MCNEILL,<br />
D.M. MEADE, S.S. MEDLEY, D.R. MIKKELSEN, R.W. MOTLEY,<br />
D. MUELLER, Y- MURAKAMI 6 , J.A. MURPHY, E.B. NIESCHMIDT 7 ,<br />
D.K. OWENS, H.K. PARK, A.T. RAMSEY, M.H. REDI,<br />
A.L. ROQUEMORE, P.H. RUTHERFORD, T. SAITO 8 ,<br />
N.R. SAUTHOFF, G. SCHILLING, J. SCHIVELL, G.L. SCHMIDT,<br />
S.D. SCOTT, J.C. SINNIS, J.E. STEVENS, W, STODIEK,<br />
J.D. STRACHAN, B.C. STRATTON, G.D. TAIT, G. TAYLOR,<br />
J.R. TIMBERLAKE, H.H. TOWNER, M. ULRICKSON,<br />
S. VON GOELER, R.M. WIELAND, M.D. WILLIAMS, J.R. WILSON,<br />
K.-L. WONG, S. YOSHIKAWA, K.M. YOUNG, S.J. ZWEBEN<br />
Plasma Physics Laboratory,<br />
Princeton University,<br />
Princeton, New Jersey,<br />
United States of America<br />
1 Los Alamos National Laboratory, Los Alamos, NM, USA.<br />
2 Max-Planck-Institut fur Plasmaphysik, Garching, Federal Republic of Germany.<br />
3 Oak Ridge National Laboratory, Oak Ridge, TN, USA.<br />
4 I.V. Kurchatov Institute of Atomic Energy, Moscow, USSR.<br />
5 Institute of Physics <strong>and</strong> Technology, Khar'kov, USSR.<br />
University of Tokyo, Tokyo, Japan.<br />
EG&G Idaho Inc., Idaho Falls, ID, USA.<br />
Japan Atomic Energy Research Institute, Naka-machi, Japan.<br />
183
184 ZARNSTORFT et al.<br />
Abstract<br />
TRANSPORT IN TFTR SUPERSHOTS.<br />
Thermal transport is analyzed for TFTR supershot plasmas using measured ion <strong>and</strong> electron<br />
temperature profiles. Outside the convection-dominated core, the ion thermal diffusivity is found to be<br />
much larger than neoclassical predictions. The ion <strong>and</strong> electron thermal diffusivities do not vary significantly<br />
with IP <strong>and</strong> Pinj. The calculated Xj is found to depend strongly (<strong>and</strong> xe weakly) on the peaking<br />
of the density profile. Xi is significantly larger in plasmas having L-mode confinement than in<br />
supershots.<br />
1. Introduction<br />
Local transport has been analyzed in auxiliary-heated TFTR plasmas<br />
with emphasis on underst<strong>and</strong>ing the enhanced confinement observed in the<br />
"supershot" regime [1]. This regime is interesting because of its strongly<br />
peaked density profiles, iwhich result from the primary particle source being<br />
in the plasma core, rather than at the plasma edge, as in the L- or<br />
H-mode. During the past year the supershot regime has been extended to<br />
lp = 1.6 MA, <strong>and</strong> up to 30.5 MW [2] of near-balanced co- <strong>and</strong> countertangential<br />
deuterium neutral beam injection into deuterium plasmas with<br />
carefully conditioned pumping carbon limiters [3]. Typical plasma parameters<br />
are Te(0) = 7-8 keV, ne(0) = 5-9x 10 19 m" 3 , T;(0) = 25-32 keV,<br />
<strong>and</strong> very high fusion reactivity, reaching QDD up to 1.55 x 10~ 3 . The density<br />
profiles are very peaked, with ne(0)/ < ne > up to 3, where < ne > is<br />
the volume average density. The global confinement time T^f, as determined<br />
by magnetic measurements, is up to three times greater than that predicted<br />
by Goldston L-mode scaling [4]. The global confinement time is found to be<br />
roughly independent of Ip <strong>and</strong> Pmj [2].<br />
This paper will describe the transport processes in supershot plasmas<br />
<strong>and</strong> the scaling of the inferred transport coefficients, followed by a comparison<br />
between the transport in supershots <strong>and</strong> plasmas having approximately<br />
L-mode confinement. All plasmas discussed here have balanced co<strong>and</strong><br />
counter-tangential injection. Transport in plasmas with unbalanced injection<br />
is discussed by Scott et al. [5].<br />
2. Supershot Transport Analysis<br />
Figure 1 shows the density <strong>and</strong> temperature profiles for a high-confinement<br />
supershot. This Ip = 1.4 MA plasma was heated by 22 MW of neutral beam<br />
power, <strong>and</strong> had ne = 3.9 X 10 19 m~ 3 <strong>and</strong> Zeg = 2.4. The global energy confinement<br />
time was 0.18 sec determined from magnetic measurements while<br />
L-mode scaling [4] would predict 0.056 sec.
e<br />
at<br />
O<br />
186 ZARNSTORFF et al.<br />
X-ray spectroscopic measurements of metallic concentrations. The radiated<br />
power profile is measured by three bolometer arrays. Edge hydrogenicneutral<br />
influx is inferred [7] from the measurements of an array of absolutely<br />
calibrated Ha detectors. The beam-ion slowing down distribution is simulated<br />
as a separate species not subject to anomalous transport, consistent<br />
with experimental observations [8,9]. The beam ions are treated as joining<br />
the background thermal ion species when their energy falls to |Ti. Electronion<br />
energy exchange is assumed to be classical.<br />
The total stored energy <strong>and</strong> neutron emission rate calculated by this simulation<br />
are typically in good agreement with the experimental measurements<br />
(maximum deviations of < 10% for stored energy, < 25% for neutron flux -<br />
roughly the present measurement uncertainty). For the supershot shown in<br />
Fig. 1 the analysis indicates that nb/ne — 0.14 on axis, <strong>and</strong> that the beam<br />
stored energy is 41% of the total. While the global energy confinement time<br />
is 0.18 sec, the calculated energy confinement time of the thermal component<br />
is 0.12 sec.<br />
The calculated neutral beam power <strong>and</strong> particle source profiles are very<br />
peaked on axis. The central power density of 4 MW m~ 3 <strong>and</strong> beam fueling<br />
is the dominant particle source for r < |a. The central energy transport<br />
(both for ions <strong>and</strong> electrons) is dominated by convection for r < a/3. In this<br />
region, it is found that Qi/TiTi is bounded from below by ~ | <strong>and</strong> Qe/TeTe<br />
by 2 - 2.5, where Qi (Qe) is the total ion (electron) heat flux <strong>and</strong> I\ (re) is<br />
the ion (electron) particle flux [10]. Thus, use of the usual convective heat<br />
flux of |r\7; would require an unphysical negative Xi m the central region.<br />
For the present paper the electron <strong>and</strong> ion thermal difFusivities Xe an d Xi are<br />
defined by Qe = neXeVTe + \Y£Te <strong>and</strong> Qi = n^Ti + fl^T;, where n; is the<br />
total thermal ion density, unless otherwise noted.<br />
The ion thermal diffusivity with neutral beam heating, see Fig. 2, is found<br />
to be much larger [11] than predicted by neoclassical theory[12], as previously<br />
found on Doublet III [13]. In all plasmas analyzed, the measured T± profile is<br />
narrower than predicted by neoclassical transport, with the prediction being<br />
well outside the error-bars of the measurements. The central ion temperature<br />
is not in strong disagreement with the neoclassical prediction due to the<br />
dominance of the convective heat flux in the central ion power balance. The<br />
outer region of the predicted Ti profile is determined by the assumed classical<br />
ion-electron energy exchange, which dominates the predicted neoclassical<br />
transport. The inferred Xi IS U P to 40 times larger than the neoclassical<br />
prediction in the outer region of the plasma, emphasizing the importance<br />
of Ti profile measurements to the underst<strong>and</strong>ing of thermal transport. The<br />
analysis indicates that in the outer region x% an d Xe have similar magnitudes<br />
<strong>and</strong> profile shapes. The error-bars on Xe <strong>and</strong> Xi m the figure (<strong>and</strong> subsequent
i<br />
30<br />
20<br />
10<br />
10'<br />
<strong>IAEA</strong>-CN-50/A-III-3 187<br />
"1.5 2.0 2.5 3.0<br />
MAJOR RADIUS (m)<br />
—l 1 1 1 1 1<br />
X; Experimental<br />
- Xj Neoclassical<br />
i i i_<br />
0.2 0.4 0.6<br />
MINOR RADIUS (m)<br />
FIG. 2. (a) Comparison between the measured ion temperature profile <strong>and</strong> the prediction of neoclassical<br />
transport [12] for the supershot of Fig. 1. (b) Radial profile of xe an d Xi inferred from the<br />
experimental data <strong>and</strong> the neoclassically predicted x,. The top of the shaded region shows xe "s defined<br />
assuming a 3/2YeTe convective flow, the bottom of the shaded region assumes 5/2TeTe convective flow.<br />
figures) represent the st<strong>and</strong>ard deviation of the calculation when the experimentally<br />
measured quantities are r<strong>and</strong>omly varied within their individual<br />
ranges of uncertainty.<br />
As discussed in Ref. [2], TE is generally independent of Ip <strong>and</strong> Pinj in the<br />
de-gassed-]imiter supershot regime, but ne(0)/ < ne > <strong>and</strong> TEI T E generally<br />
increase with increasing Ptnj <strong>and</strong> decrease with increasing JP, where rjf is the<br />
energy confinement time from L-mode scaling. Figure 3 shows the variation<br />
of Xi an d Xe at r = a/2 with IP <strong>and</strong> P,nj. This radius was chosen to avoid<br />
the convectively dominated core <strong>and</strong> the uncertainties of the plasma edge. It<br />
is seen that Xe <strong>and</strong> Xt z&e almost constant over the ranges studied. If there<br />
are any trends, they are for higher Xi <strong>and</strong> Xe f° r lower Pmj <strong>and</strong> higher x; for<br />
higher IP. These trends are opposite to those expected from previous scaling<br />
laws (e.g. L-mode).<br />
3.5<br />
0.8
188 ZARNSTORFF et al.<br />
8<br />
CM<br />
e<br />
CM<br />
E<br />
2 -<br />
(a)<br />
lp=1.4 MA<br />
10 15<br />
(b)<br />
• •<br />
1 - D D<br />
Pjnj = 17 MW<br />
i i<br />
i<br />
•<br />
1<br />
•<br />
ID CD I<br />
1<br />
•<br />
1<br />
I<br />
inj(MW)<br />
1<br />
1 h|<br />
D<br />
1.0 1.4<br />
Ip(MA)<br />
1<br />
p '<br />
•<br />
a<br />
D<br />
i i<br />
•<br />
•<br />
D<br />
a<br />
1 '<br />
•<br />
a<br />
" *i<br />
a Xe<br />
i i<br />
FIG. 3. (a) Variation ofxi <strong>and</strong> \catr = a/2 with Pinjfor IF = 1.4 MA with well conditioned limiters.<br />
(b) Variation ofxi ana " Xe at r = a ^ w ' tn hf or ^mj = 17 MW with well conditioned limiters.<br />
3. Comparison of Supershot <strong>and</strong> L-mode Transport<br />
Plasmas with L-mode confinement were previously obtained [14] on TFTR<br />
with gas-loaded limiters, producing a large recycling neutral influx <strong>and</strong> thus<br />
keeping the edge density high <strong>and</strong> the edge temperature low. To obtain<br />
this situation without deconditioning the limiter, we injected deuterium neutral<br />
beams into, helium target plasmas of various densities. With a target<br />
ne = 4.4 x 10 19 m~ 3 the confinement time during neutral beam heating was<br />
0.061 sec, while the L-mode prediction is 0.056 sec. The density <strong>and</strong> temperature<br />
profiles are shown in Fig. 1, <strong>and</strong> it is seen that the ne profile is broad,<br />
1.8<br />
D-<br />
25
<strong>IAEA</strong>-CN-50/A-III-3 189<br />
0.2 0.4 0.6<br />
MINOR RADIUS (m)<br />
FIG. 4. Radial profile of experimental x,- <strong>and</strong> Xefor supershot <strong>and</strong> L-mode plasmas shown in Fig. 1:<br />
(a) L-mode x,. (b) L-mode xt, (c) supershot xt, (d) supershot x,-.<br />
with ne(0)/ < ne >~ 1.5, <strong>and</strong> Tc(0) ~ Ti(0) ~ 4 keV. This plasma has<br />
Zeff = 2 (from visible bremsstrahJung measurements) <strong>and</strong> ne ~ 20% higher<br />
than the comparison supershot. For the helium target plasma shown in Fig.<br />
1, nj,/ne = 0.16 on axis, <strong>and</strong> the beam stored energy is 43% of the total.<br />
Its electron <strong>and</strong> thermal ion stored energies are two-thirds <strong>and</strong> one-quarter,<br />
respectively, of those for the comparable supershot. L-mode confinement has<br />
also been obtained in lp — 1.6 MA deuterium plasmas with Pinj = 30 MW<br />
after the broadening of the density profile associated with a transient increase<br />
in the carbon limiter-recycling light [3]. These plasmas also have a<br />
broad density profile <strong>and</strong> typical parameters of Te(0) ~ 6 keV, T,(0) ~ 7 keV,<br />
Zeg = 3, <strong>and</strong> have no detected coherent MHD activity. For these L-mode<br />
plasmas, the calculated deposited beam power <strong>and</strong> particle source rate on<br />
axis are half that of a corresponding supershot.<br />
The inferred thermal transport coefficients for an L-mode plasma (helium<br />
target) are shown in Fig. 4. While \e rises modestly (by a factor ~ 2) from<br />
the supershot to the L-mode, \i increases by roughly a factor of six to eight,<br />
<strong>and</strong> is much larger than Xe- Similar transport coefficients are observed for the<br />
deuterium broadened plasmas having L-mode confinement. The convective<br />
power flow is insignificant in the L-mode plasmas, due to the low ion <strong>and</strong><br />
electron temperatures; the conductive power flow is the dominant loss at all<br />
radii for both ions <strong>and</strong> electrons.
190 ZARNSTORFF et al.<br />
1.5 2.0 2.5<br />
ne(0)/<br />
FIG. 5. Variation of X; "nd \t at r = a/2 with ne(0)/(ne) for plasmas having confinement ranging<br />
from L-mode to 3 x L-mode, IP from 1.0 to 1.8 MA, <strong>and</strong> Pinjfrom 12 to 30 MW.<br />
4. Discussion<br />
The variation from supershot to L-mode confinement is continuous, <strong>and</strong><br />
is strongly correlated with the peakedness of the density profile ne(0)/ <<br />
ne > [2]. Figure 5 shows the variation of \e <strong>and</strong> \i a ^ the half radius with<br />
density profile peakedness, covering the range from L-mode to supershots for<br />
a wide range of lp <strong>and</strong> PiTy. Remarkably, Xe does not strongly vary, while Xi<br />
is anti-correlated with the peaking of the density profile. Similar trends are<br />
also found correlating decreasing \i (<strong>and</strong> \e) with decreasing local densitygradient<br />
scale length, decreasing T)e = dT \ogTe/dr logne (which ranges from<br />
1.1 to 2.7), or increasing Ti/Te (which ranges from ~ 1 for L-mode to ~ 3.5<br />
for supershots). The data does not support anomalous transport models<br />
that have \e or Xi increasing with increasing Te, T;, or /3p without other<br />
compensating dependences on Vn or Ti/Te. At r = a/2, rji (calculated using<br />
the total ion density, including non-thermal ions) ranges from ~ 1 to ~ 3,<br />
but does not correlate with the observed changes in Xi> Xe> or T{jTe.<br />
Although the ion <strong>and</strong> electron transport coefficients are lower in supershots<br />
than in the L-mode regime, they are still anomalous. A comparison of<br />
supershot <strong>and</strong> L-mode transport to various theoretical models is discussed<br />
by Tang et al. [15].<br />
5. Summary<br />
The thermal transport has been analyzed for deuterium neutral beam<br />
heated plasmas in TFTR. The ion thermal diffusivity is found to be much<br />
larger than neoclassical prediction, <strong>and</strong> increases strongly in going from the<br />
3.0
<strong>IAEA</strong>-CN-50/A-III-3 191<br />
supershot regime to plasmas having L-mode confinement. The thermal diffusivities<br />
Xi anc l Xe do n °t have the st<strong>and</strong>ard L-mode dependences, <strong>and</strong> appear<br />
to be largely independent of IP <strong>and</strong> Pmj. Xii an ^ to a lesser extent \e, change<br />
systematically as the density profile shape changes, being lowest for peaked<br />
density profiles.<br />
Acknowledgments<br />
We are grateful for the support of the TFTR technical staff <strong>and</strong> for discussions<br />
with J.D. ("alien <strong>and</strong> P. Diamond. This work was supported by<br />
U.S. Department of Energy Contract No. DE-AC02-76-CHO- 3073.<br />
REFERENCES<br />
[1] STRACHAN, J.D., et al., Phys. Rev. Lett. 58 (1987) 1004.<br />
[2] BELL, M.G., et al.. Paper <strong>IAEA</strong>-CN-50/A-I-2, these Proceedings, Vol. 1.<br />
[3] ULRICKSON, M., et al., Paper <strong>IAEA</strong>-CN-50/G-III-l, these Proceedings, Vol. 3.<br />
[4] GOLDSTON, R.J., Plasma Phys. 26 (1984) 87. The values of L-mode confinement used here<br />
do not include any ion mass correction factor.<br />
[5] SCOTT, S.D., et al., Paper <strong>IAEA</strong>-CN-50/E-HI-5, these Proceedings, Vol. 1.<br />
[6] HAWRYLUK, R.J., "An empirical approach to tokamak transport", Physics of Plasmas Close<br />
to Thermonuclear Conditions (Proc. Course Varenna, 1979), Vol. 1, Commission of the European<br />
Communities, Brussels (1979) 19-46.<br />
[7] HEIFETZ, D.H., et al., J. Vac. Sci. Technol., A 6 (1988) 2564.<br />
[8] RADEZTSKY, R.H., et al., "Measurements of fast ion radial diffusion in TFTR", Controlled<br />
Fusion <strong>and</strong> Plasma Heating (Proc. 15th Eur. Conf. Dubrovnik, 1988), Vol. 12B, Part I, European<br />
Physical Society (1988) 79-82.<br />
[9] EFTHIMION, P.C., et al.. Paper <strong>IAEA</strong>-CN-50/A-V^, these Proceedings, Vol. 1.<br />
[10] ZARNSTORFF, M.C., et al., "Convective heat transport in TFTR supershots", Controlled<br />
Fusion <strong>and</strong> Plasma Heating (Proc. 15th Eur. Conf. Dubrovnik, 1988), Vol. 12B, Part I, European<br />
Physical Society (1988) 95-98. The difference between the convective limits quoted here<br />
<strong>and</strong> in this reference is due to inclusion of beam energy diffusion, beam-beam charge-exchange,<br />
<strong>and</strong> a previous error in the SNAP analysis of experimental T; profiles at high (3P.<br />
[11] FONCK, R.J., et al., "Ion temperature profiles <strong>and</strong> ion thermal confinement in TFTR", ibid.,<br />
pp. 83-86.<br />
[12] CHANG, C.S., HINTON, F.L., Phys. Fluids 29 (1986) 3314.<br />
[13] GROEBNER, R.J., et al., Nucl. Fusion 26 (1986) 543-554.<br />
[14] BELL, M.G., et al., Plasma Phys. 28 (1986) 1329.<br />
[15] TANG, W.M., et al., Paper <strong>IAEA</strong>-CN-50/D-III-3, these Proceedings, Vol. 2.
<strong>IAEA</strong>-CN-50/A-III-4<br />
ENERGY CONFINEMENT IN AUXILIARY HEATED<br />
DIVERTOR AND LIMITER DISCHARGES IN THE<br />
DIII-D TOKAMAK*<br />
K.H. BURRELL, S.L. ALLEN 1 , G. BRAMSON, N.H. BROOKS,<br />
R.W. CALLIS, T.N. CARLSTROM, M.S. CHANCE 2 , M.S. CHU,<br />
A.P. COLLERAINE, D. CONTENT 3 , J.C. DeBOO, R.R. DOMINGUEZ,<br />
S. EJIMA 4 , J. FERRON, R.L. FREEMAN, H. FUKUMOTO 5 , P. GOHIL,<br />
N. GOTTARDI 6 , CM. GREENFIELD, R.J. GROEBNER, G. HAAS 7 ,<br />
R.W. HARVEY, W.W. HEIDBRINK 8 , F.J. HELTON, D.N. HILL 1 ,<br />
F.L. HINTON, R.-M. HONG, N. HOSOGANE 9 , W. HOWL,<br />
C.L. HSIEH, G.L. JACKSON, G.L. JAHNS, R.A. JAMES 1 ,<br />
A.G. KELLMAN, J. KIM, S. KINOSHITA 5 , L.L. LAO, E.A. LAZARUS 10 ,<br />
P. LEE, T. LeHECKA 11 , J. LISTER 12 , J.M. LOHR, P.J. LOMAS 6 ,<br />
T.C. LUCE, J.L. LUXON, M.A. MAHDAVI, K. MATSUDA,<br />
H. MATSUMOTO 9 , M. MAYBERRY, C.P. MOELLER, Y. NEYATANI 9 ,<br />
T. OHKAWA, N. OHYABU 13 , T.H. OSBORNE, D.O. OVERSKEI,<br />
T. OZEKI 9 , W.A. PEEBLES", S. PERKINS 1 , M. PERRY 3 ,<br />
P.I. PETERSEN, T.W. PETRIE, R. PHILIPONO", J.C. PHILLIPS,<br />
R. PINSKER, P.A. POLITZER, G.D. PORTER 1 , R. PRATER,<br />
D.B. REMSEN, M.E. RENSINK 1 , K. SAKAMOTO 9 , MJ. SCHAFFER,<br />
D.P. SCHISSEL, J.T. SCOVILLE, R.P. SERAYDARIAN,<br />
M. SHIMADA 9 , T.C. SIMONEN, R.T. SNIDER, G.M. STAEBLER,<br />
B.W. STALLARD 1 , R.D. STAMBAUGH, R.D. STAV, H. St. JOHN,<br />
R.E. STOCKDALE, E.J. STRAIT, P.L. TAYLOR, T.T. TAYLOR,<br />
P.K. TROST, A. TURNBULL, U. STROTH 7 , R.E. WALTZ, R. WOOD 1<br />
General Atomics,<br />
San Diego, California,<br />
United States of America<br />
* This is a report of work sponsored by the US Department of Energy under Contract No.<br />
DE-AC03-84ER51044.<br />
1<br />
Permanent address: Lawrence Livermore National Laboratory, Livermore, CA, USA.<br />
2<br />
Permanent address: Plasma Physics Laboratory, Princeton University, Princeton, NJ, USA.<br />
3<br />
Permanent address: Johns Hopkins University, Baltimore, MD, USA.<br />
4<br />
Present address: Shinetsu Chemicals, Ltd, Japan.<br />
5<br />
Present address: Hitachi Ltd, Japan.<br />
6<br />
Permanent address: JET Joint Undertaking, Abingdon, Oxfordshire, United Kingdom.<br />
7<br />
Permanent address: Max-Planck-Institut fiir Plasmaphysik, Garching, Federal Republic<br />
of Germany.<br />
193
194 BURRELL et al.<br />
Abstract<br />
ENERGY CONFINEMENT IN AUXILIARY HEATED DIVERTOR AND LIMITER DISCHARGES<br />
IN THE Dni-D TOKAMAK.<br />
The scaling of the H-mode power threshold with various plasma parameters has been determined;<br />
the roughly linear increase with plasma density <strong>and</strong> toroidal field is particularly significant. The data<br />
indicate that the H-mode transition is associated with the sudden reduction in anomalous, fluctuation<br />
connected transport across the outer midplane of the plasma. It is found that the edge localized modes<br />
(ELMs) are triggered when the pressure gradient at the edge of the plasma exceeds the threshold given<br />
by ideal ballooning mode theory. The energy confinement time increases linearly with the plasma current<br />
until the safety factor at the 95% flux surface q95 drops below three; at q9J < 3, it is independent<br />
of the current <strong>and</strong>, at constant q95, depends linearly on the toroidal field. Controlling the effects of<br />
ELMs has allowed nearly steady state plasmas with H-mode durations up to 4.4 s. The energy confinement<br />
time in H-mode plasmas created with Ohmic heating alone shows a factor of two improvement<br />
over st<strong>and</strong>ard Ohmic plasmas. The confinement time in 2.0 MA H-mode plasmas with neutral beam<br />
heating can significantly exceed the st<strong>and</strong>ard Ohmic value also. Local transport studies have shown that<br />
the thermal diffusivity in the outer half of the plasma in the neutral beam heated H-mode is a factor<br />
of three lower than the L-mode diffusivity at the same plasma density.<br />
1. INTRODUCTION<br />
Obtaining better energy confinement remains a major goal of tokamak<br />
research. On DIII-D, we have been pursuing this goal via detailed<br />
confinement investigations plus trials of various confinement improvement<br />
methods. Work has been done in limiter <strong>and</strong> single- <strong>and</strong> double-null divertor<br />
discharges with Ohmic, electron cyclotron heating (ECH) <strong>and</strong> neutral<br />
beam heating (NBI) over a range of parameters: toroidal field 0.7<br />
< BT (T) < 2.1, plasma current 0.2 < IP (MA) < 3.0, vertical elongation<br />
K < 2.2, line-averaged density 1.0 < n? (10 10 m~ 3 ) < 13.0, total plasma<br />
energy WT (MJ) < 1.3, neutral beam injection power PB < 12 MW <strong>and</strong><br />
ECH power
o<br />
O<br />
•
196 BURRELL et al.<br />
used in the initial experiments [2]. The similar ne <strong>and</strong> BT dependence of<br />
Pth is consistent with Ohyabu's microtearing mode theory of the L to H<br />
transition [4].<br />
ECH appears to be more efficient than NBI at producing the Hmode.<br />
The lowest threshold seen to date is Pth = 0.8 MW for ECH in a<br />
deuterium plasma at IP = 0.5 MA, BT = 1.1 T <strong>and</strong> ne = 1 X 10 19 m~ 3 [5];<br />
the NBI threshold for this case is about 1.1 MW. Ohmic heating can<br />
also produce the H-mode. As indicated in Fig. 1, the threshold power<br />
for Ohmic H-mode is consistent with that for NBI-produced H-modes.<br />
Achieving Ohmic H—mode requires high currents (>1.2 MA) at low toroidal<br />
field (
0.3<br />
0.2-<br />
0.1-<br />
0.0<br />
0.8<br />
0.6<br />
0.4<br />
0.2<br />
0.0<br />
0.4<br />
0.2-<br />
0.0<br />
<strong>IAEA</strong>-CN-50/A-m-4 197<br />
L-MODE<br />
H-MODE<br />
DURING ELM<br />
50 100 150<br />
FREQUENCY (kHz)<br />
FIG. 2. Auto power spectrum of the density fluctuations measured by a fixed frequency microwave<br />
reflectometer during the L-mode, H-mode <strong>and</strong> ELM periods of a single discharge.<br />
u.o -<br />
0.3-<br />
30.0-<br />
0.0-<br />
1.0-<br />
0.5-<br />
1.0-rr<br />
0.5-<br />
1.0-<br />
0.5-<br />
20.0-<br />
0.0<br />
OUTER SEPARATRIX<br />
I I<br />
OUTER SEPARATRIX<br />
I I<br />
EDGE SXR<br />
I I<br />
H " ^iniMrtrtiM'iini<br />
MAGNETIC PROBE<br />
1 1<br />
1 • • 1<br />
200<br />
1730 1770 1810 1850: 1890 1930<br />
i<br />
i i<br />
I<br />
INNER SEPARATRIX<br />
7—r<br />
OUTER<br />
I<br />
SEPARATRIX Ha<br />
i<br />
I I<br />
OUTER SEPARATRIX MAGNE1 IC PROBE<br />
it<br />
~J vL*^^——•—"^<br />
1855 1857 1859 1861<br />
TIME (ms)<br />
I<br />
"a<br />
1863<br />
FIG. 3. Plot of various diagnostic signals as a function of time near the time of the LtoH transition.
198 BURRELL et al.<br />
at the H-mode transition. The location in the bad curvature region suggests<br />
that the stabilization of ballooning modes by entry into the second<br />
stable regime might be the cause of the L to H transition [11]. However,<br />
comparison of measured edge pressure gradients with the high n, ideal<br />
ballooning mode limits [12] demonstrates that the pressure gradients are<br />
at least an order of magnitude below the first stable regime boundary at<br />
the L to H transition. Accordingly, stabilization of ideal ballooning modes<br />
cannot account for the L to H transition.<br />
3. EDGE LOCALIZED MODES AND<br />
BALLOONING MODE LIMITS<br />
The confinement improvement in the H-mode is due to the creation<br />
of a transport barrier just inside the separatrix flux surface [13]. Periodically,<br />
this barrier is breached by the ELMs, which transiently allow a burst<br />
of particles <strong>and</strong> energy to flow into the divertor. Up to 20% of the energy<br />
<strong>and</strong> particles in the plasma can be lost during an ELM. Underst<strong>and</strong>ing<br />
<strong>and</strong> controlling the ELMs could lead to even better confinement in the<br />
H—mode.<br />
Phenomenologically, the ELM looks like a transient return to<br />
L-mode. The magnetic <strong>and</strong> density fluctuations that disappeared at the<br />
H-mode transition reappear. As is illustrated in Fig. 2, the frequency<br />
spectrum of the density fluctuations during an ELM is similar to that in<br />
L-mode. The fluctuation increase occurs at or before the characteristic<br />
HQ burst which is associated with the ELM. Furthermore, from the time<br />
delay in the Ha signals at various points around the plasma, <strong>and</strong> from the<br />
time delay in the heat pulses to the inner <strong>and</strong> outer divertor hit spots [14],<br />
the ELM event happens first at the outside midplane of the plasma. This<br />
location is also consistent with magnetic precursor oscillations that are<br />
sometimes seen on the magnetic probes near the outer midplane. If the<br />
ELM is a return to L-mode, then the ELM event is terminated by the<br />
same process that initially led to the H-mode.<br />
Although the L to H transition appears unrelated to ballooning<br />
modes, it does appear that ELMs are triggered by those modes. As is<br />
illustrated in Fig. 4, comparison of measured edge pressure gradients with<br />
the predictions of ideal ballooning mode theory demonstrates that the<br />
measured edge pressure gradients are at or below the first regime, ideal<br />
ballooning mode stability limit [12,15-17]. The theory is best parameterized<br />
in terms of the shear S <strong>and</strong> the local safety factor q, both evaluated<br />
at the 95% flux surface; in Fig. 4, that theory is compared to the pressure<br />
gradient measured in the direction of the Thomson scattering view chord.<br />
The cases where the measured gradients are the largest are ones where<br />
the Thomson scattering measurements were made just prior to an ELM.<br />
This agreement occurs both for cases where the central plasma is near<br />
the ballooning mode stability limit [18] <strong>and</strong> for cases where it is far from<br />
that limit [12J. This agreement, plus the initiation of the ELM event at<br />
the outside midplane, indicates that the ELM is triggered when the edge<br />
plasma crosses the ideal ballooning mode threshold.
00<br />
d<br />
f<br />
CM I-<br />
CQ<br />
i o<br />
o<br />
o<br />
<strong>IAEA</strong>-CN-50/A-III-4 199<br />
• = BALLOONING LIMIT<br />
O = MEASURED, PRE-ELM<br />
D = MEASURED, POST-ELM<br />
at<br />
a<br />
tin<br />
0.7 g BT{T) £ 2.1<br />
1.0 g Ip(MA) g 2.0<br />
2.1 g q(95) S 6.0<br />
0.0 0.2 0.4 0.6 0.8 1.0<br />
S(0.95)/q(0.95) 2<br />
FIG. 4. Measured edge pressure gradients compared to the theoretically predicted ideal ballooning<br />
mode limit.<br />
Ballooning mode theory can be used to develop plasma shapes that<br />
are more stable to ballooning modes <strong>and</strong>, potentially, less subject to<br />
ELMs. Increasing the plasma triangularity, for example, is stabilizing.<br />
Some preliminary work on high triangularity, double-null divertor discharges<br />
shows that ELMs are much less frequent in these shots than in<br />
corresponding single-null divertors.<br />
ELMs can be affected significantly by increasing the plasma elongation<br />
<strong>and</strong> decreasing the height of the X-point. This results in ELMs with<br />
smaller amplitude, shorter duration <strong>and</strong> higher frequency; these affect<br />
the energy <strong>and</strong> particle confinement of the discharges much less [19]. We<br />
have utilized this ELM control method to run nearly-steady-state H-mode<br />
plasmas with H-mode durations as long as 4.4 seconds. The duration of<br />
these plasmas was limited only by pulse-length limitations of some of the<br />
power supplies used to control the plasma position. Possibly due to the<br />
continued presence of small ELMs, the low Z impurity content of these<br />
plasmas is constant <strong>and</strong> the metallic impurity content actually decreases<br />
with time during the H-mode.<br />
We have investigated whether increasing the current gradient at the<br />
edge of the plasma could destabilize ELMs by ramping the current up during<br />
the H-mode phase of the discharge. This work was done in single-null<br />
divertors at 2.1 T with 9.5 MW NBI. The current was initially 1.25 MA<br />
<strong>and</strong> it was raised to 1.75 MA at a rate of either 1 or 1.7 MA/s. At 1 MA/s,<br />
the only effect on the ELMs was a gradual increase in the time between<br />
ELMs. This increase is expected from our previous work at various steadystate<br />
currents <strong>and</strong> is consistent with the ballooning mode theory since the
200 BURRELL et al.<br />
mode is more stable at higher current [12]. At 1.7 MA/s, the time between<br />
ELMs initially lengthened, but the plasma then entered a 100 ms<br />
to 150 ms long L—phase. This phase ended when the current ramp ceased.<br />
This L-phase began with an ELM that looked very similar to the others<br />
prior to it; however, at this high a current ramp rate, the plasma was<br />
apparently unable to return to the H-phase. This indicates that the L<br />
to H transition is inhibited by current ramping. Similar transient loss<br />
of H—mode during current ramps has been seen on ASDEX [20]. In no<br />
case did we see an increase in ELM frequency, which would have indicated<br />
that the ELM was driven more unstable by an increasing current gradient.<br />
Accordingly, ELMs do not appear to be current driven modes.<br />
4. ENERGY CONFINEMENT TIME SCALING<br />
IN H-MODE<br />
We have investigated energy confinement time scaling as a function<br />
of plasma ion species (H, D, He); PT; nc; Ip <strong>and</strong> BT in discharges with<br />
NBI [19]. Energy confinement scaling work as been done in three types<br />
of hydrogen plasma with different isotope mixtures: (1) essentially pure<br />
deuterium (fractional edge hydrogen concentration [H]/[H+D] < 10%),<br />
(2) mixed H/D plasmas ([H]/[H+D] = 30% to 50%) <strong>and</strong> (3) pure hydrogen<br />
plasmas. The admixture of hydrogen in the deuterium plasmas is the<br />
result of hydrogen NBI. Confinement is best in deuterium plasmas [2];<br />
TE in pure hydrogen plasmas is about a factor of two smaller; TE in the<br />
mixed plasmas lies between the two extremes [19]. In helium plasmas<br />
with helium NBI; the confinement results are very similar to those in pure<br />
hydrogen plasmas [19].<br />
In deuterium plasmas, we have determined that H-mode 7^ is independent<br />
of ne <strong>and</strong> PT over the range 2.9 < ne (10 19 rn~ 3 ) < 5.5 <strong>and</strong><br />
0.8 < PT (MW) < 6.4 [2]. Mixed H/D plasmas <strong>and</strong> pure hydrogen plasmas<br />
show a decrease of T^ with increasing input power [19]. The reason<br />
for the difference between hydrogen <strong>and</strong> deuterium is not yet understood.<br />
In mixed H/D H—mode plasmas, we have demonstrated that TQ<br />
scales linearly with Ip up to the 2.0 MA level at BT — 2.1 T. This is<br />
illustrated in Fig. 5. These data all have qa5 > 3.2. However, as is also<br />
shown in Fig. 5, when q95 is lowered by lowering BT to 1.5 T, the increase<br />
of confinement with Ip appears to saturate at q95 = 3. This saturation has<br />
also been confirmed by ramping the current during H-mode from 1.4 MA<br />
to 1.6 MA at 1.5 T while maintaining constant NBI input power; no<br />
change in stored plasma energy was seen. Finally, by varying the toroidal<br />
field, we have found that TE is proportional to BT at fixed qgs < 3.<br />
This lack of Ip scaling at qg5 < 3 has been seen previously at<br />
BT < 0-9 T in the high /3r portion of our work [18,19]. Since this loss of<br />
Ip scaling occurs for qg5 < 3 at a variety of /3r values, we can conclude<br />
that it is not caused by approaching a /?T limit. We have also considered<br />
the hypothesis that this loss of Ip scaling might be due to reaching the<br />
saturated Ohmic confinement level described by Shimomura, etal. [21].
E<br />
m<br />
F<br />
LU<br />
LJU<br />
Z<br />
o<br />
N_<br />
CE<br />
UU o /<br />
UJ<br />
q<br />
o<br />
CM<br />
50.0<br />
100.0<br />
0.0<br />
m<br />
0.0<br />
<strong>IAEA</strong>-CN-50/A-III-4 201<br />
BT = 1.5 T PB = 6.7<br />
• q95 i 2.8<br />
O Q95 S 3<br />
o/'er<br />
PB ,y° BT = 2.1 T = 8.5 MW<br />
/^ O
202 BURRELL et al.<br />
However, although the TE value at qa5 < 3 does depend linearly on BT as<br />
predicted in Ref. [21], it also shows the usual decrease with increasing PB-<br />
The work in Ref. [21] predicts saturation at the same value of TE independent<br />
of PB- At present, we do not have a complete explanation for the loss<br />
of Ip scaling at 995 < 3; the interaction of sawteeth <strong>and</strong> ELMs discussed<br />
previously [19] or some other g-related phenomenon remain possibilities.<br />
Although confinement improvement with Ip may not continue indefinitely,<br />
high current H-mode plasmas can produce significant TE values.<br />
As is illustrated in Fig. 6, NBI H-mode plasmas with Ip = 2.0 MA have<br />
confinement times that can exceed the saturated Ohmic value by 30% to<br />
40% at moderate input power. Even at input powers around 10 MW, T&<br />
is still equal to the Ohmic value. Since T& usually drops below the Ohmic<br />
value whenever auxiliary heating is added, finding a confinement regime<br />
where TE actually increases is significant. This result demonstrates that<br />
Ohmic confinement does not represent the maximum possible in auxiliary<br />
heated plasmas.<br />
Another set of discharges in which confinement exceeds that st<strong>and</strong>ard,<br />
saturated Ohmic value is the Ohmic H-mode. Ohmic H-mode is<br />
always triggered by a sawtooth heat pulse <strong>and</strong>, so far, is always a transient<br />
event. The longest Ohmic H-mode observed to date has lasted for 170 ms.<br />
The Ohmic H-mode is ELM-free <strong>and</strong> is quenched because of increasing<br />
radiated power caused by impurity build up. Utilizing our magnetic analysis<br />
capabilities [23], it is possible to do a time dependent confinement<br />
analysis to determine the TE during the phase prior to significant impurity<br />
accumulation. These confinement times are shown in Fig. 7. The<br />
error bars shown in Fig. 7 reflect the uncertainty due to measurement<br />
errors propagated through the time dependent analysis.<br />
111<br />
LJJ<br />
LU<br />
FINE<br />
z<br />
o<br />
>o<br />
cc<br />
LJJ<br />
CM<br />
d -<br />
d -<br />
o<br />
• OHMIC H-MODE<br />
• NORMAL OHMIC<br />
O TRANSPORT SIMULATION O<br />
1<br />
BT = 0-5>T 1,<br />
2.1 S q95 S 3.0 ol<br />
o<br />
o<br />
o T<br />
o<br />
w<br />
1 2 3 4 5 6<br />
DENSUY(10 19 rrr 3 )<br />
FIG. 7. Energy confinement time versus density for Ohmic H-mode, normal Ohmic <strong>and</strong> Alcator A<br />
simulation.
<strong>IAEA</strong>-CN-50/A-m-4 203<br />
The TB values in the Ohmic H-mode exceed the st<strong>and</strong>ard Ohmic T&<br />
value by about a factor of two. As is illustrated in Fig. 7, the st<strong>and</strong>ard<br />
Ohmic plasma in Dili—D is in the saturated Ohmic confinement regime<br />
where the energy confinement time is basically independent of density.<br />
Also shown in Fig. 7 are the results of a transport simulation which was<br />
done assuming neoclassical transport [24] for the ions <strong>and</strong> the Alcator A<br />
value of 5 X 10 ir cm" 1 ^" 1 for the electron thermal conductivity. The<br />
Ohmic H-mode values agree with these transport predictions, indicating<br />
a possible return to Alcator scaling.<br />
Unlike other regimes of improved confinement in Ohmic plasmas<br />
which require peaked density profiles [25,26], the density profiles in the<br />
Ohmic H—mode are quite broad, similar to those in auxiliary heated H—<br />
mode [22].<br />
5. COMPARISON OF LOCAL TRANSPORT IN H-<br />
AND L-MODE PLASMAS<br />
There have been several previous attempts to compare the local<br />
transport rates inside the plasma in H- <strong>and</strong> L-mode discharges [27-29].<br />
However, owing to the high densities seen in H-mode, the H- <strong>and</strong> L-mode<br />
densities in these earlier comparisons were not the same. This could have<br />
affected the results if the local transport depends on ne. We have adopted<br />
the approach of comparing H—mode divertor <strong>and</strong> L-mode limiter plasmas<br />
of essentially the same shape, Ip, BTJ ne <strong>and</strong> PB in order to ascertain<br />
whether the H—mode confinement improvement exists only in the outer<br />
few centimeters of the plasma or whether the local transport interior to<br />
the plasma also improves [30].<br />
Local transport is inferred by steady-state transport analysis with<br />
the ONETWO [31] transport code using electron density <strong>and</strong> temperature<br />
profiles measured by a 28 point Thomson scattering system, ion temperature<br />
profiles measured by an 8 point charge exchange recombination<br />
spectroscopy system, Z^ profiles from a 16 chord visible bremsstrahlung<br />
measurement <strong>and</strong> radiated power profiles from a 21 channel bolometer<br />
system. The Thomson density profile was normalized to a CO2 interferometer<br />
measurement that has the same path through the plasma. Central<br />
ion temperature information was also obtained from the measured neutron<br />
rate. The experiment was done with hydrogen beams injected into a<br />
deuterium plasma. Hydrogen edge dilution was inferred spectroscopically<br />
by using a second eight chord charge exchange recombination system. Basic<br />
conditions were BT = 2.1 T, IP = 1.25 MA, PT = 7.5 MW <strong>and</strong> ne =<br />
7.5 x 10 19 m~ 3 .<br />
In these discharges, the electron <strong>and</strong> ion temperatures agree within<br />
the error bars; consequently, the electron-ion energy exchange term is<br />
indeterminate. Accordingly, transport results are presented for a single<br />
fluid description of the plasma. Plotted in Fig. 8 is the single fluid thermal<br />
diffusivity for the H- <strong>and</strong> L-mode discharges as a function of position<br />
in the plasma. The results for the Ohmic phases of the shots are also
204 BURRELL et al.<br />
> CO<br />
t<br />
Q<br />
<<br />
DC<br />
X =<br />
H TARGET •<br />
0.0 0.2 0.4 0.6 0.8 1.0<br />
p/a<br />
FIG. 8. Thermal diffusivity versus flux coordinate for H-mode, L-mode <strong>and</strong> Ohmic (target) plasmas.<br />
shown. Error b<strong>and</strong>s are determined by propagating r<strong>and</strong>om <strong>and</strong> possible<br />
systematic errors through the analysis in the manner described by Groebner<br />
[32]. Within these errors, the thermal diffusivity in H-mode is about<br />
a factor of three lower than that in L—mode over the outer half of the<br />
plasma; however, the diffusivities are quite similar in the central region of<br />
the discharge. The H-mode diffusivity is quite comparable to the Ohmic<br />
plasma diffusivities over most of the plasma. Accordingly, it is clear that<br />
the confinement improvement in H-mode occurs over a significant portion<br />
of the plasma, not just at the plasma edge.<br />
The power balance from this analysis shows the overwhelmingly<br />
dominant energy loss process in these plasmas is heat conduction. Integrated<br />
out to the plasma edge, the radiative losses are only 20% of the<br />
input power <strong>and</strong> the convection losses are only a few percent.<br />
REFERENCES<br />
[1] WAGNER, F.W., et al., Phys. Rev. Lett. 49 (1982) 1408.<br />
[2] BURRELL, K.H., et al., Phys. Rev. Lett. 59 (1987) 1432.<br />
[3] SUZUKI, N., et al., in Controlled Fusion <strong>and</strong> Plasma Physics (Proc. 14th Eur. Conf. Madrid,<br />
1987), Vol. 11D, European Physical Society (1987) 217.<br />
[4] OHYABU, N., JAHNS, G.L., STAMBAUGH, R.D., STRAIT, E.J., Phys. Rev. Lett. 58<br />
(1987) 120.<br />
[5] LOHR, J.M., et al., Phys. Rev. Lett. 60 (1988) 2630.<br />
[6] HINTON, F.L., STAEBLER, G.M., Paper <strong>IAEA</strong>-CN-50/D-IV-15, these Proceedings, Vol. 2.
<strong>IAEA</strong>-CN-50/A-HM 205<br />
[7] OHYABU, N., OSBORNE, T.S., JAHNS, G.L., STRAIT, E.J., STAMBAUGH, E.D., Features<br />
of Edge Magnetic Turbulence in DIII-D Exp<strong>and</strong>ed Boundary Divertor Discharges, Rep.<br />
GA-A19176, General Atomics (1988), submitted to Nucl. Fusion.<br />
[8] WAGNER, F.W., et al., J. Nucl. Mater. 121 (1984) 103.<br />
[9] HILL, D.N., ALLEN, S., BROOKS, N.H., CONTENT, D., DeBOO, J.C., et al., The DIII-D<br />
Summary Contribution to the Final INTOR Workshop, Rep. GA-A19101, General Atomics<br />
(1988).<br />
[10] HINTON, F.L., STAEBLER, G.M., Collisional Transport Near a Separatrix <strong>and</strong> the H-mode,<br />
Rep. GA-A19324, General Atomics (1988), submitted to Nucl. Fusion.<br />
[11] BISHOP, CM., Nucl. Fusion 26 (1986) 1063.<br />
[12] GOHIL, P., et al., Phys. Rev. Lett. , to be published.<br />
[13] WAGNER, F.W., et al., Phys. Rev. Lett. 53 (1984) 1453.<br />
[14] HILL, D.N., PETRIE, T., MAHDAVI, M.A., LAO, L., HOWL, W., Nucl. Fusion 28 (1988)<br />
902.<br />
[15] STAMBAUGH, R., et al., Plasma Phys. Controll. Fusion 31 (1989), to be published.<br />
[16] LAO, L.L., et al., in Controlled Fusion <strong>and</strong> Plasma Heating (Proc. 15th Eur. Conf. Dubrovnik,<br />
1988), Vol. 12B, European Physical Society (1988) 393.<br />
[17] OHYABU, N., et al., ibid., p. 227.<br />
[18] STRAIT, E.J., et al., Paper <strong>IAEA</strong>-CN-50/A-II-l, these Proceedings, Vol. 1.<br />
[19] SCHISSEL, D.P., et al., Energy Confinement Properties of H-mode Discharges in the DIII-D<br />
Tokamak, Rep. GA-A19243, General Atomics (1988), submitted to Nucl. Fusion.<br />
[20] WAGNER, F., Confinement Studies on ASDEX, Rep. IPP EI/131, Max-Planck-Institut fur Plasmaphysik<br />
(1988).<br />
[21] SHIMOMURA, Y., et al., Empirical Scaling of Energy Confinement Time of L-Mode <strong>and</strong><br />
Optimized Mode <strong>and</strong> Some Considerations of Reactor Core Plasma in Tokamak, Rep. JAERI-<br />
M-87-080, Japan Atomic Energy Research Institute (1987).<br />
[22] OSBORNE, T.H., et al., Observation of H-Mode in Ohmically Heated Divertor Discharges in<br />
Dm-D, Rep. GA-A19362, General Atomics (1988).<br />
[23] LAO, L.L., et al., Nucl. Fusion 25 (1985) 1611.<br />
[24] CHANG, C.S., HINTON, F.L., Phys. Fluids 25 (1982) 1493.<br />
[25] GREENWALD, M., et al., Nucl. Fusion 25 (1985) 1127.<br />
[26] SOLDNER, F.X., et al., Phys. Rev. Lett. 61 (1988) 1105.<br />
[27] BECKER, G., et al., Nucl. Fusion 23 (1983) 1293.<br />
[28] KAYE, S.M., et al., Nucl. Fusion 24 (1984) 1303.<br />
[29] KEILHACKER, M., et al., in Controlled Fusion <strong>and</strong> Plasma Heating (Proc. 15th Eur. Conf.<br />
Dubrovnik, 1988), Vol. 12B, European Physical Society (1988) 231.<br />
[30] JAHNS, G.L., GROEBNER, R.J., St. JOHN, H., Comparison of Transport in H- <strong>and</strong> L-Phase<br />
Discharges in the DDI-D Tokamak, Rep. GA-A19376, General Atomics (1988).<br />
[31] PFEIFFER, W., et al., Nucl. Fusion 25 (1985) 655.<br />
[32] GROEBNER, R.J., et al., Nucl. Fusion 26 (1986) 543.
CONFINEMENT STUDIES OF THE H-MODE<br />
ON JFT-2M<br />
<strong>IAEA</strong>-CN-50/A-IH-5<br />
N. SUZUKI, A. AIKAWA, K. HOSHINO, S. KASAI,<br />
T. KAWAKAMI, H. KAWASHIMA, T. KONDOH 1 , H. MAEDA,<br />
T. MATSUDA, H. MATSUMOTO, Y. MIURA, M. MORI,<br />
I. NAKAZAWA 2 , K. ODAJIMA, H. OGAWA, T. OGAWA,<br />
K. OHASA, H. OHTSUKA, S. SENGOKU, T. SHOJI, H. TAMAI,<br />
Y. UESUGI, T. YAMAMOTO, T. YAMAUCHI, K. HASEGAWA,<br />
A. HONDA, I. ISHIBORI, Y. KASHIWA, M. KAZAWA,<br />
K. KIKUCHI, H. OKANO, E. SATO, T. SHIBATA, T. SHIINA,<br />
K. SUZUKI, T. TANI, T. TOKUTAKE, S. UNO<br />
Department of Thermonuclear Fusion Research,<br />
Naka Fusion Research Establishment,<br />
Japan Atomic Energy Research Institute,<br />
Tokai-mura, Naka-gun, Ibaraki-ken,<br />
Japan<br />
Abstract<br />
CONFINEMENT STUDIES OF THE H-MODE ON JFT-2M.<br />
Experimental results showing improved plasma confinement <strong>and</strong> permitting a better underst<strong>and</strong>ing<br />
of the H-mode are presented: (1) The H-mode phase is sustained during a beam pulse of 300 ms<br />
in a high safety factor plasma although the total stored energy, Wdia, decreases with time; (2) the<br />
dependence of Wdia on the electron density in the H-mode is considered by distinguishing between<br />
electron energy <strong>and</strong> ion energy; (3) the dependence of Wdi!1 on the heating power in the H-mode can<br />
be described by the incremental confinement time, TirK, whose value is nearly the same as that in the<br />
L-mode; the increase in Wdis following the L-H transition comes mainly from pedestal formation;<br />
(4) the value of 7irlc increases linearly with the plasma current for surface safety factors of up to 3 in<br />
both the L-mode <strong>and</strong> the H-mode; (5) the isotope effect is clearly observed as a factor of 1.4 in Tinc in<br />
the two cases (H° into H + versus H° into D + ); (6) the quality of the limiter H-mode degrades with<br />
decreasing elongation; (7) four-pellet injection under optimized conditions results in an additional<br />
increase in Wdia of about 10 kJ (this value is about 30% higher than that obtained by usual gas<br />
puffing); (8) an improved L-mode is observed, which appears after the H-L transition, the value of<br />
Wdia frequently exceeding that of the preceding H-mode.<br />
1. INTRODUCTION AND EXPERIMENTAL ARRANGEMENT<br />
A high confinement mode, the H-mode, has been observed in both divertor <strong>and</strong><br />
limiter configurations with various heating methods on JFT-2M [1-5]. The characteristics<br />
of the H-mode vary considerably from good in a single-null divertor to less<br />
1 On leave from University of Tsukuba, Japan.<br />
2 On leave from Mitsubishi Electric Co., Japan.<br />
207
208 SUZUKI et al.<br />
favourable in a circular limiter configuration. In this paper, we present recent<br />
experimental results showing an improved H-mode <strong>and</strong> allowing a better underst<strong>and</strong>ing<br />
of the H-mode.<br />
Graphite plates were placed on the vacuum chamber wall (inside wall completely<br />
<strong>and</strong> outside wall partially covered) in order to reduce the metal impurities.<br />
Hydrogen neutral beam pulses were extended up to 300 ms to allow the observation<br />
of the H-mode evolution for a longer time, <strong>and</strong> a balanced injection of co- <strong>and</strong><br />
counter-beams was used for observing the dependence on the heating power up to a<br />
maximum input of 1.6 MW into the torus. The net input power is estimated to be<br />
90% <strong>and</strong> 70% of the torus input for co-injection <strong>and</strong> for counter-injection, respectively.<br />
As a new diagnostic, three more channels for ECE measurement were<br />
installed to allow improved measurements of the Te profiles, especially near the<br />
plasma edge. The total stored energy is estimated mainly from diamagnetic<br />
measurements.<br />
2. PARAMETER DEPENDENCE OF H-MODE CONFINEMENT<br />
As is well known, the L-H transition occurs abruptly when the heating power<br />
<strong>and</strong> the electron density exceed their respective threshold values (P,h, Nth) [6]. The<br />
'pedestal' of the electron temperature, T^, is then quickly formed <strong>and</strong> the establishment<br />
of an electron density pedestal, N^, follows in typically 50 ms. After this<br />
formative phase, the total stored energy Wdia as estimated from diamagnetic measurements<br />
approaches its peak value, then decreases gradually. During this slow decay<br />
phase of Wdia, the time evolution of the electron density, n,.(t), typically evolves into<br />
one of the two types. In the first case, n
40<br />
30<br />
ft 20<br />
a<br />
10<br />
50<br />
40<br />
30<br />
20<br />
10<br />
(b)<br />
<strong>IAEA</strong>-CN-50/A-m-S 209<br />
4 6<br />
Te (xl0 l9 m- 3 )<br />
LSN<br />
Br=l.25T,CW<br />
Co-Inj.-75OkW<br />
dr.- In|.- 75OkW<br />
i • I i<br />
-1 r 1 1 1 i I<br />
Lorge Da Pellets _*-• *<br />
Small 02 Pellels-<br />
Gas<br />
•"Ohmic<br />
4 6<br />
"ne (xl0 19 m- 3 )<br />
xw<br />
LSN<br />
8<br />
BT = 1.28T,CW<br />
IP = 280kA<br />
H°— 0*-<br />
Co-Inj. = 8OOkW<br />
Clr.-Inj.» 750 kW<br />
i i i<br />
FIG. 1. (a) Total stored energy, Wdia, versus line averaged electron density in Ohmic phase <strong>and</strong> in<br />
H-mode. Ip is scanned from 175 to 290 kA in the lower single-null divertor configuration (LSN), the<br />
ion grad-B drift is directed downwards. The electron density is changed in the Ohmic phase by means<br />
of gas puffing. Wdia data are collected around its peak value. The dependence of Wdia on electron<br />
density saturates in the high density region.<br />
(b) Wdia versus line averaged electron density for pellet injection <strong>and</strong> gas puffing. Pellet injection<br />
is of two types: small pellets correspond to pellet ablation far from the plasma centre; large pellets<br />
imply pellet ablation near the plasma centre. The additional increase in Wdia due to pellet injection is<br />
about 10 kJ for large pellets.<br />
8
210 SUZUKI etal.<br />
As the neutral beam power PNB is raised with balanced injection (equal co- <strong>and</strong><br />
counter-injection power), the H-transition occurs just at P^, <strong>and</strong> Wdia jumps from<br />
the L- to the H-mode value as is shown in Fig. 2. This increase in W^ apparently<br />
comes from the formation of a pedestal on Te(r) <strong>and</strong> n^r); it may also originate<br />
from an increase in W;. In the case of JFT-2M, the H-mode with edge localized<br />
modes (ELMs) appears only near P^ <strong>and</strong> Na,, <strong>and</strong> W^ attains values that are<br />
slightly lower than those observed in the absence of ELMs. WdLa without ELMs<br />
increases linearly with increasing PNB. Here, it should be noted that the increment<br />
of Wdia with PNB has offset linear features just as in the L-mode. It is, therefore,<br />
appropriate to define the incremental confinement time, Tmc, as the slope of linear<br />
fitting at the same electron density, as is shown in Fig. 2. The value of Tinc for the<br />
H-mode is somewhat larger (10-20%) than that for the L-mode; it remains, however,<br />
approximately one fourth to one half of the gross Ohmic confinement time. The gross<br />
energy confinement time, TG, in the H-mode has a maximum near P^ <strong>and</strong> decreases<br />
with increasing PNB.<br />
The value of rinc increases linearly with Ip in both H + <strong>and</strong> D + plasmas, as is<br />
shown in Fig. 2, but saturates when the surface safety factor qs < 3. This<br />
behaviour may be due to some MHD activity in the low-qs region. The increase in<br />
Wdia due to the L-H transition also increases with Ip. Here, N^ increases with<br />
increasing Ip, but Tp^ remains almost constant. The increase in We with Ip is, therefore,<br />
due to an increase in the electron density. The reason for constant Tp^, is<br />
unclear.<br />
Among the various features of the H-mode phase, we consider the pedestal<br />
formation to be crucial. From this viewpoint, we have obtained a steady pedestal, but<br />
a stationary H-mode with steady Wdia is very difficult to realize. The main problem<br />
to be solved is the impurity accumulation during the latter H-mode phase. An effort<br />
to reduce the metal impurities by using a carbon wall resulted in a longer lived<br />
H-mode. We could obtain a fairly constant value of n^t) in a high-qs plasma<br />
(qs > 4); Wdia, however, decayed slowly. This slow decay of Wdia seems to result<br />
from a decrease in Wj since the decrease in We is very small. One reason for this<br />
decay of W; may be the decrease in ion density resulting from light impurity<br />
accumulation. Hence, further studies of plasmas free from all impurities are required.<br />
When H + <strong>and</strong> D + plasmas are compared, 7inc for D + plasma heated with H°<br />
beams is longer than T^ obtained for H + , by a factor of about 1.4 in the L-mode<br />
<strong>and</strong> also in the H-mode. In the H-mode, T-mc exhibits almost the same isotope effect;<br />
the increment in W^., due to the L-H transition is, however, larger for H + than for<br />
D + plasmas. For medium input power levels, therefore, the values of T0 for H + <strong>and</strong><br />
D + appear to be almost identical.<br />
The so-called limiter H-mode has been observed in various magnetic configurations<br />
with no null point in the plasma region. The quality of this H-mode degrades<br />
with decreasing plasma elongation. In a limiter discharge with strong elongation, the<br />
quality of the limiter H-mode approaches that in a double-null divertor, but in a<br />
circular limiter discharge the increase in W^ due to the L-H transition is negligibly
30<br />
10<br />
o : Ohmic Fei9 "1.0-4<br />
• : L-rtwfe Fel3 • 2.6103<br />
»:H-moJe with ELM's<br />
- o ' H-ro* a, • 5.0 to.s<br />
IWIS.'"'<br />
H-rafe<br />
L-mJi<br />
0.5<br />
LSH USH<br />
Bt-1.2ST.CW<br />
Iflj.<br />
JL<br />
LSN, If 250kA<br />
Bt-I.25T,CW<br />
Bolonccd Inj<br />
t i i I l i i i I-_J L.<br />
1.0<br />
1.5<br />
( MW )<br />
0.1 0.2<br />
tf> (MA)<br />
<strong>IAEA</strong>-CN-50/A-III-5 211<br />
30<br />
— 20<br />
1 ro<br />
: Ohmic Fel9 • 1.0-3.5<br />
* : L-mode rT,,, "2.4 io.3<br />
t, : H-mod: wild ELM's<br />
o : H-nrxit F,n -5.0 ioJ<br />
IW|550kW<br />
H-moh<br />
(b)<br />
•25OkA "<br />
BT"1.25T,CV.'<br />
Balanced Inj.<br />
0.5 1.0 1.5<br />
LSH USH<br />
T<br />
A<br />
JL<br />
BT-I.25T.CW<br />
H° — H*<br />
Balanutf ln|.<br />
0.1 0.2<br />
IP(MA)<br />
FIG. 2. (a) Wdia versus total input power in Ohmic phase, L-mode <strong>and</strong> H-mode. A hydrogen neutral<br />
beam, H°, is injected into a D + plasma by using balanced injection. Wdia data are collected around its<br />
peak value for the density ranges shown in the figure.<br />
(b) Wdia versus total input power. An H° beam is injected into an H + plasma.<br />
(c) Incremental confinement time, Tinc, versus Ip in L-mode <strong>and</strong> H-mode. An H° beam is<br />
injected into a D + plasma by using balanced injection. The position of the null point is changed from<br />
lower (LSN) to upper (USN) in order to check the Tinc value in the L-mode.<br />
(d) Tlnc versus Ip in L-mode <strong>and</strong> H-mode. An H° beam is injected into an H + plasma. The rinc<br />
values are almost the same for LSN <strong>and</strong> USN.<br />
small <strong>and</strong> the duration of the H-mode is less than 100 ms. This dependence on the<br />
plasma elongation may result from the shear effect. Other dependences of the limiter<br />
H-mode parameters on Ip, Bt, H,, <strong>and</strong> the gas species are similar to that in a singlenull<br />
divertor.<br />
r"<br />
(d)<br />
0.3
212 SUZUKI et al.<br />
3. FOUR-PELLET INJECTION<br />
A four-pellet injector has recently been installed on JFT-2M. Three small<br />
pellets (1.28 x 1.4 mm) <strong>and</strong> one large pellet (1.48 x 1.6 mm) can be injected<br />
independently at pellet speeds of 0.8-2.4 km-s" 1 . Studies of injection timing <strong>and</strong><br />
pellet size established an optimum condition for improved confinement with pellet<br />
injection, namely the almost simultaneous injection of four pellets in the early phase<br />
of the neutral beam pulse. A key point of this condition is deep penetration of the<br />
pellets close to the plasma centre (large pellet). When the ablation of the pellets<br />
occurs far from the plasma centre (small pellet), the value of Wdia obtained with<br />
pellet injection is almost the same as that observed using gas puffing although H,.<br />
jumps to a high level. In the optimum condition, the additional increase in Wdia due<br />
to pellet injection is about 10 kJ, as is shown in Fig. l(b). This value represents an<br />
improvement of about 30% over gas puffing. This improvement in Wdia seems to<br />
arise from an increase in Wj, but the reason for this behaviour will only be clear<br />
when data on profiles exist. In the later phase of good shots, the problem as seen in<br />
the usual H-mode becomes more severe, i.e. the rapid accumulation of impurities<br />
accelerates the decay of Wdia. Here, the isotope effect is again observed when H2<br />
<strong>and</strong> D2 pellets are used. The additional increase in Wdia was about 10 kJ for D2<br />
pellets <strong>and</strong> about 5 kJ for H2 pellets.<br />
4. AN IMPROVED L-MODE<br />
An improved L-mode, which is distinguished from the usual L-mode by a<br />
higher value of W^, was observed in limiter discharges with medium elongation<br />
<strong>and</strong> in divertor plasmas heated by a helium neutral beam [7]. This mode appears after<br />
the H-L transition, <strong>and</strong> the value of Wdia frequently exceeds that in the preceding<br />
H-mode. The Te pedestal disappears, but Te in the central plasma region increases.<br />
The n,. pedestal decreases, but the value of H,. remains high. These features represent<br />
the establishment of peaked Te <strong>and</strong> n,. profiles. The centre peaked radiation profile<br />
may suggest impurity accumulation. Careful investigations should, therefore, be<br />
carried out to determine the usefulness of this mode.<br />
ACKNOWLEDGEMENTS<br />
The authors are grateful to Drs S. Shimamoto, M. Tanaka, M. Yoshikawa <strong>and</strong><br />
S. Mori for continuous encouragement.
<strong>IAEA</strong>-CN-50/A-m-S 213<br />
REFERENCES<br />
[1] SHOJI, T., et al., in Controlled Fusion <strong>and</strong> Plasma Heating (Proc. 11th Eur. Conf. Aachen,<br />
1983), Vol. 7D, Part I, European Physical Society (1983) 55.<br />
[2] SENGOKU, S., et al., J. Nucl. Mater. 145/147 (1987) 556.<br />
[3] MATSUMOTO, H., et al., Nucl. Fusion 27 (1987) 1181.<br />
[4] ODAJIMA, K., et al., in Plasma Physics <strong>and</strong> Controlled <strong>Nuclear</strong> Fusion Research 1986 (Proc.<br />
11th Int. Conf. Kyoto, 1986), Vol. 1, <strong>IAEA</strong>, Vienna (1987) 151.<br />
[5] HOSHINO, K., et al., Nucl. Fusion 28 (1988) 301.<br />
[6] SUZUKI, N., et al., in Controlled Fusion <strong>and</strong> Plasma Physics (Proc. 14th Eur. Conf. Madrid,<br />
1987), Vol. 11D, Part 1, European Physical Society (1987) 217.<br />
[7] MORI, M., et al., to be published in Nucl. Fusion.
HEATING OF PEAKED DENSITY PROFILES<br />
PRODUCED BY PELLET INJECTION IN JET<br />
JET TEAM*<br />
(Presented by G.L. Schmidt)<br />
JET Joint Undertaking,<br />
Abingdon, Oxfordshire,<br />
United Kingdom<br />
Abstract<br />
<strong>IAEA</strong>-CN-50/A-IV-l<br />
HEATING OF PEAKED DENSITY PROFILES PRODUCED BY PELLET INJECTION IN JET.<br />
A transient enhancement in performance of JET limiter discharges has been obtained when a<br />
peaked density profile formed by pellet injection is heated by using either ICRH alone or in combination<br />
with NBI. Pellet ftielling is applied during the current rise. Heating follows the fuelling sequence <strong>and</strong><br />
must be localized predominantly within the plasma core. Electron density profiles are strongly peaked<br />
immediately following the pellet injection sequence, ne(0)/vo| < 5, <strong>and</strong> retain a central peak while<br />
decaying during the period of enhancement. At a power level of 19 MW (Prr = 12.5 MW,<br />
Pnb = 5 MW <strong>and</strong> Poh = 1.5 MW) <strong>and</strong> a central density of 6 x 10 19 m~\ central ion <strong>and</strong> electron temperatures<br />
of 10.5 <strong>and</strong> 12 keV are obtained in 3 MA, 3.1 T discharges. Global energy confinement<br />
1.6 times the L-mode level has been obtained. Values of nd(0)Ti(0)TE(a) in the range from 1 to<br />
2 x 10 20 rn" 3 -keV-s are achieved. Peak neutron rates can exceed those in similar, non-enhanced shots<br />
by factors of three to five <strong>and</strong> increase strongly with heating power. Central ion <strong>and</strong> electron pressure<br />
can be enhanced by a factor of two to three. Electron pressure can be > 1 bar with a gradient of<br />
4 bar-m" 1 . Ballooning stability limits are approached within the plasma core. The period of enhanced<br />
performance has extended up to 1.2 s into the heating pulse, terminating spontaneously. The longest<br />
periods terminate with enhanced fluctuations <strong>and</strong> a strong <strong>and</strong> rapid decrease in central electron <strong>and</strong> ion<br />
temperatures. Although MHD activity can be present during this period, no sawtooth activity appears.<br />
1. Introduction<br />
The combination of peaked density profiles produced by pellet fueling with strong,<br />
central ICRF heating has been proposed as a means to enhance performance of limiter<br />
discharges! 1,2,3]. Such experiments have begun on JET using a pellet injector system<br />
jointly built as pan of the JET/USDOE collaboration on pellet fueling. The fueling<br />
source is a multi-barrel, multiple pellet, pneumatic launcher developed at Oak Ridge<br />
National Laboratory[4]. Initial results were reported previously[4,5,6,7]. Improved<br />
performance has been obtained with peaked density profiles in previous ohmic <strong>and</strong><br />
NBI heated experiments[2,8,9,10,llj <strong>and</strong> recently with RF heating in divertor configuration<br />
[12]. Experiments on TFTR[13] <strong>and</strong> JET[14], with high auxiliary heating<br />
power, have demonstrated improved performance in limiter configurations at high<br />
* See Appendix I to this paper.<br />
215
216 JET TEAM<br />
temperatures. In those experiments, neutral beam injection was used both to produce<br />
<strong>and</strong> to heat peaked density profiles. We describe here experiments which demonstrate<br />
for the first time improved performance in limiter discharges fueled by pellets <strong>and</strong><br />
heated by ICRH to ion <strong>and</strong> electron temperatures >5ke V. We describe first how peaked<br />
density profiles are generated by pellet injection. Such profiles form the target for RF<br />
heating. The period of enhanced performance is then discussed.<br />
2. Production of Peaked Profiles<br />
Pellet injecton prior to the heating pulse is used to produce a peaked density<br />
profile. Both single <strong>and</strong> multiple pellet sequences have been used. Pellet fueling<br />
occurs during the current ramp phase. Primarily 3MA discharges have been<br />
studied. Fueling efficiency in these ohmic scenarios is high (AnJn^D.7) <strong>and</strong> not<br />
strongly dependent on penetration. The remaining mass is likely to be lost in the<br />
formation <strong>and</strong> acceleration process. Strongly peaked profiles have been obtained<br />
only by penetration to or beyond the magnetic axis. Such penetration is obtained<br />
either by a sequence of 2.7mm pellets alone (TxlO^D 0 per pellet, 5 to 7 pellets at<br />
2.5Hz) or a combination of fewer 2.7mm <strong>and</strong> a single 4mm pellet (2.5xlO"D°).<br />
Peaking factors, ne(0y,OI, from 2.6 to 5 are obtained with central densities of<br />
from 0.8 to 2 xlOrn" 1 . Line average density exceeds the 3MA ohmic density limit<br />
in JET[7]. Density is limited in pellet cases by the appearance of mhd activity<br />
(Quasi Stationary Modes), which leads to rapid loss of particles <strong>and</strong> can precipitate<br />
a plasma disruption [15,16]. In the absence of QSMs, the peaked density<br />
profile, once formed, decays slowly with a time constant which can be >2s.<br />
Average ZM immediately after pellet injection can be
Yd<br />
o<br />
g<br />
a> -<br />
c 4<br />
_n ...—<br />
0)<br />
n<br />
12<br />
t-%<br />
n<br />
A Ip<br />
RR6-10MW<br />
•«— Enhanced —^/<br />
/I<br />
4<br />
Time (s)<br />
<strong>IAEA</strong>-CN-50/A-IV-l 217<br />
a<br />
b<br />
3<br />
MA<br />
-2<br />
/7G. 1. Discharge pverview: strong (I) pulse No. 1621] <strong>and</strong> weak (II) pulse No. 16206pellet perturbations:<br />
(a) plasma current, central density, <strong>and</strong> RF heating power; (b) central electron temperature<br />
(secondharmonic ECE); (c) neutron rate; (d) central ion temperature (Doppler broadening. He-like Ni).<br />
at 3s in both cases. In case I, an earlier 2.7mm pellet has been injected at 1.5s to<br />
lower the central temperature, <strong>and</strong> thereby allow penetration to the magnetic axis<br />
at 3s. Auxiliary heating begins at 3.2s, <strong>and</strong> is then maintained at roughly a constant<br />
level. A period of enhanced performance is obtained in case I beginning with the<br />
onset of heating, <strong>and</strong> ending with a rapid decrease of central ion <strong>and</strong> electron<br />
temperature at 4.4s.<br />
During the heating pulse, the total electron particle content remains roughly<br />
constant in both these cases. For case I, the central electron density decays from<br />
the peak values reached after pellet injection. The decay rate is faster than that<br />
observed in the absence of heating but remains in the range 4 to 6xlO"m 3 s".<br />
Initially, central electron temperatures increase at similar rates in both cases<br />
although density in the enhanced case is 3x higher. Final electron <strong>and</strong> ion<br />
temperatures are larger in the enhanced case by factors of 1.5 <strong>and</strong> 2. As shown in<br />
Figs, lc <strong>and</strong> 2, neutron levels reflect these enhancements in core parameters,<br />
increasing strongly with RF power <strong>and</strong> exceeding no-pellet results by factors of<br />
3 to 5. On a 1 s timescale, impurity ion profiles develop which are markedly more
218 JET TEAM<br />
0.1<br />
5 10<br />
Input Power (MW)<br />
FIG. 2. Neutron rate as function of input power for RF heating only. Solid squares: enhanced phase.<br />
Open squares: later phase (t > 4.4 s).<br />
peaked than n, within the plasma core. Such behaviour is expected from neoclassical<br />
transport 17,18]. Outside the core, the usual broad n, profiles are observed.<br />
The ratio nI(0)/nI(a/2)=2. As a result, central Zofr is some 30% higher <strong>and</strong> n/n,<br />
somewhat lower than the average value. Depending on the mix of heating power<br />
applied <strong>and</strong> the resulting range of O, C <strong>and</strong> Ni levels obtained, central Zeff after 1 s<br />
varies from 2.5 to 4 <strong>and</strong> nyn. from 0.75 to 0.5. The core power balance is little<br />
affected by radiated power losses. In the best cases, the period of enhancement<br />
terminates as shown with an abrupt loss of central temperature, density <strong>and</strong><br />
accumulation. Sawtooth oscillations do not appear prior to, or during, the times<br />
of interest.<br />
Enhanced core temperatures are obtained only in cases where a strong perturbation<br />
of the density <strong>and</strong> electron temperature is produced, <strong>and</strong> for which the RF<br />
resonance was located within the plasma core. The effect is not dependent on a<br />
particular \ spectrum, <strong>and</strong> has been obtained using either monopole (k,, = 0) or<br />
dipole (ku=7m 1 ) antenna phasing. The enhancement is obtained with H or He 3<br />
minority heating, indicating the effect is not associated simply with a nonmaxwellian<br />
tail produced by second harmonic heating of the backround deuterium.<br />
Neutron emission is predominantly thermal in origin. Enhanced temperatures<br />
<strong>and</strong> neutron yield are not obtained when the resonance location (resonance<br />
half width 0.3m) is shifted 0.5m from the magnetic axis, to the region outside the
1.3<br />
I" 1<br />
|03<br />
C<br />
0.5<br />
i:<br />
12<br />
8<br />
4<br />
n<br />
-<br />
Te<br />
T,<br />
-{ =<br />
• a<br />
/<br />
<strong>IAEA</strong>-CN-50/A-IV-l 219<br />
NP<br />
P\<br />
1 p<br />
/ _\<br />
/ /—^\V ^<br />
\<br />
\<br />
.}NP ~~<br />
1 . . .<br />
2 3 4<br />
Major radius (m)<br />
FIG. 3. Profiles of electron density at 3.0 <strong>and</strong> 4.2 s <strong>and</strong> electron temperature (Thomson scattering) <strong>and</strong><br />
ion temperature (charge exchange spectroscopy) at 4.2 s for pellet (P) <strong>and</strong> no-pellet (NP) cases. Timing<br />
of fuelling <strong>and</strong> heating as in Fig. 1. Heating power (P): RF - 12.5 MW, NBI - 5 MW;<br />
(NP): RF - 11.5 MW, NBI - 5 MW (pulse numbers: 17749/17747). Solid squares: pellet case ion temperature;<br />
open squares: no-pellet case ion temperature.<br />
plasma core. Similarly the enhancement in central electron <strong>and</strong> ion heating is<br />
diminished as the neutral beam heating power is increased. At high density in JET,<br />
power deposition profiles for 40keV/nucleon beam heating are not strongly<br />
peaked within the plasma core.<br />
Fig. 3 shows density <strong>and</strong> temperature profiles after pellet injection <strong>and</strong> near the<br />
termination of the enhanced period for a pellet <strong>and</strong> no-pellet pulse. Within a<br />
central region of approximately 0.7m diameter, the profiles differ both in<br />
magnitude <strong>and</strong> scale length. In the pellet case, although the central value of the<br />
electron density decays from 1.35 to 0.6x 1 CP'ta- 3 during the first 1 s of the heating<br />
pulse, the gradient scale length of the core density perturbation has only increased<br />
from 0.5 to 0.6m. The gradient scale length of the temperature profile, both for<br />
ions <strong>and</strong> electrons, is more than 2x smaller in the pellet case than in the no-pellet<br />
case. The electron temperature profile differs markedly from a triangular shape.<br />
The concurrence of higher density <strong>and</strong> temperature within this core plasma<br />
implies enhanced central electron pressure <strong>and</strong> pressure gradients as illustrated in<br />
Fig. 4. The ideal mhd ballooning stability of the equilibria corresponding to these<br />
3.0 s<br />
4.2s<br />
4.2 s<br />
-<br />
-<br />
-
220 JET TEAM<br />
1.00<br />
0.75<br />
0.50<br />
0.25<br />
0.00<br />
4.2 s<br />
2.5 3.0 3.5<br />
Major radius (m)<br />
FIG. 4. Profiles of electron pressure (Thomson scattering) for the pellet (P) <strong>and</strong> no-pellet (NP) cases<br />
of Fig. 3.<br />
profiles has been determined using the code HBT[19], assuming a magnetic<br />
geometry taken from the equilibrium identification code IDENTC <strong>and</strong> a radial<br />
profile of the total pressure as given by the electron pressure. The magnitude of<br />
the pressure is normalized by the Shafranov p (mhd). The ratio of mhd to<br />
diamagnetic p indicates the fast ion contribution to the total pressure is small.<br />
However, the influence of the fast ion pressure <strong>and</strong> its gradient within the plasma<br />
core may affect plasma stability locally[20]. This effect has not been included in<br />
the present calculations. Results of stability calculations are shown in Fig. 5<br />
assuming the q profile to be monotonic. For fixed q(a) the radial variation of the<br />
pressure gradient with shear <strong>and</strong> the first stability boundary vary with q(0). Two<br />
values of q(0) are shown in the range of the measured value 1.2 (Fig. 8). The<br />
discharge has reached the first stability boundary within the plasma core (r/a=0.3).<br />
Although the maximum p obtained is only 40% of the critical Troyon value for<br />
optimized profiles, the value of ep is 1.1 to 1.2 times the maximum value for<br />
ballooning stability corresponding to the experimental profiles. Should q(0) reach<br />
1.5 the discharge would be marginally stable. The further increase in q(0), which<br />
can be attained with multiple pellet injection sequences (Fig. 8), <strong>and</strong> the potential<br />
improvement in the stability boundary associated with such a change remains to<br />
be exploited as a means to obtain stable operation at higher pressure <strong>and</strong> low shear.<br />
4.0
<strong>IAEA</strong>-CN-50/A-IV-l 221<br />
1 2 3<br />
Q,_-2ffoRqc,l -JJ dg<br />
d^<br />
FIG. 5. Stability diagram for pellet case similar to Fig. 4. The s-a values of the discharge (experimental)<br />
are shown assuming central q values of 1 <strong>and</strong> 1.2. The stability boundaries shown are obtained by<br />
perturbation of the measured pressure profile assuming central q values of 1 <strong>and</strong> 1.5. Values of s-a<br />
above or to the left of the boundary are stable.<br />
8T<br />
Although some pellet discharges may approach the stability boundary, the<br />
level of incoherent magnetic fluctuations measured externally is approximately<br />
the same as is generally observed during auxiliary heating. Low-level, coherent,<br />
mhd oscillations <strong>and</strong> electron temperature relaxations are observed during the<br />
period of enhanced performance both on <strong>and</strong> off-axis; but no specific correlation<br />
has yet been established between the level of these fluctuations <strong>and</strong> loss of<br />
enhanced performance. Bursts of mhd activity during the heating can diminish<br />
neutron yield. In cases of longest duration, the period of enhanced performance<br />
is terminated by an abrupt collapse of the central electron temperature (Fig. 1).<br />
Analysis of soft X-ray <strong>and</strong> ECE measurements shows that the collapse does not<br />
follow the JET sawtooth behaviour[21 ]. A complex radial temperature redistribution<br />
occurs with the temperature profile often exhibiting two inversion radii. Up<br />
to 100|4.s proceeding the collapse, no growing m=n=l core displacement is<br />
detected. Successor oscillations are often present with a variety of m,n numbers.<br />
The dominant mode is usually m=3,n=2 centered about r=0.25m while edge<br />
magnetic measurements show a spectrum of modes with n < 8. The mode numbers<br />
of the successor oscillations, their spectral extent <strong>and</strong> the fact that sawteeth do not<br />
appear throughout the period of heating all indicate that q(0)>l during this period.
222 JET TEAM<br />
FIG. 6. i)e as a junction of minor radius following pellet injection at 3 s (pulse No. 16235) <strong>and</strong> 3. 75 s<br />
(pulse No. 17749 - solid points), <strong>and</strong> at 4.2 s during a no-pellet pulse (pulse No. 17747 - open points).<br />
3.2 Energy Confinement<br />
The pellet fueling sequence perturbs several plasma parameters likely to affect<br />
both heating <strong>and</strong> thermal energy transport, but the mechanism responsible for the<br />
enhanced performance is not yet established.<br />
The combined change in ion density <strong>and</strong> temperature profiles alters the<br />
discharge •n,. parameter [dln(T.)/dln(n.)]. Assuming electron <strong>and</strong> ion temperature<br />
profiles are similar, the T)e parameter shown in Fig. 6 reflects n,. during periods<br />
early in the enhancement phase when dilution effects are small. Following pellet<br />
injection, r\e is first strongly reduced within the plasma core by the formation of<br />
a peaked density <strong>and</strong> broad temperature profile. During the subsequent period of<br />
heating <strong>and</strong> density decay, the radial variation in n, reflects the evolving shape of<br />
the density <strong>and</strong> temperature profiles. Within the plasma core (r/a
2<br />
q(o)<br />
1-<br />
10<br />
1 U<br />
•<br />
O<br />
•<br />
<strong>IAEA</strong>-CN-50/A-IV-l 223<br />
D<br />
a<br />
a D<br />
• • ° a<br />
I<br />
* 1 T - '. •"<br />
> 8<br />
=§. 6<br />
4nlm<br />
3" 2.7mm<br />
• 4<br />
2<br />
/<br />
n<br />
V—-v. "*<br />
1 Time (s)<br />
—rrT<br />
» 16211<br />
o 14550<br />
• 0<br />
Heating<br />
16211 /<br />
/ j-<br />
/ 7x2.7 mm<br />
' (2.5Hz)<br />
F/G. 7. Evolution of q(0) from Faraday rotation measurements <strong>and</strong> TJO); 2.7 mm <strong>and</strong> 4 mm pellet<br />
sequences.<br />
The current profile is altered by the perturbation of T, resulting from pellet<br />
injection <strong>and</strong> the subsequent heating. The evolution of q(0) obtained from<br />
Faraday rotation measurements is shown in Fig. 7 for a multiple 2.7mm <strong>and</strong> a<br />
4mm pellet sequence. In these cases, the error in q(0) is estimated to be ±25%.<br />
Current diffusion calculations are in general agreement with these measurements.<br />
The calculations take the measured value of q(0) at t=ls, assume neoclassical<br />
resistivity including a bootstrap current, <strong>and</strong> vary the resistivity through the Zctf<br />
term to match the measured surface voltage. In both sequences, q(0) is greater than<br />
1 during the heating pulse, more strongly in the 2.7mm sequence, due to the<br />
extended duration of the temperature purturbation. During the heating following<br />
the 4mm sequence, q(0) rises slightly <strong>and</strong> the q profile broadens markedly. In nopellet<br />
pulses, however, Faraday rotation measurements indicate that a similar<br />
effect may also occur. For pellet fuelled discharges, current diffusion calculations<br />
attribute this evolution to a substantial bootstrap effect (Ibooua,I/^Mm.s0-2), which<br />
in combination with the pellet perturbation can ultimately create a region of<br />
negative shear within the plasma core. Such a profile is potentially unstable <strong>and</strong><br />
could be responsible for the abrupt termination of enhanced performance phase.
224 JET TEAM<br />
TABLE I. PULSE NUMBERS 17749/17747<br />
4.2s/3.5m<br />
Ptet(MW)<br />
na(x10 19 m- 3 )<br />
n,=0.7na<br />
n^O.Sn.<br />
VT,(keVnr 1 )<br />
VT (keVnrr 1 )<br />
n.VT,<br />
n.VT.<br />
Pellet<br />
19<br />
5.5<br />
-<br />
2.8<br />
26<br />
35<br />
55<br />
192<br />
No-Pellet<br />
17.5<br />
3.4<br />
2.4<br />
-<br />
10<br />
6.8<br />
24<br />
23<br />
Finally, density perturbations may cause variations in minority concentration.<br />
Such a variation can change the direct heating of the ions <strong>and</strong> electrons altering<br />
the power balance terms for each species. Detailed modeling of the ion <strong>and</strong><br />
electron power balance is not complete. However, single fluid modelling of the<br />
plasma indicates that thermal transport within the plasma core can be reduced by<br />
a factor of 2 to 3 during the enhanced period[22]. This can be seen directly from<br />
the terms shown in Table I, if comparable power deposition profiles are assumed.<br />
This improvement is only weakly reflected in the global energy confinement<br />
(+20%) when pellet <strong>and</strong> no-pellet discharges are compared, probably due to a<br />
larger fast ion population in the no pellet shot. However, global confinement is<br />
enhanced significantly with respect to L-mode[23]. At an input power of 8 to<br />
10MW, global energy confinement is approximately 450ms. This value is 1.6<br />
times the L-mode level. A further transient improvement is seen during the initial<br />
heating phase when the profile is most strongly peaked, but a dW/dt term<br />
comparable to more than half the input power is present.<br />
3.3 Particle Confinement<br />
In the absence of heating, the peaked electron density profile formed by pellet<br />
injection decays slowly retaining its peaked character for an extended period.<br />
Outside the plasma core a region of weak gradient is formed similar to no-pellet<br />
cases. This feature has been observed in past experiments [2]. In ohmic discharges,<br />
it has been modeled using a neoclassical pinch combined with a diffusion<br />
coefficient increasing with radius[2,24]. In modeling present experiments[25], a<br />
simple fixed form for that radial variation is assumed. As shown in Fig. 8, the<br />
diffusion coefficient incorporates a transition from a low central value to a higher<br />
edge value at r=0.45m. With the onset of heating, decay of the density profile
0.3<br />
f0.2<br />
1 5" 0.1<br />
<strong>IAEA</strong>-CN-50/A-IV-l 225<br />
RF Heating /<br />
#i62n k—s^r-<br />
#16227<br />
J<br />
0 0.2 0.4 Radius (m) 1.0<br />
10<br />
r=0<br />
_ 8<br />
r<br />
Ohmic<br />
. r/a-6.5<br />
JE 6<br />
1.4<br />
10<br />
s~* 8<br />
• r/a=0.75<br />
r/a=0.75<br />
0.2 0.4 0.6 0.8<br />
Time (s)<br />
RF Heating<br />
FIG. 8. Particle diffusion coefficient for Ohmic <strong>and</strong> RF heated cases. Evolution of density profile,<br />
measured (solid curves) <strong>and</strong> calculated (dashed curves), at four radii in Ohmic <strong>and</strong> RF heated cases.<br />
becomes more rapid. A similar radial variation in the diffusion coefficient is<br />
sufficient to model this change, when a 20% increase in the edge value is included.<br />
Again the neoclassical pinch is assumed. However, a wide variation in decay rates<br />
is observed when a range of heated pulses is modeled. In some cases this<br />
simplified model cannot reproduce the increased decay rate. A significant<br />
increase in core diffusion is required, suggesting that another mechanism may be<br />
triggered which can further accelerate the central electron density decay.<br />
During the ohmic phase, impurity transport both of nickel (high Z) <strong>and</strong> carbon<br />
(low Z) within this weakly anomolous central region is found to be consistent with<br />
neoclassical transport[17]. During the heating phase, impurity transport can<br />
remain consistent with neoclassical theory within the plasma core until the<br />
termination of the enhanced period. In this phase, impurity transport may reflect<br />
the appearance of an ion temperature driving term[17].<br />
4. Summary<br />
A transient enhanced performance mode has been obtained in JET limiter<br />
discharges using pellet injection fueling in combination with central RF heating.<br />
1.0
226 JET TEAM<br />
The occurence of the enhanced period follows strong perturbations in density <strong>and</strong><br />
temperature profiles which, in the plasma core, lead to a reduction in the T\<br />
parameter <strong>and</strong> a change in the q(r) profile. Thermal transport within the plasma<br />
core (r
<strong>IAEA</strong>-CN-50/A-IV-l 227<br />
APPENDIX I<br />
THE JET TEAM<br />
JET Joint Undertaking, Abingdon, Oxon, 0X14 3EA, UK<br />
J. M. Adams 1 , H. Altmann, G. Appruzzese, W. Bailey, P. Ballantyne, B. Balet, D. V. Bartlett, L. R. Baylor 23 ,<br />
K.Behringer 13 , A.C.Bell, P.Bertoldi, E.Bertolini, L.G.Betello, V.Bhatnagar, R.J.Bickerton,<br />
A. J. Bickley, J. Bizarro 21 , S. Bliman", T. Bonicelli, S. J. Booth, G. Bosia, M. Botman, D. Boyd 30 , H. Brelen,<br />
H.Brinkschulte, M.Brusati, T.Budd, M.Bures, T.Businaro 4 , P.Butcher. H.Buttgereit, C.Caldwell-<br />
Nichols, D. J.Campbell, P. Card, J.Carwardine.G.Celemano, P.Chabert", C. D.Challis, A.Cheetham,<br />
J.Christiansen, C.Christodoulopoulos, P.Chuilon, R.CIaesen, S.Clement 29 , J.P.Coad, P.Colestock 6 ,<br />
S.Conroy 12 , M.Cooke, S.Cooper, J.G.Cordey, W.Core, G.Corrigan, S.Corti-, A.E.Costley,<br />
G.Cottrell, M.Cox 7 , P.Cripwell 12 , D.Cross, H.deBIank 13 , H.deEsch. J.deHaas 13 , L.deKock,<br />
E. Deksnis, G.B.Denne, G. Deschamps, G.Devillers, K. J.Dietz, J.Dobbing, A. Dombra, N.Dolgetta,<br />
S.E.Dorling, P.G.Doyle, D.F.Duchs, H.Duquenoy, A.Edwards, J. Ehrenberg 1 *, T.Elevant",<br />
W.Engelhardt, S.K.Erents 7 , L.G.Eriksson 3 , M.Evrard 2 , H.Fajemirokun' 2 , H.Falter, J.Farthing,<br />
D. Fiory, M. Forrest 7 , C. Froger, K. Fullard, M. Gadeberg, A. Galetsas, M. Galley, R. Galvao", M. Garribba,<br />
R.Gianndla, A. Gibson, R. D.Gill, A. Gondhalekar, G.Gorini, C. Gormezano, N. A.Gottardi, C.Gowers,<br />
B.J.Green, F.S.Griph, W.K.Guo", R.Haange, G.Hammett 6 , W.Han', H.E.Han-Gonge",<br />
C.J.Hancock, P.J.Harbour, N.C.Hawkes\P.Haynes 7 , J.Heikkinen'.T.Hellsten, J.L.Hemmerich,<br />
R.Hemsworth, F.B.Herzog, R.F.Herzog, J.Hoekzema, R.Hope, W.A.Houlberg", J.How,<br />
M.Huart, T.P..Hughes 11 , M.Hugon, M.Huguet, M.Irving, J.Jacquinot, O.N.Jarvis, F.Jensen,<br />
T. C. Jernigan 21 ; E. Joffrin, E. M. Jones, L. P. D. F. Jones, T.T. C. Jones, J. Kallne, O. Kardaun 1 J . A. Kaye,<br />
B.E.Keen, M.Keilhacker, G.J.Kelly, A.Khare 14 , S.Knowlton, A.Konstantellos, M.Kovanen 10 ,<br />
P.Kupschus, P.Lallia, R.Lanza, R.Lasser, J.R.Lasl. L.Lauro-Taroni, K.Lawson 7 , E.Lazzaro,<br />
M.Lennholm, B.Liley 25 , X.LTtaudon, P.Lomas, M. Lorentz-Gottardi 2 , C.Lowry, G.Maddison 7 ,<br />
G. Magyar, M. Malacarnc, W. M<strong>and</strong>l 1 J , V. Marchese, J. Mart, P. Massmann, G. McCracken 7 , J. Mendonca,<br />
P.Meriguet, P.Micozzi 4 , S.F.Mills, P.Millward, S.L.Milora 23 , A.Moissonnier, F.Mompean,<br />
P.L.Mondino, P.Morgan, G.Murphy, G.Newbert, M.Newman, P.Nielsen, P.Noll, W.Obert,<br />
D.O'Brien, J.O'Rourke, M.G.Pacco-Duchs, M.Pain, S.Papastergiou, D.Pasini", A.Peacock,<br />
N. Peacock 7 , D. Pearson 11 , F. Pegoraro, F. Petree, M. Pick, S. Pitcher 7 , J. Plancoulaine, J-P. Poffe, F. Porcelli,<br />
R. Prentice, T. Raimondi, C. Raymond, P-H. Rebut.'J. Removille, F. Rimini, D. Robinson 7 . A. Rolfe,<br />
R.Romain, R.T.Ross, L. Rossi, R. Rushton, P.Rutter, H.C.Sack, G.Sadler, G.Saibene, N.Salmon 12 ,<br />
H.Salzmann 13 , A.Santagiustina, R.Sartori, D.Schissel 24 , P.H.Schild, M.Schmid, G.Schmidt',<br />
R.L.Shaw, K.Schimizu 17 , A.Sibley, R.Simonini, J.Sips 13 , P.Smeulders. J.Snipes, S.Sommers,<br />
L.Sonnerup, K.Sonnenberg, G.Sonnozaro, W.Stacey 2 ', M.Stamp, P.Stangeby", D.F.Start, C.A.Stecd,<br />
D.Stork. P. E.Stott.T.E. Stringer, D.Stubberfield, D. Summers, H. Summers", J.Tagle 2 *, H.Tamnen,<br />
A.Tanga, A.Taroni, C.Tebaldi 22 , A.Tesini, P.R.Thomas, E.Thompson, K.Thomsen, J.M.Todd,<br />
P. Trevalion, B. Tubbing, F.Tibone, E. Usselmann, A. Vannucci, H. van der Beken, M. von Hellermann,<br />
T.Wade, C.Walker, M.Walravens, K.Walter, Z.Wang".. D.Ward, M.L.Watkins, H.Weisen 10 ,<br />
J.Wesson, D.H.Wheeler, J.Wilks, U.Willen", D.Wilson,T.Winkel, S.Wolfe, D.Wong, C.Woodward,<br />
M.Wykes, I.D.Young, L.Zannelli, D.Zaschc"<br />
PERMANENT ADDRESS<br />
1. UKAEA, Harwell, Didcol. Oxon. UK. 16. Commissiariat a L'Energie Atomique, F-92260<br />
2. EUR-EB Association, LPP-ERM/KMS, B-1040 Brussels, Fontenay-aux-Roses. Trance.<br />
Belgium. 17. JAERI, Tokai Research Esiablishmem. Tokai-Mura,<br />
3. Technical Research Centre of Finl<strong>and</strong>, Helsinki, Finl<strong>and</strong>. Naka-Gun, Japan.<br />
4. ENEA-CENTRO Di Frascaii, 1-00044 Frascati, Roma, Italy. 18. Institute for Aerospace Studies, University of Toronto,<br />
5. Chalmers University of Technology, Goteborg. Sweden. Downsview, Ontario, Canada.<br />
6. Princeton Plasma Physics Laboratory, New Jersey, USA. 19. University of Strathclyde, 107 Rottenrow, Glasgow, G4 ONG,<br />
7. UKAEA Culham Laboratory, Abingdon. Oxfordshire, UK. UK.<br />
8. Plasma Physics Laboratory, Space Research Institute, Sao 20. <strong>Nuclear</strong> Engineering Laboratory, Lapecnranta University,<br />
Jose dos Campos,. Bra2il. Finl<strong>and</strong>.<br />
9. Jnstiluleof Mathematics, University of Oxford, UK. 21, JNICT, Lisboa, Portugal.<br />
10. CRPP/EPFL, 21 Avenue des Bains. CH-1007 Lausanne, 22. Department of Mathematics, Univeristy of Bologna, italy.<br />
Switzerl<strong>and</strong>. 23. Oak Ridge National Laboratory, Oak Ridge, Tenn., USA.<br />
11. Swedish Energy Research Commission, S-10072 Stockholm. 24. G.A. Technologies, San Diego, California, USA.<br />
Sweden. 25. University of Waikato, Hamilton. New Zeal<strong>and</strong>.<br />
12. Imperial College of Science <strong>and</strong> Technology, 26. IPP, Academia Sinica, P.R.China.<br />
University of London. UK. 27. Southwestern Institute of Physics, Lcshan, Sechuan,<br />
13. Max Planck Inslilul fur Plasmaphysik, D-8046 Garchin; bei P.R.China.<br />
Munchen, FRG. 28. University of Georgia, Atlanta, USA.<br />
14. Institute for Plasma Research, G<strong>and</strong>hinagar Bhat Gujrai, 29. Centra de Investigacionn Energeticas Medioambientales y<br />
India. Techalogicas, Spain.<br />
15. FOM Insliluut voor Plasmafysica, 3430 Be Nieuwegein, 30. University of Maryl<strong>and</strong>, College Park, Maryl<strong>and</strong>, USA.<br />
The Netherl<strong>and</strong>s. 31. University of Essex, Colchester, UK.<br />
J CRW 49.1 A(f«v. 30/11/86)
228 JET TEAM<br />
Acknowledgement<br />
The experimental programme <strong>and</strong> data evaluation are conducted under a collaboration<br />
agreement between the JET Joint Undertaking <strong>and</strong> the US Department of<br />
Energy (USDOE).<br />
REFERENCES<br />
[1] FURTH, H.P., Plasma Phys. Controll. Fusion 28 (1986) 1305.<br />
[2] SCHMIDT, G.L., et ah, in Plasma Physics <strong>and</strong> Controlled <strong>Nuclear</strong> Fusion Research 1986 (Proc.<br />
11th Int. Conf. Kyoto, 1986), Vol. 1, <strong>IAEA</strong>, Vienna (1987) 171.<br />
[3] JET TEAM, ibid., p. 31.<br />
[4] MILORA, S.L., et ah, in Controlled Fusion <strong>and</strong> Plasma Heating (Proc. 15th Eur. Conf. Dubrovnik,<br />
1988), Vol. 12B, Part I, European Physical Society (1988) 147.<br />
[5] KUPSCHUS, P., et ah, ibid., p. 143.<br />
[6] JACQUINOT, L, et ah, Plasma Phys. Controlh Fusion 30 (1988) 1467.<br />
[7] GIBSON, A., et ah, Plasma Phys. Controll. Fusion 30 (1988) 1375.<br />
[8] GREENWALD, M., et ah, Phys. Rev. Lett. 53 (1984) 352.<br />
[9] SENGOKU, S., et ah, Nucl. Fusion 25 (1985) 1475.<br />
[10] KAUFMANN, M., et ah, Nucl. Fusion 28 (1988) 827.<br />
[11] SOLDNER, F.-X., et ah, Phys. Rev. Lett. 61 (1988) 1105.<br />
[12] NOTERDAEME, J., et ah, Paper <strong>IAEA</strong>-CN-50/E-D-2, these Proceedings, Vol. 1.<br />
[13] STRACHAN, J.D., et ah, Phys. Rev. Lett. 58 (1987) 1004.<br />
[14] THOMAS, P.R., et ah, Paper <strong>IAEA</strong>-CN-50/A-IV-4, these Proceedings, Vol. 1.<br />
[15] TUBBING, B., et ah, APS Plasma Phys. Div. Mtg, Hollywood, FL (1988).<br />
[16] SNIPES, J.A., et ah, Nucl. Fusion 28 (1988) 1085.<br />
[17] BEHRINGER, K., et ah, <strong>IAEA</strong> Pellet Workshop, Gut Ising, FRG, 1988.<br />
[18] GREENWALD, M., et ah, in Plasma Physics <strong>and</strong> Controlled <strong>Nuclear</strong> Fusion Research 1986<br />
(Proc. 11th Int. Conf. Kyoto, 1986), Vol. 1, <strong>IAEA</strong>, Vienna (1987) 139.<br />
[19] GOEDBLOED, J.P., et ah, in Plasma Physics <strong>and</strong> Controlled <strong>Nuclear</strong> Fusion Research 1984<br />
(Proc. 10th Int. Conf. London, 1984), Vol. 2, <strong>IAEA</strong>, Vienna (1985) 165.<br />
[20] ROSENBLUTH, M.N., et ah, Phys. Rev. Lett. 51 (1983) 1967.<br />
[21] EDWARDS, A., Phys. Rev. Lett. 57 (1986) 210.<br />
[22] TARONI, A., et ah, Paper <strong>IAEA</strong>-CN-50/A-VII-l, these Proceedings, Vol. 1.<br />
[23] GOLDSTON, R.J., Plasma Phys. Controll. Fusion 26 (1984) 87.<br />
[24] HULSE, R.A., et ah, <strong>IAEA</strong> Pellet Workshop, Gut Ising, FRG, 1988.<br />
[25] BAYLOR, K., et ah, <strong>IAEA</strong> Pellet Workshop, Gut Ising, FRG, 1988.
<strong>IAEA</strong>-CN-50/A-IV-2<br />
PELLET INJECTION AND<br />
IMPROVED PLASMA PERFORMANCE IN ASDEX<br />
M. KAUFMANN, K. BEHRINGER, G. FUSSMANN, O. GRUBER,<br />
K. LACKNER, R.S. LANG, V. MERTENS, R. NOLTE, W. SANDMANN,<br />
K.-H. STEUER, G. BECKER, H. BESSENRODT-WEBERPALS,<br />
B. BOMBA, H.-S. BOSCH, K. BRAU 1 , H. BRUHNS, K. BUCHL,<br />
R. BUCHSE, A. CARLSON, G. DODEL 2 , A. EBERHAGEN,<br />
H.-U. FAHRBACH, O. GEHRE, K.W. GENTLE 3 , J. GERNHARDT,<br />
L. GIANNONE, G. VON GIERKE, E. GLOCK, S. VON GOELER 4 ,<br />
G. HAAS, W. HERRMANN, J. HOFMANN, E. HOLZHAUER 2 ,<br />
K. HUBNER 5 , G. JANESCHITZ, A. KALLENBACH, O. KARDAUN,<br />
F. KARGER, O. KLUBER, M. KORNHERR, K. KRIEGER, L. LENGYEL,<br />
G. LISITANO, M. LORCHER, H.M. MAYER, K. McCORMICK,<br />
D. MEISEL, E.R. MULLER, H.D. MURMANN, J. NEUHAUSER,<br />
H. NIEDERMEYER, J.-M. NOTERDAEME, W. POSCHENRIEDER,<br />
D.E. ROBERTS 6 , H. ROHR, A. RUDYJ, F. RYTER, F. SCHNEIDER,<br />
U. SCHNEIDER, E. SEVILLANO 7 , G. SILLER, E. SIMMET,<br />
F.X. SOLDNER, E. SPETH, A. STABLER, U. STROTH, N. TSOIS 8 ,<br />
O. VOLLMER, F. WAGNER, H. WURZ 9<br />
Max-Planck-Institut fur Plasmaphysik,<br />
Euratom-IPP Association,<br />
Garching, Federal Republic of Germany<br />
Abstract<br />
PELLET INJECTION AND IMPROVED PLASMA PERFORMANCE IN ASDEX.<br />
Repetitive pellet injection in ASDEX can result in a plasma regime with substantially improved<br />
plasma performance for H + as well as D + pellet fuelled discharges. This regime is characterized by<br />
strongly peaked electron density <strong>and</strong> impurity radiation profiles in which the peaking depends on the<br />
sawtooth activity. In parallel, the energy confinement is significantly enhanced, but with increasing<br />
additional heating power the peaking as well as the energy confinement degrade. Comparing st<strong>and</strong>ard<br />
gas fuelled <strong>and</strong> pellet fuelled discharges, the gain factor in energy confinement of about 2 at Ohmic<br />
power level ( = 0.5 MW) decreases to 1.3 at total heating power of 2.7 MW. — In addition, the line<br />
averaged density limit increases almost independently of the heating power by An^ = 5.5 X 10" m" 3<br />
Massachusetts Institute of Technology, Cambridge, MA, USA.<br />
2<br />
University of Stuttgart, Stuttgart, Federal Republic of Germany.<br />
3<br />
University of Texas at Austin, Austin, TX, USA.<br />
4<br />
Princeton University, Princeton, NJ, USA.<br />
5<br />
University of Heidelberg, Heidelberg, Federal Republic of Germany.<br />
5<br />
Atomic Energy Corporation of South Africa, Pretoria, South Africa.<br />
7<br />
General Atomics, San Diego, CA, USA.<br />
8<br />
<strong>Nuclear</strong> Research Centre Demokritos, Attiki, Greece.<br />
9<br />
Kemforschungszentrum Karlsruhe, Karlsruhe, Federal Republic of Germany.<br />
229
230 KAUFMANN et al.<br />
over the respective limits in gas puff discharges. This corresponds to a Murakami parameter of r^R/B,<br />
= 10.5 x 10" m~ 2 -T~' at 2.7 MW total heating power. — In connection with the increasing electron<br />
density peaking, the particle transport properties change <strong>and</strong>, in parallel, a reduction of the ion heat conductivities<br />
to neoclassical values is observed. This confirms the importance of the T;, parameter in<br />
determining ion heat conductivities. Nevertheless, the anomalous xe in the outer layers still dominates<br />
the global energy confinement, resulting in a better confinement of pellet fuelled D + than H + discharges.<br />
— Bolometric radiation measurements show central peaking which can be attributed to accumulation<br />
of copper.<br />
1. Introduction<br />
Experiments with pellet injection were performed in ASDEX (R = 1.65 m, a = 0.40 m<br />
partly carbonized walls) divertor discharges with purely Ohmic as well as with NBI<br />
<strong>and</strong> ICRH heating [lj. A centrifuge accelerated typically 5 to 30 deuterium or hydrogen<br />
pellets into a single discharge at time intervals between 30 to 100 ms. The<br />
pellets were of two different sizes each contributing 1 or 3 x 10 19 m~ 3 , respectively, to<br />
the volume averaged plasma density. Penetration depths of typically half the plasma<br />
radius, increasing with pellet size, were obtained with the injection velocity of » 600<br />
m/s. Injection of deuterium pellets into deuterium <strong>and</strong> hydrogen pellets into hydrogen<br />
discharges was studied. Extensive optimization studies <strong>and</strong> parameter scans concentrated<br />
on discharges with Bt = 2.2 T, Ip = 380 kA (go = 2.7) <strong>and</strong> covered a line averaged<br />
density range between Se = lx 10 19 <strong>and</strong> 1.2 X 10 20 (OH) <strong>and</strong> 1.4 X 10 20 m- 3 (2.6 MW<br />
NBI).<br />
Additional heating power applied so far to these discharges ranged up to 1.4 MW of<br />
ICRH [1] <strong>and</strong> 3 MW of NBI. The studies were carried out in the double-null configurations<br />
with the new divertor arrangement (DV-II [2]) having a smaller volume of the<br />
immediate divertor chamber, but larger by-passes to the main discharge chamber.<br />
2. Particle Transport <strong>and</strong> Density Limit<br />
Pellet injection is found to lead to strong peaking of the electron density profile also<br />
inside the deposition radius of the pellet particles. Figure 1 presents the peaking factor<br />
rc«(0)/(ne) (central electron density over the volume average) as function of the total<br />
heating power Ptot for Ohmic <strong>and</strong> neutral beam heated L mode deuterium discharges.<br />
With gas puffing only <strong>and</strong> with normal sawtooth activity (case l) the peaking factor<br />
is below 1.5 <strong>and</strong> depends little on the total heating power. When the sawteeth vanish<br />
in Ohmic discharges (case 2) the peaking factor rises up to 2 (only D + discharges tend<br />
to lose sawteeth). Pellet injection can suppress the sawtooth oscillations (case 3)<br />
<strong>and</strong> the highest peaking of about 2.6 was reached in sawtooth-free phases after pellet<br />
injection. While with additional heating the peaking parameter is gradually reduced,<br />
a steep density gradient can persist in the central part.<br />
If we describe the particle flux by the ansatz re = — D • Vnt + V,n • ne, we find<br />
consequently - during nearly stationary density phases - a change of the ratio of inward<br />
velocity to diffusion coefficient —Vin/D in the inner two-thirds of the plasma.<br />
This ratio is 5.4 • r/a 2 in pellet fuelled sawtooth-free OH discharges (case 3) compared<br />
with 3.5 • r/a 2 in sawtooth-free gas puff discharges (case 2). It is still an open<br />
question whether |Vin| increases <strong>and</strong>/or D decreases. [Vin/D cannot be determined in<br />
sawtoothing discharges (case 1) because during the sawtooth particles are transported<br />
discontinuously.)
3 -<br />
2 -<br />
1 -<br />
<strong>IAEA</strong>-CN-50/A-IV-2 231<br />
1 1 1<br />
o pellet<br />
GP without ^*"5" _ L-mode<br />
sawteeth<br />
8-<br />
gas puff<br />
• i i<br />
t i<br />
2 Ptot IMW l 3<br />
FIG. 1. Density profile peaking factor ne(0)/(ne) as a function of Plm of pellet gas puff fuelled D* discharges.<br />
The solid data point at P,ol = 0.45 MW corresponds to sawtooth-free st<strong>and</strong>ard gas puff OH<br />
discharges.<br />
Separate information on Vin <strong>and</strong> D can be gained from the analysis of dynamic phases.<br />
An analysis of two discharges (ohmic heating, respectively, 0.5 MW NI) with about<br />
120 ms periods after the injection of a few large pellets revealed the following results:<br />
(1.) The central density ne(0) rose after the last pellet (fig. 2a <strong>and</strong> fig. 3). (2.) Density<br />
peaking could be simulated for r < 0.3 m (fig. 2b) by D = D0[l+%) <strong>and</strong> V = Va-± with<br />
D° H = 0.05^i (D? r = 0.07^, respectively) <strong>and</strong> with V° H = -0.6 m/s {Va NI =<br />
—1.1 m/s, respectively). The calculation was corrected for the Nl-particle source <strong>and</strong><br />
yields inward drifts with small error bars (^ 25 %) because of the extended period of<br />
clearly rising density in the centre.<br />
Pellet injection into OH increases the density limit in OH- <strong>and</strong> NBI-heated deuterium<br />
discharges. The line averaged density limit increases almost independently of the heating<br />
power by Ane « 5.5 X 10 19 m~ 3 over the respective limits in gas puff discharges<br />
<strong>and</strong> corresponds to Murakami parameters of neR/Bt — 8 (OH) <strong>and</strong> 10.5 xlO 19 -?!""" 1<br />
(2.6 MW NBI). As shown earlier with the previous ASDEX divertor [3], pellet injection<br />
cannot substitute recycling at the plasma boundary. Therefore, sufficient gas puff<br />
has to be provided to reach stationarily high densities <strong>and</strong> improved confinement. In<br />
agreement with that the density limit even with pellet injection is usually coupled to<br />
high radiation at the plasma boundary.<br />
3. Impurity Transport<br />
In general, strongly increasing central radiation was observed in cases of successful density<br />
build-up <strong>and</strong> peaking of the density profile. A characteristic situation is discussed<br />
below on the basis of a 0.5 MW NBI-heated discharge. The time evolution of<br />
ne(0), ne, Te{a/2) <strong>and</strong> the central radiation Prad[0) of this discharge with five injected<br />
large pellets is shown in fig. 3. The beta poloidal fip reaches its maximum during the<br />
sawtooth-free phase after t=1.2 s. Almost simultaneously the central radiation is seen<br />
-
232 KAUFMANN et a\.<br />
16<br />
12<br />
o 8<br />
. At = 17 ms<br />
# 25 064<br />
(a)<br />
°0 0.1 0.2 0.3 r[ml O.t<br />
16<br />
12<br />
? 8<br />
At = 17 ms<br />
(b)<br />
0 0.1 0.2 0.3 r[m] 0A<br />
FIG. 2. ne versus r: (a) measured; (b) calculated.<br />
to rise drastically. During the fully developed accumulation period [t > 1.6 s) it is<br />
enhanced by a factor of ~ 20 compared to the initial phase. In figures 4a <strong>and</strong> 4b<br />
we show the radial profiles of Zc/f <strong>and</strong> the bolometrically determined radiation losses<br />
at two different times ta <strong>and</strong> tb (see fig. 3). The Ze/f profile is flat before (ta) <strong>and</strong><br />
slightly peaked during the accumulation phase after pellet injection (tb). For check<br />
of consistency, 2ff[i) derived from loop voltage, current <strong>and</strong> temperature profiles,<br />
<strong>and</strong> assuming neoclassical theory, was compared with a temperature weighted 2^j<br />
from bremsstrahlung profiles. The values agree by more than 20 %. The impurity<br />
accumulation is clearly demonstrated by the peakedness of the normalized bolometric<br />
radiation profile Prad/ne shown in fig. 4b.
0<br />
FIG. 4.<br />
ONI<br />
O<br />
£<br />
at<br />
o<br />
ID<br />
c<br />
IC<br />
15<br />
#25064 i<br />
10 -<br />
Te(a/2)<br />
—"*<br />
J<br />
xp<br />
\ /<br />
\ /I<br />
\ ^<br />
<strong>IAEA</strong>-CN-50/A-IV-2 233<br />
/<br />
/<br />
r<br />
i<br />
/<br />
n /<br />
e—^—-~- j<br />
t i<br />
. 1I / - —. 1<br />
/<br />
P<br />
NI<br />
tb<br />
\<br />
= 0.51 MW<br />
i<br />
i<br />
- 1<br />
0.8 1.0 1.2 1.4 1.6 t[s] 18<br />
I<br />
'' 1<br />
/<br />
\<br />
\<br />
f<br />
"''<br />
1 ..—<br />
— •<br />
/**<br />
F?ad(r = 0 )<br />
FIG. 3. ne, ne(0), Te(a/2) <strong>and</strong> PrJf» as junctions of time.<br />
- 2 -<br />
• ^A X<br />
- I -<br />
:- \<br />
\ \<br />
z<br />
\<br />
V<br />
br<br />
•if<br />
s<br />
1.47 s<br />
/<br />
/<br />
/<br />
/<br />
-<br />
/<br />
in<br />
3 o<br />
i<br />
r<br />
/ rc<br />
/<br />
/<br />
t<br />
1<br />
1 1<br />
0.1 0.2 0.3 rlml O.t "0 0.1 0.2 0.3 rtm] 0.4<br />
Measured Zfe, P^ <strong>and</strong> PnJne versus minor radius before (a) <strong>and</strong> after (b) pellet injection.<br />
For the interpretation of the measurements the light impurities C <strong>and</strong> O are to be<br />
distinguished from copper which - according to spectroscopic measurements - is the<br />
dominating heavy impurity. To explain the central radiation of 300 kW /m 3 at t=1.5 s<br />
we need a Cu concentration of 0.08 % which contributes to Zeff only by about 0.3.<br />
The remaining contribution to {Zeff — 1) can be attributed to 0.7 % oxygen <strong>and</strong> 2 %<br />
carbon if we assume a ratio of these elements as measured at the boundary. The<br />
peaking factor for these light elements is two between the centre <strong>and</strong> half the radius,<br />
while theory predicts a ratio of nearly 5.<br />
i<br />
/<br />
j<br />
(b)<br />
/ \<br />
\-<br />
•
234 KAUFMANN et al.<br />
E<br />
1.2<br />
Z 0.8-<br />
? 0.4-<br />
•l\<br />
• \<br />
V<br />
Y \V\<br />
\<br />
VCQIC. Dnn=.8O m 2 /s<br />
\<br />
\<br />
»=0.05\<br />
\<br />
i<br />
—o——"*—"—- *• ' 0 "tt—Vi<br />
0 0.1 0.2 0.3" " "r[m) 0.4<br />
FIG. 5. Soft-X-ray intensity versus radius for t = 1.4 s.<br />
In addition to the bolometer profiles the accumulation of Cu is also obvious from the<br />
pronounced peaking of soft-X-ray profiles. These emission profiles are particularly suited<br />
for a comparison with neoclassical transport simulations because of the suppressed<br />
boundary radiation. In fig. 5 we show such a comparison for t=1.4 s when the shape of<br />
ncu-profile has become stationary. The calculations are performed by adding neoclassical<br />
fluxes [4]<strong>and</strong> anomalous diffusive fluxes Yan = —D<strong>and</strong>nz/dr. Accumulation is<br />
initiated by reducing Dan from typical values of 0.8 m 2 fs (t < 1.2 s at all radii) in the<br />
inital phase to values of 0.05 m 2 /s in the inner region r/a < 0.75 for t > 1.2 s during<br />
accumulation. This way the good agreement with the measured SX-profiles as plotted<br />
in fig. 5 is obtained. The sensivity of this comparison with respect to the reduction of<br />
Dan is indicated in fig. 5 by the curves for unchanged transport [Dan = 0.8m 2 fs =<br />
const) <strong>and</strong> fully neoclassical transport Dan —* 0.<br />
4. Global Energy Confinement<br />
For st<strong>and</strong>ard values of Ip <strong>and</strong> Bt, the global energy confinement time TE was investigated<br />
as a function of nc, heating power Ptot <strong>and</strong> isotope type [see fig. 6]. An additional<br />
variation of confinement time with fuelling method can be well described as a further<br />
dependence of TE on the density peaking parameter. Whereas, under purely Ohmic<br />
heating, density scans for the usual gas puff-fuelled discharges with flat density profiles<br />
(ne(0)/{ne) < 1.5) show a saturation of TE at 60 <strong>and</strong> 85 ms for H + <strong>and</strong> D + ,<br />
respectively, <strong>and</strong> a subsequent decline with ne, pellet fuelling allows access to a regime<br />
with peaked nt{j) <strong>and</strong> monotonically increasing r£;(ne) reaching values of 110 ms for<br />
H + <strong>and</strong> 160 ma for JD + . However, also in this case, confinement deteriorates with<br />
heating power, <strong>and</strong> the gain in TE of these peaked density profile discharges compared<br />
to conventional, gas fuelled L regime cases decreases from a factor of nearly 2 at Ohmic<br />
power levels (« 0.5 MW) to 1.3 at Ptot = 2;7 MW for H° =• D+ injection (fig. 6). At<br />
the same time the maximum peaking factor of density achieved with pellet injection<br />
diminishes from 2.6 to 1.6.<br />
-<br />
-
<strong>IAEA</strong>-CN-50/A-IV-2<br />
0.35 MW<br />
2.6 MW<br />
Gas Puff<br />
2.6 MW<br />
0 4 8 12 0 4 8<br />
Line Averaged Density (10 13 cnv 3 )<br />
FIG. 6. Global energy confinement time re versus ne of (a) pellet refuelled <strong>and</strong> (b) gas puff fuelled D +<br />
discharges at different NBI heating powers. re <strong>and</strong> nt of pellet discharges reach values which are considerably<br />
higher than those of the st<strong>and</strong>ard gas puff case.<br />
E<br />
0.1<br />
FIG. 7. Radial dependence ofxe <strong>and</strong> x,- during post-pellet phase of an Ohmic H + <strong>and</strong> D* discharge.<br />
The abbreviation CH refers to the Xi calculation as given by Chang <strong>and</strong> Hinton.<br />
5. Local Temperature <strong>and</strong> Energy Transport Analysis<br />
Comprehensive local transport analyses covering the whole plasma cross-section <strong>and</strong><br />
including a comparison with first principle theoretical transport models have been<br />
carried out using the TRANSP code. We found that the temperature profiles of ions<br />
<strong>and</strong> the dependence of their contribution to global confinement on the density profiles<br />
can be well explained by superposing the neoclassical <strong>and</strong> »j,-mode-driven ion heat<br />
conductivities. All cases investigated showing improved confinement through density<br />
peaking correspond to rj, = ^ j" ^ (<strong>and</strong> r/e) < 1 over a large part of the plasma crosssection.<br />
For Ohmically heated pellet injection discharges, the energy confinement<br />
in the central regions is totally determined by radiation <strong>and</strong> neoclassical ion heat<br />
conduction [5]. The experimental finding—rg is larger for D + compared with H +<br />
plasmas despite the fact that Xi.neocl is increasing with ion mass-is explained by the<br />
following result: The global confinement is still dominated by the anomalous Xe in the<br />
outer zones, whose opposite isotope dependence causes a reduction in TB when going<br />
from D + to H+ (fig. 7). The TRANSP analysis of the beam heated, pellet fuelled<br />
discharges shows [5]that the confinement degradation is due to an increasing Xc <strong>and</strong><br />
an enhancement of Xi due to a shrinking of the >/,- < 1 zone with the observed flatter<br />
density profiles compared with the OH pellet discharges.<br />
235
236 KAUFMANN et al.<br />
-1<br />
-2--<br />
-3-<br />
+ with Pellets<br />
o without Pellets<br />
1<br />
1<br />
-1 -2 -1<br />
FIG. 8. Comparison of measured <strong>and</strong> estimated TE.<br />
As the above analyses revealed electron transport to be dominating the global energy<br />
confinement a statistical investigation of the dependences of the electron temperature<br />
profile was started. Gas puff as well as pellet fuelled discharges, Ohmically heated as<br />
well as neutral beam heated discharges can be described unformly (2.5 • 10 19 m~ 3 ^<br />
nc 1.2 • 10 20 m- 3 ,0.3 MW
<strong>IAEA</strong>-CN-50/A-IV-2 237<br />
finement. The improvement lessens with rising heating power. The ion confinement<br />
becomes neoclassical in agreement with r7i-mode theory. Tlie global energy confinement,<br />
however, remains controlledby electron transport <strong>and</strong> is characterized by a nearly<br />
self-similar electron temperature profile. This leads to a picture where the energy confinement<br />
is nearly determined by the boundary temperature <strong>and</strong> the density profile.<br />
High-Z impurities accumulate in the centre according to neoclassical theory.<br />
REFERENCES<br />
[1] NOTERDAEME, J.-M., et al., Paper <strong>IAEA</strong>-CN-50/E-H-2, these Proceedings, Vol. 1.<br />
[2] NIEDERMEYER, H., Plasma Phys. Controll. Fusion, to be published.<br />
[3] KAUFMANN, M., et al., Nucl. Fusion 28 (1988) 827.<br />
[4] FUSSMANN, G., et al., in Plasma-Surface Interactions in Controlled Fusion Devices (Proc. 8th<br />
Int. Conf. Jiilich, 1988), <strong>and</strong> references therein.<br />
[5] GRUBER, O., et al., in Controlled Fusion <strong>and</strong> Plasma Heating (Proc. 15th Eur. Conf. Dubrovnik,<br />
1988), Vol. 12B, Part I, European Physical Society (1988) 23.
TOKAMAK WITH STRONG MAGNETIC FIELD<br />
AND ADIABATIC PLASMA COMPRESSION<br />
E.A. AZIZOV, V.A. CHUYANOV, G.G. GLADUSH,<br />
V.D. PISMENNYJ, A.A. VEDENOV, E.P. VELIKHOV<br />
I.V. Kurchatov Institute of Atomic Energy,<br />
Moscow<br />
V.A. GLUKHIKH, B.G. KARASEV, V.A. KRYLOV,<br />
N.A. MONOSZON, I.V. MOZIN<br />
D.V. Efremov Research Institute<br />
of Electrophysical Apparatus,<br />
Leningrad<br />
Union of Soviet Socialist Republics<br />
Abstract<br />
<strong>IAEA</strong>-CN-50/A-IV-3<br />
TOKAMAK WITH STRONG MAGNETIC FIELD AND ADIABATIC PLASMA COMPRESSION.<br />
The main technical features of <strong>and</strong> the state of work on the TSP tokamak with strong magnetic<br />
field <strong>and</strong> adiabatic plasma compression, constructed at the Troitsk branch of the I.V. Kurchatov Institute<br />
of Atomic Energy, are considered.<br />
In December 1987, at the Troitsk branch of the I.V. Kurchatov Institute of<br />
Atomic Energy, TSP, a tokamak with strong field <strong>and</strong> adiabatic plasma compression,<br />
was started up physically.<br />
As is well known [1], the use of a strong magnetic field in a tokamak makes<br />
it possible, at least in the Ohmic heating regimes, to produce a high density plasma<br />
with record parameters in a tokamak of relatively small physical size. On the other<br />
h<strong>and</strong>, additional heating of a dense plasma in a tokamak with strong magnetic field<br />
has failed to become effective, so far. In 1980, we suggested [2] the use of adiabatic<br />
compression by a rising magnetic field to heat up a dense plasma to thermonuclear<br />
parameters. This suggestion was based on the reduction of the requirements to dimensions<br />
<strong>and</strong> energetics of a device with a preset value of the nrT parameter for increasing<br />
magnetic field <strong>and</strong> technical potentialities of the magnetic energy storage systems.<br />
On the basis of existing ideas on transport processes, the optimum heating<br />
scheme was chosen: two-stage compression along the major <strong>and</strong> minor plasma<br />
torus radii with preliminary heating of a low density plasma in a weak magnetic field<br />
by fast atom injection <strong>and</strong> ion cyclotron heating [3]. The minor radius compression<br />
is performed by increasing the toroidal field from Bo = 2 T to B, = 5 T on the<br />
radius Ro = 106 cm for 10 ms. The major radius compression is accomplished by<br />
the growing vertical field shifting the column from RQ = 106 cm to a radius of<br />
239
240 AZIZOV et al.<br />
TABLE I. TSP PARAMETERS AND EXPECTED PLASMA PARAMETERS<br />
Parameters<br />
Plasma volume (m 3 )<br />
Major radius of column (m)<br />
Minor radius of column (m)<br />
Toroidal field on column axis (T)<br />
Current in plasma at Ip = 2 (MA)<br />
Duration of toroidal field area (s)<br />
Compression time (s)<br />
Additional heating power<br />
(injection + HF) (MW)<br />
Mean plasma density (m~ 3 )<br />
Mean ion temperature (keV)<br />
Mean electron temperature (keV)<br />
Energy confinement time (ms)<br />
Thermonuclear power (MW)<br />
Before<br />
compression<br />
2.14<br />
1.06<br />
0.32<br />
2.0<br />
0.48<br />
0.2<br />
-<br />
1 + 1<br />
5 x 10"<br />
0.5/1.2"<br />
0.6/1.1*<br />
0.175/0.6<br />
30-50<br />
First figure "before heating", second figure "after heating".<br />
—<br />
After<br />
compression<br />
of type "a"<br />
0.856<br />
1.06<br />
0.2<br />
5.0<br />
0.48<br />
0.2<br />
0.01<br />
1.3 x 10 20<br />
2.0<br />
1.9<br />
1.0<br />
125<br />
—<br />
After<br />
compression<br />
of type "b"<br />
0.13<br />
0.415<br />
0.128<br />
12.8<br />
1.23<br />
—<br />
0.01<br />
8 x 10 20<br />
Ri = 41.5 cm for 10 ms. In this case, the toroidal field at radius R, after compression<br />
attains 12.8 T. The tokamak parameters <strong>and</strong> expected plasma parameters are<br />
given in Table I, <strong>and</strong> the cross-section of the toroidal field winding is shown in<br />
Fig. 1. They were chosen on the basis of the possibilities of pulsed energetics <strong>and</strong><br />
in order to obtain a plasma with thermonuclear parameters, in which the released<br />
thermonuclear power would be comparable to the energy loss power (Q ~ 1).<br />
In developing this design, the main emphasis was placed on the creation of a<br />
powerful infrastructure — power supply system, shielded experimental hall, control<br />
system, tritium system — of relative simplicity <strong>and</strong> cheapness of the tokamak device<br />
itself, permitting fast replacement by a new system according to the progress of<br />
physical ideas <strong>and</strong> the growth of the technical possibilities.<br />
Along the path chosen the whole complex of difficult technical problems resulting<br />
from the necessity to generate a strong fast varying field in a great volume should<br />
be solved. In doing so, a number of new, non-st<strong>and</strong>ard technical solutions have been<br />
adopted [4].<br />
7.0<br />
6.0<br />
1.3<br />
10<br />
3.5
60 H<br />
£ 40 -<br />
<strong>IAEA</strong>-CN-50/A-IV-3<br />
180 200 (cm) P<br />
FIG. 1. Cross-section of toroidal field winding <strong>and</strong> variation of compression geometry during a pulse.<br />
To ensure the required strength <strong>and</strong> to adapt the toroidal field winding to the<br />
high current power source, the winding was made of 32 one-turn coils. Massive turns<br />
(in the welded construction, the central part consists of zirconium bronze <strong>and</strong> the<br />
external part of copper) are contained, without insulation, in casings of a nonmagnetic<br />
high-manganese steel with an ultimate strength of 1.3 x 10 9 H-m" 2 . The<br />
casings are equipped with tilted teeth which are in engagement with each other<br />
through figured insulating gaskets forming a vault which takes up the centripetal load<br />
<strong>and</strong> the tilting moments. The vault is arranged at the central portion of the coils. The<br />
inner parts of the turns are free <strong>and</strong>, as it were, suspended in the vault zone.<br />
The power supply for the toroidal winding is accomplished as a transformer<br />
inductive storage. In its primary winding, up to 960 MJ is stored as magnetic energy.<br />
At fast disconnection of the primary winding, this energy is, with the aid of<br />
corresponding switchgears, transferred to the secondary winding that consists of<br />
32 turns; the current there amounts to up to 0.83 MA. The secondary winding turns<br />
are connected alternately in series with the toroidal winding turns, which allows a<br />
reduction of the voltage on the toroidal winding down to 300 V for a switch braking<br />
capacity of more than 10 10 W.<br />
Four electric machine converter units with flywheels are used as the primary<br />
energy source of the device. The total energy content in rotating masses is 4 GJ, the<br />
peak power is up to 1 GW, The energy consumption per pulse is 2 GJ.<br />
The fast growing magnetic field generates inductive currents in the conducting<br />
chamber <strong>and</strong> a corresponding pressure on its surface. A technical assessment has<br />
shown that it is practically impossible to use insulation or resistive insertions in the<br />
chamber under the conditions considered. Since at times longer than the skin time<br />
the magnetic pressure is proportional to the conductor thickness <strong>and</strong> in the parts of<br />
the TSP chamber with a maximum stress reaches 100 atm/mm of the stainless steel<br />
thickness, a thin walled chamber construction was adopted, with a wall thickness of<br />
0.8 mm, welded at sections with negative curvature surface <strong>and</strong> suspended through<br />
insulating suspensions to the magnetic system. Each section is entirely made by<br />
explosive punching. The chamber <strong>and</strong> the toroidal winding sections were assembled<br />
241
242 AZIZOV et al.<br />
65 75 85 95 105 115 125 135 145<br />
FIG. 2. Structure of poloidal field, showing hexapole magnetic diaphragm.<br />
at the plant in Leningrad, in semi-toruses with a weight of about 70 t each, <strong>and</strong> then<br />
were transported to the assembly place at Troitsk, where the semi-toruses were<br />
welded together.<br />
The poloidal field system of the TSP device should not only ensure breakdown,<br />
current rise <strong>and</strong> sustaining of the equilibrium but also adiabatic plasma compression.<br />
To reach the maximum strength of the toroidal winding, the whole central part of the<br />
device is occupied. The inductor winding is divided into two parts, split <strong>and</strong> placed<br />
above <strong>and</strong> below the toroidal winding. During the discharge process, the inductor<br />
current changes its sign; the inductor field is used as a vertical field assisting in the<br />
major radius plasma compression. A fast rise of the current in the inductor is accomplished<br />
by additional inductive storage. After compression the current in the plasma<br />
is only sustained by its self-inductance. The tune through which the current is sustained<br />
considerably exceeds the time expected for plasma cooling.<br />
To compensate the inductor stray field <strong>and</strong> to facilitate the breakdown, a<br />
number of additional poloidal windings were introduced, thus creating a hexapole<br />
magnetic diaphragm with a zero in the region of R = 106 cm (Fig. 2).<br />
The complicated structure of the poloidal field imposes stringent requirements<br />
on the control equilibrium system since for R < 106 cm the plasma column is verti-
,oV<br />
10<br />
10'<br />
10<br />
<strong>IAEA</strong>-CN-50/A-IV-3 243<br />
II11111 11 11 11 1111111 I I 11 11 1111 I 1111 11 I 1111 11 1111 11<br />
4 6<br />
10<br />
dBr<br />
6z<br />
(G-cm ')<br />
FIG. 3. Dependence of increase in vertical instability on — dBJdz: 1: without passive stabilization;<br />
2: with stabilizing coil only; 3: with chamber only; 4: with chamber <strong>and</strong> coil (Ip = 100 kA).<br />
cally unstable at the start <strong>and</strong> for R > 106 cm it is horizontally unstable. Stable<br />
equilibrium is only possible within a narrow zone near R « 106 cm. The short time<br />
constant of the chamber requires a fast <strong>and</strong> powerful control system for the major<br />
radius equilibrium. At the end of December 1987, the TSP device was mounted <strong>and</strong><br />
pumped out down to 10" 4 Pa. By that time, only one flywheel generator had been<br />
mounted <strong>and</strong> started up so that the device could only operate in rather poor<br />
conditions. Therefore, to increase the discharge frequency, we used condenser<br />
batteries as a power supply rather than the flywheel generator. For rather low toroidal<br />
fields (about 0.2 T on the radius of 106 cm, 0.8 T on the winding) a breakdown <strong>and</strong><br />
a current of up to 10 kA for one-turn voltages of less than 30 V <strong>and</strong> an initial<br />
deuterium pressure of 10~ 2 Pa were obtained. Measurements of the vertical<br />
magnetic field distributions <strong>and</strong> current distributions in the chamber were conducted;<br />
they showed good agreement with the calculations. Besides, an appreciable radial<br />
component of the magnetic field of several gauss, subject to compensation, was<br />
found. Equilibrium control system tests have shown that the required fast action is<br />
not ensured <strong>and</strong> the column cannot be maintained in equilibrium in the chamber,<br />
which has, according to the measurements, a time constant of about 100 s. If this<br />
system is to be upgraded to design parameters, it has to be modified significantly,
244 AZIZOV et al.<br />
30 40 50 60<br />
Ip = 245 kA<br />
R (cm)<br />
FIG. 4. Shape of TSP plasma compression cross-section for Ip = 245 kA, as the result of a combined<br />
energy balance <strong>and</strong> equilibrium calculation.<br />
which would be a time consuming procedure. Therefore, for the present, we have<br />
chosen another method of solving this problem:<br />
To ensure stable major radius equilibrium, one can increase the chamber time<br />
constant. This is, however, not a promising approach since a high time constant prevents<br />
major radius adiabatic compression. Therefore, we have decided to change the<br />
accepted scenario of discharge <strong>and</strong>, immediately after breakdown, to shift the column<br />
by radii that are somewhat less than 106 cm, where the column is rigidly stable<br />
horizontally <strong>and</strong> unstable vertically. Movement in the vertical direction can be stabilized<br />
by a relatively slow feedback system if short circuited turns 'freezing' the magnetic<br />
field's horizontal component <strong>and</strong> not connected inductively to its vertical<br />
component are introduced into the chamber. Turns that are formed as four quarters<br />
with a copper bus of 150 X 5 mm 2 dimensions are available at present <strong>and</strong> are<br />
installed in the TSP chamber. They allow an increase in the chamber time constant,<br />
with respect to vertical motions of up to 10 ms, by no means acting on adiabatic compression<br />
over the major or the minor radius (Fig. 3). In the scenario under consideration,<br />
the plasma in the TSP will have the noticeably elongated configuration (up to<br />
two over the separatrix) during the initial phase of the discharge as well as additional<br />
heating preceding the compression (Fig. 4).<br />
One more flywheel generator has been mounted <strong>and</strong> started up so far, which<br />
permits us to proceed to experiments with toroidal fields of about 1 T <strong>and</strong> to currents<br />
of the order of 100 kA.
<strong>IAEA</strong>-CN-50/A-IV-3 245<br />
REFERENCES<br />
[1] FAIRFAX, S., et al., in Plasma Physics <strong>and</strong> Controlled <strong>Nuclear</strong> Fusion Research 1980 (Proc.<br />
8th Int. Conf. Brussels, 1980), Vol. I, <strong>IAEA</strong>, Vienna (1981) 439.<br />
[2] AZIZOV, E.A., et al., ibid., Vol. 2, p. 599.<br />
[3] CHUYANOV, V.A., DEMICHEV, V.F., On the Adiabatic Compression of Plasma with Thermonuclear<br />
Parameters in Tokamaks, Rep. IAE-3222, Institute of Atomic Energy, Moscow<br />
(1979).<br />
[4] AZIZOV, E.A., ALEKSEEV, Yu.L, BREVNOV, N.N., Main Physical <strong>and</strong> Engineering<br />
Problems for the Creation of a Tokamak with a Strong Magnetic Field <strong>and</strong> Adiabatic Compression<br />
of Plasma (in preparation).
HIGH TEMPERATURE EXPERIMENTS AND<br />
FUSION PRODUCT MEASUREMENTS IN JET<br />
JET TEAM<br />
(Presented by P.R. Thomas)<br />
JET Joint Undertaking,<br />
Abingdon, Oxfordshire,<br />
United Kingdom<br />
Abstract<br />
<strong>IAEA</strong>-CN-50/A-IV-4<br />
HIGH TEMPERATURE EXPERIMENTS AND FUSION PRODUCT MEASUREMENTS IN JET.<br />
High temperature plasmas (T; s 23 keV <strong>and</strong> Te < 12 keV) have been obtained in JET using<br />
NBI <strong>and</strong> ICRH. The low target densities required for these experiments were produced by using graphite<br />
surfaces to pump the plasma. Low density helium pulses were employed to deplete the graphite of<br />
deuterium, thereby enhancing the pumping effect. The trapping <strong>and</strong> slowing-down rates for the ICRH<br />
minority ions <strong>and</strong> d-d tritons were close to the classical values. Although the ICRH minority ions carried<br />
as much as one third of the total energy content, the thermal plasma energy confinement was unaffected<br />
by their presence. The high temperature plasmas had the same plasma energy confinement as high<br />
density, low temperature plasmas, <strong>and</strong> the heating rates of hot electron <strong>and</strong> hot ion discharges were<br />
similar. These results show that the prospects are good for a-particle heating <strong>and</strong> high temperature<br />
operation in thermonuclear plasmas.<br />
1. INTRODUCTION<br />
This paper reports some results obtained with low<br />
collisionality, high temperature JET plasmas <strong>and</strong> the associated<br />
fusion product diagnostic measurements. Non-thermal ions arising<br />
from neutral beam injection (NBI) or ion cyclotron resonance<br />
heating (ICRHj have long slowing-down times <strong>and</strong> so contribute<br />
significantly to the fusion yield <strong>and</strong> the total energy content.<br />
At high RF power densities ICRH minority ions provide a good<br />
simulation of a-particles in a thermonuclear plasma.<br />
The NBI system has been used to inject 80keV deuterons at<br />
powers of up to 21MW. With the central electron temperature,<br />
To(0), in the range 5-12keV, the NBI power is transferred to the<br />
thermal ions. Up to 18MW of ICRH have been launched in the<br />
plasma. When tuned to a minority fundamental resonance, ICRH<br />
couples mainly to high energy ion tails (mean energy«O.1-lMeV),<br />
which slow down on the electrons. A small proportion of the RF<br />
power is transferred directly to the electrons [1] by L<strong>and</strong>au<br />
damping, mode conversion or TTMP. Bulk ion heating <strong>and</strong> tail<br />
formation have been observed with second harmonic ICRH.<br />
247
248 JET TEAM<br />
NBI has been used to obtain hot ion plasmas with a central<br />
ion temperature , Tj(O), up to 23keV <strong>and</strong> Te(0) « 8keV at a<br />
central electron density, ^(0), « 2xl0 19 rrf 3 . Hot electron<br />
plasmas with Te(0) up to 12keV <strong>and</strong> T.(0) « 7keV have been<br />
obtained with ICRH at njO) « 3.5xl0 18 m . Similarly, high Te <strong>and</strong><br />
Tt have been obtained simultaneously by using ICRH <strong>and</strong> NBI<br />
together.<br />
2. FUSION PRODUCT MEASUREMENTS<br />
Comprehensive measurements have been made of neutron rates<br />
<strong>and</strong> spectra. The neutron yield has been absolutely calibrated in<br />
situ using radio-isotope sources <strong>and</strong> a pulsed neutron tube to an<br />
estimated accuracy of 10%.The neutron energy spectra have been<br />
used to separate the sources of neutron emission so that the<br />
central deuteron density could be determined.<br />
14MeV neutron emission has been measured by foil activation<br />
<strong>and</strong> silicon diode counters. This latter technique utilises 28 Si<br />
(n,a) <strong>and</strong> (n,p) reactions whose cross-sections have effective<br />
thresholds at around 6MeV. Good discrimination against y's <strong>and</strong><br />
2.5MeV neutrons is obtained by only accepting large amplitude<br />
pulses.<br />
Plasma y-ray spectrum measurements have provided valuable<br />
information about the fast ion distribution in ICRH plasmas. The<br />
r-ray spectra indicate the presence in ICRH plasmas of fast ions<br />
with energies higher than 7.5MeV. The details of these<br />
measurements <strong>and</strong> their interpretation are presented elsewhere<br />
[2].<br />
3. HIGH TEMPERATURE OPERATION<br />
The low densities required for high temperature operation<br />
require that the plasma be pumped both before <strong>and</strong> during<br />
additional heating. Two methods have been used to accomplish<br />
this: either the plasma is started on the main limiters <strong>and</strong> then<br />
moved onto the graphite protection tiles on the small major<br />
radius side of the vacuum vessel or an X-point configuration [3]<br />
is formed. In both cases the graphite surfaces act as a particle<br />
sink <strong>and</strong> the plasma is pumped. Low density helium conditioning<br />
plasmas [4] are used to deplete the graphite of deuterium <strong>and</strong> so<br />
increase the pumping action.<br />
Figure 1 illustrates the main features of a typical high<br />
temperature plasma (JET pulse 16066) between 10 <strong>and</strong> 16 seconds<br />
after breakdown. The X-point was formed at 8 seconds <strong>and</strong> n^CO)<br />
fell to a very low level (0.8x10* m~ 3 ) before the heating was<br />
applied.
<strong>IAEA</strong>-CN-50/A-IV-4 249<br />
FIG. 1. Data for JET pulse 16066: (a) central temperatures <strong>and</strong> additional heating powers against<br />
time; (b) central electron density <strong>and</strong> neutron emission rate against time; (c) electron <strong>and</strong> ion temperature<br />
profiles. CXRS denotes charge exchange recombination spectroscopy, ECE electron cyclotron emission<br />
<strong>and</strong> LIDAR the time resolved Thomson scattering.<br />
The ICRH heats the electrons, so reducing the electron/ion<br />
coupling, <strong>and</strong> provokes a "monster" sawtooth [5]. Both these<br />
effects promote ion heating by the NBI. Following the last<br />
sawtooth crash before the monster, Ti(O) rises rapidly to 14keV<br />
<strong>and</strong> the neutron emission peaks. The electron <strong>and</strong> ion temperature<br />
profiles, at the time of the maximum Ti(O), are shown in<br />
Fig.l(c) <strong>and</strong> are seen to be highly peaked.<br />
Shortly after the maximum TjCO) the density begins to rise<br />
more rapidly, whereupon both the ion temperature <strong>and</strong> the neutron<br />
emission fall. The electron density profile changes from being<br />
peaked to being hollow at this time <strong>and</strong> carbon line radiation<br />
increases. At the monster sawtooth crash the plasma temperatures<br />
collapse <strong>and</strong> show no signs of recovery in spite of an associated<br />
fall in density.<br />
4. NEUTRON EMISSION<br />
Similar plasma conditions to those of Fig. 1 had been<br />
obtained at the same power level with He minority ICRH a few
250 JET TEAM<br />
pulses previously. Tuning to hydrogen minority doubled the<br />
neutron rate. Whilst the increased neutron emission could be due<br />
to the formation of a high energy deuteron tail by 2wcd ICRH,<br />
only 12% of the neutrons can be identified beyond 2.8MeV (which<br />
corresponds to the NBI energy) in the liquid scintillator<br />
spectrum.<br />
During the first ^second of ICRH the y-spectrum was<br />
dominated by 12 C(p,p') 12 C (threshold 4.8MeV). Only Ln the las£<br />
second, when the neutron rate had fallen, did C(d,p) C<br />
(threshold 0.36MeV) take over. Thus the increased emission<br />
cannot be due to high energy deuterons. A possible explanation<br />
for the extra neutrons is the effective reduction of the NBI<br />
slowing down rate by the RF fields.<br />
The neutron emission of other high temperature pulses can<br />
be accounted for by the beam-beam, beam-thermal <strong>and</strong><br />
thermal-thermal deuteron reactions. Of these, the beam-thermal<br />
interactions are the most important <strong>and</strong> account, typically, for<br />
60% of the neutrons. The beam-beam neutrons are only significant<br />
during the low density period of the heating pulse <strong>and</strong> provide<br />
«10-50% of the maximum emission.<br />
The interpretation of the neutron yield measurements<br />
requires that the deuteron concentration in the high temperature<br />
plasmas is rather low, with na/ivsO.25-0.45 being typical.<br />
Analyses of other diagnostics such as visible Bremsstrahlung,<br />
neutron spectra, triton burn-up <strong>and</strong> charge exchange<br />
recombination radiation give similar values.<br />
5. FAST PARTICLES IN PLASMAS<br />
The energy confinement of ICRH minority ions <strong>and</strong> the<br />
burn-up of tritons produced by d-d fusion reactions test much of<br />
the important physics of a-particle heating in thermonuclear<br />
plasmas. Not only are the Larmor radii of these ions similar to<br />
those of d-t oc's but also, in the case of the ICRH fast ions,<br />
nfast/ne (*10~ 2 ) , pfast (»i%) <strong>and</strong> vfaBt/vAlfv4n (>1) are in<br />
the appropriate range. However, d-t a's have an isotropic 1/v<br />
distribution whereas the ICRH minority ions have a<br />
quasi-Maxwellian anisotropic (vji_/V||«30) distribution. The<br />
anisotropy of the ICRH distribution might be expected to provide<br />
rigorous tests for the appearance of loss-cone instabilities,<br />
fishbones <strong>and</strong> stochastic diffusion.<br />
The energy density contained in fast minority particles<br />
should be TsPrf/2, where Prf is the absorbed power density <strong>and</strong><br />
TS the minority slowing-down time on the electrons. The<br />
perpendicular energy contained in the minority particles can be
P ICRHV 2<br />
<strong>IAEA</strong>-CN-50/A-IV-4 251<br />
FIG. 2. (a) Measured perpendicular component offast ion energy against TS(0)PICRH/2 for (A) hydrogen<br />
minority <strong>and</strong> (O) helium minority plasmas; (b)fast ion energy calculated with a Fokker-Planck code<br />
against the experimental values for (A)(h) 3 He, (D)(h) 4 He <strong>and</strong> (O)( 3 He)d plasmas.<br />
obtained from the dlamagnetlc loop <strong>and</strong> equilibrium magnetic<br />
fields. The correlation with Ts(0)PrcRH/2 is satisfactory, as<br />
shown in Fig. 2(a). The factor 3-5 between the axes can be<br />
accounted for by profile effects, the RF coupling efficiency,<br />
finite minority poloidal Larmor radii <strong>and</strong>, possibly, anomalous<br />
losses.<br />
If the ICRH deposition profile calculated with a ray<br />
tracing code [6] is combined with profiles of temperature <strong>and</strong><br />
density, then it is found that RF coupling efficiencies of 0.5<br />
for hydrogen <strong>and</strong> 0.65 for helium minority are required for the<br />
Stix distribution function [1] to match the experimental data on<br />
minority energy <strong>and</strong> fusion yield [2]. The results of a<br />
self-consistent wave propogation <strong>and</strong> Fokker-Planck code are<br />
compared with data in Fig. 2(b). To improve the match with some<br />
data points,where TS can be as much as 1 second, an additional<br />
ad-hoc energy loss with a characteristic time of 0.5 seconds has<br />
been added. The absorption is calculated to occur mainly on the<br />
minority in these plasmas. The extra loss term can be associated<br />
with the rather low coupling efficiencies required in the Stix<br />
calculation. Neoclassical effects have been neglected in<br />
calculation of the minority distribution functions. So these<br />
should be assessed before it is assumed that the extra losses<br />
are anomalous.<br />
The 14MeV neutron emission from a deuterium plasma provides<br />
direct measurements of the slowing-down <strong>and</strong> trapping of d-d<br />
tritons (lMeV). Figure 3 shows the temporal evolution of the<br />
2.5MeV <strong>and</strong> 14MeV neutron emission from a plasma with 2.5MW of
252 JET TEAM<br />
1<br />
5-<br />
0-<br />
•<br />
2.5 MeV neutroa rate<br />
(divided by 100) \A<br />
I<br />
/<br />
/ i<br />
/ f<br />
N \<br />
Mi 1/<br />
h<br />
i ! L<br />
i<br />
i<br />
\<br />
V Calcul4tedl4MeVrate<br />
1<br />
Time (a)<br />
(^reduced by 15K)<br />
\iqjeriment»l 14 MeV r»t«<br />
14 16<br />
F/G. 3. 2.5 MeV neutron emission rate (. ), experimental 14 MeV neutron emission ( ) <strong>and</strong><br />
calculated 14 MeV emission ( ; against time for a 3 MA/2.9 Tplasma with 12.5 MW ICRH <strong>and</strong><br />
2.5 MWNB1.<br />
NBI <strong>and</strong> 12.5MW of ICRH. The minority ion energy content was<br />
approximately 1MJ compared with 4MJ in the thermal plasma. The<br />
delay due to the slowing-down of the tritons on the plasma<br />
electrons from lMeV to the peak of the d-t cross-section at<br />
240keV can be seen clearly.<br />
The results of a calculation of the 14MeV emission based on<br />
the measurements of plasma temperature <strong>and</strong> density are also<br />
shown in Fig. 3. The slowing-down time must be systematically<br />
reduced by 15% in order to obtain agreement with the 14MeV<br />
measurements from most plasmas. This systematic rescaling of TS<br />
is within the experimental error, which is typically 20%. The<br />
rate of triton burn-up is generally in good agreement with the<br />
classical calculation which implies that the trapping is close<br />
to 100% in JET plasmas with currents of 3MA or more.<br />
6. ENERGY CONFINEMENT AT HIGH TEMPERATURES<br />
The data from a set of 3MA.2.8-3.4T discharges have been<br />
sorted into AA high Te (9
<strong>IAEA</strong>-CN-SO/AIV-4 253<br />
FIG. 4. (a) Diamagnetic energy content against heating power <strong>and</strong> (b) plasma energy content against<br />
heating power for a set of 3 MA/2.8-3.4 T discharges. A: Te > 9 keV, D: 7] > 9 keV, o : Te <strong>and</strong><br />
T, > 9keV, Q>:ne > 3.5 x 10 19 m' 3 <strong>and</strong> Te < 6 keV, it: pulse 16066 (Fig. I) <strong>and</strong> S: pulse 16981<br />
(Fig. 5).<br />
considerable spread, with the high density plasmas having the<br />
lowest energy contents.<br />
The plasma energy content, determined from magnetic<br />
measurements assuming that all fast ions are perpendicular, is<br />
plotted against heating power in Fig. 4(b). The spread is now<br />
rather small <strong>and</strong> the different groups are interspersed with no<br />
apparent trend in either temperatures or density. The spread in<br />
the diamagnetic energy must be predominantly due to fast ions.<br />
The plasma energy confinement is apparently insensitive to<br />
overall temperature (or density) variations of a factor of two.<br />
The heating rates for the electrons <strong>and</strong> ions are very similar<br />
(Te/i(O) * 2-3xl0 18 Po/1(MW)/ne(0) keV). 1-D transport<br />
simulations [7] of these plasmas require that the ion <strong>and</strong><br />
electron thermal conductivities be approximately equal in order<br />
to satisfactorily reproduce the data. However, at the time of<br />
writing, the local transport analysis of the hot electron <strong>and</strong><br />
hot ion plasmas has not been completed.<br />
By pushing the plasma to a smaller minor radius on the<br />
inside wall, plasmas which are similar to the TFTR "supershots"<br />
[4] have been produced. Figure 5 shows the temperature <strong>and</strong><br />
density profiles in one of these pulses (JET pulse 16981). The<br />
characteristic narrow electron density <strong>and</strong> broad temperature<br />
profiles can be seen. This pulse has been identified in Fig. 4.
254 JET TEAM<br />
Major Radius (m) Major Radius (m)<br />
FIG. 5. (a) Electron <strong>and</strong> ion temperature profiles; (b) electron density profile for the 'supershot' (JET<br />
pulse 16981).<br />
The global energy confinement is very similar to other high<br />
temperature<br />
dimensions.<br />
JET pulses in spite of the different ~i plasma ««*•»=<br />
7. CONCLUSIONS<br />
High temperature, low collisionality plasmas have been<br />
produced in JET by high power NBI <strong>and</strong> ICRH. The low plasma<br />
densities required for operation in this regime are achieved by<br />
using the graphite wall tiles as a plasma pump.<br />
The trapping <strong>and</strong> slowing-down of fast ICRH minority ions<br />
<strong>and</strong> d-d tritons are close to classical expectations. There are<br />
some signs of additional losses when the slowing-down time is of<br />
order one second but this has yet to be fully investigated.<br />
Neoclassical losses, in particular, should be assessed. MHD<br />
instabilities have been observed to eject fast particles from<br />
the plasma core in JET [8]. However, the prospects for usable<br />
a-particle heating in future tokamak experiments are good.<br />
The plasma energy content is insensitive to the temperature<br />
of either the electrons or the ions. The presence of fast ion<br />
populations with up to 50% of the plasma energy does not affect<br />
the plasma energy confinement. Thus the high temperatures <strong>and</strong><br />
fast ion heating required in a thermonuclear plasma do not cause<br />
any deleterious effects beyond the usual confinement degradation<br />
with additional heating.
<strong>IAEA</strong>-CN-50/A-IV-4 255<br />
The fusion performance of the JET high temperature plasmas<br />
would be greatly enhanced if the plasma deuteron content were to<br />
be increased <strong>and</strong> the next stage of the experimental development<br />
of these discharges will be dedicated to this end.<br />
REFERENCES<br />
[1] STIX, T.H., Nucl. Fusion 15 (1975) 737.<br />
[2] START, D.F.H., et al., Paper <strong>IAEA</strong>-CN-50/E-II-3, these Proceedings, Vol. 1.<br />
[3] TANGA, A., et al., in Plasma Physics <strong>and</strong> Controlled <strong>Nuclear</strong> Fusion Research 1986 (Proc.<br />
11th Int. Conf. Kyoto, 1986), Vol. 1, <strong>IAEA</strong>, Vienna (1987) 65.<br />
[4] STRACHAN, J.D., et al., Phys. Rev. Lett. 58 (1987) 1004.<br />
[5] CAMPBELL, D.J., et al., Phys. Rev. Lett. 60 (1988) 2148.<br />
[6] BHATNAGAR, V.P., et al., Nucl. Fusion 24 (1984) 955.<br />
[7] TARONI, A., et al., Paper <strong>IAEA</strong>-CN-50/A-VTM, these Proceedings, Vol. 1.<br />
[8] CAMPBELL, D.J., et al., Paper <strong>IAEA</strong>-CN-50/A-VII-2, ibid.
FUSION PRODUCT MEASUREMENTS ON TFTR<br />
<strong>IAEA</strong>-CN-50/A-IV-S<br />
J.D. STRACHAN, S.J. ZWEBEN, C.W. BARNES 1 , H.-S. BOSCH 2 ,<br />
H.P. FURTH, H.W. HENDEL, D.L. JASSBY, L.C. JOHNSON,<br />
R.W. MOTLEY, T. MURPHY 3 , E.B. NIESCHMIDT 4 , T. SAITO 5 ,<br />
K.M. YOUNG, M.G. BELL, M. BITTER, A. CAVALLO,<br />
E.D. FREDRICKSON, K.W. HILL, H. HSUAN, D.K. MANSFIELD,<br />
D.R. MIKKELSEN, H.K. PARK, A.T. RAMSEY, M.H. REDI,<br />
G. TAYLOR, <strong>and</strong> the TFTR GROUP<br />
Plasma Physics Laboratory,<br />
Princeton University,<br />
Princeton, New Jersey,<br />
United States of America<br />
Abstract<br />
FUSION PRODUCT MEASUREMENTS ON TFTR.<br />
The DD charged fusion products in TFTR plasmas have been studied through the burnup of<br />
0.8 MeV 3 He <strong>and</strong> 1 MeV tritons inside the plasma <strong>and</strong> through the loss of 1 MeV tritons to the wall.<br />
The measured triton burnup fraction of -0.5 —1% (with about 35% uncertainty) appears to be about<br />
two times below classical expectations, even allowing for a factor-of-two due to the uncertain deuterium<br />
depletion. The energetic triton loss rates are generally proportional to the triton source rate, as expected<br />
for prompt losses, but can be enhanced by the presence of MHD activity. Projected alpha particle<br />
parameters for TFTR DT discharges are described.<br />
A. BURNUP MEASUREMENTS<br />
Burnup studies of the charged DD fusion products (the 1 MeV<br />
d(d,p)t triton [1] <strong>and</strong> the 0.8 MeV d(d,n) 3 He helium ion [2])<br />
measure the characteristics of particles having orbits, electron<br />
drag'forces, spatial profiles, <strong>and</strong> velocity space distributions<br />
similar to those expected for the DT-produced 3.5 MeV alphas.<br />
However, since the DD-produced triton density inside the plasma is<br />
only about 1% of that expected for DT alphas, these DD charged<br />
fusion products are expected to have little influence on the plasma<br />
or on each other. Therefore, we can explore the potential<br />
influence of the bulk plasma on alpha particle confinement.<br />
The confinement of the charged fusion products in DD plasmas<br />
is deduced from the magnitude of their subsequent burnup in the<br />
1 Los Alamos National Laboratory, Los Alamos, NM, USA.<br />
2 Max-Planck-Institut fur Plasmaphysik, Garching, Federal Republic of Germany.<br />
3 University of California, San Diego, CA, USA.<br />
4 Idaho National Engineering Laboratory, Idaho Falls, ID, USA.<br />
5 Japan Atomic Energy Research Institute, Naka-machi, Japan.<br />
257
258 STRACHAN et al.<br />
- Z - 1, Steady-Slate<br />
Triton Burnup<br />
PEAK ELECTRON TEMPERATURE (keV)<br />
FIG. 1. Magnitude of the burnup for the 0.8 MeV 3 He ions (steady-state value) (solid points), <strong>and</strong> for<br />
the 1 MeV triton burnup (integrated over the plasma duration) with small observed triton losses (open<br />
circles), <strong>and</strong> with two times larger observed triton losses (open squares). The triton data are limited<br />
to 1.4 MA plasmas. The lines are the calculated steady-state Z = 1 values. The shaded region indicates<br />
the magnitude of the bumup expected when transient effects <strong>and</strong> realistic deuterium depletion are<br />
included in the calculations.<br />
d(t,n)a <strong>and</strong> d( He,p)a fusion reactions. The principal<br />
uncertainties relate to the absolute calibrations of the relevant<br />
nuclear detectors <strong>and</strong> the density of deuterium In the background<br />
plasma. The 14.7 MeV protons from the burnup of the 0.8 MeV He in<br />
the d( He,p)a fusion reaction were detected with x3 calibration<br />
uncertainties by surface barrier detectors at the edge of the<br />
plasma. The 14.1 MeV neutrons from the burnup of the 1 MeV tritons<br />
in the d(t,n)a fusion reaction were detected with 35% uncertainty<br />
by Cu(n,2n) activation [3], which was cross-calibrated to a<br />
collimated neutron spectrometer [4].<br />
For steady-state Z - 1 plasmas with no orbit losses, the<br />
burnup fraction, defined as the ratio of 14.7 MeV p or 14.1 MeV n<br />
yield to the measured 2.5 MeV n source, is expected to depend only<br />
upon central electron temperature [5] . In Fig. 1 is plotted the<br />
burnup fraction for the 0.8 MeV He, which slightly exceeds the<br />
values expected for Z - 1 <strong>and</strong>, therefore, significantly exceeds (by<br />
2x) calculated values with realistic Ze££. This apparent excess of<br />
0.8 MeV He ions is most likely due to the uncertainty In the<br />
absolute calibration of the 15 MeV proton detector [6,7]. An<br />
alternate explanation could invoke enhanced reactivity due to D He<br />
reactions between the 0.8 MeV He ions <strong>and</strong> the energetic beam ions.<br />
For TFTR supershots, the burnup fractions for 1 MeV tritons<br />
are five to ten times below the Z - 1 steady-state value. These<br />
burnup fractions are thought to be below ideal levels primarily due
<strong>IAEA</strong>-CN-50/A-IV-5 259<br />
to deuterium depletion by impurities in the plasma (a x2-3 effect,<br />
especially important after NBI) <strong>and</strong> the lack of sufficient time to<br />
achieve equilibrium (a xl.5-2.5 effect). In both the He <strong>and</strong><br />
triton cases [1,2,8,9], the burnup time evolution during beam turn<br />
on <strong>and</strong> turn off is delayed with respect to the source signal by<br />
time durations that agree with electron drag times. This indicates<br />
that the slowing down processes are not anomalous. The triton<br />
burnup efficiency is relatively lower than the He burnup, probably<br />
because the He ions tend to reach steady-state during the neutral<br />
beam heating (a time of high Te <strong>and</strong> low Ze£f), while the tritons do<br />
not slow to the peak of the DT cross section until well after the<br />
beam heating ends. Consequently, the tritons experience much of<br />
their burnup at times of smaller electron temperature <strong>and</strong> higher<br />
Zeff. thus reducing the observed, burnup fraction.<br />
The net result, however, Is that the triton burnup is, on<br />
average, x2 less than expected. This difference is larger than the<br />
30% measurement uncertainty <strong>and</strong> could be caused either by enhanced<br />
prompt losses (which at 1.4 MA are only about 10% classically) or<br />
by anomalous triton diffusion corresponding to a triton particle<br />
confinement time of about 0.5 sec. Both of these possibilities<br />
seem to be ruled out by the escaping triton measurements.<br />
B. ESCAPING TRITON MEASUREMENTS<br />
The escaping energetic (> 0.3 MeV) triton flux has been<br />
measured with time resolution (< 0.1 msec) <strong>and</strong> pitch angle<br />
resolution (of 5° in the range 40°-90° relative to toroidal<br />
magnetic field) with an array of collimated ZnS scintillators<br />
located below the plasma [10]. The flux magnitude has not yet been<br />
absolutely calibrated, <strong>and</strong> the signals shown have a ~ 30% component<br />
due to 3 MeV protons (which have the same orbits as the 1 MeV<br />
tritons). The fraction of tritons escaping to the detector (Fig.<br />
2) was observed to decrease about a factor-of-twenty when the<br />
current was increased from 0.8 MA to 2.0 MA, in agreement with the<br />
classically expected relative decrease in prompt losses to this<br />
detector. Over this current range, the triton burnup increased<br />
about x2 while the calculated confined fraction increased from 70%<br />
to 97% (Fig. 2). Therefore, if the observed triton losses<br />
accounted for the reduced triton burnup at 0.8 MA, then this loss<br />
could only account for less than 10% of the burnup reduction at 1.6<br />
MA. The implication is that enhanced prompt loss (at the measured<br />
energy, pitch angle <strong>and</strong> poloidal locations) is most likely not<br />
responsible for the x2 reduced burnup.<br />
An enhanced triton loss correlates with the appearance of MHD<br />
activity In the plasma, as shown for cases of a sawtooth crash <strong>and</strong><br />
m/n - 2/1 MHD activity in Fig. 3. These observed losses of up to<br />
x2 above the non-MHD level (averaged over a shot) may be an<br />
indication of either a prompt or diffusive loss correlated with the<br />
MHD activity (Fig. 3). The plasmas with up to two times larger<br />
integrated MHD-correlated triton losses (square points In Fig. 1)
260 STRACHAN et al.<br />
10'<br />
10'<br />
Classical Fraction<br />
Of Confined Tritons<br />
Lost Triton<br />
Signal Norm<br />
At 0.8 MA<br />
1.0 1.5 2.0<br />
PLASMA CURRENT (MA)<br />
FIG. 2. Observed energetic triton loss signal at the pitch angle of maximum flux (normalized to the<br />
neutron source rate) (solid points) <strong>and</strong> triton burnup magnitude (open squares) as a function of plasma<br />
current. The dashed lines indicate the range in the calculated classical prompt loss to the detector<br />
normalized to the expected =25% global classical loss at 0.8 MA. The solid line indicates the expected<br />
fraction of confined tritons.<br />
have similar triton burnup, again indicating that the observed lost<br />
tritons, even with MHD activity, are a small component of the total<br />
triton population.<br />
After NBI ends, the escaping energetic triton flux evolves in<br />
time .proportionally to the triton source signal (the 2.5 MeV<br />
neutrons), strongly suggesting that those few tritons which leave<br />
the plasma have a prompt loss process rather than a slow diffusive<br />
loss. This is particularly true of the time interval up to 0.3 sec<br />
after NBI when the energetic triton density is expected to be about<br />
constant <strong>and</strong> the triton source <strong>and</strong> lost triton signal (Fig. 4d)<br />
fall by 10 2 . After 0.6 from the end of the NBI, the observed<br />
neutron production is dominated by confined tritons [11] .<br />
Essentially, this observation suggests the possibility of waiting<br />
for the beam heating effects on the plasma to decay away in order<br />
to enhance the observable effects caused by the confined charged<br />
fusion products. This "alpha storage" regime [12] is described in<br />
the next section.<br />
C. DT ALPHA PARTICLE PROJECTIONS<br />
We have calculated the expected alpha parameters for DT<br />
supershots on TFTR from measurements of an actual 1.4 MA, 24 MW<br />
beam-heated TFTR DD plasma in Fig. 4. We take the alpha density to<br />
be the number of alphas with energy greater than the alpha critical<br />
energy (Fig. 4f) <strong>and</strong> assume that all the alphas exist inside r/a —<br />
0.3/0.82. The total alpha creation rate was simply taken as 80x<br />
the measured DD neutron production rate that occurred in the TFTR<br />
deuterium plasmas. The conversion factor of 80 would apply if<br />
deuterons <strong>and</strong> tritons replaced the deuterium plasma <strong>and</strong> beam ions
4.5<br />
-.4..<br />
?3.<br />
POLOIDAL PLANE<br />
<strong>IAEA</strong>-CN-S0/A-IV-5 261<br />
T<br />
2.6 3.6<br />
RADIUS <br />
Sawtooth Craah<br />
1.4 MA. 12 MW NBI ' b '<br />
/ft<br />
Detected Triton Orbits<br />
q-l Surface (1.4 MA)<br />
Triton Detector<br />
I msec 10 niaac<br />
m/n = 2/1 Mode<br />
FIG. 3. (a) Poloidal cross section of TFTR with an escaping 1 MeV triton orbit that reaches one of<br />
the lost alpha detectors. The bottom two traces indicate some of the 1 MeV triton losses correlated with<br />
MHD activity, including (b) a sawtooth crash <strong>and</strong> (c) an m/n = 2/1 oscillation. The neutron flux signal<br />
indicates a reduction of the 2.45 MeV neutron emission with sawtooth <strong>and</strong> m = 2/1 MHD.<br />
<strong>and</strong>, if all the measured DD neutrons were created by beam-target<br />
reactions [13]. The projected alpha heating is only 2.5% of the<br />
total at the end of the neutral beam injection (3.95 sec in Fig.<br />
4a) but is about 25% of the total at 4.4 sec (or 0.4 sec after the<br />
beams). The energy content in the alphas would have risen from 7%<br />
of the total at 3.95 sec to 35% of the total at 4.4 -• 4.6 sec.<br />
This energy content <strong>and</strong> its anisotropy (if any) should be<br />
detectable with the magnetic diagnostics. The alpha density (Fig.<br />
4e) would have risen from 0.25% at 4.4 sec to 1.1% at 4.6 sec,<br />
primarily due to the decay of the central electron density. The<br />
average alpha energy would fall from 2.2 MeV at 4.0 sec to 0.8 MeV<br />
at 4.4 sec, which emphasizes the transient nature of the alpha<br />
population. For all TFTR supershot plasmas, the calculated alpha<br />
slowing down duration is 2 to 5 times the bulk plasma energy<br />
confinement time (Fig. 4c).
262 STRACHAN et al.<br />
_ 1<br />
s 10*<br />
I<br />
:<br />
10p<br />
10"<br />
1 1II III) 1<br />
• "tb<br />
i 1 y<br />
mummmmim<br />
•<br />
I<br />
r~- -^<br />
3.5 4.0 4.5<br />
TIME (sec)<br />
(b) :<br />
tLPIasmaEnergy :<br />
AlphaN,. :<br />
Energy N^ ,<br />
i t<br />
(C) ;<br />
5.0<br />
-: 10'<br />
10<br />
-<br />
-<br />
AilS z<br />
- ul o<br />
-<br />
_ C<br />
Storing Decay Storage Mode<br />
n<br />
a<br />
a<br />
a<br />
a<br />
a<br />
a ^<br />
/<br />
,ne(°)<br />
D<br />
D<br />
TCU<br />
\ 1 ^^&D<br />
no(0)(10"cnT 3 ) ^><br />
4.0 4.5<br />
TIME (sec)<br />
FIG. 4. Time evolution of plasma parameters for one TFTR supershot. (a) Neutral beam power (PNB),<br />
ohmic power (P0H), projected alpha power (PJ assuming no energetic alpha losses, <strong>and</strong> the rate of<br />
change of plasma energy (|£|J; (b) plasma energy content <strong>and</strong> projected alpha energy content assuming<br />
zero energetic alpha losses; (c) alpha slowing down duration (T°) <strong>and</strong> gross energy confinement<br />
time (TE); (d) total neutron emission (x), the lost energetic triton signal (open squares) normalized to<br />
the neutron emission at 3.55 sec, the DT14 MeVneutron signal (+),<strong>and</strong>the range in calculated classical<br />
DTburnup signal (solid lines), with the range being caused by variation ofZefffrom 3 to 5 in carbon;<br />
(e) central electron density (open squares) <strong>and</strong> projected central alpha density assuming zero alpha<br />
transport; (f) average alpha energy «.Eay), critical energy (Ecn-,) for the alphas, central ion temperature<br />
(Ti(0)), <strong>and</strong> central electron temperature (Tt(0)). Calculated quantities are indicated as lines while<br />
experimental data are indicated as points.<br />
The Implication of Fig. 4 <strong>and</strong> other similar projections Is<br />
that DT operation of TFTR will allow study of alpha particle<br />
physics issues [12,14]. Energetic alpha densities na •»<br />
3.5 x 10 cm" , alpha pressure of /?a(o) » 0.5%, <strong>and</strong> alpha slowing<br />
down durations r° = 0.7 sec are projected on the basis of the best<br />
-<br />
-<br />
_
<strong>IAEA</strong>-CN-50/A-IV-5 263<br />
achieved DD TFTR plasmas. These alpha parameters will allow<br />
experimental investigations of energetic alpha loss rates, alpha<br />
thermalization rates, the influence of alpha pressure on fishbone<br />
instabilities, <strong>and</strong> potentially the influence of alpha heating on<br />
the post-beam ohmic plasma. Improvements to this alpha storage<br />
mode are desirable to further enhance the influence of the alphas<br />
on - the post-beam plasma. For example, increasing the plasma<br />
density would increase the relative importance of the alpha heating<br />
(by increased electron drag) <strong>and</strong> may cause the plasma to reach<br />
equilibrium sooner (reducing ft). If the alpha source rates were to<br />
reach the Q » 1 level then Pa(.o) « na(o)/ne(o) = 1% would be<br />
obtained, which are levels comparable to those in ignited plasmas<br />
[15].<br />
ACKNOWLEDGMENT<br />
This program was supported by the U.S. Department of Energy<br />
Contract No. DE-AC02-76-CHO-3073.<br />
REFERENCES<br />
[1] BARNES, C.W., et al., "Triton burnup studies on TFTR", Controlled Fusion <strong>and</strong> Plasma Heating<br />
(Proc. 15th Eur. Conf. Dubrovnik, 1988), Vol. 12B, Part I, European Physical Society<br />
(1988) 87-90.<br />
[2] STRACHAN, J.D., Rep. 2544, Plasma Physics Lab., Princeton Univ., NJ (1988).<br />
[3] NIESCHMIDT, E., et al., Rev. Sci. Instrum. 59 (1988).<br />
[4] BARNES, C.W., STRACHAN, J.D., Plasma Physics Lab., Princeton Univ., NJ, Report (to be<br />
published).<br />
[5] STRACHAN, J.D., et al., in Basic Physical Processes of Toroidal Fusion Plasmas (Proc. Course<br />
<strong>and</strong> Workshop Varenna, 1985), Vol. 2, Rep. EUR-10418-EN, p. 699.<br />
[6] STRACHAN, J.D., Rev. Sci. Instrum. 57 (1986) 1771.<br />
[7] STRACHAN, J.D., CHAN, A., Nucl. Fusion 27 (1987) 1025-1029.<br />
[8] MURPHY, T.J., et al., "Injection of deuterium pellets into post-neutral-beam TFTR plasmas",<br />
Controlled Fusion <strong>and</strong> Plasma Heating (Proc. 15th Eur. Conf. Dubrovnik, 1988), Vol. 12B, Part<br />
I, European Physical Society (1988) 91-94.<br />
[9] MURPHY, T., PhD Thesis, Princeton Univ., NJ (1988).<br />
[10] ZWEBEN, S., Rev. Sci. Instrum. 57 (1986) 1774.<br />
[11] JASSBY, D.L., et al., "Fission detector determination of D-D triton burnup fraction in beamheated<br />
TFTR plasmas", Controlled Fusion <strong>and</strong> Plasma Physics (Proc. 14th Eur. Conf. Madrid,<br />
1987), Vol. 11D, Part HJ, European Physical Society (1987) 1264-1267.<br />
[12] ZWEBEN, S., et al., Rep. PPPL-2535, Plasma Physics Lab., Princeton Univ., NJ (1988).<br />
[13] JASSBY, D.L., Nucl. Fusion 17 (1977) 309-365.<br />
[14] ZWEBEN, S., Phys. Scr. 16 (1987) 119.<br />
[15] PARKER, R.R., et al., Paper <strong>IAEA</strong>-CN-50/G-II-l, these Proceedings, Vol. 3.
ENERGY CONFINEMENT WITH AUXILIARY<br />
HEATING IN JT-60<br />
<strong>IAEA</strong>-CN-50/A-V-1<br />
S. TSUJI, M. AKIBA, T. ANDO, K. ANNOH, T. AOYAGI,<br />
K. ARAKAWA, M. AZUMI, T. FUJH, T. FUKUDA, A. FUNAHASHI,<br />
K. HAMAMATSU, T. HIRAYAMA, M. HONDA, H. HORIIKE,<br />
N. HOSOGANE, T. IIJIMA, Y. IKEDA, T. IMAI, S. ISHIDA, K. ITAMI,<br />
T. ITO, Y. KAMADA, Y. KAWANO, M. KIKUCHI, H. KIMURA,<br />
T. KIMURA, H. KISfflMOTO, Y. KOIDE, T. KOIKE, I. KONDO,<br />
S. KONOSfflMA, H. KUBO, S. KUNIEDA, K. KURIHARA,<br />
M. KURIYAMA, Y. KUSAMA, S. MAEHARA, K. MAENO,<br />
T. MATOBA, S. MATSUDA, M. MATSUKAWA, T. MATSUKAWA,<br />
M. MATSUOKA, Y. MATSUZAKI, N. MIYA, K. MIYACHI,<br />
M. MIZUNO, M. NAGAMI, A. NAGASHIMA, K. NAGASHIMA,<br />
T. NAGASfflMA, O. NAITO, H. NAKAMURA, M. NEMOTO,<br />
Y. NEYATANI, H. NINOMIYA, N. NISHINO, T. NISHITANI,<br />
K. ODAJIMA, N. OGIWARA, T. OHGA, M. OHTA, K. OMORI,<br />
S. OMORI, T. OZEKI, M. SAIGUSA, K. SAKAMOTO, A. SAKASAI,<br />
M. SATO, M. SEIMIYA, M. SEKI, S. SEKI, K. SHIMIZU,<br />
M. SHIMIZU, Y. SHIMOMURA, H. SHIRAI, H. SHIRAKATA,<br />
T. SUGIE, M. TAKAHASHI, S. TAKAHASHI, H. TAKATSU,<br />
H. TAKEUCHI, S. TAMURA, Y. TANAKA, K. TANI, K. TOBITA,<br />
N. TOYOSHIMA, M. TSUNEOKA, K. UEHARA, K. USHIGUSA,<br />
I. YONEKAWA, H. YOSHIDA, R. YOSHINO<br />
Naka Fusion Research Establishment,<br />
Japan Atomic Energy Research Institute,<br />
Naka-machi, Naka-gun, Ibaraki-ken,<br />
Japan<br />
Abstract<br />
ENERGY CONFINEMENT WITH AUXILIARY HEATING IN JT-60.<br />
An improved divertor confinement regime has been found in beam heated lower X-point discharges<br />
in JT-60. The improvement is associated with an increase in electron density <strong>and</strong> high particle<br />
recycling in the divertor region, the latter of which is in contrast to the H-mode. The energy confinement<br />
time becomes longer than that of limiter discharges with the same plasma volume by up to 50%. The<br />
radiation power in the divertor region is increased up to half of the input power. Frequent edge localized<br />
modes observed in low-q discharges degrade the improved energy confinement.<br />
265
266 TSUJ1 et a).<br />
1. INTRODUCTION<br />
JT-6O is a large tokamak with powerful auxiliary heating systems. It was<br />
operated over a wide range of plasma parameters in 1987: 1 < Ip < 3.2 MA,<br />
0.65 < ap < 0.92 m, <strong>and</strong> 5 X 10' 8 :£ n,. < 1.2 x 10 20 nr 3 . A combined heating<br />
power of up to 30 MW was injected <strong>and</strong> the plasma stored energy was increased to<br />
3 MJ [1, 2].<br />
The improvements in confinement have been explored with beam heated hydrogen<br />
plasmas by several methods; by current profile modification with LHCD [3-5],<br />
by beam acceleration with ICRF [6, 7] <strong>and</strong> by H-mode transition with the outer<br />
X-point [1, 2, 8], A new divertor coil was installed to produce a lower X-point configuration<br />
at the beginning of 1988. Hence, JT-60 has become a unique device where<br />
the effect of configurations, limiter <strong>and</strong> outer or lower X-point on the plasma confinement<br />
can be examined with the same heating <strong>and</strong> diagnostic systems.<br />
NB heating experiments in the lower X-point configuration (ap « 0.65 m,<br />
K « 1.3) have been carried out with PMB up to 25 MW. A new regime of improved<br />
divertor confinement (IDC) appears in the lower X-point configuration when the<br />
heating power exceeds about 15 MW. The IDC regime is characterized by high particle<br />
recycling <strong>and</strong> remote radiative cooling in the divertor region, which is required<br />
to alleviate the heat load on the divertor plates of the fusion reactors.<br />
2. IMPROVED CONFINEMENT REGIME WITH LOWER X-POINT<br />
Discharge waveforms with <strong>and</strong> without improved divertor confinement are<br />
compared in Fig. 1. The thick lines in the figure are traces of an improved<br />
shot (E6950, Bt = 4.0 T) <strong>and</strong> the thin lines st<strong>and</strong> for an unimproved shot (E6956,<br />
Bt = 2.7 T). The stored plasma energy of the former shot begins to rise around<br />
6.1 s whereas that of the latter shots saturates early. Lowering the effective safety<br />
factor, qeff, leads to an excitation of edge localized modes (ELMs), which prevent<br />
the discharges from reaching the IDC regime. Frequent ELMs can be clearly seen<br />
in the H° w trace.<br />
The improvement is associated with an increase in the electron density <strong>and</strong> a<br />
decrease in the radiation power from the core plasma. The central electron temperature<br />
measured by ECE keeps rising with increasing density. Note that the Ha emission<br />
from the divertor region is significantly enhanced during the improved phase.<br />
Bolometric measurements indicate that radiation power both in the divertor <strong>and</strong> near<br />
the X-point regions increases at these moments. These observations suggest that high<br />
particle recycling takes place in the divertor region. Although the carbon impurity<br />
lines tend to rise, the oxygen impurity lines emitted from the main plasma drop<br />
during the improved phase. Visible bremsstrahlung measurement indicates that Zeff<br />
is kept nearly constant throughout the improved phase. The IDC regime is different<br />
from the H-mode since particle recycling never drops <strong>and</strong> there is no sharp transition.
E6950(Bi=4.0T)<br />
E6956(Bt = 2.7T)<br />
°46 5.0 5.5 6.0 6.5 7.0 7.5<br />
TIME(S)<br />
<strong>IAEA</strong>-CN-50/A-V-1 267<br />
h-> IMPROVED<br />
4.5 5.0 5.5 6.0 65 70 75<br />
TIME(S)<br />
FIG. 1. Comparison ofl MA discharge waveforms with <strong>and</strong> without improved confinement. The thick<br />
lines st<strong>and</strong> for traces of an enhanced shot (E6950; B, = 4T, q^f "3.7) <strong>and</strong> thin ones for a low-q shot<br />
(E6956; B, = 2.7T, qtff » 2.4).<br />
There is, however, a threshold for the heating power (—15 MW) to achieve the<br />
improvement.<br />
The IDC regime is easily obtained at high B,, whereas clear H-phases are<br />
observed only in low B, discharges. Figure 2 shows the points where IDC regime,<br />
L/H transitions <strong>and</strong> ELMs appear in the domain of line averaged electron density <strong>and</strong><br />
absorbed power. L/H transitions were observed in low density discharges for Bt<br />
around 3 T. The IDC regime sets in afterwards at higher electron densities. When<br />
Bt is higher, the IDC regime starts at lower electron densities. The threshold i^<br />
increases with power in both cases. Since the connection length of the magnetic field<br />
lines from the plasma edge to the divertor plates increases with Bt, these findings<br />
suggest that the IDC regime is related to the formation of dense <strong>and</strong> cold divertor<br />
plasmas [9, 10]. The time evolution of the divertor plate temperature is measured<br />
with an infrared camera. An example for these measurements is shown in Fig. 3. It<br />
should be noted that the rate of temperature increase drops when the IDC regime sets<br />
in around 5.7 s. The heat flux onto the divertor plates which is evaluated with a 1-D<br />
heat inverse conduction code decreases during the IDC regime. The total power load<br />
at 6.7 s is estimated to be about 4 MW, on the assumption that the heat flux profile<br />
is similar to the temperature profile. The values of the radiation power from main<br />
<strong>and</strong> divertor plasmas are about 4 MW <strong>and</strong> 9 MW, respectively. Thus, the total
268<br />
«+<br />
3 -<br />
2<br />
1<br />
0<br />
3<br />
2<br />
1<br />
n<br />
-<br />
-<br />
IP<br />
IP<br />
i<br />
i i<br />
0 0° o<br />
TSUJI et al.<br />
-1MA , BT-4~4.5T<br />
O<br />
• •<br />
= 1MA<br />
i i<br />
1 < • 1 1 1*1 1<br />
••I<br />
s «<br />
oo<br />
o ° °<br />
8 .<br />
° •« °<br />
•<br />
, BT -3-3.3T<br />
1 i<br />
20<br />
i i i i<br />
P (MW)<br />
ABS<br />
-<br />
25<br />
• ELM<br />
onset<br />
O IDC<br />
onset<br />
LH<br />
transition<br />
O IDC<br />
onset<br />
FIG. 2. Threshold electron densities of the IDC regime, H-mode <strong>and</strong> ELMs as a Junction of the total<br />
absorbed power.<br />
absorbed power of 18.7 MW is well accounted for, <strong>and</strong> nearly half of the input power<br />
is radiated in the divertor region. Although the total radiation power from the main<br />
plasma incrases slightly during the improved phase when the plasma current is higher<br />
than 1 MA, most of the power is radiated near the X-point as is seen in the 3-D plot<br />
of the time evolution of the bolometer signals (Fig. 3). Presumably, enhanced divertor<br />
functions with high particle recycling are responsible for the IDC regime.<br />
Figure 4 shows the stored plasma energy as evaluated from diamagnetic<br />
measurements as a function of the total absorbed power. The data points of unimproved<br />
shots shown as closed symbols obey an offset linear law. The open symbols<br />
represent the improved shots. The degree of improvement appears to depend on the<br />
development of high particle recycling in the divertor.<br />
For comparison, the data points from 1 MA limiter discharges with nearly the<br />
same plasma volume of 32 m 3 as the lower X-point ones are plotted in Fig. 4. The<br />
energy confinement in the lower X-point configuration is better by about 20% in the<br />
case of the unimproved shots <strong>and</strong> up to 50% in the case of the improved shots. The<br />
improvement becomes, however, less pronounced with increasing plasma current.<br />
The data of 1.8 MA (qeff « 2.8) <strong>and</strong> 2.0 MA (qeff « 2.6) shots are not very<br />
different from those of 1.5 MA (qeff = 3.3) shots. Lowering the safety factor below<br />
three should affect the plasma confinement <strong>and</strong> degrade the improvement.
E7558 • IMPROVED<br />
5 6<br />
TIME (S)<br />
<strong>IAEA</strong>-CN-50/A-V-1<br />
FIG. 3. Time evolution of radiation power <strong>and</strong> temperature of divertor plates by which the power<br />
balance can be examined (Ip = 1.8 MA, B, = 4.5 T, P^ = 18.7MW). A 3-D plot of bolometer signals<br />
<strong>and</strong> the location of the temperature measurement of the divertor plates by an IR camera are shown on<br />
the right h<strong>and</strong> side.<br />
3. COMPARISON BETWEEN OUTER AND LOWER X-POINT<br />
CONFIGURATIONS<br />
We have not observed such an improvement as described above in the outer<br />
X-point configuration. A significant difference was found in the divertor heat flux<br />
in the high power heating case. About 70% of the input power was exhausted to the<br />
divertor plates in the outer X-point configuration [11]. There is no appreciable difference<br />
in energy confinement between the outer <strong>and</strong> the limiter configurations when<br />
qeff is above three [1]. The peakedness of the electron density profiles is compared<br />
269<br />
3.37
270 TSUJIetal.<br />
2.0 -<br />
1.5 -<br />
1.0 -<br />
0.5-<br />
*<br />
A<br />
a<br />
o<br />
I<br />
IP<br />
2.0 MA<br />
1.8<br />
1.5<br />
1.0<br />
• •<br />
i<br />
•<br />
1 , 1<br />
Open Symbols: Improved<br />
•H-<br />
m<br />
° ° * ^rf<br />
• 0 O QJ<br />
+<br />
•<br />
+ Limiter < 1. OMA, aP-o.7m»<br />
i i<br />
1<br />
i<br />
10 15<br />
Pabs IMW)<br />
20 25<br />
A<br />
• V<br />
o<br />
+<br />
•fo a<br />
o °^<br />
><br />
FIG. 4. Stored plasma energy as a function of the total absorbed pov/er. Data points represented by<br />
open symbols are in the IDC regime.<br />
A<br />
£<br />
V<br />
c 1<br />
cP a<br />
• • n<br />
m O<br />
• UMITER<br />
O LOWER-X<br />
A OUTER-X<br />
0PEN:NB<br />
CLOSED: OH<br />
0 1 2 3 4 5 6 7 8<br />
n8 (10 19 m" 3 )<br />
FIG. 5. Peakedness of electron density profile as a function of line averaged electron density.<br />
in Fig. 5 to show up the distinction between the outer <strong>and</strong> the lower X-point configurations.<br />
The electron density profile in the outer X-point configuration becomes<br />
almost flat with increasing density. On the other h<strong>and</strong>, the electron density profile<br />
in the lower X-point configuration is parabolic, similarly to the limiter configuration,<br />
irrespective of whether it has been improved or not. Recycling particles are easily<br />
refuelled in the lower X-point configuration, which may explain the difference in the<br />
density profiles.<br />
"1<br />
o —
7.0<br />
E -<br />
1<br />
0.0<br />
7.0<br />
0.0<br />
=— \<br />
n;<br />
- T7T_|<br />
1<br />
0.0 0.25 0.50<br />
p(m)<br />
\<br />
Lower-X<br />
IP=1MA<br />
<strong>IAEA</strong>-CN-50/A-V-1 271<br />
10 2<br />
IO- 1<br />
10 2<br />
IO- 1<br />
0.75 1.0 0.0 0.25 0.50<br />
p(m)<br />
FIG. 6. Density, temperature <strong>and</strong> thermal diffusivity profiles from a transport analysis of a beam<br />
heated plasma in the IDC regime. The subscripts e, i <strong>and</strong> f st<strong>and</strong> for electron, ion <strong>and</strong> fast ion, respectively.<br />
The calculated profiles assuming neoclassical parameter dependence of Xi are indicated by<br />
H-mode transitions have been observed both in the outer <strong>and</strong> in the lower<br />
X-point configurations. The H-mode phase does not, however, last long, partly<br />
because we operate only with hydrogen plasmas. Consequently, the improvement in<br />
energy confinement is limited to 10%. In the case of the lower X-point configuration,<br />
which is completely open divertor, frequent ELMs rather than clear H-phases appear.<br />
The threshold power for the H-transition is rather high (Pabs « 18 MW at<br />
B, « 4 T) in both configurations. Although the location of the lower X-point is<br />
towards the VB direction, there is no appreciable difference in terms of power<br />
threshold as compared with the outer X-point.<br />
4. TRANSPORT ANALYSIS<br />
We have analysed beam heated plasmas in the lower X-point configuration in<br />
order to evaluate electron <strong>and</strong> ion heat conduction. The electron temperature profile<br />
is measured by the Thomson scattering <strong>and</strong> soft X-ray filter methods. The ion temperature<br />
is evaluated by charge exchange recombination (CXR) spectroscopy. The<br />
electron density as found by Thomson scattering is corrected by FIR interferometer<br />
measurements. Figure 6 shows an example of an analysis using a 1.5-D timeindependent<br />
code. The ion temperature profile is peaked, which cannot be explained<br />
0.75
272 TSUJI et al.<br />
by the parameter dependence of the neoclassical ion thermal diffusivity. The ion <strong>and</strong><br />
electron thermal diffusivities calculated from the CXR ion temperature profile show<br />
a reverse behaviour at the outer radii as compared with the neoclassical behaviour<br />
found by Chang <strong>and</strong> Hinton [12] as shown in the right h<strong>and</strong> boxes. Their values at<br />
half minor radius are about 3 m 2 -s"'.<br />
5. CONCLUSIONS<br />
The improved divertor confinement regime appears in the lower X-point configuration<br />
when the heating power exceeds about 15 MW. The IDC regime is easy to<br />
develop in high-q discharges. The energy confinement improves up to 50%, compared<br />
with the limiter discharges with the same plasma volume. The improvement<br />
is associated with high particle recycling <strong>and</strong> remote radiative cooling in the divertor.<br />
Reducing the safety factor below three can excite frequent ELMs <strong>and</strong> degrade the<br />
improved confinement regime.<br />
The peaked ion temperature profile measured by CXR spectroscopy cannot be<br />
explained by the neoclassical ion thermal diffusivity. The ion <strong>and</strong> electron thermal<br />
diffusivities at half minor radius have nearly the same vlaue of about 3 itf-s" 1 .<br />
ACKNOWLEDGEMENTS<br />
The authors wish to thank the members of JAERI who have contributed to the<br />
JT-60 project throughout its progress. They also wish to express their gratitude to<br />
S. Mori, K. Tomabechi <strong>and</strong> M. Yoshikawa for continuous encouragement <strong>and</strong><br />
support.<br />
REFERENCES<br />
[1] JT-60 TEAM, in Controlled Fusion <strong>and</strong> Plasma Heating (Proc. 15th Eur. Conf. Dubrovnik,<br />
1988), Vol. 12B, European Physical Society (1988), to be published in Plasma Phys. Controll.<br />
Fusion.<br />
[2] JT-60 TEAM, Paper <strong>IAEA</strong>-CN-50/A-I-4, these Proceedings, Vol. 1.<br />
[3] JT-60 TEAM, in Plasma Physics <strong>and</strong> Controlled <strong>Nuclear</strong> Fusion Research 1986 (Proc. 1 lth Int.<br />
Conf. Kyoto, 1986), Vol. 1, <strong>IAEA</strong>, Vienna (1987) 563.<br />
[4] JT-60 TEAM, Plasma Phys. Controll. Fusion 29 (1987) 1377.<br />
[5] TSUJI, S., JT-60 TEAM, in Controlled Fusion <strong>and</strong> Plasma Physics (Proc. 14th Eur. Conf.<br />
Madrid, 1987), Vol. 11D, Part I, European Physical Society (1987) 57.<br />
[6] FUJII, T., JT-60 TEAM, in Controlled Fusion <strong>and</strong> Plasma Heating (Proc. 15th Eur. Conf.<br />
Dubrovnik, 1988), Vol. 12B, Part H, European Physical Society (1988) 766.<br />
[7] KIMURA, H., et al., submitted to Phys. Rev. Lett.<br />
[8] JT-60 TEAM, in Proc. 8th Int. Conf. on Plasma-Surface Interactions, Jiiiich, 1988, to be published<br />
in J. Nucl. Mater.
<strong>IAEA</strong>-CN-50/A-V-1 273<br />
[9] SHIMOMURA, Y., et al., Nucl. Fusion 23 (1983) 869.<br />
[10] SHIMADA, M., et al., in Plasma Physics <strong>and</strong> Controlled <strong>Nuclear</strong> Fusion Research 1984 (Proc.<br />
10th Int. Conf. London, 1984), Vol. 1, <strong>IAEA</strong>, Vienna (1985) 281.<br />
[11] NAKAMURA, H., et al., Nucl. Fusion 28 (1988) 43.<br />
[12] CHANG, C.S., HINTON, F.L., Phys. Fluids 29 (1986) 3314.
THERMAL WAVE INVESTIGATION OF<br />
ANOMALOUS TRANSPORT<br />
BY MODULATED ECRH AND SAWTEETH<br />
M. ASHRAF, CM. BISHOP, J.W. CONNOR, M. COX,<br />
N. DELIYANAKIS 1 , J. HUGILL, H.W. LEAN, P. MANTICA 2 ,<br />
W. MILLAR, B.J. PARHAM, R.A. PITTS 3 ,<br />
D.C. ROBINSON, A. SIMONETTO 4 , G. VAYAKIS 1<br />
Culham Laboratory,<br />
Euratom-UKAEA Fusion Association,<br />
Abingdon, Oxfordshire,<br />
United Kingdom<br />
Abstract<br />
<strong>IAEA</strong>-CN-50/A-V-2-1<br />
THERMAL WAVE INVESTIGATION OF ANOMALOUS TRANSPORT BY MODULATED ECRH<br />
AND SAWTEETH.<br />
The electron thermal difftisivity, x. of ECR heated plasmas in DITE has been obtained from<br />
(1) the radial form of the modulated components of SXR <strong>and</strong> EC emission from the plasma in response<br />
to modulated ECRH power input; (2) analysis of the propagation of heat pulses from the sawtooth<br />
collapse; (3) power balance studies. The response of the density <strong>and</strong> edge parameters <strong>and</strong> their fluctuations<br />
to ECRH has also been investigated. The results obtained for central resonance are consistent with<br />
diffusive transport of heat <strong>and</strong> the role of off-diagonal terms in the transport matrix appears to be small.<br />
1. INTRODUCTION<br />
In general heat <strong>and</strong> particle transport in plasmas will be driven by pinch<br />
terms <strong>and</strong> radial gradients of all of the thermodynamic forces. Therefore<br />
the electron heat flux, qe, <strong>and</strong> particle flux, Fe, will respond to the radial<br />
gradients of electron temperature <strong>and</strong> electron density:<br />
(T) "Te /n\ one , 1.<br />
~ 9e = e ~bT e ~d7 ~~ qvinch ('<br />
dr e ~d^ p<br />
1 Oxford University, Oxford, United Kingdom.<br />
2 Istituto di Fisica del Plasma, Consiglio Nazionale delle Ricerche, Milan, Italy.<br />
3 Royal Holloway <strong>and</strong> Bedford New College, University of London, London, United<br />
Kingdom.<br />
4 Attached under a Euratom Fellowship.<br />
275
276 ASHRAF et al.<br />
However, the conventional assumption that only the 'diagonal' terms (K^<br />
<strong>and</strong> Di n ') are important has been used in most of the analysis. The transport<br />
coefficients obtained are therefore 'effective' values:<br />
A theoretical analysis of thermal wave propagation has been conducted<br />
for collisionless <strong>and</strong> collisional neoclassical plasmas which shows that x e j*<br />
measured by these techniques is sensitive to the off-diagonal elements of<br />
the transport matrix. For example measurement of xl^ by heat pulse<br />
modulation would give a value of twice x^ for a collisionless plasma <strong>and</strong> the<br />
fractional density perturbation would exceed <strong>and</strong> be of opposite sign to the<br />
temperature perturbation at large distances from the source. However, close<br />
to the source the density perturbation will be small <strong>and</strong> of the same sign<br />
as the temperature perturbation. Collisional classical plasmas <strong>and</strong> those<br />
subject to anomalous transport from trapped electron modes give smaller<br />
positively correlated density perturbations (~ 30% of Te) <strong>and</strong> values of x e j*<br />
closer to x£ T ^ since the off-diagonal terms are smaller.<br />
2. EXPERIMENTAL ARRANGEMENT<br />
Experimental Parameters<br />
Transport studies have been undertaken in DITE with major/limiter radii of<br />
R/a = 1.20/0.21m (He plasma, fundamental ECRH) <strong>and</strong> 1.19/0.24m (H or<br />
D plasma, fundamental or second harmonic ECRH). The plasma parameters<br />
for fundamental (second harmonic) heating were: plasma current 100 kA<br />
(40-60 kA), line averaged density 1-5 x 10 19 m" 3 (0.6 - 0.8 x 10 19 m- 3 ),<br />
electron temperature 0.8-1.5 keV (0.5 - 0.7 keV). The plasmas were heated<br />
using up to 180 kW of 100% square wave modulated (143 or 333Hz), 60 GHz<br />
X mode radiation launched from the high field side at 45°(30°) to the major<br />
radius for fundamental (second harmonic) heating. The EC resonance was<br />
scanned from 1.0 to 1.5m. Very strong <strong>and</strong> localised absorption is both<br />
predicted <strong>and</strong> measured [1].<br />
Diagnostics<br />
The plasma response to modulated ECRH <strong>and</strong> to sawtooth perturbations<br />
was measured using two 20 channel soft X-ray (SXR) diode arrays viewing
<strong>IAEA</strong>-CN-50/A-V-2-1 277<br />
from the top <strong>and</strong> outboard side, a 14 channel heterodyne ECE system covering<br />
53-66.5 GHz <strong>and</strong> a 5 channel 2 mm microwave interferometer. The<br />
edge density <strong>and</strong> temperature <strong>and</strong> the edge plasma floating potential were<br />
measured using probes at various poloidal <strong>and</strong> toroidal locations. The level<br />
of edge magnetic activity was obtained from Mirnov coils. The radial variation<br />
of the mean <strong>and</strong> fluctuating components of the edge ne, Te <strong>and</strong> Br were<br />
measured using a reciprocating probe.<br />
3. ANALYSIS<br />
Modulated ECRH<br />
Even in a finite cylindrical plasma with radially varying ne <strong>and</strong> Xe, the<br />
temperature phase lag, (r), at frequency u> is given within ~ 10% by the<br />
expression for an homogeneous slab plasma provided that the observation<br />
radius, robs, satisfies krobs > 1 <strong>and</strong> k(a — r 1. Here k = (3w/4x) 1/ ' 2<br />
<strong>and</strong> the bar denotes an average over the appropriate region. If there are no<br />
modulated power sources or sinks (e.g. changes in ohmic heating, equipartition<br />
or radiation) at the observation radius the local value of x 1S given<br />
by (2]<br />
At radii where k(a — rot,3) < 1, d/dr is sensitive to the behaviour at the<br />
plasma boundary <strong>and</strong> eq (4) tends to over estimate the local value of x-<br />
In order to include these boundary effects, cylindrical effects in the plasma<br />
centre <strong>and</strong> the line-of-sight averaging of the SXR emission, an analysis code<br />
has been used [3] in which x <strong>and</strong> the ECRH deposition profile [1] are varied<br />
to achieve a fit to the experimental phase <strong>and</strong> amplitude. The code<br />
includes ohmic power modulation resulting from modulated plasma conductivity<br />
which for these discharges ( PECRHIPOH £ 1) reduces the value of<br />
X by up to 40%. Modulation of the equipartition is not normally important<br />
<strong>and</strong> the radiation loss is small for rja £ 0.7.<br />
Sawtooth<br />
Equation (4) also gives accurate values of xl**( r ) when applied to the<br />
Fourier components of sawtooth generated local temperature perturbations.<br />
Modelling of the effect of line-of-sight averaging of the SXR emission indicates<br />
that eq(4) typically overestimates x by ~ 15%. The conventional delay<br />
formula, XST = Sr 2 /SSt, gives results consistent with the phase analysis.
278<br />
40<br />
30<br />
01<br />
£20<br />
X<br />
1-0<br />
a<br />
" \<br />
<strong>IAEA</strong>-CN-50/A-V-2-1 279<br />
t<br />
•<br />
*<br />
•<br />
•<br />
o • Sawtooth<br />
a • Modulation<br />
* • Power balance<br />
"0 10 10 30 4-0 50<br />
ne (10 m" )<br />
FIG. 2. Comparison between x? ( r = a ^) deduced from modulation experiments, sawtooth heat<br />
pulse propagation <strong>and</strong> power balance as a function of line averaged density. Solid points are for He<br />
discharges, open points for HID discharges.<br />
relative to temperature perturbations (Te/Te cz 10 — 20%) suggests that<br />
in these experiments the off-diagonal elements of the transport matrix are<br />
small.<br />
The Ha signals show a modulation with a prompt component at the<br />
wall but the response at the limiter is delayed by several ms indicating<br />
the presence of both direct edge absorption of ECRH power <strong>and</strong> enhanced<br />
recycling caused by the thermal wave. The ion saturation current shows<br />
similar behaviour.<br />
The variation of amplitude <strong>and</strong> phase of the modulated component of the<br />
ion saturation current at the limiter with resonance position, shown in Fig.<br />
3, also provides evidence for diffusive transport from the ECRH deposition<br />
region. The fluctuating component of Br, which is related to the level of<br />
edge electrostatic fluctuations by parallel pressure balance, shows similar<br />
behaviour (Fig,3).<br />
The phase <strong>and</strong> amplitude of the plasma response cannot always be fitted<br />
with our simple diffusive model. In particular with off-axis heating the<br />
minimum phase lag does not always occur where the power is deposited,<br />
possibly due to the observed locking of sawteeth to the modulation in some<br />
cases. At high density the SXR response shows evidence of an effect on<br />
impurity concentration <strong>and</strong> the signal may even decrease at the resonance<br />
radius.
280 ASHRAF et al.<br />
Modulation amplitude vs resonance position<br />
30<br />
Phase delay vs resonance position<br />
-30 -20 -10 0 10<br />
rres(cm)<br />
FIG. 3. Amplitude <strong>and</strong> phase of the ion saturation current <strong>and</strong> radial field fluctuations as a function<br />
ofECRH resonance position for second harmonic heating.<br />
5. CONCLUSION<br />
X e J* values deduced from power balance <strong>and</strong> sawtooth propagation are similar<br />
<strong>and</strong> both fall with increasing ne. Modulation experiments give somewhat<br />
higher values of x e j* • There are indications that the effective thermal conductivity<br />
nex e j* rises away from the central regions of the plasma. The<br />
amplitudes <strong>and</strong> delay times of the edge response are consistent with diffusive<br />
energy transport from the power deposition region. Off-diagonal terms<br />
in the transport matrix appear to be small.<br />
REFERENCES<br />
[1] ASHRAF, M., et al., Paper <strong>IAEA</strong>-CN-5O/E-I-3, these Proceedings, Vol. 1.<br />
[2] JAHNS, G.L., et al., Nucl. Fusion 26 (1986) 226.<br />
[3] DELIYANAKIS, N., et al., in Electron Cyclotron Emission <strong>and</strong> Electron Cyclotron Resonance<br />
Heating (Proc. 6th Joint Workshop Oxford, 1987), UKAEA, Culham Lab., Abingdon (1987)<br />
247.
<strong>IAEA</strong>-CN-50/A-V-2-2<br />
COUPLING OF PARTICLE AND HEAT TRANSPORT<br />
MEASURED VIA SAWTOOTH<br />
INDUCED PULSE PROPAGATION<br />
S.K. KIM, D.L. BROWER, W.A. PEEBLES, N.C. LUHMANN, Jr.<br />
Institute of Plasma <strong>and</strong> Fusion Research,<br />
University of California at Los Angeles,<br />
Los Angeles, California<br />
M.S. FOSTER, S.C. McCOOL<br />
Fusion Research Center,<br />
University of Texas at Austin,<br />
Austin, Texas<br />
United States of America<br />
Abstract<br />
COUPLING OF PARTICLE AND HEAT TRANSPORT MEASURED VIA SAWTOOTH INDUCED<br />
PULSE PROPAGATION.<br />
Detailed measurements of sawtooth induced heat <strong>and</strong> particle transport are made on the TEXT<br />
tokamak. A multichannel, heterodyne, far infrared laser interferometer system with high spatial<br />
(Ax
282 KIMet al.<br />
(a)<br />
(b)<br />
410<br />
420<br />
TIME (ms)<br />
420<br />
TIME (ms)<br />
430<br />
SXRal<br />
ll.6em<br />
-8.9<br />
430<br />
FIG. 1. (a) Density <strong>and</strong>
<strong>IAEA</strong>-CN-50/A-V-2-2 283<br />
ASBD(V)<br />
FIG. 2. (a) Abel inverted electron density profile immediately before (solid line) <strong>and</strong> after (dashed line)<br />
sawtooth crash; BT = 2 T, Ip = 300 kA <strong>and</strong> ^ = 4 x 1& 3 cm' 3 , (b) Correlation of density <strong>and</strong> SXR<br />
crash size. Point A is for a discharge near the density limit <strong>and</strong> point B is for a discharge at low qa.<br />
averaged density sawtooth in order to obtain the local density perturbation. The Abel<br />
inverted, density sawtooth time history is shown in Fig. 3(a) at various positions outside<br />
the inversion radius. Important features include the broadening of the pulse <strong>and</strong><br />
larger time-to-peak for increasing minor radius, thereby creating the image of pulse<br />
propagation. Figure 3(b) follows the evolution of the density perturbation profile during<br />
a sawtooth cycle, Immediately after the sawtooth crash<br />
(t « 0.1 rst, where TS, is the sawtooth period), electrons from the central region are
284 KIM et al.<br />
(b)<br />
o<br />
3<br />
'Z 1<br />
<strong>IAEA</strong>-CN-50/A-V-2-2 285<br />
o<br />
o°<br />
o .<br />
••I*<br />
SHOT IO5IO7<br />
• DENSITY<br />
OSOFT X-RAY<br />
200 400 600<br />
minor radius (cm )<br />
FIG. 4. The time-to-peak, p tp, dependence on minor radius squared for heat <strong>and</strong> density pulses;<br />
p p<br />
13<br />
BT = 2 T, Ip = 200 kA <strong>and</strong> ne0 = 3 x 10 13 -3<br />
,<br />
A comparison of the time-to-peak, tp(r), characteristics of the heat <strong>and</strong> particle<br />
pulses is made in Fig. 4. The data are quite similar, suggesting that the heat <strong>and</strong> particle<br />
transport occur at essentially the same rate. Employing a previously described<br />
diffusive mode [1] to the density perturbation provides an estimate of the average<br />
1.5 m 2 -s"' (= r 2 /^^,) in the confinement zone. The st<strong>and</strong>ard diffusive<br />
model for heat transport [3] indicates x" p — 2 m 2 -s"' (= i 2 /^). The validity of this<br />
model is, however, suspect since it assumes the density perturbation to be negligible,<br />
thereby contradicting experimental results on TEXT. These estimated values for the<br />
transport coefficients are both larger, by a factor of two to three, than D^ GF<br />
deduced from modulated gas feed experiments [4] <strong>and</strong> x PB deduced from steady<br />
state power balance calculations [5]. The modulated gas feed results are thought to<br />
be more indicative of the steady state because of their slow time scale<br />
(fmod > rE) <strong>and</strong> edge fuelling characteristics. The inverse slopes r 2 /^ for density <strong>and</strong><br />
temperature perturbations are generally comparable for all discharges except those<br />
at the high density or low-q limit for TEXT. In these extreme cases, heat <strong>and</strong> density<br />
pulse propagation are no longer thought to be accurately described by a diffusive-type<br />
model.<br />
To further investigate the relationship between heat <strong>and</strong> particle transport after<br />
the sawtooth crash, the scaling behaviour of rVtp for density <strong>and</strong> temperature<br />
perturbations is examined. The effects of qa <strong>and</strong> iieo scaling are most clearly<br />
obtained by performing a regression analysis yielding (r 2 /tp) DP
286 KIM et ah<br />
In summary, we observe that the temperature perturbation generated from the<br />
sawtooth crash is accompanied by a density perturbation of comparable magnitude.<br />
Both the density <strong>and</strong> temperature perturbations are found to be transported out<br />
through the confinement zone of TEXT at the same rate <strong>and</strong> in a manner consistent<br />
with a diffusive process. In addition, the scalings of (r 2 /^) for particles <strong>and</strong> heat are<br />
measured to be similar. These results indicate that particle <strong>and</strong> thermal transport for<br />
sawtooth induced perturbations are coupled. Future work will include a heat transport<br />
model consistent with a finite density perturbation <strong>and</strong> measurements of the transport<br />
coupling during electron cyclotron resonance heating on TEXT.<br />
ACKNOWLEDGEMENT<br />
This work is supported by the US Department of Energy under Contract<br />
Nos DE-FG03-86ER-53225 <strong>and</strong> DE-AC05-78ET-53043.<br />
REFERENCES<br />
[1] KIM, S.K., BROWER, D.L., PEEBLES, W.A., LUHMANN, N.C., Jr., Phys. Rev. Lett. 60<br />
(1988) 577.<br />
[2] KIM, S.K., BROWER, D.L., PEEBLES, W.A., LUHMANN, N.C., Jr., High-resolution multichannel<br />
interferometric measurement of sawtooth density-pulse propagation, to be published in<br />
Rev. Sci. Instrum. (1989).<br />
[3] FREDRICKSON, E., et al., Nucl. Fusion 26 (1986) 849.<br />
[4] GENTLE, K.W., RICHARDS, B., WAELBROECK, F., Plasma Phys. Controll. Fusion 29<br />
(1987) 1077.<br />
[5] WOOTTON, A.J., et al., in Plasma Physics <strong>and</strong> Controlled <strong>Nuclear</strong> Fusion Research 1986<br />
(Proc. 11th Conf. Kyoto, 1986), Vol. 1, <strong>IAEA</strong>, Vienna (1987) 187.
DENSITY FLUCTUATIONS AND PARTICLE/<br />
THERMAL TRANSPORT FOR OHMICALLY<br />
AND AUXILIARY HEATED PLASMAS<br />
IN THE JIPP T-nU TOKAMAK<br />
<strong>IAEA</strong>-CN-S0/A-V-3-1<br />
K. KAWAHATA, K. ADATI, R. AKIYAMA, A. ANDO, R. ANDO,<br />
T. AOKI, D.-G. BI\ J. FUJITA, Y. HAMADA, S. HIDEKUMA,<br />
S. HIROKURA, K. IDA, H. IKEGAMI, K. KADOTA, E. KAKO,<br />
O. KANEKO, A. KARITA, Y. KAWASUMI, S. KITAGAWA,<br />
M. KOJIMA, T. KOUMOTO, S. KUBO, Y. KUBOTA, R. KUMAZAWA,<br />
T. KURODA, K. MASAI, H. MASUMOTO, A. MOHRI, T. MORI,<br />
S. MORITA, K. NARIHARA, A. NISHIZAWA, I. OGAWA, Y. OGAWA,<br />
K. OHKUBO, Y. OKA, S. OKAJIMA 2 , S. OKAMURA, T. OZAKI,<br />
A. SAGARA, M. SAKAMOTO, M. SASAO, K. SATO, K.N. SATO,<br />
T. SATO, F. SHIMBO, S. TANAHASHI, Y. TANIGUCHI, K. TOI,<br />
T. TSUZUKI, T. WATARI, H. YAM ADA<br />
Institute of Plasma Physics,<br />
Nagoya University,<br />
Chikusa-ku, Nagoya,<br />
Japan<br />
Abstract<br />
DENSITY FLUCTUATIONS AND PARTICLE/THERMAL TRANSPORT FOR OHMICALLY<br />
AND AUXILIARY HEATED PLASMAS IN THE JIPP T-JJU TOKAMAK.<br />
The paper reports a study on microturbulence excited in ohmically heated (OH) <strong>and</strong> auxiliary<br />
heated plasmas in the JIPP T-JJU tokamak. In high density OH plasmas it has been found that the energy<br />
confinement time deviates from the Alcator scaling <strong>and</strong>, at the same time, the ion mode which<br />
propagates in the ion diamagnetic drift direction is excited in addition to the electron mode. The value<br />
of 17; = (d In Tj/d In n;) evaluated experimentally is about 1.0-1.2 when the ion mode is excited. In<br />
high power auxiliary heated plasmas, where the ion mode is also observed, the ion thermal diffusivity<br />
around r/a = 0.5 is two to five times larger than the neoclassical values. From an analysis of the time<br />
evolution of the density profile after the injection of an ice pellet, the particle diffusivity D <strong>and</strong> the convective<br />
velocity v are estimated to be D = (0.4-0.7) n^-s" 1 <strong>and</strong> v = (4-8) m-s" 1 at r/a = 0.5 for OH<br />
plasmas.<br />
1. DENSITY FLUCTUATIONS AND THERMAL DIFFUSIVITY<br />
The causes of anomalous transport in hot plasmas have been studied for a long<br />
time. Recent theoretical studies [1-3] suggest that the dissipative trapped electron<br />
(DTE) mode <strong>and</strong> the ion temperature gradient mode (ij; mode) are important. In the<br />
1 Southwestern Institute of Physics, Leshan, Sichuan, China.<br />
Department of Applied Physics, Chubu University, Kasugai 487, Japan.<br />
287
288 KAWAHATA et al.<br />
TEXT tokamak, the existence of a density fluctuation propagating in the ion diamagnetic<br />
drift direction fo mode) has been reported [4] in a high density ohmically<br />
heated (OH) plasma, but without experimental information on the ion temperature<br />
profile. In the JIPP T-IIU tokamak [5] (R = 0.91 m, ap = 0.23 m, Bt :S 3 T), the<br />
r/i mode is observed in high density OH <strong>and</strong> also in auxiliary heated (NBI <strong>and</strong><br />
ICRH) plasmas, <strong>and</strong> its effect on the temperature profile is investigated.<br />
The spatial <strong>and</strong> temporal behaviour of the density j?e(r,t), the electron<br />
temperature Te(r,t) <strong>and</strong> the ion temperature T;(r,t) is measured with a six channel<br />
HCN laser interferometer system, a ten channel grating polychromator (ECE) <strong>and</strong><br />
charge exchange recombination spectroscopy (CXRS). To study plasma microturbulence,<br />
we have developed an FIR laser scattering system with heterodyne detection.<br />
The main radiation source is a 5 m long HCN laser, which delivers a linearly polarized<br />
beam of 0.5 W with a wavelength \ — 337 jtm. For heterodyne detection,<br />
another HCN laser is operated as a local oscillator at a beat frequency of 2 MHz.<br />
Low frequency density fluctuations propagating in the ion diamagnetic drift<br />
direction have been observed in high density OH <strong>and</strong> auxiliary heated plasmas.<br />
Figure 1 shows typical power spectra of density fluctuations with kj = 9.9 cm" 1<br />
in the OH plasma. They are observed at two different scattering regions whose<br />
centres are located at z = +30 cm (Figs l(a) <strong>and</strong> (b)) <strong>and</strong> z = —30 cm (Figs 1<br />
(c) <strong>and</strong> (d)). The upper (f > 0) <strong>and</strong> lower (f < 0) sideb<strong>and</strong>s in Figs l(a) <strong>and</strong><br />
w/2it(400kHz/d.)<br />
FIG. 1. Power spectral distributions of the density fluctuations with kg = 9.9 cm' 1 , in the scattering<br />
regions with the centres located at (a, b) z = +30 cm <strong>and</strong> (c, d) z = -30 cm. Discharge conditions:<br />
Ip = 200 kA, B, = 2.9 T; (a, c) ne = 2.5 x 1& 9 rn 3 , <strong>and</strong> (b, d) he = 5.2 X 10 19 m 3 .
1.0<br />
5 10 15 20<br />
Minor Radius ( cm )<br />
<strong>IAEA</strong>-CN-50/A-V-3-1 289<br />
g.<br />
1.0<br />
0.8<br />
0.6<br />
0.4<br />
0.2<br />
* % * (b)<br />
\o\o<br />
°\*\<br />
8 *<br />
i i i i<br />
5 10 15 20<br />
Minor Radius ( cm )<br />
FIG. 2. (a) Normalized electron density <strong>and</strong> (b) normalized ion temperature profiles of ohmically<br />
heated plasmas with ne = 2.5 x ldf 9 m' 3 (solid line) <strong>and</strong>ne = 5.2 x JO 19 m' 3 (dashed line).<br />
(b) correspond to the directions of the electron diamagnetic drift <strong>and</strong> the ion diamagnetic<br />
drift, respectively, <strong>and</strong> vice versa in Figs l(c) <strong>and</strong> (d). In the low density<br />
regime, the main part of the density fluctuations propagates in the direction of the<br />
electron diamagnetic drift (Figs l(a) <strong>and</strong> (c)), having a linear dispersion relation for<br />
various wavenumbers. In the high density regime, the ion mode propagating in the<br />
ion diamagnetic drift direction is observed (Figs l(b) <strong>and</strong> (d)). This ion mode is considered<br />
to be the drift instability driven by ion temperature gradient, which may cause<br />
anomalous ion thermal transport in high density OH <strong>and</strong> auxiliary heated plasmas.<br />
To study the drift wave turbulence, it is important to examine the spatial profiles of<br />
the density <strong>and</strong> the temperature. Figure 2 shows the normalized electron density <strong>and</strong><br />
ion temperature profiles for the OH plasmas in the low <strong>and</strong> high density regimes. The<br />
value of ij; = (d In T/d In n;) in the high density case is about 1.0-1.2 at<br />
r/a * 0.5, <strong>and</strong> in this plasma the ion mode is clearly observed. This value is comparable<br />
to the threshold value (—0.95) estimated theoretically for the instability with<br />
kxPi - 1 [6].<br />
Figure 3 shows the temporal behaviour of the plasma parameters in the ICRF<br />
heated discharge (PRF » 800 kW). During the OH phase, the stored energy<br />
increases with increasing line averaged electron density up to 4 X 10 13 cm" 3 , <strong>and</strong><br />
saturates in the high density region of 5, S 4 X 10 13 cm" 3 . The electron mode<br />
component fte(e) increases with the electron density. On the other h<strong>and</strong>, the ion<br />
mode component fi^i) keeps a constant level in the low density region<br />
(% £ 4 x 10 13 cm" 3 ) <strong>and</strong> starts rising clearly when % increases above<br />
4 x 10 13 cm" 3 . Injection of ICRF power at t = 255 ms remarkably enhances both<br />
components of the density fluctuations. The injection of an ice pellet in the course<br />
of the ICRF pulse also drastically increases the amplitude of both components just<br />
25
290 KAWAHATA et al.<br />
^ 30 °-<br />
S-200.<br />
"MOO.<br />
0.<br />
1<br />
X -°<br />
a? 0.0<br />
7*"<br />
2 8.<br />
o<br />
x, 4.<br />
"* 0.<br />
0.<br />
~ 2.0<br />
3<br />
Z 1.0<br />
2<br />
0.0<br />
^4.0<br />
^3.0<br />
S 2.0<br />
1.0<br />
0.0<br />
.ru<br />
125. 250. 375.<br />
time (ms )<br />
FIG. 3. Time behaviour of plasma parameters, plasma current Ip, ICRF power Pgp, line averaged<br />
electron density ne, diamagnetic signal Wp, electron density fluctuations ne{e) <strong>and</strong> fte(i), where ne(e)<br />
<strong>and</strong> ne(i) are the electron density fluctuation propagating in the direction of the electron diamagnetic<br />
drift <strong>and</strong> the electron density fluctuation propagating in the direction of the ion diamagnetic drift,<br />
respectively.<br />
after the injection. A few milliseconds later, however, the ion mode component<br />
rapidly returns to the level just before the injection, in contrast to the behaviour of<br />
the electron mode component fte(e). These phenomena seem to be closely related to<br />
the temporal behaviour of the electron density profile. The injected ice pellet<br />
(1.0 mm (diameter) X 1.3 mm (length), v « 400 m-s" 1 ) is ablated around<br />
r/a » 0.5. The broad density profile formed just after the injection makes the ion<br />
mode unstable, which may cause an increase of the inward flow. This enhanced<br />
inward flow makes the density profile peaked within 3 ms after the injection, which<br />
is favourable to reducing the value of ^ <strong>and</strong> results in a reduction of the fluctuation<br />
level of the ion mode ^<br />
500.
0.2 0.4 0.6<br />
(a)<br />
r/a<br />
<strong>IAEA</strong>-CN-50/A-V-3-1 291<br />
I-<br />
5<br />
1 1<br />
e<br />
o<br />
NBI+ICRF<br />
Experiment<br />
.Chanff—Hlnton -<br />
Ratio<br />
0.1,<br />
0 0.2 O.4 0.6<br />
r/a<br />
0.8<br />
FIG. 4. Comparison of experimental <strong>and</strong> neoclassical values of ion thermal diffusivity as functions of<br />
plasma minor radius: (a) NBI heating; (b) NBI + ICRF heating.<br />
The electron <strong>and</strong> ion thermal diffusivities, xe <strong>and</strong> Xi, have been evaluated<br />
experimentally, where the electron <strong>and</strong> ion power deposition profiles have been<br />
determined from the time derivatives of the electron <strong>and</strong> ion thermal energies at the<br />
turn-on/turn-off of the auxiliary power. It is found that the power deposition profiles<br />
to ions for NBI <strong>and</strong> ICRF heated plasmas are consistent with theoretically expected<br />
profiles. Figure 4 shows a comparison of experimental <strong>and</strong> neoclassical [7] values<br />
of the ion thermal diffusivity as functions of plasma minor radius. The ion thermal<br />
diffusivity at r/a = 0.5 has been calculated to be 0.9 m 2 -s~' <strong>and</strong> 1.5 m 2 -s" ] for the<br />
NBI (PNBI = 0.5 MW) <strong>and</strong> NBI + ICRF (Ptotal = 1.7 MW) heating cases, respectively.<br />
These values of Xi are almost the same as the neoclassical value near the<br />
centre (r/a :£ 0.2) <strong>and</strong> are two to five times as large as the neoclassical value at<br />
r/a « 0.5. The density fluctuation level increases with increasing auxiliary power.<br />
The magnitude of the ion mode is of the same order as the electron mode. The<br />
observed ion mode may well explain the anomaly of Xi, but it is necessary to collect<br />
a lot of detailed information on the local behaviour of various fluctuations such as<br />
plasma potential <strong>and</strong> magnetic fluctuations.<br />
2. PARTICLE TRANSPORT ANALYSIS WITH ICE PELLET INJECTION<br />
We have analysed particle transport with the injection of a small D2 pellet,<br />
which is introduced as a source of electron density perturbation. Figure 5 shows the<br />
time evolution of the density profile <strong>and</strong> the profile shape factor, k, defined by the<br />
(b)<br />
10<br />
0.1
292 KAWAHATA et al.<br />
0 6 12 18 24<br />
radius(cm)<br />
FIG. 5. Time evolution of density profile ne(r,t) with injection of a small pellet <strong>and</strong> profile shape factor,<br />
k, defined by ne = ne(O)(l-(r/af) k .<br />
fitting of the profile as n,.(r,t) = ne(0,t)(l-(r/a) 2 ) k(t) . We try to estimate the diffusion<br />
coefficient D <strong>and</strong> the inward velocity v in the following two ways: First, by comparing<br />
the profiles <strong>and</strong> k-values at two different times, t[ <strong>and</strong> t2, in Fig. 5, we estimate<br />
D <strong>and</strong> v roughly, assuming that D <strong>and</strong> v do not change during density relaxation.<br />
Secondly, we also estimate D <strong>and</strong> v by using a 1-D transport code, assuming<br />
D(r) = D(0)/(n(r)/n(0)) <strong>and</strong> v(r) = v(a)(r/a) p . Good agreement with the experimental<br />
data has been obtained for D(0) = 0.4 m 2 -s -1 , v(a) = 20 m-s" 1 <strong>and</strong> p = 2. The<br />
values D <strong>and</strong> v as calculated by the two methods agree with each other within a factor<br />
of two.<br />
REFERENCES<br />
[1] DUCHS, D.F., et al., in Plasma Physics <strong>and</strong> Controlled <strong>Nuclear</strong> Fusion Research 1986 (Proc.<br />
11th Int. Conf. Kyoto, 1986), Vol. 1, <strong>IAEA</strong>, Vienna (1987) 325.<br />
[2] TANG, W.M., et al., ibid., p. 337.<br />
[3] WALTZ, R.E., et al., ibid., p. 345.<br />
[4] BROWER, D.L., et al., Phys. Rev. Lett. 59 (1987) 48.<br />
[5] WATARI, T., et al., in Plasma Physics <strong>and</strong> Controlled <strong>Nuclear</strong> Fusion Research 1986 (Proc.<br />
11th Int. Conf. Kyoto, 1986), Vol. 1, <strong>IAEA</strong>, Vienna (1987) 495.<br />
[6] KADOMTSEV, B.B., POGUTSE, O.P., Rev. Plasma Phys. (Engl. Transl.) 5 (1970) 308.<br />
[7] CHANG, C.J., HINTON, F.L., Phys. Fluids 25 (1982) 1493.
TURBULENCE, TRANSPORT AND<br />
q MEASUREMENTS IN TEXT*<br />
<strong>IAEA</strong>-CN-50/A-V-3-2<br />
A.J. WOOTTON, M. AUSTIN 1 , R.D. BENGTSON,<br />
J.A. BOEDO, R.V. BRAVENEC, D.L. BROWER 2 , J. CHEN 3 ,<br />
G. CIMA 4 , K.A. CONNER 5 , T.P. CROWLEY 5 ,<br />
P.H. DIAMOND 6 , R. DURST, P.H. EDMONDS, S.P. FAN 3 ,<br />
J.C. FORSTER 5 , M.S. FOSTER, R.F. GANDY 1 , K.W. GENTLE,<br />
G.A. HALLOCK, R.L. HICKOK 5 , L.K. HUANG 7 ,<br />
W.C. JENNINGS 5 , J.Y. KIM, S. KIM 2 , H. LIN,<br />
N.C. LUHMANN, Jr. 2 , S.C. McCOOL, W.H. MINER,<br />
A. OUROUA, D.M. PATTERSON, W.A. PEEBLES 2 ,<br />
P.E. PHILLIPS, T.L. RHODES, B. RICHARDS, C.P. RITZ,<br />
D.W. ROSS, W.L. ROWAN, P.M. SCHOCH 6 , D. SING,<br />
E. SYNAKOWSKI, P.W. TERRY 8 , D. THOMAS 9 ,<br />
K. WENZEL 10 , W.P. WEST 9 , J.C. WILEY, D. WROBLEWSKI 7 ,<br />
X.Z. YANG 11 , X.H. YU 11 , Z. ZHANG 3<br />
Fusion Research Center,<br />
The University of Texas at Austin,<br />
Austin, Texas,<br />
United States of America<br />
Abstract<br />
TURBULENCE, TRANSPORT AND q MEASUREMENTS IN TEXT.<br />
The tokamak TEXT is used to investigate links between turbulence <strong>and</strong> transport, primarily with<br />
ohmically heated, edge fueled plasmas. The effects of low power (150 kW) electron cyclotron heating<br />
<strong>and</strong> solid hydrogen pellet fueling have also been investigated. Results concerning particle transport are<br />
summarized, <strong>and</strong> comparisons between the measured fluxes <strong>and</strong> those predicted to result from drift<br />
waves are made. Measurements of the plasma safety factor q are presented.<br />
* Work performed under grant DE-FG05-88ER53267 for the US Department of Energy.<br />
1 Aubum University, Auburn, AL 36849, USA.<br />
2 University of California, Los Angeles, CA 90024, USA.<br />
3 Institute of Plasma Physics, Hefei, China.<br />
4 Consiglio Nazionale delle Ricerche, Milan, Italy.<br />
5 Rensselaer Polytechnic Institute, Troy, NY 12181, USA.<br />
6 University of California, La Jolla, CA 92093, USA.<br />
7 Johns Hopkins University, Baltimore, MD 21218, USA.<br />
8 Institute for Fusion Studies, University of Texas, Austin, TX 78712, USA.<br />
9 General Atomics, San Diego, CA 92138, USA.<br />
10 Massachusetts Institute of Technology, Cambridge, MA 02139, USA.<br />
" Institute of Physics, Academy of Science, Beijing, China.<br />
293
294<br />
WOOTTON et al.<br />
1. Particle transport<br />
Previous measurements with Langmuir probes on TEXT have<br />
demonstrated the importance of electrostatic turbulence in determining the total<br />
particle transport at <strong>and</strong> behind the limiter [1,2]. The measurements of<br />
density (n) <strong>and</strong> potential ($) fluctuation levels <strong>and</strong> their correlations have now<br />
been extended to the plasma axis using the heavy ion beam probe (HIBP) [3].<br />
The range of HIBP measured frequencies <strong>and</strong> wave vectors is<br />
0
0.01<br />
<strong>IAEA</strong>-CN-50/A-V-3-2 295<br />
• D HIBP<br />
0.7 0.8 0.9 1.0 1.1 1.2<br />
FIG. 2. Radial dependence of total panicle flux T obtained from source measurements (HJ, <strong>and</strong> that<br />
driven by the measured electrostatic turbulence (T* £ ), obtained with the heavy ion beam probe (HIBP)<br />
<strong>and</strong> Langmuir probes (Lpr). Both measured (O) <strong>and</strong> interpreted (M) values ofke are used to calculate<br />
T fE with the HIBP data, fi^ = 2 T, Ip = 200kA,ne = 3 x 10' 9 m~ 3 , H*.<br />
poloidally oriented (kj_ * ke), an extrapolated value for kg is used. Figure 2<br />
shows the radial profiles of both H> E (assuming poloidal <strong>and</strong> toroidal<br />
symmetry) <strong>and</strong> the total particle flux T determined from measurements of the<br />
particle source (from Ha emission) [2]. The approximate agreement<br />
demonstrates the importance of the measured electrostatic turbulence in<br />
determining particle transport. Assuming $/(kTe) = n/n <strong>and</strong> an$ =90° would<br />
lead to incorrect values ^E<br />
A time dependent particle source has been used to determine the<br />
diffusion coefficient D <strong>and</strong> the convection velocity v, where T = -DVn-nv [5].<br />
This technique has now been extended to allow spatial resolution. Typical<br />
results are shown in Fig. 3, with both D (Fig. 3a) <strong>and</strong> v (Fig. 3b) normally<br />
increasing towards the plasma edge for sawtoothing discharges. Both D <strong>and</strong><br />
v decrease with increasing density. The neoclassical inward pinch velocity<br />
vnc < v for p > o.2: i.e., much less than the experimental value for most of<br />
the plasma volume. In the confinement region r^rf-^O (see Fig. 2), so the<br />
measured electrostatic turbulence must account for both, or neither, of the two<br />
terms DVn <strong>and</strong> nv.<br />
In non-sawtoothing discharges with high MHD activity (usually<br />
accredited to m=2 tearing modes) the central value of D is increased, <strong>and</strong> the<br />
edge value decreased. An interpretation is that a large central D steepens the<br />
edge gradients, <strong>and</strong> this drives the MHD instability. With electron cyclotron<br />
heating (60GHz, primary resonance, outside O mode launch), density<br />
depressions are found around the expected energy deposition location, <strong>and</strong><br />
there is a loss of global particle confinement. The results suggest a significant<br />
enhancement of the edge value of D. During pellet injection improved particle
296<br />
10'<br />
N 10°<br />
E<br />
gio- 1<br />
O<br />
(a)<br />
10"<br />
0.0 0.2 0.4 O.f<br />
P<br />
WOOTTON et al.<br />
O.I<br />
1<br />
o 1)<br />
100<br />
0.1<br />
1.0 0.0 0.2 0.4 0.C 0.8 t.O<br />
FIG. 3. Radial profiles of (a) panicle diffusion coefficient D <strong>and</strong> (b) convection velocity v, deduced<br />
from time dependent gas source experiments. Also shown are the expectations of the dissipative trapped<br />
electron drift wave turbulence model, D dw <strong>and</strong> v dw , using the measured values ofaln <strong>and</strong> ke (assuming<br />
unidirectional propagation), <strong>and</strong> the neoclassical pinch velocity v" c . B$ = 2 T, Ip = 200 kA,<br />
n, = 3 x 10' 9 m-\ H + .<br />
confinement is found, which can be explained by the cessation of sawteeth,<br />
<strong>and</strong> a scaling D <strong>and</strong> v a l/ne.<br />
Drift wave theories are often invoked to explain the anomalous<br />
electron energy transport in tokamaks. These same theories can be tested for<br />
their ability to predict both the microscopic turbulence characteristics, <strong>and</strong> the<br />
measured particle transport using measured fi/n <strong>and</strong> ke values in relevant<br />
formulae for D dw <strong>and</strong> v dw . On the microscopic level, the measured_n/n is<br />
consistent with mixing length estimates (see Fig. 1), but the measured keps =<br />
0.1 is smaller than expected for drift waves (keps=0.4). However, the<br />
interpretation of the experimental results could be affected by the presence of<br />
counter propagating turbulence [6]. The experimental phase velocity vph =<br />
3xl0 3 ms- 1 is in the expected electron diamagnetic drift direction for r < a, but<br />
is larger than expected for a drift wave in a frame rotating with the<br />
neoclassical poloidal velocity (giving vph~lxl0 3 ms- 1 ). On the macroscopic<br />
level, Fig. 3 shows the predicted diffusion <strong>and</strong> convection velocity for the<br />
dissipative trapped electron mode [7]: D dw « D <strong>and</strong> v dw is in the wrong<br />
direction (i.e., outward instead of inward). Inward convection is predicted<br />
for other drift waves (e.g., the universal mode), but these are predicted to be<br />
stable for the measured TEXT parameters. Thus current drift wave<br />
formalisms appear to be unsuitable c<strong>and</strong>idates to explain particle transport.
2.0<br />
1.8<br />
1.6<br />
1.4<br />
1.2<br />
CT 1.0<br />
0.8<br />
0.6<br />
0.4<br />
0.2<br />
<strong>IAEA</strong>-CN-50/A-V-3-2 297<br />
• Li Beam Polarization Data<br />
O Li Beam Fluorescent Data<br />
D Pellet Data<br />
0.0 0.1 0.2 0.3 0.4 0.5 0.6 0.7 0.8 0.9 1.0<br />
FIG. 4. Radial profiles of cylindrical safety factor q determined by three different diagnostics under<br />
different plasma conditions. The expectations ofSpitZer <strong>and</strong> neoclassical resistivity are shown for reference<br />
purposes. Li beam polarization: B+= 1.8 T, Ip = 300 kA, ne = 1.5 x JO 19 m' 3 , H*; U beam<br />
fluorescence: fi0 = 1.5 T, lp = 260 kA, ne = 0.94 X 10 19 m~ 3 , H + ; hydrogen pellet ablation:<br />
B
298 WOOTTON et al.<br />
ne=3xl0 19 m- 3 , assumes that the observed neutrals in the ablation cloud<br />
follows the field lines after ionization <strong>and</strong> subsequent recombination events,<br />
<strong>and</strong> has a time resolution =400|ls. The results were taken at 2.8 <strong>and</strong> 5.9<br />
radians into a sawtooth cycle, <strong>and</strong> show q(0)=0.3. For this discharge the<br />
expectations based upon resistivity, shown in Fig. 4, apply only in the central<br />
region, p < 0.5. For p > 0.5 the expected q is greater than shown. The low<br />
"measured" value suggests that the pellet cloud is not aligned with the<br />
equilibrium helical field; it has been suggested that the high local beta value in<br />
the cloud may explain this discrepancy. We conclude that q(0) can be < 1<br />
throughout a sawtooth cycle.<br />
REFERENCES<br />
[1] RITZ, C.P., et al., Nucl. Fusion 27 (1987) 1125.<br />
[2] ROWAN, W.L., et al., Nucl. Fusion 27 (1987) 1105.<br />
[3] HALLOCK, G.A., WOOTTON, A.J., HICKOCK, R.L., Phys. Rev. Lett. 59 (1987) 1301.<br />
[4] LIU, C.S., ROSENBLUTH, M.N., TANG, W.M., Phys. Fluids 19 (1976) 1040.<br />
[5] GENTLE, K.W., RICHARDS, B., WAELBROECK, F., Plasma Phys. Controll. Fusion 29<br />
(1987) 1077.<br />
[6] BROWER, D.L., et al., Phys. Rev. Lett. 59 (1987) 48.<br />
[7] WOOTTON, A.J., et al., Fluctuations <strong>and</strong> Anomalous Transport in Tokamaks, particularly<br />
TEXT, Rep. FRCR 310, University of Texas at Austin (1988).<br />
[8] WEST, W.P., THOMAS, D.M., DeGRASSIE, J.S., ZHENG, S.B., Phys. Rev. Lett. 58<br />
(1987) 2758.<br />
[9] WROBLEWSKI, D., MOOS, H.W., Rev. Sci. Instrum. 57 (1986) 2029.<br />
[10] DURST, R.D., PHILLIPS, P.E., ROWAN, W.L., q Profile Measurements in Tokamaks Using<br />
Fueling Pellets, Rep. FRCR 303, University of Texas at Austin (1988). Accepted for publication<br />
in Rev. Sci. Instrum.
<strong>IAEA</strong>-CN-50/A-V-3-3<br />
COMPARATIVE STUDY OF CENTRAL<br />
CONFINEMENT IN THE TJ-I TOKAMAK WITH<br />
TRANSPORT AT THE EDGE DUE TO<br />
ELECTROSTATIC FLUCTUATIONS<br />
B. ZURRO, C. HIDALGO, C. PARDO, M.A. PEDROSA,<br />
F. MOMPEAN, A.P. NAVARRO, TJ-I GROUP<br />
Asociacidn Euratom/CIEMAT,<br />
Madrid, Spain<br />
Abstract<br />
COMPARATIVE STUDY OF CENTRAL CONFINEMENT IN THE TJ-I TOKAMAK WITH<br />
TRANSPORT AT THE EDGE DUE TO ELECTROSTATIC FLUCTUATIONS.<br />
The confinement time of central ions measured by the laser ablation technique has been studied<br />
as a function of the toroidal field <strong>and</strong> has been correlated with the confinement time as deduced from<br />
fluctuation induced transport measured at the edge with probes. Although the confinement time has a<br />
quadratic dependence on the toroidal field <strong>and</strong> is linked with the ion energy confinement time — which<br />
can be interpreted within neoclassical theory — the confinement due to fluctuation shows a similar<br />
behaviour. These results are discussed.<br />
1. INTRODUCTION<br />
One of the key issues in tokamak plasma physics is an underst<strong>and</strong>ing of the basic<br />
mechanisms causing the experimentally observed anomalous energy transport. To<br />
solve this problem, great effort is directed towards an elucidation of whether this<br />
anomaly is accounted for by an enhanced particle transport <strong>and</strong> whether this enhancement<br />
is explained solely by fluctuations [1].<br />
To shed some light on this problem, two types of studies are being carried out<br />
on the TJ-I tokamak. On the one h<strong>and</strong>, the central confinement of particles has been<br />
measured by the laser ablation technique <strong>and</strong> has been compared with the central<br />
energy confinement time (electrons <strong>and</strong> ions). On the other h<strong>and</strong>, the transport at the<br />
edge due to electrostatic fluctuations has been measured by Langmuir probes to infer<br />
whether particle losses resulting from electrostatic fluctuations show a trend similar<br />
to the central confinement properties.<br />
2. EXPERIMENTAL SET-UP<br />
The TJ-I tokamak (RQ = 30 cm, a = 10 cm) was operated for this experiment<br />
at a plasma current of 40 kA, a plasma density of about 2 x 10 13 cm" 3 ; the toroidal<br />
field was scanned between 0.8 <strong>and</strong> 1.5 T.<br />
299
300 ZURRO et al.<br />
FIG. 1. Variation of ion confinement time with toroidal field for constant line averaged<br />
density of (2-3) x 1& S cm' 3 .<br />
The laser ablation technique was used to inject silicon <strong>and</strong> iron into ohmically<br />
heated TJ-I discharges. Particles were injected into the plasma once the plasma<br />
reached its plateau value. The time behaviour of the injected iron in the hot plasma<br />
core was monitored by a pyroelectric detector <strong>and</strong> a vacuum ultraviolet monochromator,<br />
both collimated along the central plasma chord. The decay time of the perturbations<br />
in the signature of both detectors was used to deduce the impurity confinement<br />
time. To determine the ion energy confinement time, the central ion temperature was<br />
measured by a charge exchange analyser <strong>and</strong> by Doppler broadening of lines belonging<br />
to the central impurity ions. Thomson scattering profiles were used to determine<br />
the electron energy confinement times.<br />
A square array of four single Langmuir probes (3x3 mm), placed 4 cm above<br />
the equatorial plane on the outer side of the torus, was used to measure density <strong>and</strong><br />
potential fluctuations at the limiter radius. In the TJ-I tokamak, the vacuum chamber<br />
plays the role of a belt limiter. Two adjacent probes were used to measure density<br />
fluctuations, being biased in the ion saturation current range. The other pair oriented<br />
along the poloidal angle was unbiased <strong>and</strong> was used to monitor potential fluctuations.<br />
The electronic system used has a 300 kHz b<strong>and</strong>width. Data acquisition was accomplished<br />
by using a four channel camac module with an 8 kb memory per channel.<br />
Data were digitized at a 500 kHz sampling rate. Conventional FFT was used for data<br />
analysis.
<strong>IAEA</strong>-CN-50/A-V-3-3 301<br />
TABLE I. COMPARISON OF TJ-I EXPERIMENTAL CONFINEMENT TIMES VERSUS<br />
ALCATOR SCALING AND ROZHANSKITS THEORY RESULTS<br />
BT(T)<br />
1.5<br />
1.0<br />
0.8<br />
Ip(kA)<br />
46<br />
35<br />
37<br />
3. RESULTS OBTAINED<br />
4.9<br />
4.4<br />
3.2<br />
3.0 ± 0.5<br />
1.2 ± 0.1<br />
0.9 ± 0.1<br />
3.1. Central particle confinement measured by laser ablation<br />
The dependence of the central particle confinement time has been measured as<br />
a function of the toroidal magnetic field for discrete values from 0.8 to 1.5 T, at a<br />
fixed line average electron density of (2-3) x 10 13 cnr 3 . Figure 1 shows the results<br />
obtained, the dashed line corresponding to a parabolic dependence. The observed<br />
increase in confinement time is well predicted by the theory of Rozhanskii [2]<br />
(Table I), contrasting with the results obtained at higher toroidal fields in other tokamaks<br />
[3], where the confinement time decreases as the field increases.<br />
We have performed a simple experiment to discover whether the confinement<br />
time of the background particles follows the same trend as the injected impurities in<br />
a toroidal field scan. We kept constant the gas puffing injection rate as we varied B,,<br />
<strong>and</strong> measured the electron density at the current top in the central plasma region by<br />
Thomson scattering. The rise in density with toroidal field in these conditions is similar<br />
to the rise in TX (Fig. 2), measured in the laser ablation experiment. A similar<br />
rise is observed in radiated power measured by pyroelectric detectors. This discharge<br />
behaviour confirms the improvement in confinement with toroidal field for both<br />
background particles <strong>and</strong> injected impurities in the TJ-I tokamak for the toroidal field<br />
ranging from 0.8 to 1.5 T.<br />
In Table II, the measured particle confinement times are compared with energy<br />
confinement times at two values of the toroidal field. The latter were deduced by performing<br />
a simplified power balance within the plasma half-radius, by using a onedimensional<br />
static transport code. As is easy to see, the particle confinement time<br />
seems to be linked to the ion energy confinement time <strong>and</strong> does not correlate with<br />
electron thermal losses.<br />
3.2. Global confinement deduced from fluctuation<br />
The wavenumber/frequency spectra have been estimated for density <strong>and</strong> potential<br />
fluctuations [4]. The integrated spectra S(kp) <strong>and</strong> S(w) are shown in Fig. 3. The<br />
TROZ<br />
2.0<br />
1.2<br />
0.8<br />
TALC<br />
3.7<br />
5.7<br />
4.1
302 ZURRO et al.<br />
Mo)<br />
6 (10"cm- 3 )<br />
FIG. 2. Change of central density <strong>and</strong> central chord radiated power with toroidal field, on keeping<br />
the gas injection rate constant.<br />
TABLE II. COMPARISON BETWEEN PARTICLE AND ENERGY CONFINEMENT<br />
TIMES IN TJ-I<br />
Tokamak<br />
TM (1 T)<br />
TJ-I (1.5 T)<br />
(ms)<br />
1.2<br />
3.0<br />
(ms)<br />
2<br />
4<br />
broadb<strong>and</strong> turbulence lies mainly below 100 kHz, the k-spectrum peaks at<br />
kp « 2 cm" 1 . The turbulence propagates in the electron diamagnetic direction with<br />
a phase velocity of about 10 5 cm-s" 1 .<br />
We have estimated the flux T(w) of particles driven by electrostatic turbulence<br />
by correlating the density (n) <strong>and</strong> potential ($) fluctuations. In a frequency b<strong>and</strong> Aw,<br />
this radial flux is given by [5]<br />
sin<br />
(ms)<br />
0.8<br />
0.42<br />
TE<br />
(ms)<br />
0.7<br />
0.36<br />
(ms)<br />
1.3<br />
3.1
<strong>IAEA</strong>-CN-50/A-V-3-3 303<br />
85 13S 185 235 2 4 6 8 10<br />
k(cm-1)<br />
FIG. 3. Integrated spectra S(f) <strong>and</strong> S(kp) of (a) density <strong>and</strong> (b) potential fluctuations.<br />
where kp(o>) is the poloidal wavenumber, yn$ is the coherence between density <strong>and</strong><br />
potential fluctuations, ani is the phase difference between them <strong>and</strong> nms <strong>and</strong> $„,,, are<br />
their root mean square (rms) values. Figure 4 shows the coherence, the phase angle<br />
<strong>and</strong> the spectrally resolved particle flux.<br />
The total particle fluxes leaving the plasma because of the turbulence,<br />
T = Er(w), were estimated at 1 <strong>and</strong> 1.5 T to be 3 x 10 ls <strong>and</strong> 2 X 10 16 cm^-s" 1 ,<br />
respectively. On the assumption of poloidal <strong>and</strong> toroidal symmetry in the fluctuations,<br />
a global particle confinement time can be determined from Tpf ~ n
304 ZURRO et al.<br />
-140<br />
50 100<br />
f(kHz)<br />
SO 100<br />
f (kHz)<br />
FIG. 4. (a) Coherence <strong>and</strong> (b) phase angle between density <strong>and</strong> potential fluctuations; (c) spectrally<br />
resolved flux.<br />
confinement time measured by the laser ablation technique can be considered<br />
representative of the central particle confinement time in TJ-I. Its empirical variation<br />
with toroidal field, which shows a unique behaviour in TJ-I plasmas, correlates<br />
reasonably well with the global confinement time deduced from the particle flux<br />
driven by electrostatic fluctuations at the edge.<br />
The main uncertainties in this comparison stem from the following points:<br />
First, the global particle confinement time, with which the fluctuation deduced confinement<br />
time should be compared, could be a factor one to three smaller than the<br />
central value [6, 7] since the particles are better confined at the centre than at the<br />
edge. Second, the measurements of fluctuation induced transport were made only at<br />
150<br />
150
<strong>IAEA</strong>-CN-50/A-V-3-3 305<br />
the outer edge of the torus, <strong>and</strong> they could depend on the poloidal position. In spite<br />
of these weak points, the comparison of the trend of both confinement times due to<br />
the aforementioned TJ-I unique behaviour can shed some light on the relationship<br />
between particle transport <strong>and</strong> fluctuations in tokamaks.<br />
REFERENCES<br />
[1] LIEWER, P.C., Nucl. Fusion 25 (1985) 543.<br />
[2] ROZHANSKII, V.A., Sov. J. Plasma Phys. 6 (1980) 465.<br />
[3] MARMAR, E.S., RICE, J.E., TERRY, J.L., SEGUIN, F.H., Nucl. Fusion 22 (1982) 1567.<br />
[4] LEVINSON, S.J., BEALL, J.M., POWERS, E.J., BENGTSON, R.D., Nucl. Fusion 24 (1984)<br />
527.<br />
[5] POWERS, E.J., Nucl. Fusion 14 (1974) 749.<br />
[6] YAMAUCHI, T., NAGAMI, M., SENGOKU, S., Jpn. J. Appl. Phys. 9 (1980) 1737.<br />
[7] VLASES, G., BUCHL, K., CAMPBELL, D., in Controlled Fusion <strong>and</strong> Plasma Physics (Proc.<br />
11th Eur. Conf. Aachen, 1983), Vol. 7D, Part I, European Physical Society (1983) 127.
TRANSPORT STUDIES ON TFTR<br />
UTILIZING PERTURBATION TECHNIQUES<br />
<strong>IAEA</strong>-CN-50/A-V-4<br />
P.C. EFTHIMION, M. BITTER, E.D. FREDRICKSON,<br />
R.J. GOLDSTON, G.W. HAMMETT, K.W. HILL, H. HSUAN,<br />
R.A. HULSE, R. KAITA, D.K. MANSFIELD, D.C. McCUNE,<br />
K.M. McGUIRE, S.S. MEDLEY, D. MUELLER, A.T. RAMSEY,<br />
S.D. SCOTT, B.C. STRATTON, K.-L. WONG, TFTR GROUP,<br />
H. BIGLARI 1 , P.H. DIAMOND 1 , Y. TAKASE 2 , V.A. VERSHKOV 3<br />
Plasma Physics Laboratory,<br />
Princeton University,<br />
Princeton, New Jersey,<br />
United States of America<br />
Abstract<br />
TRANSPORT STUDIES ON TFTR UTILIZING PERTURBATION TECHNIQUES.<br />
A variety of perturbation experiments have been conducted on TFTR to study plasma transport:<br />
gas puffing to study electron particle transport, impurity injection to measure impurity transport, <strong>and</strong><br />
low power edge NBI to study fast ion radial transport. These diverse experiments provide quantitative<br />
measurements of the transport coefficients which indicate that the electron <strong>and</strong> impurity diffusion coefficients,<br />
<strong>and</strong> ion <strong>and</strong> electron thermal diffusivities, are of similar magnitudes (~1 m 2 /s). However,<br />
radial diffusion of circulating ions is considerably smaller (D < 0.05 m 2 /s). Analysis using a test particle<br />
model of transport shows that the parallel velocity necessary for good confinement of supra-thermal<br />
particles is linked to the correlation length of fluctuations which cause the turbulent transport. Thus<br />
cross-field transport can be explained by small scale fluctuations.<br />
1.0 INTRODUCTION<br />
The st<strong>and</strong>ard technique for ascertaining the transport coefficients of<br />
tokamak plasmas has been to measure the input quantities to the heat or<br />
particle balance equations [e.g., Te(r,t), ne(r,t), Prad(r,t), Zgff(r,t), <strong>and</strong><br />
sometimes T|(r,t)] during the equilibrium phase of the discharge, calculate<br />
sources of heat <strong>and</strong> particles, <strong>and</strong> consequently determine the transport<br />
coefficients. This methodology cannot determine uniquely whether the net<br />
outward transport consists of both inward <strong>and</strong> outward components, <strong>and</strong><br />
thus what fraction of the transport is diffusive <strong>and</strong> what fraction convective.<br />
1 University of California at San Diego, San Diego, CA, USA.<br />
2 Plasma Fusion Center, Massachusetts Institute of Technology, Cambridge, MA, USA.<br />
3 I.V. Kurchatov Institute of Atomic Energy, Moscow, USSR.<br />
307
308 EFTHIMION et al.<br />
Perturbation techniques involve applying a small impulse of energy or<br />
particles to a plasma in equilibrium. Gradients of the density <strong>and</strong><br />
temperature along the profiles are perturbed in a controlled manner, <strong>and</strong> can<br />
be correlated with the local transport. A variety of such experiments have<br />
been eonducted on TFTR to examine various aspects of plasma transport: (i)<br />
gas puffing to study electron particle transport; (ii) impurity injection to<br />
investigate impurity transport; <strong>and</strong> (iii) low power neutral beam injection at<br />
the plasma edge to measure fast ion radial diffusion. This paper will describe<br />
the results of these experiments.<br />
2.0 GAS PUFFING TO STUDY PARTICLE TRANSPORT<br />
The particle transport studies involve puffing a small amount of gas<br />
(1.33 Pa-m for 0.05 s) <strong>and</strong> then observing the time evolution of the density<br />
profile with a ten channel far-infrared interferometer. The size of the<br />
perturbation is kept small (An/n ~ 5%) in an attempt not to disturb the plasma<br />
equilibrium. The data from seven to ten reproducible plasma discharges are<br />
averaged to obtain a good signal-to-noise ratio. The large inner-wall graphite<br />
limiter is conditioned with many helium discharges to reduce the residual<br />
levels of deuterium <strong>and</strong> hydrogen in the graphite, thereby lowering the<br />
effective particle recycling coefficient <strong>and</strong> permitting rapid density pumpout.<br />
In most of the experiments deuterium is puffed into helium plasmas in<br />
order to maintain the limiter condition for subsequent experiments.<br />
Two analysis techniques are used to obtain the transport coefficients<br />
from the particle balance equation:<br />
3ne(r,t)/9t = -1/r 9/3r [rr(r,t)] + S(r,t), (1)<br />
where S is the particle source term, F(r,t) is the particle flux with the<br />
assumed form (neV - DBng/Br), where V is the velocity pinch, <strong>and</strong> D is the<br />
particle diffusivity. The MIST code [1] is used to model the inward density<br />
wave assuming values of D, <strong>and</strong> taking the ratio of D/V to be consistent with<br />
the shape of the equilibrium profile. The second technique emphasized here
<strong>IAEA</strong>-CN-50/A-V-4 309<br />
uses the TRANSP code [2] to calculate the particle flux, F, as a function of<br />
time <strong>and</strong> position by solving Eq. (1) using the measured time-dependent<br />
density profile <strong>and</strong> an empirical model for the source function. Then using<br />
data during the time the density wave propagates across the plasma, a linear<br />
multiple regression of I7n = a + (p/nj (3nJdi) determines the transport<br />
coefficient D <strong>and</strong> V at each radial position. This technique assumes that the<br />
transport coefficients obtained are not a function of the size of the gas puff<br />
itself. When compared, the two analysis techniques yield comparable<br />
deduced transport coefficients.<br />
Previous results [3] for a low density ohmic discharge indicated<br />
that the radial diffusion is a minimum in the plasma core <strong>and</strong> rises to a<br />
maximum in the periphery. The inward velocity has a similar shape to D,<br />
<strong>and</strong> has values substantially greater than neoclassical. Recently four different<br />
helium plasma conditions were examined with the density n l<br />
e<br />
= 1.6 x 10<br />
<strong>and</strong> 3.1 x 10 V , <strong>and</strong> plasma current 1= 0.8 <strong>and</strong> 1.4 MA. At ng =<br />
1.6 x 10 m' D with either current, the plasma global energy confinement<br />
1Q O<br />
time is in the linear regime. Forne = 3.1 x 10 m, the confinement<br />
at 0.8 MA is in the saturated confinement regime while at 1.4 MA the<br />
confinement is near the knee of the curve. In each case a small deuterium<br />
puff of 1.33 Pa-rrr for 0.05 s was injected into an equilibrated helium plasma.<br />
Figure 1 is a plot of the particle diffusivities obtained for these four ohmic<br />
cases. The open <strong>and</strong> closed circles represent the high density cases; there is<br />
no sign of a current dependence. The low density points (open <strong>and</strong> closed<br />
triangles) also have no clear current dependence, but their values are<br />
systematically higher than the high density points. When averaged over the<br />
plasma radius the particle diffusivity for this case is a factor of two greater<br />
than the high density cases, <strong>and</strong> thus the profile-averaged diffusivity is<br />
roughly proportional to l/ne. All four conditions exhibit a radial dependence<br />
that has a minimum at the plasma core <strong>and</strong> a maximum near the edge. The<br />
profiles of the particle diffusivity De(r), <strong>and</strong> the equilibrium thermal<br />
diffusivity X~(r), have the same shapes <strong>and</strong> their absolute values agree within<br />
a factor of two across the full profile for the four plasma conditions<br />
considered. Previous studies of particle transport using gas puffs on other
310 EFTHIMION et al.<br />
4.0<br />
2.0 -<br />
><br />
1.0 -<br />
u.<br />
-<br />
Q<br />
UJ<br />
O 0.5 -<br />
h-<br />
<<br />
a.<br />
O<br />
cc<br />
I-<br />
UJ u *
5<br />
g<br />
30<br />
20<br />
< 2.0<br />
Q<br />
§ 1.0<br />
i<br />
0.5<br />
10 1—-<br />
— o<br />
0.2 -<br />
0.1<br />
—<br />
—<br />
—<br />
J_L<br />
1<br />
A<br />
<strong>IAEA</strong>-CN-50/A-V-4 311<br />
1 1<br />
na=3.1x10 l9 nri 3 , iP= 1.4 MA<br />
ne=3.1xi0 19 m' 3 . lp= 0.8 MA<br />
ne-1.6x10 l9 m 3<br />
Re= 1.6x1o'V 3<br />
A<br />
A<br />
O O<br />
"T<br />
.Ip-<br />
• ' P -<br />
1 I I<br />
1<br />
0 0.1 0.2 0.3 0.4 0.5 0.6 0.7<br />
MINOH RADIUS (m)<br />
&<br />
o<br />
JL<br />
1.4 MA<br />
0.8 MA<br />
FIG. 2. Inward pinch velocity as a function of radius for the four plasma conditions in Fig. 1.<br />
convective flux terms ascertained in the analysis. The analysis has been<br />
redone with no source term <strong>and</strong> the transport coefficients changed by only<br />
10-15% for the low density case at r > 0.5 m. The error bars associated with<br />
the transport coefficients in the two figures are on the order of +/- 50% at all<br />
radial positions, <strong>and</strong> reflect the uncertainty in determining the density gradient<br />
at any position.<br />
Good regression fits at all radii to the flux model were not always<br />
possible, especially at radii r < 0.15 m, where the integrated flux is low <strong>and</strong><br />
sawtooth mixing occurs. The best of those poor fits indicates that the<br />
transport coefficients are lower than or equal to those at r = 0.2 m. Systematic<br />
studies are now underway to investigate the sensitivity of the transport<br />
coefficients to the size of the gas puff. For variations in the density<br />
perturbations on the order of An / n < 10%, there is no noticeable variation in<br />
the transport coefficients. However, in a recent case where the density<br />
increase was 100%, the simple flux model does not give good fits. The<br />
o<br />
1<br />
A<br />
a. °<br />
A<br />
-<br />
-<br />
A
312 EFTHIMION et al.<br />
diffusivity obtained from those fits is nearly constant with a value of De = 2<br />
m 2 /s for 0.4 < r < 0.7 m, <strong>and</strong> drops down to De = 0.3 - 0.4 m 2 /s in the<br />
plasma core. Note that De can depend on VTe, VT^, <strong>and</strong> Vne. Further<br />
studies will focus upon possible nonlinearities in the particle flux (e.g., due to<br />
gradient-driven transport).<br />
The electron <strong>and</strong> ion temperature during the gas puff were measured<br />
with an ECE radiometer, <strong>and</strong> a three radial channel X-ray crystal<br />
spectrometer, respectively. The central electron temperature initially rises <strong>and</strong><br />
then falls in response to the puff. The central ion temperature falls, as has<br />
been previously reported [5]. For this case, the electron temperature is<br />
3.5 keV, the ion temperature is at least 1 keV lower, <strong>and</strong> the equilibrium<br />
line average density is ne = 1.2 x 10 m . The TRANSP analysis code<br />
was used to calculate the time evolution of the central ion temperature for the<br />
case of neoclassical ion transport [8], <strong>and</strong> ion convective thermal transport of<br />
the form 5/2 n V T|. The code predicts that the ion temperature should<br />
increase because the additional density increases the plasma collisionality<br />
improving the electron-ion coupling, <strong>and</strong> there is also a significant inward<br />
convective heat flow. The drop in ion temperature occurs at all three<br />
positions as measured by the crystal spectrometer. The ion temperature drop<br />
can be simulated using an T]^ model [9] with a cubic turn-on as a function of<br />
the local Tjj parameter, along with neoclassical ion transport, <strong>and</strong> the<br />
5/2n ITj convection model. A value of ricrit = 1.8-2.5 is sufficient to match<br />
either the neutron flux, or the central ion temperature before the insertion of<br />
the gas puff, as well as the observed drops in ion temperature <strong>and</strong> neutron<br />
flux. The calculation shows that the gas puff changes the local gradients, the<br />
enhanced gradient-driven transport increases, <strong>and</strong> the ion temperature drops<br />
during the time of the density perturbation. However, reducing the non-<br />
convective term in the ion power balance to 3/2 also has the effect of<br />
reducing the ion temperature during the gas puff.<br />
3.0 IMPURITY INJECTION TO MEASURE IMPURITY TRANSPORT<br />
Impurity transport coefficients are deduced from modeling the time<br />
evolution of different ionization states of an impurity that is injected using
<strong>IAEA</strong>-CN-50/A-V-4 313<br />
the laser-blowoff technique [10]. The impurity line brightnesses as a<br />
function of time are simulated with the one-dimensional radial impurity<br />
transport code, MIST, which solves the impurity continuity equations:<br />
3/3t nq = - 1/r d/dr (r r ) + Iq_j n^ - (Iq + Rq )nq + Rq+1 nq+1<br />
, + Sn<br />
where n is the impurity density in ionization state q, F is the impurity flux<br />
density, <strong>and</strong> I <strong>and</strong> R are ionization <strong>and</strong> recombination rates, respectively.<br />
S_ is the impurity source which is assumed to be an instantaneous burst of<br />
monoenergetic impurity atoms at 3 eV. x is the confinement time for parallel<br />
flow to the limiter in the scrape-off region <strong>and</strong> is parameterized as X /D,<br />
where X is a scale length of the scrape-off region, <strong>and</strong> D is the impurity<br />
diffusivity. The definition of F is the same as used in the gas puff<br />
experiments, with the additional assumption that V/D is equal to<br />
cv3ln(ne)/dr, where cy is a peaking parameter which relates the impurity V/D<br />
to the electron density profile scale lengths. In equilibrium, the total impurity<br />
density profile would have the shape of the electron density to the power of<br />
c . For these simulations D is assumed to be constant across the minor<br />
radius, <strong>and</strong> both D <strong>and</strong> V are assumed to be independent of q.<br />
This discussion will focus upon experiments where the brightness<br />
<strong>and</strong> time evolution of lines emitted by edge (Ge , <strong>and</strong> Ge ), <strong>and</strong> central<br />
(Ge ) states were measured in a series of ohmically heated plasmas. A<br />
detailed study [11] of the sensitivity of the modeling to the ionization <strong>and</strong><br />
recombination rates <strong>and</strong> transport shows that the time evolution of the lines<br />
emitted by central states is determined primarily by transport effects, while<br />
those of the edge states are determined by ionization, recombination, <strong>and</strong><br />
transport. As a result, it is not possible to uniquely deduce the spatial<br />
dependence of D <strong>and</strong> V from these data alone, <strong>and</strong> D <strong>and</strong> V are<br />
parameterized as described above.<br />
Impurity transport was studied in ohmically heated deuterium <strong>and</strong><br />
helium plasmas with L = 0.8-2.5 MA <strong>and</strong> ne = 0.6-6.0 x 10 19 m' 3 .<br />
Impurity diffusion coefficients are found to be in the range of 0.5-1.5 m /s,<br />
(2)
314 EFTHIMION et al.<br />
1.5 - 0<br />
I.O-<br />
0.5,<br />
-<br />
-<br />
1 1<br />
1<br />
1<br />
O A<br />
a<br />
•<br />
1<br />
1<br />
1 1<br />
•<br />
1 1<br />
D<br />
o<br />
•<br />
1<br />
H«<br />
•<br />
*<br />
Ip3xl0 m are near the plasma density limit. Thus<br />
there is a correlation between the density <strong>and</strong> the diffusivity. As shown in<br />
Fig. 3, there is no correlation between density <strong>and</strong> the diffusivity for ng <<br />
3 x 10 y m . Note that the lack of dependence of the diffusion coefficient<br />
•<br />
-<br />
-
<strong>IAEA</strong>-CN-S0/A-V-4 315<br />
on working gas <strong>and</strong> L <strong>and</strong> the observed ne dependence is similar to that seen<br />
for electron transport as described in the previous section.<br />
4.0 MEASUREMENT OF ENERGETIC ION DIFFUSION<br />
In most circumstances reactor-like plasmas are produced <strong>and</strong><br />
maintained by energetic ion heating. Underst<strong>and</strong>ing the heating efficiency<br />
involves the issue of energetic ion transport. Anomalous radial diffusion of<br />
the fast ions could result in enhanced fast ion loss <strong>and</strong> a degradation in<br />
heating efficiency. Although neutral beam heating of plasmas has been<br />
studied in many experiments during the past 15 years, there have been no<br />
direct measurements of the local energetic ion transport in these plasmas. By<br />
injecting a neutral beam source with a tangency radius of Rt = 2.84 m<br />
(Fig. 4) into a plasma with RQ = 2.35 m, energetic ions are deposited in the<br />
outer half of the TFTR plasma (r/a > 0.5). This configuration creates an<br />
annulus of energetic ions in the outer region of the plasma. The radial<br />
inward diffusion of these ions is determined with neutral particle analyzers<br />
that measure the fast ion distribution as a function of energy across the<br />
midplane of the plasma, especially focusing on the inner edge of the fast<br />
ion annulus at R ~ 2.1 m.<br />
A neutral beam source with P^ = 2.0 MW <strong>and</strong> E^ = 95 keV was<br />
injected for 0.5 s, <strong>and</strong> produced an increase in the line average density from<br />
n_ = 1.19 x 10 19 to 1.35 x 10 9 m , <strong>and</strong> an increase in central ion<br />
temperature from 3.0 to 4.5 keV [12]. At the inner radius of injection, the<br />
beam ions slowed down predominantly on the electrons between 95 <strong>and</strong><br />
47.5 keV, in approximately 75 ms.<br />
The measurement of the charge-exchange (ex) neutral particle flux as<br />
a function of sightline tangency radius for 95 <strong>and</strong> 56 keV is shown in Fig. 5.<br />
The signals are normalized to the H intensity in order to compensate for<br />
variations in neutral density in comparing plasma discharges. In the<br />
region of 1.9 < Rt < 2.2 m, the gradient of the ex flux near the injection<br />
energy is largely determined by the beam deposition profile, although energy<br />
diffusion would permit significant broadening into the core region if radial<br />
diffusion were present. At the lower energy, radial diffusion would move
316 EFTHIMION et al.<br />
CX Sightlines<br />
Steep Edge in<br />
CX Signal<br />
0.2 0.4 0.6<br />
MINOR RADIUS CnO<br />
FIG. 4. Plan view of edge heating experiment. In addition, measured profiles of electron temperature<br />
<strong>and</strong> density, ion temperature profile <strong>and</strong> central ion temperature, <strong>and</strong> the calculated profile power deposition<br />
to electrons <strong>and</strong> ions are shown.<br />
the slowing down ions into the hollow core (i.e., to larger major radius) <strong>and</strong><br />
would strongly flatten the observed radial gradient for E > Ejj/2. The<br />
observed fast ion gradient is nearly the same at the two energies, confirming<br />
that the transport is small. These measurements are compared with a Fokker-<br />
Planck code [13] simulation of the spectra assuming different values of fast<br />
ion diffusion. The code solves the st<strong>and</strong>ard Fokker-Planck equation in<br />
0.8
I0 7 !<br />
10'<br />
1.8<br />
<strong>IAEA</strong>-CN-50/A-V-4 317<br />
Energy=95 ( a ) :<br />
D = 0.5 m Is -<br />
2.3<br />
1 1 1<br />
Energy -56 ( b )<br />
0.25<br />
2.4<br />
D = 0.5 nT/s<br />
2,. "=<br />
2.2 2.3 2.4<br />
FIG. 5. Measured ex count rate, normalized to Ha emission intensity near the inner fast ion edge. For<br />
both data <strong>and</strong> simulations, the contribution to the signal from pitch-angle scattered ions from<br />
R > 2.4 m has been subtracted. The data <strong>and</strong> all simulations have been normalized to equality at<br />
R, = 2.05 m.<br />
toroidal geometry including a new term to represent radial diffusion. The<br />
code simulations confirm that the radial variation of neutral flux as a function<br />
of energy is consistent with a very small amount of radial ion diffusion<br />
(D < 0.05 m 2 /s). In comparison, the calculated equilibrium ion thermal <strong>and</strong><br />
momentum diffusivities at r = 0.35 m are %j = 0.7 irr /s, <strong>and</strong> % = 0.7 m /s.
318 EFTHEVHON et al.<br />
In the core region of this discharge, r ~ 0.25m, x <strong>and</strong> & fall t0<br />
9 Y<br />
~ 0.2 m /s. By contrast, with central heating in this discharge we find % ~<br />
9 T<br />
Xj ~ 1 m /s. This result suggests that there is a strong response in the ion<br />
channel to changes in the heating profile shape.<br />
5.0 DISCUSSION<br />
All of the perturbation experiments provide some quantitative<br />
information about plasma transport. In the case of electron particle transport,<br />
the transport coefficients have well-defined profile shapes with minimum<br />
values in the plasma core <strong>and</strong> maxima near the edge. The inward pinch is<br />
highly anomalous in the outer half of the plasma. The profile of De(r) has the<br />
same shape as the equilibrium %e(r) profile, with the absolute values<br />
agreeing within a factor of two. There is no current dependence in the data,<br />
<strong>and</strong> when the transport is averaged across the plasma radius there is a l/ng<br />
dependence. This density dependence, <strong>and</strong> %e ~ De suggests that the heat<br />
<strong>and</strong> particle transport is due to electrostatic fluctuations with dissipative<br />
susceptibilities (i.e., dissipative trapped electron modes or Tjj-modes with<br />
dissipative trapped electron coupling). However, there is no mass<br />
dependence in the transport coefficients. This is in contradiction to the<br />
predictions of drift <strong>and</strong> Th-mode theory where for the case of dissipative<br />
trapped electron susceptibility %& scale as q , where q is the ion charge, <strong>and</strong><br />
is independent of mass. It should be mentioned that edge processes <strong>and</strong> their<br />
effect on profiles can influence the isotope scaling. A comparison with the<br />
impurity transport results reveals several similarities. The particle<br />
diffusivities <strong>and</strong> convective velocities of the electrons <strong>and</strong> impurities are very<br />
similar. The impurity transport also has no current dependence, has a<br />
tendency towards inverse density dependence, <strong>and</strong> has no dependence on<br />
the working gas. In the case of the impurity transport experiment, the<br />
particle diffusivity is significantly higher than that predicted by neoclassical<br />
theory. The edge heating experiments yield fast ion particle diffusivity<br />
substantially smaller (D < 0.05 m /s) <strong>and</strong> interesting trends in the ion<br />
thermal <strong>and</strong> momentum diffusivity, suggesting a strong direct or indirect<br />
response in the ion channel to heating profile shape.
<strong>IAEA</strong>-CN-50/A-V-4 319<br />
The difference between thermal <strong>and</strong> fast ion transport can be<br />
resolved by noting that the magnetic drift-induced excursion of fast ions off<br />
of magnetic flux surfaces tends to reduce test particle diffusion by shifting<br />
resonances through a spectrum correlation length. Such a reduction is<br />
consistent with the observed ratio of fast to thermal ion diffusivities.<br />
Consider a model of circulating ion transport due to saturated<br />
rjj-modes. This model is easily generalized to other electrostatic<br />
microinstabilities. The test particle diffusion coefficient is<br />
D = 11 Vrk I 2 re [1/(0^ - k,,V|| + 0)^ + 1 Aco^], (3)<br />
where Vr is the fluctuating E x BQ drift, k <strong>and</strong> co^. are the mode wave vector<br />
<strong>and</strong> frequency, COJJ is the ion magnetic drift frequency, <strong>and</strong> Aco^ is the<br />
turbulence induced frequency line-width. This expression can be evaluated<br />
for both thermal <strong>and</strong> fast particles to obtain an expression for the ratio of the<br />
fast to thermal particle transport:<br />
R) (PTi/V < ViWl<br />
Here p, V|| refer to the fast ion gyroradius <strong>and</strong> parallel velocity, S is the<br />
spatial form-factor of the turbulent spectrum, <strong>and</strong> Am is the radial correlation<br />
length of the fluctuation. Typically, S ~ exp(-x 2 /Am 2 ), while Lg ~ R <strong>and</strong><br />
pTi < Am. Hence, S ~ exp (-V| 2 /Vth 2 ) for V(( » Vth. Thus fast ion<br />
transport due to localized microturbulence is small.<br />
It is clear that particles with VJI/V^ > (A^p,^) (^<br />
are wel1<br />
confined, where s is the shear parameter. The fact that the parallel velocity<br />
needed for good confinement is linked to the correlation length is a<br />
consequence of the fact that the fluctuations are localized. The good<br />
confinement of fast particles supports the notion that electrostatic fluctuations<br />
which cause transport are of small scale. Indeed, only for Am » p-pj. <strong>and</strong><br />
pTiV ,,/Vfh ~ A^, can Dp ~ D(n. Thus the good confinement is consistent<br />
with electrostatic turbulence induced transport due to localized fluctuations.
320 EFTHIMION et al.<br />
This explanation is similar to the one used to explain good runaway electron<br />
confinement [14,15]. Note also that one could infer the correlation lengths of<br />
electrostatic <strong>and</strong> magnetic fluctuations by the simultaneous measurement of<br />
fast ion <strong>and</strong> runaway electron confinement. A similar calculation for<br />
energetic trapped ions (Hot) indicates that DH/Dth ~ (Aco^a)^) (A^p^)<br />
« 1, so that the energetic ion confinement is superior. Finally it should be<br />
emphasized that this discussion is based on the assumption that the fast or hot<br />
ions interact passively with ambient turbulence. In particular, energetic ion-<br />
driven modes have not been considered here.<br />
ACKNOWLEDGMENTS<br />
It is a pleasure to acknowledge the many engineers, computer<br />
programmers, technicians, <strong>and</strong> other staff members who have supported the<br />
TFTR program. This work supported by the U.S. Department of Energy<br />
Contract No. DE-AC02-76-CHO-3073.<br />
REFERENCES<br />
[1] HULSE, R.A., Nucl. Technol./Fusion 3 (1983) 259.<br />
[2] HAWRYLUK, R.J., in Physics Close to Thermonuclear Conditions (Proc. Course Varenna,<br />
1979), Commission of the European Communities, Brussels (1979).<br />
[3] MANSFIELD, D.K., et al., "Particle confinement studies on ohmically heated plasmas in TFTR<br />
using gas modulation techniques", Controlled Fusion <strong>and</strong> Plasma Physics (Proc. 14th Eur. Conf.<br />
Madrid, 1987), Vol. 11D, Part I, European Physical Society (1987) 314-317.<br />
[4] BERLIZOV, A.B., et al., "Low-q discharges in the T-10 tokamak", Plasma Physics <strong>and</strong> Controlled<br />
<strong>Nuclear</strong> Fusion Research 1980 (Proc. 8th Int. Conf. Brussels, 1980), Vol. 1, <strong>IAEA</strong>,<br />
Vienna (1981) 23-34.<br />
[5] STRACHAN, J.D., et al., Nucl. Fusion 22 (1982) 1145-1159.<br />
[6] VASIN, N.L., VERSHKOV, V.A., ZHURAVLEV, V.A., Sov. J. Plasma Phys. 10 (1984) 525.<br />
[7] GENTLE, K.W., RICHARDS, B., WAELBROECK, F., Plasma Phys. Control. Fusion 29<br />
(1987) 1077.<br />
[8] CHANG, C.S., HINTON, F.L., Phys. Fluids 25 (1982) 1493.<br />
[9] LEE, G.S., DIAMOND, P.H., Phys. Fluids 29 (1986) 3291.<br />
[10] MARMAR, E.S., CECCHI, J.L., COHEN, S.A., Rev. Sci. Instrum. 46 (1975) 1149.<br />
[11] STRATTON, B.C., et al., submitted to Nucl. Fusion.
<strong>IAEA</strong>-CN-50/A-V-4 321<br />
[12] RADEZTSKY, R.H., et al., "Measurements of fast ion radial diffusion in TFTR", Controlled<br />
Fusion <strong>and</strong> Plasma Heating (Proc. 15th Eur. Conf. Dubrovnik, 1988), Vol. 12B, Part I, European<br />
Physical Society (1988) 79-82.<br />
[13] HAMMETT, G.W., PhD Dissertation, Univ. Microfilms Int. No. GAX86-12694, Princeton<br />
Univ., NJ (1986).<br />
[14] BARNES, C, STRACHAN, J., Phys. Fluids 26 (1983) 2668.<br />
[15] MYNICK, H.E., KROMMES, J.A., Phys. Fluids 23 (1980) 1229.
CURRENT DRIVEN TURBULENCE AND<br />
MICROTURBULENT FLUCTUATIONS<br />
IN THE TORTUR AND STOR-M TOKAMAKS<br />
A.J.H. DONNE, C.J. BARTH, B. DE GROOT,<br />
N.J. LOPES CARDOZO, H. DE KLUIVER, G.J.J. REMKES<br />
FOM-Instituut voor Plasmafysica 'Rijnhuizen',<br />
Nieuwegein, Netherl<strong>and</strong>s<br />
M. EMAAMI, A. HIROSE, O. MITARAI 1 , A. SARKISSIAN,<br />
H.M. SKARSGARD, S.W. WOLFE, W. ZHANG<br />
Department of Physics, University of Saskatchewan,<br />
Saskatoon, Saskatchewan,<br />
Canada<br />
Abstract<br />
<strong>IAEA</strong>-CN-50/A-V-5<br />
CURRENT DRIVEN TURBULENCE AND MICROTURBULENT FLUCTUATIONS IN THE<br />
TORTUR AND STOR-M TOKAMAKS.<br />
The effects of fast current transients on a magnetically confined plasma are discussed on<br />
the basis of results obtained in the TORTUR <strong>and</strong> STOR-1M tokamak experiments. The<br />
formation of a current skin <strong>and</strong> the accompanying turbulent dissipation process have been studied<br />
both experimentally <strong>and</strong> theoretically. Delayed bulk heating is observed <strong>and</strong> is explained as being<br />
due to current profile changes induced by the current transient. Density fluctuations have been<br />
measured at both tokamaks in a wide frequency range (up to 200 MHz). As a result of a<br />
turbulent heating pulse the fluctuations in certain frequency regions are almost completely<br />
suppressed.<br />
1. TORTUR<br />
The application of a high voltage spike (typical rise times 2-10 |i.s, field<br />
strengths E < 5 kV/m) during the plateau phase of a tokamak induces a chain of<br />
events. These effects have been studied in various tokamaks. In TORTUR (R =<br />
46 cm, a = 8.5 cm, BT = 2.9 T, L/OH) < 55 kA, Te - T{ < 1 keV, n < 10 20 nr 3 ,<br />
Zeff(imp) < 2) during the voltage spike a current skin is formed in which strong<br />
anomalous dissipation occurs. The formation of this skin layer can be described<br />
by the concept of marginal stability. The critical drift parameter, vd/cs (electron<br />
drift velocity/ion acoustic velocity), for ion-acoustic turbulence is found to be 7 -<br />
8. However, the values needed for properly simulating the skin heating are<br />
significantly smaller [1].<br />
Due to turbulent dissipation in the skin region fast transverse wave<br />
transport occurs, leading to a non-thermal ion distribution. Bulk ion heating<br />
Kumamoto Institute of Technology, Kumamoto, Japan.<br />
323
324 DONNE et al.<br />
E<br />
CO<br />
o<br />
FIG. 1. Short term effects of high voltage current pulse (a,b). The thermal part of the electron distribution<br />
function shows an increase in Te (c) <strong>and</strong> ne (e) in the centre of the plasma, while at the edge<br />
(r/a = 0.7) cooling (d) <strong>and</strong> rarefaction If) occur. Both effects disappear in about 50 ps. A tail population<br />
with Te up to 3 keV (g) <strong>and</strong> ne up to 10 19 m~ 3 (h) is observed at r/a = 0.7 m, for 10 to 15 ins only.<br />
follows after thermalization on a much longer time-scale, x^n^r,,,^); [2,3].<br />
After an initial stable formation of the current skin (the first 3 |is), a rapid<br />
broadening towards the center follows later during current rise, possibly due to a<br />
mixture of resistive modes [4]. In this phase the plasma is compressed with<br />
considerable heating. After removal of the additional current, the current density<br />
profile has become narrower. The excess energy stored in the poloidal magnetic<br />
field is gradually released during the relaxation in about 2 ms. The above
GO<br />
40<br />
20ri<br />
HI<br />
i i<br />
ii<br />
1<br />
\<br />
<strong>IAEA</strong>-CN-S0/A-V-5 325<br />
Co)<br />
10 15 20 25 30 35<br />
*• i Cms)<br />
E<br />
0)<br />
10<br />
8<br />
6<br />
4<br />
2<br />
0<br />
1000<br />
800<br />
600<br />
400<br />
200<br />
0<br />
r=5 mm<br />
creation<br />
non-thermal<br />
ion tail<br />
Cb)<br />
(d)<br />
10 15 20 25 30 35<br />
*• t Cms)<br />
FIG. 2. Long term effects of high voltage current pulse (a), showing a gradual increase of the electron<br />
(c) <strong>and</strong> ion (d) temperatures <strong>and</strong> no significant effects on ne (b).<br />
processes could be satisfactorily simulated by a simple model incorporating the<br />
mentioned effects. Without deterioration of xE large increases of Te(0) (up to<br />
60%) have been induced. The energy losses during the voltage spike were small<br />
<strong>and</strong> the feared impurity enhancement did not show up. It may be remarked that<br />
for multi-pulse turbulent heating much smaller values of loop voltages <strong>and</strong> rise<br />
times are required than for single-pulse turbulent heating. The effects of the<br />
current pulse on the short <strong>and</strong> the long term are shown in Figs 1 <strong>and</strong> 2,<br />
respectively.<br />
A bifurcation of the plateau regime can be achieved by properly<br />
programming the plasma current [5]. After breakdown the current is ramped up<br />
rapidly (dl/dt < 30 MA/s), producing a turbulent plasma. If in this phase the<br />
current is clamped, a mildly turbulent plasma can be sustained throughout the<br />
plateau. The resistivity is 2 - 4 times neo-classical <strong>and</strong> the profiles of Te <strong>and</strong> ne are<br />
broad. On the other h<strong>and</strong>, by letting the initial turbulent plasma relax before taking<br />
the current to the plateau value, a plasma with neo-classical resistivity <strong>and</strong> more<br />
peaked profiles is obtained. In both distinct regimes, xE is in agreement with the<br />
used scaling laws (e.g. Pfeiffer <strong>and</strong> Waltz [6]), the mildly turbulent regime<br />
featuring both higher input power <strong>and</strong> higher temperatures.<br />
During stationary current-driven turbulent (CDT) discharges density<br />
fluctuations have been observed at different radial positions by collective<br />
scattering of (2 <strong>and</strong> 4 mm) microwaves [7] in a wide spectral region (up to 100<br />
MHz) <strong>and</strong> at various k-values (see Figs 3a-c). Immediately after application of the<br />
current pulse the density fluctuations at frequencies above 0.7 MHz, <strong>and</strong><br />
observed at k = 1700 nr 1 are almost completely suppressed [7].
326 DONNE et al.<br />
350<br />
300<br />
250<br />
200<br />
150<br />
100<br />
50<br />
0<br />
(o)<br />
100 200 300 400 500<br />
*• frequency CkHz)<br />
1.0 2.0 3.0 4,0 5.0<br />
>• frequency (MHz)<br />
1.6<br />
1.4<br />
1.2<br />
1.0<br />
0.8<br />
0.6<br />
0.4<br />
0.2<br />
0.0 0.0<br />
11 1<br />
1<br />
tb)<br />
0.2 0.4 O.S 0.8 1.0<br />
•• frequency (MHz)<br />
FIG. 3. Density fluctuations as a Junction of frequency for three frequency regions: (a) 0-200 kHz,<br />
(b) 200-700 kHz <strong>and</strong> (c) 0.7-3 MHz. Scattering conditions: X = 2 mm, rla = 0.125, k = 600 m' 1<br />
<strong>and</strong> Ip = 30 kA.<br />
2. STOR-1M <strong>and</strong> STOR-M<br />
In the ST0R-1M tokamak [8] (R = 22 cm, a = 3.5 cm, BT = 1 T, L(OH)<br />
£ 10 kA, - 100 eV, - 1 x 10¹⁹ m-3, hydrogen), a short cmrent<br />
pulse (20 \xs duration, peak current £ 10 kA) is superimposed on the ohmic<br />
current at the plateau (Fig. 4a,b). Safety factors q(a) as small as 1.5 have been<br />
achieved without plasma disruption with the aid of plasma feedback control.<br />
The current pulse induces skin current formation, anomalous resistivity<br />
<strong>and</strong> concurrent turbulent heating. The evolution of the toroidal current density<br />
profile, as measured by a small magnetic probe is shown in Fig. 4c. The profile<br />
of the toroidal electric field has also been deduced from the magnetic<br />
measurements. The behaviour of current penetration cannot be simulated<br />
satisfactorily by the observed (anomalous) resistivity alone. The observed rate of<br />
current penetration is one order of magnitude faster than expected from the<br />
resistivity profile. Including an enhanced electron viscosity [9] in the electron<br />
momentum equation explains the fast current penetration although at present the<br />
mechanism of the viscosity enhancement is not clear.
E<br />
4<br />
tc)<br />
<strong>IAEA</strong>-CN-50/A-V-5 327<br />
500<br />
0<br />
fL/~\<br />
- 11 Vp<br />
-10<br />
" rV\<br />
i i i<br />
— 1 " 1 1 1 • •1<br />
300<br />
- // 200 OH + TH<br />
100<br />
- rr%<br />
OH only<br />
7°<br />
(b) -<br />
- 5<br />
-<br />
1 !<br />
fe) -<br />
x :<br />
i t i i i i i<br />
0.0 0.2 0.4 O.G 0.8<br />
*• At (msl<br />
FIG. 4. Effects of turbulent heating current pulse in STOR-1M. (a) Overall current waveform,<br />
(b) details of current pulse <strong>and</strong> loop voltage, (c) evolution of toroidal current density profile, (d) electron<br />
density <strong>and</strong> (e) temperature after current pulse. BT = 1.0 T. Vm (turbulent heating capacitor voltage)<br />
= 4.0 kV in (a,b) <strong>and</strong> 3.0 kV in (c,d).<br />
The electron density <strong>and</strong> temperature after the current pulse have been<br />
observed to significantly increase as shown in Figs 4d <strong>and</strong> 4e, respectively. The<br />
delayed electron heating has also been observed in TORTUR [4]. After the<br />
current pulse, ohmic heating is the only energy input, <strong>and</strong> the global energy<br />
confinement improves by a factor almost 5 (see Fig. 5a). The maximum pp<br />
(poloidal beta) achieved in ST0R-1M is 3.2 without apparent sign of saturation<br />
with the current pulse amplitude.<br />
The improved confinement after the current pulse is accompanied by<br />
significant reduction in MHD activities <strong>and</strong> low frequency (f < 500 kHz) density<br />
10
328 DONNE et al.<br />
1.0<br />
0.8 -<br />
0.6 -<br />
t 0.4 : -<br />
0.2 -<br />
0.0<br />
-<br />
-<br />
1<br />
OH + TH<br />
OH only<br />
N<br />
t i l l<br />
Co) .<br />
m=2<br />
tb)<br />
, VMILv^^JW^ ,<br />
FIG. 5. Effects of turbulent heating on global energy confinement in STOR-1M. (a) Energy confinement<br />
lime after the current pulse, (b) m = 2, 3 MHD signals <strong>and</strong> density fluctuation at the edge.<br />
BT = LOT. VTH = 3kV.<br />
fluctuations at the edge as shown in Fig. 5b. The m = 2 Mirnov oscillations are<br />
almost completely suppressed.<br />
The onset of anomalous resistivity <strong>and</strong> concurrent efficient heating occurs<br />
when the additional current exceeds 2 kA. The corresponding critical drift<br />
parameter vjcs is approximately 5, which is well below the critical value for the<br />
onset of typical electrostatic instabilities (e.g. ion acoustic <strong>and</strong> electrostatic ion<br />
cyclotron modes) because of a small temperature ratio T/T^ = 2 - 3 in STOR- 1M.<br />
Yet, high-frequency density fluctuations in the ion acoustic regime with a broad<br />
spectrum extending to f = 200 MHz have been detected by Langmuir probes<br />
during the current pulse.<br />
ST0R-1M is a prototype for a larger STOR-M (R = 46 cm, a = 12 cm, BT<br />
= IT, Ip(OH) = 40 kA, = 350 eV, = 2 x 10 19 m-3). Stable ohmic<br />
discharges with q(a) < 2 <strong>and</strong> discharge duration of 0.2 s have been achieved.<br />
Turbulent heating experiments <strong>and</strong> low q tokamak operation with rapid current<br />
ramp <strong>and</strong> clamping are planned.<br />
The work at the University of Saskatchewan was sponsored by the<br />
Natural <strong>Sciences</strong> <strong>and</strong> Engineering Research Council of Canada. The travel of O.<br />
Mitarai was supported by the National Fusion Program of Canada. The loan of a<br />
2-mm interferometer from PPL (Princeton) is gratefully acknowledged. The work<br />
at Rijnhuizen was performed as part of the research program of the association<br />
agreement of Euratom <strong>and</strong> the "Stichting voor Fundamenteel Onderzoek der<br />
Materie" (FOM) with financial support from the "Nederl<strong>and</strong>se Organisatie voor<br />
Wetenschappelijk Onderzoek" (NWO) <strong>and</strong> Euratom.
<strong>IAEA</strong>-CN-50/A-V-5 329<br />
REFERENCES<br />
[1] Kalfsbeek H.W., Magnetic field profiles during turbulent heating in a toroidal<br />
hydrogen plasma, Rijnhuizen Report 78-114 (1978)<br />
[2] Ishihara O. <strong>and</strong> Hirose A., Quasilinear evolution of current-driven<br />
ion-acoustic instability in a magnetic field, Phys. Rev. Lett. 5.0 (1983) 1783.<br />
[3] Nakamura R., Hiraki N., Nakamura Y. <strong>and</strong> Itoh S., Relaxation of ion energy<br />
spectrum just after turbulent heating pulse in TRIAM-I tokamak, Jpn. J.<br />
Appl. Phys. 31 (1982) 1095.<br />
[4] De Kluiver H. <strong>and</strong> Lopes Cardozo N.J., Plasma heating by current-driven<br />
turbulence, Comments Plasma Phys. Controll. Fusion ii (1988) 211.<br />
[5] De Kluiver H. et al., High-temperature, high-beta plasma heating by weak<br />
turbulence in the TORTUR tokamak, Phys. Lett. 94A (1983) 156.<br />
[6] Pfeiffer W. <strong>and</strong> Waltz R.E., Empirical scaling laws for energy confinement in<br />
ohmically-heated tokamaks, Nucl. Fusion 19 (1979) 51.<br />
[7] De Kluiver H., Barth C.J. <strong>and</strong> Donn6 A.J.H., Current driven turbulence <strong>and</strong><br />
microturbulent spectra in the TORTUR tokamak, Plasma Phys. Controll.<br />
Fusion 30 (1988) 699.<br />
[8] Mitarai O., Wolfe S.W., Hirose A. <strong>and</strong> Skarsgard H.M., Measurement of the<br />
image field in the STOR-1M tokamak, Plasma Phys. Controll. Fusion 27<br />
(1985) 395. Kuwahara H. et al., Study of enhanced confinement <strong>and</strong> q = 2<br />
disruptive modes with fast rising current in the STOR-1M tokamak, Plasma<br />
Physics <strong>and</strong> Controlled <strong>Nuclear</strong> Fusion Research (Proc. 11th Int. Conf.,<br />
Kyoto, 1986) Vol. 1, <strong>IAEA</strong>, Vienna (1987) p. 413.<br />
[9] Hirose A., Kawabe T. <strong>and</strong> Skarsgard H.M., Anomalously rapid current<br />
penetration in a toroidal turbulent heating experiment, Phys. Rev. Lett. 29<br />
(1972) 1087.
RECENT TEXTOR RESULTS<br />
TEXTOR TEAM<br />
(Presented by F.L. Waelbroeck)<br />
Institut fur Plasmaphysik,<br />
Euratom-KFA Association,<br />
Kernforschungsanlage Jiilich GmbH,<br />
Jiilich, Federal Republic of Germany<br />
Abstract<br />
<strong>IAEA</strong>-CN-50/A-VI-l<br />
RECENT TEXTOR RESULTS.<br />
A major part of the TEXTOR programme deals with the analysis of the properties of the edge<br />
plasma <strong>and</strong> plasma facing surfaces <strong>and</strong> the development of methods of producing discharges with a<br />
reproducible, low degree of contamination. Recent pump limiter (ALT II) <strong>and</strong> ICRH results are the<br />
object of separate presentations. The paper presents <strong>and</strong> compares recent results obtained under optimum<br />
carbonization <strong>and</strong> under boronization conditions (high limiter power deposition). It summarizes<br />
the results of many different diagnostics developed to study the plasma edge, the scrape-off layer <strong>and</strong><br />
the different particle fluxes to <strong>and</strong> from the wall. It is finally shown that the improved underst<strong>and</strong>ing<br />
<strong>and</strong> control of the plasma-wall interaction leads to discharges of such high reproducibility that signal<br />
averaging techniques can be used. Reliable analyses of the properties of the confined plasma can result.<br />
As an example, the evolution of the current distribution profile in the presence of sawtooth activity is<br />
discussed.<br />
1. INTRODUCTION<br />
Recent TEXTOR activities have been focused on:<br />
- Improving the surface (deposition of films <strong>and</strong> conditioning),<br />
- Characterizing the plasma edge <strong>and</strong> scrape-off layer (SOL),<br />
- Questions related to transport phenomena in the plasma core,<br />
- Performance of pump limiters,<strong>and</strong><br />
- ICRH studies.<br />
The last two are addressed in separate presentations<br />
[l, 2l. Results concerning the first two were presented at the<br />
8th International Conference on Plasma Surface Interactions in<br />
Controlled Fusion Devices (Jlilich, May 1988); details will appear<br />
in the proceedings; highlights are summarized in § 2 <strong>and</strong> 3.<br />
The reproducible TEXTOR discharges allow reducing statistical<br />
errors by applying signal averaging techniques; this is done,<br />
e.g. to study sawtooth behaviour in the plasma center. The<br />
method <strong>and</strong> a typical application are briefly described in § 4.<br />
331
332 TEXTOR TEAM<br />
TEXTOR measurements were interrupted in April 1988 to implement<br />
two neutral beam injectors (total power ~ 3 MW), upgrade<br />
in ICRH power (~ 4 MW), modify one of two pairs of rf antennae<br />
for Ion Bernstein Wave studies <strong>and</strong> instal a toroidally symmetrical<br />
inner limiter of graphite.<br />
2. PLASMA-FACING SURFACES<br />
2.1 Surface materials <strong>and</strong> conditioning<br />
We have tried to optimize carbonization: 0.1 um-thick films<br />
were deposited after eroding the previous layer by a Radiofrequency-assisted<br />
dc Glow (RG) discharge in D2- The wall temperature<br />
(Tw = 150 or 350 °C), the gas composition (15 or 25 % CD4<br />
in D2 or He) <strong>and</strong> the conditioning after the procedure were varied.<br />
The purity of the first ensuing discharges was unaffected<br />
(metal-free plasmas with leff < 1.5 resulted); hydrogen-recycling<br />
depends on conditioning: large plasma density excursions<br />
are avoided when carbonization is followed by 30 - 60 min long<br />
RG discharges in D2 or He <strong>and</strong>/or ~ 8 hours of baking at 400 °C<br />
[3]. Rather 12pure, low density plasmas ^eff * **^*<br />
ng = 4 - 5.10 ) resulted from combining RG in He <strong>and</strong> baking.<br />
The all-carbon surrounding has demonstrated: that ion implantation<br />
<strong>and</strong> collision-induced release are the main steps of<br />
hydrogen <strong>and</strong> oxygen recycling [3, 4]. For H, thermal desorption<br />
between discharges is important when Tw > 300 °C. The mechanisms<br />
differ from those prevailing on metal surfaces [5, 6] where, for<br />
H, deposition, thermal diffusion <strong>and</strong> recombination <strong>and</strong>, for 0,<br />
oxide formation <strong>and</strong> reduction by H are the main steps. This explains<br />
the difficulty to analyse recycling in devices with inner<br />
surfaces covered partly by carbon, partly by metal atoms.<br />
During tokamak shots, oxygen is implanted [7, 8] into carbonized<br />
layers which were initially oxygen-free [3] <strong>and</strong> buffers<br />
thereafter the 0 concentration in the plasma. The implanted 0 is<br />
removed by brief (10 - 20 min - long) RG discharges in He; the<br />
0 line-radiation decreases by a factor of 4 in the next tokamak<br />
discharge; it reincreases thereafter from shot to shot to the<br />
earlier level. RG discharges in He allow also removing excess D<br />
from a-C:D films.<br />
"Boronization" was tested in TEXTOR [9, 10]: A hydrogenrich<br />
amorphous layer of boron <strong>and</strong> carbon (atomic ratio 1/1) was<br />
deposited by an RG discharge in 10 % diborane (I^Hg), 10 % methane<br />
<strong>and</strong> 80 % He. Special precautions were taken because diborane<br />
is toxic <strong>and</strong> reactive [ll].<br />
Boronization reduced strongly the plasma radiation (factor<br />
> 2) <strong>and</strong> affected significantly hydrogen recycling. Oxygen VI
<strong>IAEA</strong>-CN-50/A-VI-l 333<br />
line-radiation decreased by a factor of 6: the 0 concentration<br />
was a factor of ~ 3 lower. Possible reasons for this are discussed<br />
in [4, 9, 10], The carbon II line-radiation decreased by<br />
about 40 %: a lower rate of chemical erosion may have been partly<br />
compensated by increased physical sputtering (higher edge<br />
temperature).<br />
Plasma density control was easier after boronization: the<br />
recycling coefficient R is usually larger than unity during the<br />
current flat top in TEXTOR at Tw = 150 °C with carbonized wall;<br />
R < 1, making feed-back density control possible, occurs when<br />
Tw > 300 "C; high power ICRH pulses produce density excursions<br />
even at the higher temperatures. Recycling was more favourable<br />
after boronizaiton: R < 1 was obtained at 150 °C <strong>and</strong> ICRH density<br />
excursions were avoided: feed-back density control could be<br />
systematically used [2].<br />
More work is required to underst<strong>and</strong> the causes of these improvements.<br />
However, one question arises: can a boronization<br />
layer be erased in a reasonably short time before depositing the<br />
next one, as was done for carbonization? Thick layers might peel<br />
off.<br />
2.2 Particle fluxes to <strong>and</strong> from the wall<br />
Underst<strong>and</strong>ing the SOL, the edge plasma <strong>and</strong> tokamak behaviour<br />
in general requires the knowledge of particle fluxes to<br />
<strong>and</strong> from the wall. This is difficult: small differences between<br />
large fluxes matter (for instance,to evaluate the hydrogen wall<br />
inventory). The fluxes to <strong>and</strong> from the wall are not necessarily<br />
equal; transient phenomena <strong>and</strong> redeposition are important.<br />
In TEXTOR, the calibrated gas inlet system <strong>and</strong> mass resolved<br />
measurements [12] yield the rates at which Do (or h^) enters<br />
the plasma <strong>and</strong> outgasses between discharges [13]. The flux of<br />
hydrogen atoms to the wall is measured by a permeation probe<br />
[14] <strong>and</strong> also deduced from the enhanced flux of charge-exchange<br />
neutrals caused by short H2 gas pulses made during the discharge<br />
[15]. The hydrogen flux from the limiter or other surfaces<br />
deeper in the SOL, including the wall, is derived from the radial<br />
profile of the H light [16, 17]. A spectral analysis<br />
(Doppler profile) of this^ine, emitted by atoms recycled at the<br />
limiter, has allowed among others [18, 19] evaluating their velocity<br />
distribution <strong>and</strong> the fraction (30 - 50 %) of the incident<br />
hydrogen flux which is directly reflected after impact. This value<br />
agrees with measurements in the laboratory [20]. Redeposited<br />
carbon layers contain significant amounts (D/C ~ 0.4) of deuterium<br />
[21].
334 TEXTOR TEAM<br />
The hydrogen recycle <strong>and</strong> wall inventory problems are important<br />
but so involved, multi-faceted <strong>and</strong> interrelated that time<br />
will be required to elucidate them fully, even with all necessary<br />
diagnostics available.<br />
Underst<strong>and</strong>ing carbon erosion <strong>and</strong> redeposition is urgent <strong>and</strong><br />
crucial since graphite is contemplated as first wall material in<br />
future devices. The C flux from limiters has been measured by<br />
the same spectroscopic method used for H <strong>and</strong> 0 [16, 17]. Measurements<br />
with a sniffer probe equipped with a heatable inner graphite<br />
target [22] have demonstrated the importance of chemical<br />
erosion by hydrogen from the plasma. The same conclusion is<br />
drawn from the measurements of the C fluxes from the limiters<br />
[17, 18]. Chemical erosion by hydrogen at the wall had also to<br />
be assumed to explain the redeposition profiles in the SOL<br />
[23, 24]. In addition, chemical erosion by oxygen occurs<br />
[12, 18, 22] but is in principle avoidable if we can reduce the<br />
oxygen contamination. A rapid redeposition of carbon (order of<br />
lO 15 atoms/em's) occurs in the SOL. The atoms leave probably the<br />
wall as CH4, are ionized, dissociated in the SOL <strong>and</strong> guided by<br />
the magnetic field to obstacles situated in the limiter shadow.<br />
Thus a screening effect occurs. The redeposition rate depends on<br />
the distance along field lines between the collector probe <strong>and</strong><br />
the next obstacle. When this distance is very large, carbon diffusing<br />
out of the plasma is also collected on the deeper-lying<br />
probe.<br />
Results relating to the oxygen fluxes have been mentioned<br />
in § 2.1. The presence of metal ions is continuously surveyed by<br />
their X-ray radiation from the plasma center. TEXTOR is recarbonized<br />
whenever their concentrations reach regularly a value higher<br />
than 0.02 %. Impurity collector probes confirm the fact<br />
that the metal fluxes are very low.<br />
3.PROPERTIES OF SOL AND OF EDGE PLASMA<br />
The TEXTOR results concerning the plasma edge have been reviewed<br />
recently by Samm [18], Differences arising in the presence<br />
of toroidal <strong>and</strong> poloidal limiters, the influence of the plasma<br />
species (H, D, He), the detached <strong>and</strong> attached plasma conditions,<br />
the particle transport <strong>and</strong> the influence of impurities<br />
are addressed (see also [25, 26]). Lack of space restricts the<br />
present summary to two major points:<br />
Earlier measurements of the ne profiles in the SOL had<br />
shown L25J that the e-folding length \ varied significantly<br />
with the distance (along field lines) fr'om a poloidal limiter.
<strong>IAEA</strong>-CN-50/A-VI-l 335<br />
These measurements - which agreed with theoretical predictions<br />
[27] - have been repeated [12] <strong>and</strong> confirmed using the toroidal<br />
limiter of which single blades, close or far away from the<br />
diagnostics, had been withdrawn (1.5 cm). This affects only<br />
slightly the toroidal symmetry. Although the steepening of the<br />
profile as one approaches the limiter is - as expected- somewhat<br />
reduced, it is still present <strong>and</strong> accounts for the rather small<br />
e-folding length \ (0.5 - 0.8 cm) of the heat flux to the limiter<br />
which is measured by infrared thermography on the limiter<br />
blades [28].<br />
The small value of X. <strong>and</strong> X
336 TEXTOR TEAM<br />
FIG. I. Sawtooth modulation of (a) phase shifts, <strong>and</strong> (b) Faraday rotation angles along nine vertical<br />
chords after superposition of290 similar periods <strong>and</strong> correction for the finite time constant of the acquisition<br />
circuits (x is the minimum chord distance from the magnetic axis; the different fall times in the<br />
phase shift <strong>and</strong> rotation signals are due to different sampling frequencies for the raw data of 5 <strong>and</strong><br />
1 kHz, respectively).<br />
phase shifts Aip «/n ds <strong>and</strong> Faraday rotation angles a=/n B nds<br />
along nine vertical Chords with time resolutions of Z§0^\xsec<br />
<strong>and</strong> 1 to 10 msec respectively (EL,, is the poloidal field component<br />
parallel to a probing chord). Whereas the Au -traces show<br />
distinct sawtooth oscillations, the rotation signals merely exhibit<br />
r<strong>and</strong>om fluctuations, primarily caused by detector noise.<br />
This noise, which is not correlated with the sawtooth phase, can<br />
be reduced by forming a coherent average of similar events (details<br />
on this technique including corrections for the finite<br />
time resolution may be found in Ref. [32]). As an example,<br />
Fig. 1 presents the results obtained by superimposing 290 sawtooth<br />
cycles detected in five consecutive discharges. For better<br />
visualization, the signals are displayed as a sequence of two<br />
identical events; furthermore, since the rotation angles have<br />
opposite signs on both sides of the magnetic axis, the<br />
a-traces derived in the inner half of the plasma cross-section<br />
have been plotted upside down to avoid any confusion with inverted<br />
sawteeth.<br />
A comparison of the coherently averaged phase shift data<br />
with the original signals shows that the characteristic features<br />
of an individual sawtooth are preserved except for precursor oscillations,<br />
the phase of which is probably only weakly correlated<br />
with the sawtooth collapse. Moreover, the coherently averaged<br />
rotation signals reveal the expected outward shift of the<br />
magnetic axis during the sawtooth rise phase in accordance with
q(r]<br />
3-<br />
2-<br />
1- -<br />
<strong>IAEA</strong>-CN-50/A-VI-l 337<br />
y \<br />
0- —<br />
0<br />
0 10 20 30 40 r Icm)<br />
FIG. 2. Mean electron density <strong>and</strong> safety factor versus flux surface radius.<br />
equilibrium theory. Such a shift diminishes the distance between<br />
the outer chord at x+ = + 5.5 cm <strong>and</strong> the centre <strong>and</strong> thereby decreases<br />
the amount of Faraday rotation, whereas for the inner<br />
chord at x_ = - 4.5 cm the opposite occurs. Consequently, the<br />
signal at x_ exhibits a slightly concave shape in contrast to a<br />
somewhat convex waveform observed at x_+ (cf. Fig. Kb)). A quantitative<br />
analysis of this asymmetry yields an outward displacement<br />
of the magnetic axis by about 1 mm. This agrees with equilibrium<br />
calculations by means of the Princeton TRANSP code<br />
[33] using electron density <strong>and</strong> temperature data measured in<br />
TEXTOR before <strong>and</strong> after a sawtooth collapse. Note that small<br />
r<strong>and</strong>om motions of the plasma, uncorrelated with the sawtooth<br />
phase, are eliminated by the signal averaging.<br />
In order to analyse the data of Fig. 1 in terms of local<br />
density <strong>and</strong> field variations, we split ng <strong>and</strong> Bp into time-independent<br />
mean values <strong>and</strong> in fluctuating components. Then we determine<br />
these mean profiles fie(r) <strong>and</strong> 6p(r,9) from the time-averaged<br />
phase shift <strong>and</strong> rotation signals p under the assumptions of<br />
eccentric circular flux surfaces <strong>and</strong> constant density on a given<br />
surface (r is the surface radius <strong>and</strong> 9 denotes the poloidal angle;<br />
for further details see Ref. [3l]). The resulting q{r) profile<br />
has a central vaUie of 0.77 ± 0.12 (see Fig. 2). Next, we<br />
deduce the modulation ri (r,t) of the electron density distribution<br />
from the sawtooth Sscillations of the phase shifts by a sequence<br />
of Abel inversions where we include phase shift signals<br />
obtained from comparable discharges with 6 slightly different<br />
major radii. Thereby, we exp<strong>and</strong> our 9-channel instrument to 54<br />
virtual chords. The local density perturbation has a relative<br />
amplitude in the centre of An /ft = 0.075. The inversion radius<br />
at r = 14 cm is close to fffe radius of the q = 1 surface as<br />
1
338<br />
tv(r)<br />
10 l9 m 3 J<br />
-0.2<br />
TEXTOR TEAM<br />
10 20 30 40 r (cm)<br />
FIG. 3. Deviation of the electron density from the mean profile at ten equidistant times during a sawtooth<br />
period.<br />
determined from Bp (see Fig. 3). The structure in n (r,t) for<br />
r > 25 cm is presently not well understood but is possibly influenced<br />
by a sawtooth-correlated release of particles from the<br />
carbonized wall, the recycling coefficient of which is close to<br />
orie. Finally,A we calculate the density-induced oscillations<br />
a (x,t)
<strong>IAEA</strong>-CN-50/A-VI-l 339<br />
FIG. 4. Sawtooth modulation of the Faraday rotation signals separated into (a) density induced oscillations,<br />
<strong>and</strong> (b) changes due to poloidal field variations.<br />
sently work is in progress to corroborate these findings by a<br />
more detailed analysis of the poloidal field oscillations using<br />
an improved spatial resolution <strong>and</strong> supplementing the Faraday rotation<br />
diagnostic with highly resolved soft X-ray [35] <strong>and</strong> ECE<br />
measurements ^36] to gain additional information on the internal<br />
mode structure.<br />
REFERENCES<br />
Many recent results have been presented at the 8th Int.<br />
Conf. on Plasma Surface Interaction in Controlled Fusion Devices<br />
(Jlilich, May 1988). This will be abridged 8th PSI Jlilich (1988)<br />
in the following. The papers will appear in J. Nucl. Mater.<br />
[l] K.H. DIPPEL et al., this conference, paper CN-50 A-VII-<br />
10<br />
2 R. WEYNANDS et al., this conference, paper CN-50 E-II-1<br />
3 F. WAELBROECK et al., 8th PSI JUlich (1988) (0.22)<br />
4 F. WAELBROECK, Iberian Vacuum Meeting, Braga, Portugal<br />
(Sept. 1988), to appear in Vacuum<br />
5] F. WAELBROECK, KFA Bericht JuL-1966 (1984)<br />
6. F. WAELBROECK, KFA Bericht JOL-1962 (1980)<br />
7. M. RUBEL et al., to appear in J. Nucl. Mater.<br />
8] M. RUBEL et al., to appear in Plasma Physics <strong>and</strong> Controlled<br />
Fusion<br />
[9] F. WAELBROECK et al., to appear in Plasma Physics <strong>and</strong><br />
Controlled Fusion<br />
[10] J. WINTER et al., 8th PSI JUlich (1988), Post-deadline<br />
t/Ts
340 TEXTOR TEAM<br />
11<br />
12<br />
13<br />
!«]<br />
18<br />
19<br />
20<br />
21<br />
22<br />
23<br />
24<br />
25<br />
26<br />
28<br />
29<br />
30<br />
G. Esser et al., 15th SOFT, Utrecht, NL, (Sept. 1988)<br />
V. PHILIPPS et al., 8th PSI JUlich (1988) (B.27)<br />
F. WAELBROECK et al., J. Nucl. Mater. 145-147 (1987),<br />
665<br />
W.T. SHMAYDA et al., 8th PSI Jlilich (1988) (A.21)<br />
G. BERTSCHINGER et al., 12th Europ. Conf. on Controlled<br />
Fusion <strong>and</strong> Plasma Physics, (Sept. 1985), Budapest,<br />
Hungary, Vol. 1 (1985), 251-255<br />
[16] P. BOGEN <strong>and</strong> E. HINTZ, in "Physics of Plasma-Wall Interactions<br />
in Controlled Fusion", Plenum Press, New York<br />
(1986) Eds. D.E. POST <strong>and</strong> R. BEHRISCH<br />
[17] A. POSPIESZCZYK et al., J. Nucl. Mater. 145-147 (1987),<br />
574<br />
U. SAMM et al., 8th PSI Jlilich (1988) (14)<br />
P. BOGEN et al., 8th PSI Julich (1988) (A20)<br />
R. ARATARI et al., 8th PSI Julich (1988) (D32)<br />
H. BERGSAKER et al., 8th PSI Julich (1988) (B7)<br />
V. PHILIPPS et al, 8th PSI Julich (1988 (07)<br />
P. WIENHOLD et al., 14th EPS Conference, (June 1987),<br />
Madrid, 11.782<br />
P. WIENHOLD et al., 8th PSI JUlich (1988) (09)<br />
U. SAMM et al., J. Nucl. Mater. 145-147 (1987), 206<br />
U. SAMM et al., Plasma Physics <strong>and</strong> Controlled Fusion 29<br />
n° 10A (1987), 1321<br />
[27] H. GERHAUSER, H.A. CLAA6EN, D. REITER, Int. Workshop on<br />
Plasma edge theory in Fusion Devices, April 1988,<br />
Augustusburg, DDR<br />
K.H. FINKEN et al., 8th PSI Julich (1988) (C6)<br />
D.M. GOEBEL et al., 8th PSI JUlich (1988) (111)<br />
H. SOLTWISCH, W. STODIEK, J. MANICKAM, <strong>and</strong> J. SCHLuTER,<br />
in Proceedings of the Eleventh International Conference<br />
on Plasma Physics <strong>and</strong> Controlled <strong>Nuclear</strong> Fusion Research,<br />
Kyoto, 1986 (International Atomic Energy Agency,<br />
Vienna, 1987), vol. 1, p. 263<br />
31] H. SOLTWISCH, Rev. Set. Instrum. 57, 1939 (1986)<br />
32 H. SOLTWISCH, Rev. Sci. Instrum. 59, (1988)(in press)<br />
33] D. McCUNE, G. TAYLOR, <strong>and</strong> H. PARK, Bull. Am. Phys. Soc.<br />
31, 1450(1986)<br />
[34] B.B. KADOMTSEV, Fiz. PIasmy 1, 710(1975) (Sov. J. Plasma<br />
Phys. 1, 389 (1975))<br />
35] J. SCHLuTER, private communication<br />
36] Y. CAO <strong>and</strong> G. WAIDMANN, 14th EPS, Conference on Plasma<br />
Physics <strong>and</strong> Controlled Fusion, Madrid, 1987 (European<br />
Physical Society, Geneva, 1987), Vol. 1, p. 257
<strong>IAEA</strong>-CN-S0/A-VI-2-1<br />
RESONANT ISLAND DIVERTOR EXPERIMENTS<br />
ON TEXT<br />
J.S. DeGRASSIE, T.E. EVANS, G.L. JACKSON, N. OHYABU 1<br />
General Atomics,<br />
San Diego, California,<br />
United States of America<br />
S.C. McCOOL, K.W. GENTLE, W.L. ROWAN, A.J. WOOTTON<br />
Fusion Research Center,<br />
The University of Texas at Austin,<br />
Austin, Texas,<br />
United States of America<br />
F. KARGER, G. HAAS<br />
Max-Planck-Institut fur Plasmaphysik,<br />
Euratom-IPP Association,<br />
Garching,<br />
Federal Republic of Germany<br />
Abstract<br />
RESONANT ISLAND DIVERTOR EXPERIMENTS ON TEXT.<br />
The first experimental tests of the resonant isl<strong>and</strong> divertor (RID) concept have been carried out<br />
on the Texas Experimental Tokamak (TEXT). Modular perturbation coils produce static resonant magnetic<br />
fields at the tokamak boundary. The resulting magnetic isl<strong>and</strong>s are used to guide heat <strong>and</strong> particle<br />
fluxes around a small scoop limiter head. An enhancement in the limiter collection efficiency over the<br />
non-isl<strong>and</strong> operation, as evidenced by enhanced neutral density within the limiter head, of up to a factor<br />
of four is obtained. This enhancement is larger than one would expect given the measured magnitude<br />
of the cross-field particle transport in TEXT. It is assumed that electrostatic perturbations occur which<br />
enhance the ion convection rate around the isl<strong>and</strong>s. Preliminary experiments utilizing electron cyclotron<br />
heating (ECH) in conjunction with RID operation have also been performed.<br />
The first experimental tests of the resonant isl<strong>and</strong> divertor (RID)<br />
[1] concept have been carried out on TEXT. In the RID, a magnetic<br />
isl<strong>and</strong> resonant at the tokamak edge is used to guide heat <strong>and</strong> particle<br />
flux around the leading edge of a mechanical limiter, thereby enhancing<br />
particle exhaust <strong>and</strong> survivability of a potential pumped-limiter structure.<br />
The magnetic topology has similarity to the conventional poloidal<br />
divertor, but with greatly relaxed engineering requirements since the<br />
Present address: Institute of Plasma Physics, Nagoya University, Nagoya, Japan.<br />
341
342<br />
(a)<br />
MOVABLE UMITER<br />
DRIVE<br />
DeGRASSIE et al.<br />
EML COILS<br />
|—10 cm—|<br />
(b)<br />
IONIZATION<br />
GAUGE<br />
INSIDE SCOOP<br />
CHAMBER<br />
FIG. 1. (a) TEXT torus layout indicating EML coil module positions <strong>and</strong> location of movable limiter.<br />
TEXT major <strong>and</strong> minor radii are 1.0 <strong>and</strong> 0.26 m, respectively; (b) detail of graphite limiter head.<br />
external perturbation coils need only produce \8B/B\ ~ 10 3 in the<br />
RID. (Of course, the shear is much less in the RID.) Another proposed<br />
advantage of the RID is that an H-mode might be obtained with the<br />
simplified perturbation coils [2].<br />
The modular resonant perturbation coil set installed on TEXT was<br />
designed for ergodic magnetic limiter (EML) experiments, which have<br />
shown promising results [3,4,5]. This coil set also produces a sufficient<br />
level of coherency (unoverlapped isl<strong>and</strong> domains) to allow experimental<br />
tests of the RID with a small scoop limiter. Our preliminary tests [6]<br />
showed promise in particle ducting <strong>and</strong> heat flux control. Movement<br />
of the limiter location to a more favorable toroidal position relative to<br />
the magnetic isl<strong>and</strong> has resulted in substantially improved performance<br />
as described here. Figure l(a) indicates the EML coil layout on TEXT<br />
along with the toroidal location of the radially movable limiter [Fig.<br />
l(b)]/ A hot filament ionization neutral density gauge is located in the<br />
scoop limiter head, giving a fast response measurement of the collected<br />
neutral particles. An infrared camera views the front face of the limiter<br />
from the bottom of the torus is used to infer the surface temperature of<br />
the limiter face.<br />
A substantial improvement in the particle collection efficiency results<br />
from the RID action. Typical discharge characteristics are dis-
<strong>IAEA</strong>-CN-50/A-VI-2-1 343<br />
• «• >•> J•e « • • I • •<br />
TIME (ms)<br />
FIG. 2. Pressure rise in limiter chamber (P) due to magnetic isl<strong>and</strong>s generated by EML coils. (JH is<br />
the EML coil current.) The increase occurs only while q is such that the isl<strong>and</strong> resonant radius is at<br />
the limiter radius.<br />
played in Fig. 2. The EML coil current is pulsed on (/H in Fig. 2) once<br />
the discharge has reached steady state. The neutral pressure within the<br />
limiter head (P) doubles due to the action of the magnetic isl<strong>and</strong>s on<br />
particle flux control. (The limiter head pressure equilibration time for<br />
a step change in the plasma source is only ~ 3 msec.) In this discharge<br />
the q value is swept in time by gradually dropping the plasma current<br />
(7p). For this case, the primary isl<strong>and</strong> resonance is at the m=l'jn—1<br />
surface, that is, where q = 3.5. The rise <strong>and</strong> fall in the pressure occur<br />
as the isl<strong>and</strong> structure sweeps by the collection aperature of the<br />
movable limiter. Mappings of this magnetic structure (based upon the<br />
actual perturbation coil geometry <strong>and</strong> the experimental discharge parameters)<br />
at the two times indicated in Fig. 2 are displayed in Fig. 3.<br />
The m—ljn—2 isl<strong>and</strong> "brackets" the aperture during the period of enhanced<br />
plasma collection. Pressure increases due to the RID of up to a<br />
factor of 4 have been obtained.
344 DeGRASSIE et al.<br />
CJ<br />
CO<br />
a<br />
23<br />
21<br />
19<br />
APERTURE<br />
229kA<br />
lp = 209 kA<br />
v ;<br />
c ' Y - • ' •• ; •••..•••••••':•-.•*.<br />
0 30 60 90 120 150 180 0 30 60 90 120 150 180<br />
POLOIDAL ANGLE (DEGREE) POLOIDAL ANGLE (DEGREE)<br />
FIG. 3. Mappings of field structure at the two times indicated in Fig. 2. The m = 7/n = 2 isl<strong>and</strong> is<br />
seen to pass by the limiter aperture during the period of increased plasma collection.<br />
This effect is clearly a resonant phenomenon, as expected, in that<br />
the increase occurs only at q values near the resonant q value. (At<br />
q — 3.2 on the limiter front face, q ~ 3.5 at the limiter aperture.) Varying<br />
the limiter radius requires a different Ip to achieve the resonant q as<br />
expected. Reversing the direction of In places an x point on the aperture<br />
rather than the o point for all conditions the same. This reversed<br />
situation gives no observable pressure rise.<br />
Interestingly, the pressure increase is greater in helium discharges<br />
than in hydrogen. Empirically, TEXT has found better particle confinement<br />
time with helium compared to hydrogen, indicating a lower intrinsic<br />
cross-field transport in helium. Any transport mechanism which<br />
moves particles across the field lines competes with the desired RID<br />
particle control.<br />
Measurements with the infrared camera confirm that heat is diverted<br />
off the limiter face in the presence of the magnetic isl<strong>and</strong>. Also,<br />
a fiber optic threaded down the limiter shaft viewing the region inside<br />
the aperture collector shows a significant increase in the ha recycling<br />
h'ght due to the enhanced plasma collection.<br />
Although the pumped limiter enhancements are qualitatively as<br />
predicted, one cannot justify the magnitude given the small isl<strong>and</strong><br />
widths in TEXT. The measured intrinsic cross-field diffusion should<br />
transport an ion across an isl<strong>and</strong> long before it circulates the isl<strong>and</strong><br />
due to motion parallel to the field lines, thus washing out any particle<br />
channeling action. Presently, our working model is that isl<strong>and</strong> induced<br />
perturbations in the electrostatic field cause ions to circulate the isl<strong>and</strong>s<br />
much more rapidly due to the SE X B drift, being independent<br />
of parallel motion <strong>and</strong> transporting impurities as rapidly as the pro-
<strong>IAEA</strong>-CN-50/A-VI-2-1 345<br />
tons. This electrostatic perturbation results from the response of the<br />
electrons to the magnetic perturbations; the electron thermal velocity is<br />
large enough, compared with the intrinsic transport motion across the<br />
field lines, such that the electrons recognize the static perturbation [3].<br />
In contrast, ions only recognize the resulting electrostatic perturbation.<br />
Perturbed potentials of order 8/Ta ~ 1 around the magnetic isl<strong>and</strong>s<br />
are large enough to greatly enhance the isl<strong>and</strong> circulation rate of the<br />
ions.<br />
Experiments have been carried out with ECH on TEXT, using<br />
200 kW of 60 GHz gyrotron power at the source. A significant enhancement<br />
of the RID head pressure is obtained with ECH resonant at the<br />
center of the discharge. Investigations are underway to underst<strong>and</strong> this<br />
combined effect.<br />
ACKNOWLEDGMENTS<br />
This is a report of work sponsored in part by the U.S. Department<br />
of Energy under Contract Nos. DE-AC03-84ER53158, DE-AC05-<br />
78ET53043, <strong>and</strong> DE-AC05-85ER53193.<br />
REFERENCES<br />
[1] KARGER, F., LACKNER, K., Resonant helical divertor, Phys.<br />
Lett. 61A (1977) 385.<br />
[2] OHYABU, N., deGRASSIE, J.S., EVANS, T.E., Model for divertor<br />
function in H-xnode onset <strong>and</strong> proposal for H-mode operation with<br />
the isl<strong>and</strong> divertor, J. Nucl. Mater. 145-147 (1987) 844.<br />
[3] OHYABU, N., deGRASSIE, J.S., BROOKS, N., TAYLOR, T.,<br />
IKEZI, H., et a/., Ergodic magnetic layer experiment, Nucl. Fusion<br />
21 (1985) 669.<br />
[4] deGRASSIE, J.S., OHYABU, N., BROOKS, N.H., GENTLE, K.W.,<br />
BENGTSON, R., et a/., Ergodic magnetic Kmiter experiments on<br />
TEXT with a 7/3 resonance, J. Nucl. Mater. 128&129 (1984) 266.<br />
[5] WOOTTON, A.J., BENGTSON, R.D., BOEDO, J.A., BRAV-<br />
ENEC, R.V., EMPSON, K.L., et ai., Partide <strong>and</strong> thermal transport,<br />
<strong>and</strong> resonant Held experiments in TEXT in Plasma Physics<br />
<strong>and</strong> Controlled <strong>Nuclear</strong> Fusion Research 1986 (Proc. 11th Int. Conf.<br />
Kyoto, 1986), vol. 1, <strong>IAEA</strong>, Vienna (1987) p. 187.<br />
[6] EVANS, T.E., deGRASSIE, J.S., JACKSON, E.L., OHYABU, N.,<br />
Experiments to test an intr&-isl<strong>and</strong> scoop limiter on TEXT, J. Nucl.<br />
Mater. 145-147 (1987) 812.
<strong>IAEA</strong>-CN-50/A-VI-2-2<br />
RESONANT HELICAL DIVERTOR EXPERIMENT<br />
USING LARGE m/n = 3/1, 4/1 ISLANDS IN THE<br />
JIPP T-IIU TOKAMAK<br />
T.E. EVANS 1 , K. ADATI, A. ANDO, D.R. BAKER 1 ,<br />
J.S. DeGRASSIE 1 , H.R. GARNER 1 , Y. HAMADA,<br />
S. HIDEKUMA, A.M. HOWALD 1 , K. IDA, O. KANEKO,<br />
K. KAWAHATA, S. KITAGAWA, T. KUMAZAWA,<br />
T. KURODA, A.W. LEONARD 1 , K. MASAI, K. MATSUURA,<br />
A. MOHRI, S. MORITA, Y. OGAWA, S. OKAMURA, T. OZAKI,<br />
L.S. PERANICH 1 , M. SAKAMOTO, K.N. SATO,<br />
S. TANAHASHI, K. TOI, Y. TOMITA, T. WATARI, H. YAMADA,<br />
K. YAMAZAKI, <strong>and</strong> the ICRF, NBI <strong>and</strong> NTX OPERATION GROUPS<br />
Institute of Plasma Physics,<br />
Nagoya University,<br />
Nagoya, Japan<br />
Abstract<br />
RESONANT HELICAL DIVERTOR EXPERIMENT USING LARGE m/n = 3/1, 4/1 ISLANDS IN<br />
THE JIPP T-IIU TOKAMAK.<br />
The object of the Helical Isl<strong>and</strong> Divertor Experiment (HIDEX) on the JIPP T-IIU<br />
tokamak is to examine the effects of placing a pump limiter in a 3/1 or 4/1 magnetic isl<strong>and</strong> generated<br />
near the plasma edge by two toroidally localized m = 3 multipole coils. The HIDEX tests whether this<br />
divertor geometry can act to increase the removal efficiency of the pump limiter, while simultaneously<br />
reducing the heat load to the blade edges. Experimentally, it is found that, when an isl<strong>and</strong> 0-point surrounds<br />
the HIDEX Umiter blade, the heat load <strong>and</strong> plasma recycling on the blade edges <strong>and</strong> front face<br />
are reduced, the recycling at the neutralizer surface behind the limiter increases <strong>and</strong> the carbon impurities<br />
in the plasma are reduced.<br />
The Helical Isl<strong>and</strong> Divertor Experiment ( HIDEX ) on the JIPP<br />
T-IIU tokamak is a test of a resonant helical divertor ( RHD )<br />
concept first proposed by Karger <strong>and</strong> Lackner[l] <strong>and</strong> tried (on a<br />
small scale) on TEXT[2]. When the blade of a pump limiter is<br />
inserted into the O-point of a magnetic isl<strong>and</strong>, field lines that<br />
make up the isl<strong>and</strong> boundary are diverted around the blade.<br />
Particles following these field lines can then be removed by<br />
pumping, while the heat load to the limiter blade is reduced.<br />
General Atomics, San Diego, California 92138-5608, United States of America.<br />
347
348<br />
EVANS et al.<br />
JIPP T-IIU ( minor radius = 0.25 m, major radius R = 0.93 m,<br />
toroidal field B. < 3 T, plasma current I < 300 kA ) is equipped<br />
with two sets of toroidally localized m = 3 multipole field<br />
coils. These coil currents produce a magnetic perturbation<br />
mainly composing of m/n = 3/1, 2/1, 2/2 <strong>and</strong> 4/1 modes [3] which<br />
resonate with certain rational q surfaces in the plasma,<br />
resulting in large magnetic isl<strong>and</strong>s at q = 3 <strong>and</strong> q = 4 near the<br />
plasma edge (Fig.l). Rough measurements of the isl<strong>and</strong> widths are<br />
in agreement with numerical field line mappings that predict<br />
values of 15 ~ 25 mm for m/n = 3/1 or m/n = 4/1 isl<strong>and</strong>s<br />
for typical operationing conditions of I = 250 kA, B = 2.7 T<br />
<strong>and</strong> a helical current I, = 6 kA. These widths are more than 10<br />
times the Larmor radius of D present near the edge. The HIDEX<br />
pump limiter head has a curved graphite blade ( 10 mm thick, 220<br />
mm poloidal by 160 mm toroidal ) which is designed to fit inside<br />
these isl<strong>and</strong>s <strong>and</strong> acts as the main limiter for the plasma.<br />
-180<br />
POLOIDAL ANGLE<br />
m/n = 4/1<br />
ISLAND<br />
m/n = 3/1<br />
ISLAND<br />
FIG. 1. Magnetic field mapping showing the formation of m/n = 3/1 <strong>and</strong> 4/1 magnetic isl<strong>and</strong>s near<br />
the plasma edge. Plasma parameters are B, = 2.4 T, Ip = 170 kA <strong>and</strong> Ik = 6 IcA.
( b )<br />
900 1<br />
- 1200-<br />
1100-<br />
S iooo-<br />
S 900-<br />
o 600-<br />
700<br />
500<br />
<strong>IAEA</strong>-CN-50/A-VI-2-2 349<br />
200 -tOO 600<br />
TIME (ms)<br />
200 400 600<br />
TIME (ms)<br />
• - no helical field<br />
X - x-polnt on head<br />
0 - 0-po1nt on head<br />
at q • 3 resonance<br />
S00 (000<br />
X-ooint on head<br />
0-ooint on head<br />
at Q = 3 resonance<br />
with NBI<br />
BOO 1000<br />
FIG. 2. Comparison of surface temperatures of midplane limiter blade edge (ion drift side) for<br />
m/n = 311 isl<strong>and</strong> X- <strong>and</strong> O-points on limiter blade <strong>and</strong> for Ih = 0. (a) For Ohmic heating, the blade<br />
temperature is much higher for the X-point or Ih = 0 cases than for the 0-point case, (b) With NBI auxiliary<br />
heating, X-point operation is again hotter although the differences are not so great.<br />
The temperature rise of the HIDEX limiter blade edge, as<br />
measured with an infrared video camera, is much less when the<br />
O-point of an isl<strong>and</strong> surrounds the blade than when I. is zero or<br />
reversed to produce an isl<strong>and</strong> X-point at the blade. Figure 2(a)<br />
compares the temperatures for operations with I. = +6 <strong>and</strong> 0 kA<br />
with ohmic heating only <strong>and</strong> a q value at the blade of q = 3.<br />
Figure 2(b) is a comparison between two shots with an additional<br />
100 ms of net 500 kW NBI auxiliary heating. The 0-point<br />
operation again results in a lower blade temperature although the<br />
difference with the X-point is smaller. For operation with the
350 EVANS et al.<br />
FIG. 3. High speed video photographs of the HIDEX limiter head in total visible light from the electron<br />
drift side: (a) for the limiter blade centred in an m/n = 4/1 isl<strong>and</strong> 0-point; <strong>and</strong> (b)for the blade centred<br />
in an X-point. The light is much brighter <strong>and</strong> located in the centre part of the head for the X-point case.<br />
blade between isl<strong>and</strong>s ( e.g., q = 3.5 ), little or no difference<br />
in temperature is observed. The plasma density <strong>and</strong> carbon<br />
radiation strongly increase during the time the X-point is on the<br />
limiter, probably due to ablation of carbon from the limiter.<br />
The lack of a corresponding increase in oxygen radiation also<br />
indicates that the carbon is coming from the pump limiter rather<br />
than the impurity gases adsorbed on the other surfaces of the<br />
vacuum chamber. In other cases, however, there is no<br />
significant change in the amount of carbon in the plasma. These<br />
results verify that the heat load to the blade is minimized when<br />
the blade is set inside the 0-point.<br />
A high speed video camera with various interference filters<br />
is also used to view the HIDEX limiter head during plasma<br />
discharge. Photographs in Fig.3 are taken in total visible<br />
light, averaged for 10 ms beginning 200 ms into discharge. For<br />
Fig.3(a) the 0-point of a 4/1 isl<strong>and</strong> is centered on the limiter,<br />
<strong>and</strong> for Fig.3(b) the X-point is on the same location. The<br />
visible light signal is brightest at the middle part of the blade<br />
in the X-point case, confirming that the pattern of outward power
<strong>IAEA</strong>-CN-50/A-VI-2-2 351<br />
flow by plasma particles is changed by the formation of<br />
isl<strong>and</strong> <strong>and</strong> concentrated in the region around the X-point. The<br />
presence of a 3/1 isl<strong>and</strong> on the limiter has the same effect.<br />
A D detector viewing the limiter blade from the rear shows<br />
a<br />
a noticeably bigger signal ( i.e., greater recycling at the<br />
neutralizer surface behind the limiter ) for the 4/1 isl<strong>and</strong><br />
0-point on the blade than for an O-point which is slightly<br />
displaced radially inward. The plasma temperatures ( T^ , Tg )<br />
<strong>and</strong> their profiles are not greatly different for operations with<br />
<strong>and</strong> without the helical field perturbation. When the HIDEX<br />
limiter is inserted, Ti, Cr <strong>and</strong> Fe K -line intensities become<br />
a<br />
very weak probably due to less interaction between the core<br />
plasma <strong>and</strong> the vessel wall. The helical field perturbation<br />
suppresses naturally occurring small MHD activity <strong>and</strong> flattens the<br />
frequency spectrum, which is peaked at the m/n = 2/1 mode when<br />
the helical field is zero.<br />
In conclusion, large magnetic isl<strong>and</strong>s are formed in the edge<br />
of the JIPP T-IIU plasma by the resonant interaction of the<br />
external helical field with the q = 3 <strong>and</strong> q = 4 flux surfaces.<br />
Surrounding the HIDEX limiter blade with the O-point of one of<br />
these isl<strong>and</strong>s changes the outward power flow from the core<br />
plasma, resulting in less heat load to the blade than when<br />
isl<strong>and</strong>s are not present.<br />
ACKNOWLEDGEMENT<br />
This is a report of work in Japan-U.S. Fusion Collaboration<br />
Program, sponsored by the U.S. Department of Energy under<br />
Contract No. DE-AC03-84ER51044 <strong>and</strong> the Japanese Ministry of<br />
Education.
352 EVANS et al.<br />
REFERENCES<br />
[1] KARGER, F., LACKNER, K., Phys. Lett., A 61 (1978) 385.<br />
[2] EVANS, T.E., DeGRASSIE, J.S., JACKSON, G.L., OHYABU, N., J. Nucl. Mater. 145-147<br />
(1986) 812.<br />
[3] YAMAZAKI, K., et al., in Plasma Physics <strong>and</strong> Controlled <strong>Nuclear</strong> Fusion Research 1986 (Proc.<br />
12th Int. Conf. Kyoto, 1986), Vol. 1, <strong>IAEA</strong>, Vienna (1987) 309.
INVESTIGATIONS ON THE MT-1 TOKAMAK<br />
<strong>IAEA</strong>-CN-50/A-VI-3-1<br />
J.S. BAKOS, G. BURGER, I.B. FOLDES, P.E. GIESE,<br />
D. HILDEBRANDT 1 , P.N. IGNACZ, S. KALVIN,<br />
L.N. KHIMCHENKO 2 , L. KOLTAI, F. PASZTI, G. PETRAVICH,<br />
J. SZIGETI, D. VENZKE 1 , L. WEIXELBAUM 1 , V. WENZEL 1 ,<br />
S. ZOLETNIK<br />
Central Research Institute for Physics,<br />
Budapest, Hungary<br />
Abstract<br />
INVESTIGATIONS ON THE MT-1 TOKAMAK.<br />
The intensity of the impurity atomic line measured in the instrumented limiter chamber is used<br />
to determine the impurity containment time. By using the scaling law for the impurity containment time,<br />
Zeff can be determined. Measurement of the radial distributions of plasma ions <strong>and</strong> impurities in the<br />
scrape-off layer shows a strong coupling between the transports of the different particles. MicroChannel<br />
plate (MCP) based tokamak soft X-ray diagnostics have been built <strong>and</strong> operated successfully. Special<br />
features of the disruptive instabilities are observed, owing to the extended energy sensitivity from the<br />
UV region to a few keV.<br />
1. INTRODUCTION<br />
The MT-1 tokamak is a small research tokamak with a restricted number of<br />
access ports. The main characteristics of the tokamak are: R
354 BAKOS et al.<br />
The radiation of the different atoms can be observed in front of the neutralizing<br />
plate (Fig. 1) projecting this volume on the entrance slit of a monochromator <strong>and</strong><br />
using a photomultiplier.<br />
A laser blow-off burst of sodium atoms is injected into the plasma edge at an<br />
angle of 180° toroidally <strong>and</strong> poloidally, relative to the position of the limiter. The<br />
place of the deposition of the non-intrinsic impurity ions can be calculated by using<br />
the electron density distribution measured also by the blow-off burst of atoms [2],<br />
the centre of mass <strong>and</strong> the thermal velocity of the burst.<br />
If the non-intrinsic ions are deposited inside the limiter radius, the ions penetrate<br />
into the core plasma <strong>and</strong> are subsequently ionized. Afterwards, the multiple charged<br />
ions effuse into the edge plasma where they are accelerated to the limiter chamber.<br />
If the ions are deposited mainly in the scrape-off layer (SOL), they diffuse along the<br />
field lines straight into the limiter.<br />
In our case, the impurity ions are deposited by the blow-off burst inside the<br />
limiter radius.<br />
An increase in the intensity (light signal) of the sodium atom resonance line in<br />
the limiter chamber indicates the arrival of the injected ions.<br />
The light signal (V) in the limiter chamber is delayed by about one millisecond<br />
relative to the time of injection (t,) <strong>and</strong> decreases exponentially (Fig. 2). The<br />
e-folding time varies in the ms region, depending on the plasma conditions. By using<br />
the scaling law for the impurity confinement time [3], Zeff can be calculated; it is<br />
found to be 1.8-2.5, which are reliable values.<br />
3. COLLECTOR PROBE MEASUREMENTS<br />
Particle fluxes of the background plasma ions <strong>and</strong> of the impurities at the plasma<br />
edge have been examined by a bidirectional solid probe which could be positioned<br />
by using a sample transfer system in the SOL plasma at the torus top side that is toroidally<br />
opposite to the active sector limiter [4]. In addition to the intrinsic particle<br />
fluxes, those of the test impurities which were injected by laser blow-off [5] or from<br />
a biased erosion probe [4] have been investigated.<br />
The following observations were made: At this location there exists only a slight<br />
toroidal asymmetry of the particle fluxes of the background plasma ions <strong>and</strong> the<br />
injected impurities which is generally less than 30% (Fig. 3).<br />
These particle fluxes decayed radially with an e-folding length of 12 mm. The<br />
similar directional <strong>and</strong> radial dependence of the fluxes of the background plasma ions<br />
<strong>and</strong> the injected impurities indicates that impurity transport at the plasma edge is<br />
strongly coupled to the dynamics of the background plasma [6].<br />
For many exposures, the intrinsic impurities showed a behaviour that is quite<br />
similar to that of the test impurities <strong>and</strong> background plasma ions for many exposures.<br />
However, there were also cases for which deviations from this behaviour occurred.<br />
These deviations can be attributed to direct transport of local impurity influxes from
<strong>IAEA</strong>-CN-50/A-VI-3-1<br />
>v<br />
MPL J{_<br />
FIG. I. Instrumented limiter with optical observation. NPI <strong>and</strong> NP2 are the neutralizing plates of the<br />
ion <strong>and</strong> the electron side, respectively. MON: monochromator; MPL: photomultiplier.<br />
logV<br />
3<br />
2<br />
1<br />
0<br />
-1<br />
-2<br />
-3<br />
•<br />
-<br />
•<br />
•<br />
3 1<br />
I . -<br />
2 3 4 5 6 7 8 9 10 11 12<br />
t[ms]<br />
FIG. 2. Intensity of optical atomic line of injected impurity atom versus time in the instrumented limiter<br />
chamber in front of the neutralizing plate.<br />
the wall to the collector probe [6]. The cause of the temporary occurrence of these<br />
local influxes is not yet clear.<br />
4. SOFT X-RAY MEASUREMENTS USING MCP DETECTORS<br />
The internal structure of a tokamak plasma can be well analysed by measuring<br />
its soft X-ray radiation along different chords.<br />
-<br />
-<br />
-<br />
355
356 BAKOS et al.<br />
<<br />
+ s<br />
5<br />
2<br />
1<br />
5<br />
2<br />
10"<br />
injected Pt<br />
injected Na<br />
75 80 85 90 95 100<br />
r/mm<br />
o<br />
"a<br />
10<br />
10<br />
10<br />
10*<br />
Fe<br />
Mo<br />
75 80 85 90 95 100<br />
r/mm<br />
FIG. 3. Radial distribution of plasma ions (H + ), injected impurities (Pt <strong>and</strong> Na) <strong>and</strong> intrinsic impurities<br />
(Fe <strong>and</strong> Mo) in the scrape-off layer of the MT-1 tokamak.<br />
In small tokamaks the electron temperature is usually a few hundred eV; thus<br />
the sensitivity in the low energy range, along with the small size of the detector system,<br />
is important. Choosing detectors the solution to this dem<strong>and</strong> dem<strong>and</strong> can be the<br />
microchannel plate (MCP) detector [7]. With one MCP detector, the soft X-ray radiation<br />
can be measured along ten to twenty chords. By carefully adjusting the conditions<br />
of measurement a time resolution of a few ps can be reached.<br />
In the soft X-ray pinhole camera using MCP as detector the radiation emitted<br />
from the plasma goes through a thin (0.7-3 pxa) aluminium foil <strong>and</strong> is projected to<br />
the MCP detector by a small aperture. The MCP converts an incident photon to<br />
several electrons. These electrons are collected by the anodes. The output signals are<br />
digitized <strong>and</strong> stored in a minicomputer.<br />
The measured soft X-ray radiation distributions are shown in Fig. 4 for a stable<br />
tokamak discharge at a fixed instant of time. The different curves represent different<br />
absorber foils. The peak emissivity is normalized. The distribution is more peaked<br />
for thicker foils, showing an increasing temperature towards the centre of the plasma<br />
column. Although for 0 <strong>and</strong> 0.7 /tm foils the detector is sensitive to the radiation<br />
below a few hundred eV, for normal tokamak discharges the radiation is this range<br />
of energies is proportional to the higher energies; thus the measured distribution<br />
resembles the one measured by silicon detectors.<br />
The situation changes if disruptive instabilities are present. During such instabilities<br />
the MCP detector measures substantially different signals. At the moment of<br />
the disruption, usually a large flash is observed. This flash is more pronounced for
<strong>IAEA</strong>-CN-50/A-VI-3-1 357<br />
10 12<br />
No. chord<br />
FIG. 4. Measured line integrated emissivity distributions using different Al absorber foils for stable<br />
tokamak discharge. The curves are normalized to the peak values. The tokamak centre lies between<br />
chords 6 <strong>and</strong> 7; chords I <strong>and</strong> 12 are displaced 5 cm from the centre.<br />
t[ms)<br />
ttms]<br />
FIG. 5. Measured soft X-ray signals for silicon <strong>and</strong> MCP detectors of a tokamak discharge with<br />
periodic disruptions.<br />
thinner absorber foils but can be observed even for 3 (im foil. The silicon detector<br />
soft X-ray measurements showed these flashes only in some special cases with small<br />
amplitude. For 0 <strong>and</strong> 0.7 jtm foils, the signals much more resemble the bolometric<br />
total radiation signals than the silicon detector signals. This shows that a significant<br />
part of the total radiated power comes in the low energy range during disruptions.<br />
This is illustrated in Fig. 5.<br />
The time resolution of the MCP soft X-ray diagnostics has been estimated on<br />
the basis of the measured photon statistics. In the given geometry, this turned out<br />
to be a few ps. Placing the MCP detector closer to the plasma time resolution of 1 (is<br />
could be obtained. During the first experiments, 25-30 kHz disruption precursor<br />
oscillations were measured.
358 BAKOS et al.<br />
REFERENCES<br />
[1] BAKOS, J.S., et al., to be published in Rev. Sci. Instrum.<br />
[2] BAKOS, J.S., et al., to be published in Plasma Phys. Contrail. Fusion.<br />
[3] BLACKWELL, B., et al., in Plasma Physics <strong>and</strong> Controlled <strong>Nuclear</strong> Fusion Research 1982<br />
(Proc. 9th Int. Conf. Baltimore, 1982), Vol. 2, <strong>IAEA</strong>, Vienna (1983) 27.<br />
[4] BAKOS, J.S., et al., in Plasma-Surface Interaction in Controlled Fusion Devices (Proc. 8th<br />
Int. Conf. Jiilich, 1988), to be published.<br />
[5] BAKOS, I.S., et al., ibid.<br />
[6] HILDEBRANDT, D., BAKOS, J.S., PETRAVICH, G., to be published in Plasma Phys.<br />
Controll. Fusion.<br />
[7] WIZA, J.L., Nucl. Instrum. Methods 162 (1979) 587.
<strong>IAEA</strong>-CN-50/A-VI-3-2<br />
EDGE TURBULENCE DURING THE COMBINED<br />
LOWER HYBRID/OHMIC HEATING REGIMES<br />
ON THE CASTOR TOKAMAK<br />
J. STOCKEL, L. KRYSKA, J. BADALEC, F. ZACEK,<br />
J. DATLOV, K. JAKUBKA, V. KOPECKY, P. MAGULA,<br />
M. VALOVIC, S. NANOBASHVILI 1 , M.G. SHATS 2<br />
Institute of Plasma Physics,<br />
Czechoslovak Academy of <strong>Sciences</strong>,<br />
Prague, Czechoslovakia<br />
Abstract<br />
EDGE TURBULENCE DURING THE COMBINED LOWER HYBRID/OHMIC HEATING<br />
REGIMES ON THE CASTOR TOKAMAK.<br />
An electrostatic turbulence of the edge plasma is studied on the CASTOR tokamak by a triple<br />
Langmuir probe with an analog correlator, allowing the levels of density <strong>and</strong> poloidal electric field<br />
fluctuations to be monitored, together with a radial turbulent flux. A significant stabilization of the<br />
fluctuations during the combined lower hybrid/inductive current drive regime (LHCD/OH) suggests an<br />
improvement of particle confinement. This is independently supported by spectroscopical data,<br />
indicating a substantial enhancement of the global particle confinement time (~2x) during the<br />
LHCD/OH part of the discharge.<br />
1. INTRODUCTION<br />
Recent OH tokamak experiments (e.g. in Ref. [1]) suggest a close correlation<br />
between edge particle transport <strong>and</strong> electrostatic turbulence. The radial turbulent<br />
particle flux, T = , caused by cross-field drift 5vr = 6Ep/B, (Sn, Svr, 5Ep<br />
are fluctuating parts of the plasma density, radial particle velocity <strong>and</strong> poloidal electric<br />
field respectively, Bt is the toroidal magnetic field) has been found to be<br />
directed outward. The turbulent flux T at r = a is comparable to the total radial<br />
particle flux through the outermost closed magnetic surface rspec = an
360 STfiCKEL et al.<br />
A quantitative improvement in particle confinement has been observed on the<br />
CASTOR tokamak as well [4], together with a simultaneous decrease in the level of<br />
electrostatic turbulence. The experimental evidence of these facts is reported here in<br />
greater detail.<br />
2. EXPERIMENTAL ARRANGEMENT<br />
The experiment was performed on the CASTOR tokamak (R = 40 cm,<br />
a = 8.5 cm are the major <strong>and</strong> minor radii, r = 9 ms is the pulse length). Electrostatic<br />
fluctuations were studied in the regime with a toroidal magnetic field of<br />
B, = 1 T <strong>and</strong> plasma current of Ip = 12 kA. The operation without pulsed gas<br />
puffing is preferred to reach a reproducible low density regime (n
3<br />
Q.<br />
I I I I<br />
<strong>IAEA</strong>-CN-50/A-V1-3-2 361<br />
(a) b )<br />
•»»<br />
,01)<br />
><br />
a<br />
1.5<br />
1.0<br />
0.5 0<br />
20<br />
15<br />
10<br />
0<br />
5.0<br />
's<br />
» 2.5<br />
A<br />
- jx \OH<br />
\ A<br />
J<br />
i<br />
" • /V"•}<br />
•....'• >^<br />
I<br />
>.LHCD/OH<br />
^LHCD/OH<br />
4<br />
t Ims)<br />
F/G. 7. Typical time evolutions during LHCD/OH regimes. The dotted lines correspond to pure OH<br />
regimes:<br />
(a) Uloop — loop voltage, ne — line average density, Ha — intensity ofH-alpha spectral line.<br />
(b) a, Ep are root mean square values of density <strong>and</strong> poloidal electric field fluctuations; T is the<br />
turbulent flux. The triple probe was located at the bottom of the torus at r = 85 mm (limiter radius).<br />
the electrostatic fluctuations in the edge particle transport on the CASTOR tokamak.<br />
However, in the case of CASTOR, the quantitative comparison is rather complicated<br />
because of the poloidal asymmetry of the turbulent flux, as the turbulent flux measured<br />
at the bottom part of the torus T b (a) (Fig. l(b)) is roughly one third the flux<br />
T'(a) measured at the top part. Therefore, the comparison can only be made after<br />
rough averaging of T(a) in the poloidal plane T(a) = (r'(a) + T b (a)/2 s 2 r b (a).<br />
The satisfactory agreement between T(a) <strong>and</strong> rspec suggests that electrostatic turbulence<br />
should represent an important contribution to particle transport in the edge<br />
plasma of the CASTOR tokamak.
362 STOCKEL et al.<br />
This <strong>and</strong> other features of the OH edge turbulence in CASTOR are similar to<br />
features observed in other low-/3 tokamak plasmas [1].<br />
LHCD/OH discharge: After applying additional RF power to the OH target<br />
plasma, typically more than one half the plasma current is driven by LH waves. This<br />
is demonstrated in Fig. l(a) by a decrease in the loop voltage. Simultaneously, the<br />
density decay is substantially reduced during the combined LHCD/OH phase of the<br />
discharge. Spectroscopic data indicate that neither a neutral influx (from the wall,<br />
limiters or the RF antenna) nor an additional ionization of impurity ions is responsible<br />
for this behaviour of the density. Therefore, the effect of density stabilization is<br />
assumed to be the result of an enhancement of the global particle confinement time<br />
by a factor of two. The improvement of the particle confinement was independently<br />
deduced from a decrease in the density gradient scale length Ln at the plasma edge<br />
during LHCD/OH [5].<br />
At the same time, the levels of fluctuation <strong>and</strong>, consequently, the turbulent flux<br />
decrease substantially during LHCD/OH (Fig. l(b)). This is consistent with the<br />
improvement of the global particle confinement time. At present, it is, however,<br />
difficult to compare the suppression of fluctuations <strong>and</strong> the improvement of confinement<br />
more quantitatively, as the turbulent flux F(a) was available only at one poloidal<br />
angle, for the LHCD/OH regimes.<br />
It should be emphasized here that edge turbulence suppression is found to be<br />
approximately independent of the mutual position of triple probe <strong>and</strong> RF antenna.<br />
Hence, the effect is supposed to be toroidally symmetric.<br />
3.2. Characteristic features of edge turbulence during LHCD/OH<br />
At present, we cannot explain the observed effect without being too speculative.<br />
Therefore, in this subsection, we present only a brief, point by point, summary<br />
of the experimental results, which may contribute to some underst<strong>and</strong>ing of the<br />
mechanism of edge turbulence suppression during LHCD/OH:<br />
(1) In addition to the decrease in the fluctuation levels, a decrease in the correlation<br />
between density <strong>and</strong> Ep fluctuations is observed. The cross-correlation coefficient<br />
CnE = Bt r/fiEp decreases from -0.3 (OH value) to -0.2 (LHCD/OH<br />
value).<br />
(2) The suppression of density fluctuations as measured by a microwave scattering<br />
(MS) technique is generally less pronounced than the Langmuir probe data<br />
(Fig. 2). This may indicate that, in particular, low wavenumber fluctuations are<br />
affected during LHCD/OH since in our case the MS device only monitors<br />
density fluctuations with k± > 6 cm" 1 . .<br />
(3) The relative drop of the poloidal electric field fluctuations during LHCD/OH,<br />
defined as<br />
A =1 - Ep RF /E° H
6 m<br />
/<br />
<strong>IAEA</strong>-CN-50/A-V1-3-2 363<br />
I N<br />
1<br />
/<br />
V-OH<br />
V-<br />
V-.<br />
'•••' -OH<br />
t (ms)<br />
-LHCD/OH<br />
1 1<br />
FIG. 2. Suppression of density fluctuations as seen by microwave scattering (Ps curve) <strong>and</strong> by the<br />
Langmuir probe (H 2 (a) curve). Both diagnostics see the top part of the torus. The MS data correspond<br />
to the wavenumber k± = 6 cm' 1 . The time evolution of the local electron density (ne(a)} is shown for<br />
comparison.<br />
(for the meaning of Ep F>0H see Fig. 3(a)) shows a broad maximum in the<br />
limiter region (Fig. 3(b)). It should be noted that the relative drop of the Ep<br />
fluctuations decreases smoothly towards the plasma centre. This demonstrates<br />
that the suppression of Ep fluctuations takes place inside an essential portion of<br />
the plasma edge.<br />
(4) The spectral characteristics of the edge turbulence during the LHCD/OH<br />
regime are shown in Fig. 4. The Ep fluctuations <strong>and</strong> the radial turbulent flux<br />
are suppressed in a broad frequency range while the density fluctuations<br />
are suppressed only in the lower part of the frequency spectrum<br />
(
364 STOCKEL et al.<br />
15<br />
I 10<br />
"" 5<br />
0<br />
(a)<br />
4 6<br />
t (msl<br />
10<br />
1.0<br />
0.8<br />
0.6<br />
0.4<br />
0.2<br />
100 90 30<br />
r (mm)<br />
FIG. 3. (a) Example for the time evolution of the root mean square values of Ep fluctuation for the<br />
definition of the relative drop of fluctuation level AEp during LHCD/OH:<br />
AEp = 1 - EflE° H<br />
Analogous definitions exist for An <strong>and</strong> AT.<br />
(b) Radial profile of relative drop of Ep fluctuation level.<br />
1.0 r-<br />
100 200<br />
w/2n (kHz)<br />
FIG. 4. Relative drop of density An <strong>and</strong> poloidal electric field AEp fluctuations, together with relative<br />
drop of turbulent flux AT versus frequency. Measurements are shot by shot, using a b<strong>and</strong>pass filter with<br />
W/2TT = 30 kHz.<br />
300<br />
70
a.<br />
15<br />
10<br />
<strong>IAEA</strong>-CN-50/A-VI-3-2 365<br />
s<br />
4 5<br />
t (ms)<br />
F/G. 5. Temporal evolution of level of magnetic fluctuations measured in 35-65 kHz frequency range.<br />
is an average of signals from a complete array of Mirnov coils.<br />
4. CONCLUSIONS<br />
The suppression of edge electrostatic turbulence is proposed as a c<strong>and</strong>idate<br />
for the improvement of particle confinement, which is routinely observed on the<br />
CASTOR tokamak during combined lower hybrid/inductive current drive. However,<br />
underst<strong>and</strong>ing the turbulence suppressing mechanism needs additional data on edge<br />
turbulence in this regime of operation.<br />
REFERENCES<br />
[1] ROWAN, W.L., et al., Nucl. Fusion 27 (1987) 1105.<br />
[2] ALIKAEV, V.V., et al., Fiz. Plazmy 11 3 (1985) 53.<br />
[3] MAYBERRY, M.J., CHEN, K.I., LUCKHARDT, S.C., PORKOLAB, M., Phys. Fluids 30<br />
(1987) 2288.<br />
[4] STOCKEL, J., KRYSKA, L., ZACEK, F., NANOBASHVILI, S., Comments on Edge Turbulence<br />
During Lower Hybrid Current Drive on CASTOR Tokamak, Rep. IPPCZ-279, IPP Czech.<br />
Acad. Sci., Prague (March 1988); additional references concerning the CASTOR tokamak can<br />
be found in this report.<br />
[5] GUNTHER, K., et al., "Edge density profile in the CASTOR tokamak using a thermal lithium<br />
beam", Proc. 8th Conf. on Plasma-Surface Interaction, Jiilich, 1988.<br />
[6] PARLANGE, F., et al., in Controlled Fusion <strong>and</strong> Plasma Physics (Proc. 12th Eur. Conf.<br />
Budapest, 1985), Vol. 9F, Part U, European Physical Society (1985) 244.<br />
1
GLOBAL POWER BALANCE AND<br />
LOCAL HEAT TRANSPORT IN JET<br />
<strong>IAEA</strong>-CN-50/A-VII-l<br />
A. TARONI, B. BALET, G. BETELLO, V.P. BHATNAGAR,<br />
J.P. CHRISTIANSEN, J.G. CORDEY, G. CORRIGAN, S. CORTI,<br />
D.F. DUCHS, R. GALVAO 1 , G. GORINI, N. GOTTARDI,<br />
M. VON HELLERMAN, W. HAN, J. JACQUINOT, O. KARDAUN 2 ,<br />
P.P. LALLIA, L. LAURO-TARONI, P.J. LOMAS, D. MUIR,<br />
P.H. REBUT, C. SACK, G.L. SCHMIDT 3 , P. SMEULDERS,<br />
D.F.H. START, T.E. STRINGER, P.R. THOMAS, K. THOMSEN,<br />
F. TIBONE, M.L. WATKINS, H. WEISEN<br />
JET Joint Undertaking,<br />
Abingdon, Oxfordshire,<br />
United Kingdom<br />
Abstract<br />
GLOBAL POWER BALANCE AND LOCAL HEAT TRANSPORT IN JET.<br />
Global energy confinement analysis shows that both off-set linear <strong>and</strong> power law dependences<br />
of energy content versus input power can represent JET data. Results of the analysis are presented for<br />
the bulk <strong>and</strong> for selected subsets of data. Studies of local energy fluxes with both interpretative <strong>and</strong><br />
predictive transport codes show that local transport models implying profile resilience <strong>and</strong>, in particular,<br />
a 'critical gradient' model, lead to satisfactory description of JET results in most regimes. The<br />
limitations of these, as well as of other plasma transport models used to simulate JET discharges, are<br />
pointed out.<br />
1. INTRODUCTION<br />
Several lines are followed at JET to study the crucial issue of<br />
energy confinement. Global energy confinement studies are carried<br />
out on data collected in the JET transport data base. This data<br />
base contains information for most JET discharges, referring to a<br />
wide range of operating conditions [1]. Analysis based on the bulk<br />
of the collected data, <strong>and</strong> on selected data corresponding to<br />
similar operating conditions,have been carried out. Results are<br />
given in Section 2.<br />
A deeper underst<strong>and</strong>ing of the mechanisms of energy confinement<br />
is sought by means of local transport analysis using interpretative<br />
transport codes (ITC). These studies are performed at various<br />
levels of generality <strong>and</strong> complexity, with different codes. We<br />
1 Inst. de Pesquisas Espaciais <strong>and</strong> University of Sao Paulo, Brazil.<br />
2 IPP, Garching, FRG.<br />
3 PPPL, Princeton, New Jersey, USA.<br />
367
368 TARONI et al.<br />
report in Section 3 results of a study of the local heat flux q =<br />
qe + q^ for ICRF heated discharges with long sawtooth-free periods<br />
("monster" sawteeth). In the same Section we shall report on the<br />
analysis of local electron <strong>and</strong> ion heat fluxes qe <strong>and</strong> q^ for a wide<br />
range of plasma regimes.<br />
Predictive transport codes (PTC) have been extensively used at<br />
JET to test models for q <strong>and</strong> q^ . Two kinds of PTC have been<br />
developed <strong>and</strong> used: simplified 1-D steady state <strong>and</strong> complete, timedependent<br />
1%-D (i.e. transport equations coupled to the mhd<br />
equilibrium equation). The steady state approach allows quick<br />
checks of models on a wide range of discharges. More dem<strong>and</strong>ing<br />
tests in time-dependent situations are carried out with complete<br />
PTC's for a subset of representative discharges. Results of<br />
simulations with PTC are reported in Section A.<br />
2. ANALYSIS OF GLOBAL ENERGY CONFINEMENT<br />
JET has extended the parameter range for confinement scaling<br />
studies further than other devices in many directions [1-5], yet<br />
important questions remain open. The first is whether the<br />
dependence of plasma energy content W on total power input P^o1- is<br />
better approximated by a power law:<br />
or by an offset linear law:<br />
W = g (PtQt - dW) 0 , a = 0.5 (1)<br />
W - W ° + W P tot " fjf> («<br />
Here g, W° <strong>and</strong> the incremental confinement time T- C are assumed to<br />
be represented by power laws of relevant global plasma quantities<br />
such as plasma current I , toroidal magnetic field BT, line<br />
(volume) average density n (), major radius R, minor radius a,<br />
plasma elongation K = b/a, etc.<br />
Both assumptions (1) <strong>and</strong> (2) lead to scaling laws for W, or for<br />
the energy replacement time Tg = W/(PtQt - dW/dt), with a similar<br />
goodness of fit to the available data. The best scaling laws<br />
represent the bulk of the experimental values of Tg or W with a<br />
rather large "dispersion" (1 ± 30%). This is mainly due to the<br />
effect of various mechanisms that, in addition to local thermal<br />
transport, contribute to the determination of tg (e.g. sawtooth<br />
activity at low (^ 3) boundary values of the safety factor q^,<br />
different power deposition <strong>and</strong> radiation profiles^etc.). These<br />
mechanisms play a different role in different operating<br />
conditions.<br />
Among the scaling laws derived in the form (1), the Goldston<br />
scaling [6] is in reasonable agreement with JET L-mode data (Fig.<br />
la). An exception is provided by small bore plasmas [5]. JET
0.5 1<br />
r. (s> Goldston<br />
<strong>IAEA</strong>-CN-50/A-VII-l 369<br />
0.5<br />
• 1<br />
4<br />
*<br />
* it)<br />
**<br />
* * *<br />
wh-<br />
0.5 1<br />
. (s) Rebut-Lallia<br />
FIG. 1. Observed confinement time T" versus the one predicted by (a) Goldston scaling <strong>and</strong><br />
(b) Rebut-Lallia scaling. Data refer to the bulk of 1988 discharges with Pwl > 1.1 P0H, excluding<br />
H-modes.<br />
H-mode data can be well represented by assuming tg = 2tg (Goldston)<br />
[3]. However, no clear dependence on the atomic mass of the main<br />
plasma ions is apparent from the analysis of JET global data.<br />
The Rebut-Lallia scaling [7] is of type (2) <strong>and</strong> represents both<br />
ohmic <strong>and</strong> L-mode discharges. Figure lb has been obtained with this<br />
scaling.<br />
It must be noticed that the scaling with the geometrical parameters,<br />
which is different in the Goldston <strong>and</strong> Rebut-Lallia laws,<br />
remains an open question <strong>and</strong> that the dependence of t^nc on plasma<br />
current is being revised (see below).<br />
An improvement in this kind of study is achieved by carrying out<br />
the global energy confinement analysis of selected subsets of<br />
discharges, referring to similar operating conditions. As an<br />
example, the scaling law (2) has recently been investigated for a<br />
set of ICRH power scans in the 1-5 MA current range [8], accounting<br />
for heating efficiency [9] <strong>and</strong> the effect of sawteeth.<br />
For a series of "monster" sawtooth discharges, it is found that<br />
T inc i ncreases l ess than linearly with current (T• c \ I ), while<br />
it saturates or even decreases for I > 3.5 MA, when sawtooth<br />
stabilisation is not obtained <strong>and</strong> sawtooth activity plays a role in.<br />
a wide region.
370 TARONI et al.<br />
100-<br />
q<br />
80-<br />
60-<br />
40-<br />
20-<br />
(a)<br />
0 0 10 20 30 40 50<br />
60<br />
40-<br />
20-<br />
0-<br />
(b)<br />
10 20 30<br />
<br />
FIG. 2. Total heat flux q (kW-m~ 2 ) versus ne(VTe) (U-m' 4 ) for 'monster' cases at 2 MA (open<br />
circles) <strong>and</strong> 3.5 MA (crosses); (a) refers to x = 'A, (b) to x = 3 A.<br />
3. LOCAL ENERGY TRANSPORT ANALYSIS BY MEANS OF INTERPRETATIVE<br />
TRANSPORT CODES<br />
Analysis of Total Heat Flux<br />
Plasma energy transport has been studied for a series of 110-<br />
ICRF heated discharges with "monsters" by means of an ITC<br />
evaluating the total energy flux through electron <strong>and</strong> ion channels.<br />
Power scans at I = BT= 2, 2.5, 3, 3.5 (MA,T) have been considered.<br />
For each scan the ICRH power varies from 2 to 14 MW. Data from<br />
these discharges have been selected at times during sawtooth-free<br />
periods subject to the criterion 0 < g^/Pt0^ < 0.4. The total<br />
local heat flux q is modelled at various radii, x = 1/2, 2/3, 3/4,<br />
x being a normalised radial coordinate, by assuming [9,10]:<br />
q = - n X - q_ (3)<br />
Here q represents a non-diffusive "heat pinch"; ); is a "total"<br />
heat diffusivity <strong>and</strong> is the flux surface average of VTe. The<br />
data derived for the study of (3) show less scatter than the NBI<br />
data used in [10]. Figures 2a <strong>and</strong> 2b are plots of q versus n.<br />
Only data for 2 <strong>and</strong> 3.5MA pulses are shown: Figure 2a corresponds<br />
to local values at the half-radius <strong>and</strong> yields x = 2m 2 /sec without<br />
any appreciable dependence upon current. Figure 2b showing 3/4<br />
radius data reveals, on the other h<strong>and</strong>, a current dependence<br />
X = 7.5/1 (MA) mVsec. This result is confirmed by non-linear<br />
regression analysis <strong>and</strong> is consistent with the result on t^nc for<br />
ICRF discharges mentioned at the end of Section 2. Further<br />
analysis is required to relate it to local theoretical expressions<br />
of electron <strong>and</strong> ion thermal fluxes.
<strong>IAEA</strong>-CN-50/A-VH-l 371<br />
Separate Electron <strong>and</strong> Ion Energy Balances<br />
Analyses of this type have been carried out with the JICS <strong>and</strong><br />
TRANSP codes, which may separate qe <strong>and</strong> q^ either by modelling q^<br />
or by using the available experimental T^ profiles [11]. JICS may<br />
also evaluate local qe <strong>and</strong> q^ predicted by several theoretical <strong>and</strong><br />
empirical models for comparison with the "measured" heat fluxes.<br />
A wide range of plasma regimes is being studied: sawtoothing<br />
L-mode discharges with ICRH, NBI <strong>and</strong> combined heating; discharges<br />
with ICRH off-axis heating; discharges with "monster" sawteeth;<br />
H-mode cases; experiments at I = 3MA with pellet injection.<br />
One general result is that energy transport is anomalous, <strong>and</strong><br />
with a similar spatial dependence for both electron <strong>and</strong> ions. This<br />
result is confirmed by the time-dependent TRANSP code runs for<br />
H-mode <strong>and</strong> hot-ion mode discharges [3,5]. In these cases values of<br />
Xj_ as high as 2xe have been found.<br />
Another result is that in the "monster" sawtooth regime no<br />
significant improvement of the central energy confinement is<br />
observed.<br />
Interesting is the analysis of discharges with pellet injection<br />
where a novel, transient JET plasma regime is observed when strong<br />
additional heating is applied towards the end of the current rise<br />
[A]. Strongly peaked sawtooth-free profiles of Te <strong>and</strong> Ti are<br />
established, with Teo <strong>and</strong> T^o higher than in comparable "monster"<br />
cases. Temperature peaking correlates with density peaking. A<br />
sharp variation of VTe, VT^ (when available) <strong>and</strong> Vne is observed at<br />
a radius x^ = 0.5 (Fig. 3).<br />
Transport analysis shows that the local energy confinement<br />
improves for x < x_ (leading to a 20-30% improvement in the global<br />
value of Tg): both electron <strong>and</strong> ion thermal conductivity are<br />
reduced by a factor 2-3 for x < x^.<br />
It is tempting to relate the observed regime to the suppression<br />
of the so-called n^-mode, as a consequence of density peaking. The<br />
value of n^ is uncertain but, in cases where T^ profiles have been<br />
measured, they are similar to those of Te; thus the evaluation of<br />
n. is likely to be a reliable estimate of n,^, under reasonable<br />
assumptions on the profile of n^. All estimates of n, <strong>and</strong> n^ show<br />
that they reach very low values (< 0.5) just after pellet<br />
injection, increasing gradually in time to values in excess of 3 in<br />
the region x < x^ before the end of the good confinement phase<br />
(Fig. 3). This may indicate that n- exceeds the predicted<br />
threshold limit r\^c without noticeable change in energy transport,<br />
or that r)^c is larger than 1.5, a value usually assumed. Notice<br />
that ne >> 3 for x > x_ in these experiments <strong>and</strong> through almost the<br />
entire plasma cross-section for most JET discharges without<br />
pellets.<br />
Other observations yet to be explained are: the strong reduction<br />
of electron energy transport; the fact that sufficiently vigorous<br />
central heating is required to produce the increase in VTg<strong>and</strong> VT^,<br />
not observed so far with NBI alone; the mhd events at the end of
372 TARONI et al.<br />
3.2 3.4 3.6<br />
Radius (m)<br />
FIG. 3. (a) Experimental profiles ofTe, 7) <strong>and</strong> ne for a pellet shot (17279). Superscript I refers to the<br />
phase of enhanced confinement (t, = 44.6), superscript 2 to the following 'normal' phase (t2 = 45).<br />
TJ is fr om ECE, n[ from Abel inversion of interferometer data; T 2 t <strong>and</strong> n\ are from Lidar (not<br />
available for phase J); TJ <strong>and</strong> if from charge exchange spectroscopy. (b) 'Experimental' thermal<br />
conductivity x = X, + ("jV T/n^V Tjxi <strong>and</strong> values of rje <strong>and</strong> TJ, at R = 3.4, t = t, <strong>and</strong> t2. Similar<br />
values of-r\e <strong>and</strong> ij, are obtained from Lidar data during phase 1 of other discharges. The neoclassical<br />
(Chang-Hinton) value ofxt at t, is given for comparison.<br />
the enhanced confinement phase; the correlation, observed so far,<br />
with the evolution of the current density profile [4].<br />
Comparison of "Experimental" <strong>and</strong> Theoretical Heat Fluxes<br />
A number of models for local energy transport available in the<br />
literature (see [7,12] <strong>and</strong> the references quoted in [13]) has been<br />
compared with experimentally determined heat fluxes, in a series of<br />
ohmic, sawtoothing L-mode <strong>and</strong> "monster" discharges.<br />
Local agreement within a factor of 2 between modelled <strong>and</strong><br />
measured heat flux is accepted as fairly good, keeping in mind the<br />
uncertainties in "experimental" fluxes <strong>and</strong> the strong non-linearity<br />
(e.g. local dependence of xe on VTe) of most theoretical models.<br />
Our results indicate that in the region outside q^ = 1, where<br />
meaningful comparisons are possible, the resistive mhd model (PT<br />
model) [12] <strong>and</strong> the Rebut-Lallia (RL) model [7] predict energy<br />
fluxes in fair agreement with the observed ones. For the RL model,<br />
the discrepancy increases when VTe approaches the local critical<br />
gradient VCT (typically, near the plasma edge), suggesting that the<br />
transition to low transport below VCT might have to be smooth<br />
rather than sudden. In the same region, pure drift wave models<br />
fail to reproduce radial dependence <strong>and</strong> magnitude of the measured<br />
fluxes [13,14], The microinstability-profile consistency model of<br />
Tang [13,15], rescaled by a factor 2 is in agreement with JET<br />
data.
<strong>IAEA</strong>-CN-50/A-VII-l 373<br />
4. SIMULATION OF JET RESULTS WITH PREDICTIVE TRANSPORT CODES<br />
We shall present results obtained with the two transport models<br />
proposed at JET with reference to results from other models. The<br />
RL model [7,12] produces confinement degradation when VTg exceeds a<br />
critical gradient. In the PT model [12,16] confinement degradation<br />
is due to the non-linear dependence of the heat fluxes on the<br />
pressure gradient. In both models Xi = Xe is assumed.<br />
Uncertainties (± 40%) remain in the values of the numerical<br />
constant in the expressions of xe [7,12], determined empirically<br />
<strong>and</strong> kept fixed for all simulations. Notice that the corresponding<br />
variations of the values of xe> Xi <strong>and</strong> TR are lower (= ± 20%), as a<br />
result of the non-linear dependence of the models on gradients of<br />
the temperature profiles.<br />
Results of Computer Simulations<br />
Satisfactory results with both models have been obtained when<br />
simulating ohmic discharges, L-mode discharges, "monster" sawteeth<br />
<strong>and</strong> ICRH off-axis heating cases. They produce resilient Te<br />
profiles in agreement with experiments, without needing ad hoc<br />
modifications, as is the case for models based on drift wave<br />
microinstabilities. The time evolution of global quantities <strong>and</strong><br />
temperature profiles following any modification of the input power<br />
is computed correctly by these models. On the other h<strong>and</strong>, the<br />
"profile consistency" (PC) model in [14] causes a delayed plasma<br />
response especially when power is suddenly switched off. Such a<br />
delay is due to the dependence xe "= J P net e x dx in the PC model,<br />
P being the net power input profile to the electrons. It is<br />
expected that other PC-related models involving a similar<br />
dependence of xe (<strong>and</strong> possibly x±) on tne power deposition [15],<br />
will exhibit similar shortcomings, while being satisfactory for<br />
quasi-steady-state conditions.<br />
The main uncertainties with both RL <strong>and</strong> PT models refer to the<br />
plasma core, <strong>and</strong> show up when attempting to simulate the central<br />
temperature evolution during sawteeth, including "monsters". It is<br />
difficult, however, to establish whether these uncertainties<br />
reflect an intrinsic deficiency of the models or are related to an<br />
inadequate evaluation of quantities such as local shear, nonthermal<br />
component of Vp, local power deposition. Similar problems<br />
appear with most theoretical transport models [13].<br />
As a more dem<strong>and</strong>ing test for the models, we performed complete<br />
simulations of H-mode discharges at I = 2,3 <strong>and</strong> 4 MA, starting from<br />
the ohmic phase. Notice that JET H-modes are non-stationary. The<br />
time evolution of ne has been input from the experimental data<br />
base, while the formation of an edge thermal barrier during the<br />
H-mode has been simulated by transiently increasing the boundary<br />
temperatures Tea, in agreement with a systematic trend in
374 TARONI et al.<br />
t 1st<br />
FIG. 4. Results of simulation ofH-mode discharge at 4 MA. (a) Time evolution of energy content from<br />
models (PT , RL ...) <strong>and</strong> measurements (magnetic , diamagnetic ); (b) Teprofiles at<br />
beginning of H-mode, t = 53.5 (PT , RL .... ECE ).<br />
measurements (a possible model of the edge thermal barrier<br />
consistent with the RL model is given in [17]). The adopted models<br />
determine the time evolution of the bulk plasma. In these cases<br />
(Fig. 4) the critical gradient model seems to perform better than<br />
the PT one.<br />
The equivalent thermal conductivity of the RL model in the<br />
plasma bulk is, during the H-raode, close to its ohmic value. The<br />
somewhat high values of Zj- obtained with Xi = Xe raav indicate that<br />
Xi> Xe> consistent with TRANSP analysis [3]. The model predicts<br />
degradation with increasing power, as experimentally observed, by<br />
the same mechanism as in the L-mode.<br />
No improved confinement in the core region, when density <strong>and</strong><br />
temperature profiles are peaked in the first phase of ICRF heating<br />
following pellet injection, is predicted by RL <strong>and</strong> PT models in<br />
their present formulation. An ad hoc reduction of xe <strong>and</strong> x± by a<br />
factor = 2.5 in the region x < x_ is required for reasonably good<br />
simulations, in agreement with JICS analysis.<br />
PTC simulations show, consistently with ITC results, that the<br />
assumption X± = a Xe with a ~ 1 [18], does allow a proper<br />
simulation of the relevant quantities, e.g. total energy content<br />
W, T^o <strong>and</strong> the available T^ profiles. This remains true (with<br />
reduced xe) even for the pellet experiments with good central<br />
confinement. The uncertainty on a is large (a = 0.5-2). The good<br />
performance of models with x± = a Xe should simply be considered as<br />
a statement that x± i s anomalous, with a radial dependence similar<br />
to that of xe (possibly introducing the same kind of profile<br />
resilience) <strong>and</strong> different from the neoclassical one.
6. CONCLUSIONS<br />
<strong>IAEA</strong>-CN-50/A-VII-l 375<br />
Global energy confinement analysis shows that scaling laws such<br />
as the Rebut-Lallia or the Goldston one allow a fair representation<br />
of JET L-mode results: the question of the dependence of W on<br />
remains open. H-mode data roughly fit a "2 x L-mode" scaling.<br />
The analysis of ICRH discharges shows an incremental confinement<br />
time saturating at the highest currents in JET (I ^ 5MA) as an<br />
effect of sawtooth activity, <strong>and</strong> increasing less than linearly with<br />
current in the absence of sawteeth. Local analysis is consistent<br />
with these results.<br />
Existing transport models fail to reproduce all plasma regimes<br />
found in JET. However, models that imply profile resilience <strong>and</strong><br />
assume x± ~ Xe perform better than others. In particular, the<br />
"critical gradient" model, although it needs to be improved or<br />
completed with other mechanisms in the plasma core, (as shown by<br />
the unpredicted temporary improvement of confinement in pellet<br />
injection cases followed by ICRF), leads to a satisfactory<br />
simulation of most JET regimes <strong>and</strong> can be considered a useful basis<br />
for prediction of tokamak performance.<br />
ACKNOWLEDGEMENTS<br />
We thank A. Galway, B. Keegan, E. Springmann <strong>and</strong><br />
P. Stubberfield for their assistance in the updating <strong>and</strong> use of<br />
the various transport codes. R. Granetz, H. Hamnen, K. Lackner<br />
<strong>and</strong> G.P. Maddison are acknowledged for useful discussions.<br />
REFERENCES<br />
[1] BICKERTON, R.J., et al., Paper <strong>IAEA</strong>-CN-50/A-I-3, these Proceedings, Vol. 1.<br />
[2] REBUT, P.H., et al., Paper <strong>IAEA</strong>-CN-50/D-IV-l, these Proceedings, Vol. 2.<br />
[3] KEILHACKER, M., et al., Paper <strong>IAEA</strong>-CN-50/A-III-2, these Proceedings, Vol. 1.<br />
[4] SCHMIDT, G., et al., Paper <strong>IAEA</strong>-CN-50/A-IV-l, ibid.<br />
[5] THOMAS, P., et al., Paper <strong>IAEA</strong>-CN-50/A-IV-4, ibid.<br />
[6] GOLDSTON, R.J., Plasma Phys. Controll. Fusion 26 (1984) 87.<br />
[7] LALLIA, P.P., REBUT, P.H., WATKINS, M.L., Chaotic Magnetic Topology <strong>and</strong> Heat<br />
Transport on Tokamaks, Rep. JET-P (88) 05 <strong>and</strong> 2nd Eur. Fusion Theory Meeting (Varenna,<br />
Italy, December 1987).<br />
[8] BHATNAGAR, V.P., et al., in Controlled Fusion <strong>and</strong> Plasma Heating (Proc. 15th Eur. Conf.<br />
Dubrovnik, 1988), Vol. 12B, Part I, European Physical Society (1988) 358.<br />
[9] CALLEN, J.C., et al., Nucl. Fusion 27 (1987) 1857.<br />
[10] CHRISTIANSEN, J.P., et al., Nucl. Fusion 28 (1988) 817.<br />
[11] CORTI, S., et al., in Controlled Fusion <strong>and</strong> Plasma Heating (Proc. 15th Eur. Conf. Dubrovnik,<br />
1988), Vol. 12B, Part I, European Physical Society (1988) 127.<br />
[12] THOMAS, P., et al., ibid., p. 115.
376 TARONI et al.<br />
[13] ROSS, D.W., et al., Thermal <strong>and</strong> Particle Transport for Ignition Studies, Rep. DOE/ET-53193<br />
Washington, DC (1987).<br />
[14] DUCHS, D.F., et al., in Plasma Physics <strong>and</strong> Controlled <strong>Nuclear</strong> Fusion Research 1986 (Proc.<br />
11th Int. Conf. Kyoto, 1986), Vol. 1, <strong>IAEA</strong>, Vienna (1987) 325.<br />
[15] TANG, W.M., Nucl. Fusion 26 (1986) 1605.<br />
[16] THOMAS, P., A Comparison between Additional Heating Data <strong>and</strong> Forms with Model Scale<br />
Invariance, JET-P (87) 17.<br />
[17] REBUT, P.H., WATKINS, M.L., LALLIA, P.P., in Controlled Fusion <strong>and</strong> Plasma Heating<br />
(Proc. 15th Eur. Conf. Dubrovnik, 1988), Vol. 12B, Part I, European Physical Society<br />
(1988) 247.<br />
[18] TARONI, A., et al., in Controlled Fusion <strong>and</strong> Plasma Physics (Proc. 14th Eur. Conf. Madrid,<br />
1987), Vol. 1 ID, Part I, European Physical Society (1987) 173.
SAWTOOTH ACTIVITY AND CURRENT<br />
DENSITY PROFILES IN JET<br />
D.J. CAMPBELL, J.G. CORDEY, A.W. EDWARDS,<br />
R.D. GILL, E. LAZZARO, G. MAGYAR, A.L. McCARTHY 1 ,<br />
J. O'ROURKE, F. PEGORARO, F. PORCELLI, P. SMEULDERS,<br />
D.F.H. START, P. STUBBERFIELD, J.A. WESSON,<br />
E. WESTERHOF 2 , D. ZASCHE 3<br />
JET Joint Undertaking,<br />
Abingdon, Oxfordshire,<br />
United Kingdom<br />
Abstract<br />
<strong>IAEA</strong>-CN-50/A-VH-2<br />
SAWTOOTH ACTIVITY AND CURRENT DENSITY PROFILES IN JET.<br />
Extensive investigations of sawtooth activity in JET have led to a major revision of the underst<strong>and</strong>ing<br />
of sawteeth <strong>and</strong> to further theoretical developments. In addition, experiments with powerful<br />
auxiliary heating have revealed a new plasma regime in which sawteeth are stabilized <strong>and</strong> quiescent<br />
plasmas are achieved for periods of over 3 s. Measurements of current density profiles using a far<br />
infrared multichannel polarimeter show that the central safety factor q0 may be below unity in normal<br />
sawtoothing plasmas <strong>and</strong> may reach values as low as 0.6-0.8 during the stable periods. Analysis of pellet<br />
ablation <strong>and</strong> of density perturbations at rational q surfaces ('snakes') yields further information on the<br />
evolution of the q-profile during sawteeth. These results have significant implications for theories of<br />
the sawtooth instability <strong>and</strong> for explanations of the sawtooth stabilization.<br />
1. Introduction<br />
In many tokamak plasmas, the sawtooth instability plays a primary role in<br />
determining heating <strong>and</strong> confinement in the plasma centre. In the<br />
near—ignition regime, now being explored by large tokamak experiments,<br />
sawteeth may cause a substantial reduction of the fusion reactivity <strong>and</strong> a<br />
spatial redistribution of fusion products. Considerable attention is,<br />
therefore, focussed on the underst<strong>and</strong>ing of the instability mechanism <strong>and</strong><br />
the investigation of possible stabilization techniques.<br />
Previous studies on JET [1,2] have shown that there are considerable<br />
discrepancies between conventional models of the instability <strong>and</strong><br />
experimental observations. In addition, measurements of the central value<br />
of the safety factor q0 in TEXTOR [3] <strong>and</strong> observations of the 'snake' in<br />
JET [4] suggest that the instability does not involve complete reconnection<br />
1 Flinders University, Bedford Park, 5042 South Australia, Australia.<br />
2 FOM Instituut voor Plasmafysica 'Rijnhuizen', Nieuwegein, Netherl<strong>and</strong>s.<br />
3 Max-Planck-Institut fur Plasmaphysik, D-8046 Garching, Federal Republic of Germany.<br />
377
378 CAMPBELL et al.<br />
'slow' partial<br />
'fast' part;al<br />
(keV)<br />
'fishbones'<br />
'full'collapse<br />
7<br />
./<br />
#17850<br />
6<br />
5<br />
6<br />
5<br />
A.<br />
/<br />
t<br />
50 ms<br />
^ /<br />
y' X. (r/a ~ 0)<br />
Te (r/a - 0.4)<br />
F/G. 1. Behaviour of the electron temperature at two radii during a sawtooth cycle in a JET discharge<br />
with auxiliary heating. The major commonly observed phenomena are indicated.<br />
of the plasma centre. More detailed investigations of sawtooth activity in<br />
JET, which are discussed here, together with an analysis of the current <strong>and</strong><br />
safety factor profiles, confirm the need for a careful reappraisal of sawtooth<br />
theory.<br />
2. Sawtooth Activity<br />
Sawtooth activity in JET exhibits considerable complexity, with the<br />
sawtooth rise phase often interrupted by one or more subordinate<br />
relaxations <strong>and</strong> substantial associated mhd activity. In addition, during<br />
some high-power additional heating experiments (with ICRH <strong>and</strong>/or<br />
NBI), bursts of activity resembling 'fishbones' [5] are observed. Figure 1<br />
shows a sawtooth cycle from a JET plasma with additional heating<br />
(Ip = 5 MA, B^ = 3.15 T, PRF = 2 MW). Four major commonly<br />
observed phenomena are illustrated : a full sawtooth collapse, a 'slow'<br />
partial collapse, a 'fast' partial collapse, <strong>and</strong> 'fishbone-like' bursts.<br />
Detailed studies of the sawtooth collapse [6] have shown that it occurs in<br />
two main phases: the sudden appearance of a rapidly growing m=n=l<br />
displacement of the plasma core is followed by a rapid redistribution of
-0.6<br />
(keV)<br />
6.6<br />
6.4<br />
6.2<br />
6.0<br />
5.8<br />
<strong>IAEA</strong>-CN-50/A-VII-2 379<br />
V<br />
100 /iS N<br />
/<br />
V. /<br />
#16969<br />
Te (r/a - 0.2)<br />
warm core residue<br />
FIG. 2. Reconstructions of successor oscillations after a full sawtooth collapse using electron cyclotron<br />
emission (ECE) <strong>and</strong> soft X-ray tomography (SXR). The bar on the time axis indicates the interval over<br />
which ECE measurements are used to reconstruct the contour plot. The SXR contour plot is a 'snapshot'<br />
at one instant during this period.<br />
energy, resulting in a flattening of the central temperature profile on a<br />
timescale of lOO^s. This picture of the collapse, obtained by soft X—ray<br />
tomography, is supported by reconstructions of successor oscillations using<br />
ECE measurements (the former employs measurements from two<br />
perpendicular cameras, the latter exploits the plasma rotation to<br />
reconstruct two-dimensional images from measurements along a single line<br />
of sight through the plasma). Figure 2 compares reconstructions of<br />
successor oscillations of the same collapse by the two techniques. Although<br />
the ECE reconstructions have lower time resolution, they are in agreement<br />
with the soft X—ray results. More detailed analysis confirms the conclusion<br />
[1,2] that the collapse resembles a broad convective flow rather than a<br />
resistive reconnection in a narrow layer.<br />
Certain subordinate relaxations ('fast* partial sawteeth) share some aspects<br />
of the full sawtooth collapse: they occur on a rapid timescale <strong>and</strong> are<br />
accompanied by large successor oscillations. However, there are important<br />
differences. Whereas the full collapse leads to a convective flow of the hot<br />
plasma centre <strong>and</strong> the formation of a cold bubble in the plasma core, soft<br />
X—ray tomography <strong>and</strong> fast ECE temperature measurements reveal that
380<br />
-1<br />
hot core<br />
Z(m)<br />
V)<br />
4.4<br />
4.2<br />
4.0<br />
3.8<br />
3.6<br />
R(m)<br />
2ms<br />
CAMPBELL et al.<br />
#8075<br />
Te (r/a - 0.05)<br />
f\ A A A<br />
1 A A IN|yVyn<br />
11V V«<br />
hot core<br />
flatannulus<br />
FIG. 3. ECE reconstructions of the formation <strong>and</strong> evolution of an isl<strong>and</strong>-like structure following a 'fast'<br />
partial collapse. The bars on the time axis show the time intervals over which the contour plots were<br />
reconstructed.<br />
these subordinate relaxations generate a m=n=l helical structure which<br />
resembles the conventional picture of a magnetic isl<strong>and</strong> [7]. This structure<br />
evolves to form a poloidally symmetric flattened region around the<br />
sawtooth inversion radius, rather than engulfing the plasma core as in the<br />
classic theory of the sawtooth instability. ECE reconstructions of the<br />
successor oscillations of such a collapse are shown in Fig 3.<br />
3. Sawtooth Stabilization<br />
During auxiliary heating experiments, sawtooth activity usually dominates<br />
the evolution of the plasma core, limiting central plasma parameters <strong>and</strong><br />
modulating the central electron temperature by up to 50%<br />
(Te(max)/Te(min) - 2). However, under certain conditions, the plasma<br />
undergoes a transition to a regime in which sawteeth are suppressed [8].<br />
This has been observed in limiter plasmas with currents of up to 5 MA<br />
during periods of ICR.F or ICRF + NBI heating, <strong>and</strong> recently it has also<br />
been obtained in 3 MA H—mode plasmas with NBI heating. In the former<br />
case, the quiescent period has been extended to 3.2s (-7 energy<br />
replacement times), as shown in Fig 4 (Ip = 3 MA, B^,= 3.15T). The<br />
benefits of the regime include a small increase in energy confinement, by<br />
up to 20%, but it appears that the major advantage of sawtooth
<strong>IAEA</strong>-CN-50/A-VII-2 381<br />
#15697<br />
. 0<br />
13<br />
FIG. 4. Behaviour of central electron <strong>and</strong> ion temperatures during the longest period of sawtooth<br />
stabilization observed in JET.<br />
stabilization in near—ignition plasmas will be an increase in the fusion<br />
power product due to peaking of the density <strong>and</strong> temperature profiles. This<br />
may be further enhanced by the reactions of non—thermal particles<br />
accelerated by RF fields.<br />
The stable regime is terminated by a normal m=n=l instability, but the<br />
collapse has an inversion radius which may be up to 50% larger than for<br />
normal sawteeth. During the stable period, Faraday rotation measurements<br />
of the q-profile (see below) indicate that q0 falls substantially below unity.<br />
Thus, stabilization is probably not due to non-inductive currents raising q<br />
above 1, but may be caused by the fast particles accelerated by the RF<br />
fields or injected by neutral beams [9].<br />
4. Measurement of Current <strong>and</strong> Safety Factor Profiles<br />
Recently, measurements of the current density profile have been obtained<br />
using a six—channel polarimeter to determine the Faraday rotation of<br />
far—infrared (195 /an) radiation [10]. It is found that during normal<br />
sawteeth, in both ohmic <strong>and</strong> additionally heated plasmas, q0 attains values<br />
- 0.8 (± 15%). Furthermore, measurements of the q-profile during stable<br />
periods show that q0 may reach values as low as 0.6 [10]. These results are<br />
supported, within experimental uncertainties, by calculations of the<br />
resistive diffusion of the current (using TRANSP [11]) <strong>and</strong> by equilibrium<br />
analysis of external magnetic measurements (using IDENTC). Figure 5a<br />
shows the evolution of q0 during a period of sawtooth stabilization<br />
(Ip = 3.3 MA, By = 2.7 T, P#F = 10 MW), as determined by polarimetry<br />
<strong>and</strong> by TRANSP. Two cases are shown for the latter method. The first (a)<br />
assumes that qQ is reset to 1 after each sawtooth collapse <strong>and</strong> the second<br />
(b) does not. Nevertheless, q0 attains approximately the same value in
382 CAMPBELL et al.<br />
#13430<br />
1 *1 ^. j (MA-m 2 )<br />
3<br />
R(m)<br />
4 0.0 0.5<br />
P<br />
(MW)<br />
FIG. 5. (i) Behaviour of the central electron temperature during a period of sawtooth stabilization;<br />
(ii) evolution of the central value of the safety factor q0 as deduced from Faraday rotation measurements<br />
(polarimelry), <strong>and</strong> calculations of the resistive diffusion of current under two different assumptions<br />
(see text). Note that the current flat-top started only at 5 s. Safety factor (Hi) <strong>and</strong> current density profiles<br />
(iv), derived from Faraday rotation measurements, are shown just before the termination of the stable<br />
period (arrowed).<br />
both cases. Current density <strong>and</strong> q—profiles -300 ms before the collapse<br />
terminating the stable period are also shown. Note that the error bar in the<br />
polarimetry analysis includes some systematic effects (due, for example, to<br />
misalignment relative to the toroidal field <strong>and</strong> to plasma birefringence)<br />
whose magnitude has been estimated but not yet directly measured.<br />
Experiments with injected pellets have revealed that a very localized<br />
density perturbation with m=n=l topology (the 'snake') can persist for<br />
periods of up to 2s following pellet injection [4]. The geometry of the<br />
structure indicates that it is located at the q=l surface, which, at the time<br />
of the sawtooth collapse, appears to lie very close to the sawtooth inversion<br />
1.0
<strong>IAEA</strong>-CN-50/A-VII-2 383<br />
radius. In addition, the location of the perturbation undergoes a<br />
substantial shift in minor radius (Ar/r - 30%) during a sawtooth period,<br />
from which it is inferred that the position of the q=l surface undergoes a<br />
similar shift. This suggests, in contrast to the Faraday rotation<br />
measurements, the existence of a very flat region in the central q—profile<br />
(since resistive diffusion can Change q in the plasma centre by only a few<br />
percent during the sawtooth ramp phase). On this basis, a parabolic<br />
q—profile would yield a value for qp of 0.97.<br />
Analysis of pellet ablation measurements [12] leads to a similar result.<br />
During pellet injection, a substantial fall in Ha <strong>and</strong> soft X-ray emission is<br />
observed as the pellet crosses the q=l surface . This fall can be explained if<br />
it is assumed that on rational q surfaces the reservoir of electrons capable<br />
of interacting with <strong>and</strong> ablating the pellet is much lower than on<br />
non—rational q surfaces. This requires that the q=l surface lies in a region<br />
of small shear <strong>and</strong>, in fact, leads to an estimate of the shear in the vicinity<br />
of the q=l surface. The method yields (dq/dr)q=i = 5xlO" 2 m" 1 which, for<br />
a parabolic profile, would imply q0 = 0.99.<br />
5. Discussion<br />
In spite of substantial agreement between some of our observations of the<br />
sawtooth collapse <strong>and</strong> the predictions of the quasi-interchange model [2],<br />
several aspects of the JET results are not explicable in terms of any<br />
existing theory. In particular, it is found that the rate of increase of the<br />
instability growth rate is much too rapid. In addition, the mechanism for<br />
the rapid redistribution of energy which accompanies the collapse is not<br />
understood, although this may involve higher order ideal modes or<br />
small-scale turbulence.<br />
The q—profile is a key parameter, <strong>and</strong> we have investigated its behaviour<br />
by a number of different techniques. Faraday rotation measurements show<br />
that qo is most probably below 1 in normal sawtoothing discharges, but, at<br />
present, experimental errors do not allow the possibility that q0 ~ 1 to be<br />
excluded. While observations of pellet-induced perturbations suggest<br />
values of q0 close to unity, these measurements are consistent with a<br />
q—profile having a region of low shear in the vicinity of the q=l surface<br />
<strong>and</strong> a central value of q below 1. No direct comparison of these techniques<br />
under identical conditions has been possible to date, so an analysis of the<br />
consistency of the various methods must await further experiments. In<br />
addition, more detailed resistive diffusion calculations will allow the limits<br />
imposed by experimental uncertainties to be more fully explored.<br />
The observation that a q=l surface exists throughout the sawtooth cycle<br />
conflicts with the assumption that |1—qo| - 10 " 2 , with q everywhere
384 CAMPBELL et al.<br />
above 1, underlying the explanation of the sawtooth collapse in JET as a<br />
quasi—interchange mode. In addition, significant new problems are raised<br />
by the observation that sawteeth may be stabilized with q0 well below<br />
unity. Complete underst<strong>and</strong>ing of this phenomenon requires an adequate<br />
model of the sawtooth instability. A re-evaluation of resistive theory<br />
including diamagnetic <strong>and</strong> trapped particle effects is, therefore, underway<br />
[13]. A central aspect of this analysis is that the sawtooth collapse leads to<br />
relaxation of the shear at the q=l surface rather than a reconnection to<br />
q=l in the plasma centre.<br />
Acknowledgements<br />
It is a pleasure to acknowledge contributions to this work <strong>and</strong> many<br />
helpful discussions with our colleagues in the JET Project. In addition, we<br />
wish to acknowledge R Goldston <strong>and</strong> D McCune of PPPL for the use of<br />
TRANSP <strong>and</strong> C Best for supervising its installation at JET.<br />
References<br />
[1] Campbell, D.J. et al, "Sawteeth <strong>and</strong> disruptions in JET", Plasma<br />
Physics <strong>and</strong> Controlled <strong>Nuclear</strong> Fusion Research 1986 (Proc. 11th<br />
Int. Conf. Kyoto, 1986) Vol. 1, <strong>IAEA</strong>, Vienna (1987) 433.<br />
[2] Wesson, J.A., Kirby, P., Nave, M.F., "Sawtooth oscillations", ibid.<br />
Vol. 2, 3.<br />
[31 Soltwisch, H., Stodiek, W., Manickam, J., Schliiter, J., "Current<br />
density profiles in the TEXTOR tokamak", ibid.yol. 1, 263.<br />
[4] Weller, A., et al, Persistent density perturbations at rational-q<br />
surfaces following pellet injection in the Joint European Torus,<br />
Phys. Rev. Lett. 59 (1987) 2303.<br />
[5] McGuire, K. et al, Study of high beta magnetohydrodynamic modes<br />
<strong>and</strong> fast ion losses in PDX, Phys. Rev. Lett. 50 (1983) 891.<br />
[6] Edwards, A.W., et al, Rapid collapse of a plasma sawtooth oscillation<br />
in the JET tokamak, Phys. Rev. Lett. 57 (1986) 210.<br />
[7] Westerhof, E. <strong>and</strong> Smeulders, P., to be published.<br />
[8] Campbell, D.J. et al, Stabilization of sawteeth with additional heating<br />
in the JET tokamak, Phys. Rev. Lett. 60 (1988) 2148.<br />
[9] Pegoraro, F., Porcelli, F., Coppi, B., Detragiache, P., Migliuolo, S.<br />
"Theory of sawtooth stabilisation in the presence of energetic ions",<br />
Paper <strong>IAEA</strong>-CN-50/D-4-6Jtbis conference, Vol. 2.<br />
[10] O'Rourke, J., et al, "Polarimetric measurements of the q—profile",<br />
Controlled Fusion <strong>and</strong> Plasma Heating (Proc. 15th Euro. Conf.<br />
Dubrovnik, 1988) Vol. 12B(I), Europhysics Conference Abstracts<br />
(1988) 155.
<strong>IAEA</strong>-CN-50/A-VH-2 385<br />
[11] Goldston, R.J., et al, New techniques for calculating heat <strong>and</strong><br />
particle source rates due to neutral beam injection in axdsymmetric<br />
tokamaks, J. Comput. Phys. 43 (1981) 61.<br />
[12] Gill, R.D., Edwards, A.W. <strong>and</strong> Weller, A., Determination of the shear<br />
on the q=l surface of the JET tokamak, JET Preprint JET-P(88)59,<br />
to be published.<br />
[13] Gill, R.D., et al, "The sawtooth in JET", ibid.[10] Vol. 12B(I), 350.
RESEARCH ON SAWTOOTH OSCILLATIONS<br />
AND DISRUPTIONS USING<br />
SOFT X-RAY TOMOGRAPHY<br />
Y. NAGAYAMA, S. TSUJI 1 , K. MIYAMOTO<br />
Department of Physics,<br />
Faculty of Science,<br />
University of Tokyo,<br />
Hongo, Bunkyo-ku, Tokyo<br />
K. KAWAHATA, N. NODA, S. TANAHASHI, J. FUJITA<br />
Institute of Plasma Physics,<br />
Nagoya University,<br />
Chikusa-ku, Nagoya<br />
Japan<br />
Abstract<br />
<strong>IAEA</strong>-CN-50/A-VII-3<br />
RESEARCH ON SAWTOOTH OSCILLATIONS AND DISRUPTIONS USING SOFT X-RAY<br />
TOMOGRAPHY.<br />
Sawtooth oscillations <strong>and</strong> major disruptions in tokamak plasmas are investigated by using the soft<br />
X-ray tomography technique. The colder plasma is carried to the centre by a hydrodynamic flow <strong>and</strong><br />
is heated to form a new hot spot during the sawtooth crash phase. The old hot core is pushed out, <strong>and</strong><br />
the new hot spot remains at the centre after the crash. A mixture of the m = 2/n = 1 mode <strong>and</strong> a higher<br />
mode is observed before minor disruptions take place. A large m = I mode appears after the minor<br />
disruption <strong>and</strong> persists until a major disruption occurs.<br />
1. INTRODUCTION<br />
Recently, soft X-ray tomography has been developed as a tool of investigating<br />
disruptions (sawtooth <strong>and</strong> major) [1-9]. One way of confirming the theory of disruptions<br />
is comparing the soft X-ray image obtained by the experiment with that<br />
predicted by the theory.<br />
The Kadomtsev model [10] was believed to explain sawtooth oscillations in<br />
smaller tokamaks [8]. Recently, Wesson proposed a quasi-interchange mode model<br />
[11] to explain the fast sawtooth crash in JET [9, 12]. We have reported previously<br />
that the observed soft X-ray image is not consistent with the Kadomtsev model but<br />
is partly consistent with the Wesson model [6, 7]. In the Kadomtsev model, the<br />
collapse is attributed to the m = 1 tearing mode instability <strong>and</strong> the total reconnection<br />
1 JAERI, Naka-machi, Naka-gun, Ibaraki-ken 311-01, Japan.<br />
387
388 NAGAYAMA et al.<br />
of the magnetic field line. In the Wesson model, it is postulated that the m = 1 ideal<br />
mode instability leads to a convective flow <strong>and</strong> causes the collapse. The observable<br />
differences between these models appear in the collapse time <strong>and</strong> in the temporal<br />
evolution of the magnetic flux surfaces or the contour map of the soft X-ray emissivity.<br />
In this paper, a more detailed analysis of the experiment will be presented.<br />
It has been thought that a possible mechanism for the major disruption is the<br />
overlapping of the m/n = 3/2 mode <strong>and</strong> 2/1 mode magnetic isl<strong>and</strong>s caused by the<br />
tearing mode instability. Mode structures are also investigated in connection with the<br />
major disruption.<br />
2. DEVICE AND TOMOGRAPHY<br />
The experiments are carried out in the JIPP T-II tokamak (a = 0.15 m,<br />
R = 0.91 m). Soft X-ray emissions are filtered by the use of beryllium foils (10 or<br />
40 fim thick) <strong>and</strong> are detected with an array of 29 SBD detectors. The signals are<br />
digitized every 10 /JLS by the use of 12 bit transient recorders. Details of the<br />
experimental set-up are presented in Ref. [4].<br />
To generate tomographic reconstructions, we assume that the plasma column<br />
rotates rigidly in the poloidal direction <strong>and</strong> take three successive profiles; thus the<br />
data of one quarter of the rotation only are employed. The soft X-ray emissivity<br />
profile is Fourier exp<strong>and</strong>ed in sin m0 <strong>and</strong> cos md for the angular components <strong>and</strong> in<br />
Bessel functions of order m with f-th zero point Jm(X«r) for the radial components.<br />
We take ( = 11 <strong>and</strong> m = 0-2. The Fourier components m = 0-2 are necessary to<br />
reconstruct the m = 1 mode structure of the Kadomtsev model. The frequency of the<br />
X-ray signal in the central chord is double that of the m = 1 mode (see Fig. 1). The<br />
m = 2 component is also necessary to reproduce the frequency doubling. The number<br />
of radial expansion terms is optimized with the help of the Akaike information<br />
criterion [7]. The radial resolution of the soft X-ray detecting system is 1 cm <strong>and</strong> that<br />
of the reconstructed image is 1.5 cm. The time resolution is 30 /xs.<br />
3. SAWTOOTH OSCILLATIONS<br />
The soft X-ray signal <strong>and</strong> the time evolution of the tomographic image are<br />
shown in Fig. 1. Initially, the hot core moves outward along the minor radius. Here<br />
we mean that the region with high X-ray emissivity is 'hot' <strong>and</strong> the region with low<br />
emissivity is 'cold'. Then a structure similar to Kadomtsev's isl<strong>and</strong> appears<br />
(frame C). The shape of the hot core changes from a circle to a crescent, <strong>and</strong> a new<br />
hot spot appears in the isl<strong>and</strong>-like structure <strong>and</strong> grows gradually (frames G-L).<br />
The old hot core moves toward the outside, <strong>and</strong> the new hot spot moves from the<br />
periphery to the centre. This shows that a hydrodynamic flow exists inside the plasma<br />
which is similar to Wesson's flow [11]. During the crash, the width of the old hot
2=0.2 cm l ^ ^ f ^ ^ ^ ^<br />
<strong>IAEA</strong>-CN-50/A-VII-3 389<br />
time (ras) 180<br />
'tuMH i ' ' ' A<br />
B C DE FG HI J KLM N<br />
FIG. I. Soft X-ray signals <strong>and</strong> time evolution of soft X-ray tomography in the region of -8 cm<br />
< X < 8 cm <strong>and</strong> -8 cm < y < 8 cm when a sawtooth crash takes place. Plasma parameters:<br />
B, = 2.6 T, I = 105 kA, Ta = 780 eV, ne = 8 x 10 19 m" 3<br />
core becomes narrower (frames K-M), <strong>and</strong> the old hot core diminishes. After the<br />
crash, the new hot spot remains at the centre (frame N). A wide flat plateau around<br />
the new hot spot appears just after the old hot core has diminished. The width of the<br />
plateau slowly becomes narrower (frames N <strong>and</strong> O), <strong>and</strong> at last the X-ray emissivity<br />
profile returns to the initial state.<br />
In the Kadomtsev model, the hot core is circular, <strong>and</strong> the isl<strong>and</strong> is crescent<br />
shaped [10]. In our observation, the hot core is crescent shaped, <strong>and</strong> the isl<strong>and</strong> is<br />
circular. The shape of the hot core does not depend on the poloidal beta but depends<br />
on the X-ray profile. It seems that the hot core is circular when the electron temperature<br />
profile or the current density profile is flat <strong>and</strong> is crescent shaped when the
390 NAGAYAMA et al.<br />
RECONNECTION RECONNECTION<br />
KINK FLOW<br />
OLD HOT CORE<br />
NEW HOT SPOT / 5 \<br />
FIG. 2. Schematic view of magnetic surface explaining sawtooth crash by using Sato <strong>and</strong> Nakayama 's<br />
model. The hatched area (in 6) is a flat region.<br />
current profile is peaked. In the Wesson model the hot core is replaced by the cold<br />
bubble, <strong>and</strong> the crash takes place under the condition of q0 « 1 [11]. In our observation,<br />
the shape of the hot core is the same as is expected from the Wesson model,<br />
but the birth of the new hot spot is inconsistent with the Wesson model. Assuming<br />
a current profile of j(r) = jo(l - r 2 /a 2 ) s , where the parameters j0 <strong>and</strong> s are determined<br />
by the use of the total plasma current <strong>and</strong> the radius of the q •= 1 surface, we<br />
obtain a value of q0 which is between 0.7 <strong>and</strong> 0.9 when the crash takes place. These<br />
facts are inconsistent with the Wesson model.<br />
One possible explanation for our observation is given by Sato <strong>and</strong> Nakayama's<br />
model [13]. A schematic view of the magnetic surface explaining the sawtooth crash<br />
using their model is shown in Fig. 2. A reconnection of magnetic field lines which<br />
is driven by the kink flow gives birth to the closed flux surface (2). The plasma inside<br />
of the new flux surface is ohmically heated <strong>and</strong> becomes a new hot spot (4). The kink<br />
flow carries the old hot core outward <strong>and</strong> drives the reconnection (5); then a flat<br />
region appears around the central new hot spot (6). The behaviour of the old hot core<br />
<strong>and</strong> the new hot spot is consistent with Sato <strong>and</strong> Nakayama's 3-D full MHD simulation<br />
[13].<br />
The crash time is not very different from the Kadomtsev time <strong>and</strong> is a hundred<br />
times longer than the helical Alfve'n time which is expected as the characteristic crash<br />
time in the Wesson model. The crash time is shorter when the current profile is<br />
broader. This behaviour has not yet been explained by any model.
-1.8 cm__^jJ/\M^<br />
0.2<br />
2.2<br />
<strong>IAEA</strong>-CN-50/A-VII-3 391<br />
i . . i l l I I l l 1 1 1 .<br />
\ \ I * .' i i i I • '. ' • ' I I < t I i t<br />
209 9 » * M ** * k » k » A A » A<br />
y<br />
A BC C D E F G H<br />
7r,?P,9 ,•,
392 NAGAYAMA et al.<br />
m/n=2/1 isl<strong>and</strong><br />
3/2 isl<strong>and</strong><br />
1/1 hot core<br />
FIG. 4. Schematic view of magnetic surface explaining major disruption. The hatched area (in 3 <strong>and</strong><br />
6) is a stochastic region.<br />
(frames D <strong>and</strong> E). Finally, the X-ray profile becomes flat (frames I <strong>and</strong> J), <strong>and</strong> the<br />
major crash takes place when the X-ray in the central region drops. During the major<br />
crash phase, the m = 1 mode remains in the central region, <strong>and</strong> the m = 2 mode<br />
is dominant in the outer region (frames K <strong>and</strong> M). After the major crash, the X-ray<br />
emission is very low, <strong>and</strong> the X-ray profile becomes very flat (frame O); then,<br />
suddenly a large, negative spike appears on the loop voltage, <strong>and</strong> the plasma shifts<br />
inward (frames N <strong>and</strong> O).<br />
The schematic diagram of the disruption process which we assume is shown in<br />
Fig. 4. The overlapping of the m/n = 2/1 mode <strong>and</strong> the 3/2 mode (1) causes a partial<br />
crash which destroys the region around the centre (2). The current in the outer region<br />
drops because of the crash, <strong>and</strong> the current is concentrated in the central region. q0<br />
becomes less than unity <strong>and</strong> the m = 1 mode becomes unstable (4). The m = 1 mode<br />
dissipates the thermal energy in the central region. The thermal energy is gradually<br />
lost in the loop from 1 to 4, which is observed in the experiment. Finally, the mode<br />
mixing of the m/n = 1/1,2/1 <strong>and</strong> 3/2 modes causes the major crash (5 <strong>and</strong> 6). The<br />
1/1 mode breaks the central region, <strong>and</strong> the 3/2 <strong>and</strong> 2/1 modes break the outer region.<br />
Actually, mode mixing of the 1/1 <strong>and</strong> 2/1 modes is found [4], <strong>and</strong> rapidly growing<br />
higher frequency X-ray signals are observed before the major crash. Because of the<br />
last crash, the electron temperature becomes very low. The current decays because<br />
of the high resistivity.<br />
REFERENCES<br />
[1] NAGAYAMA, Y., et al., Jpn. J. Appl. Phys. 20 (1981) L779.<br />
[2] TSUJI, S., et al., Nucl. Fusion 22 (1982) 1082.<br />
[3] NAGAYAMA, Y., et al., in Controlled Fusion <strong>and</strong> Plasma Heating (Proc. 11th Eur. Conf.<br />
Aachen, 1983), Vol. 7D, Part I, European Physical Society (1983) 23.<br />
[4] TSUJI, S., et al., Nucl. Fusion 25 (1985) 305.<br />
[5] NAGAYAMA, Y., Jpn. J. Appl. Phys. 24 (1985) 787.
<strong>IAEA</strong>-CN-50/A-VII-3 393<br />
[6] NAGAYAMA, Y., et al., in Controlled Fusion <strong>and</strong> Plasma Physics (Proc. 14th Eur. Conf.<br />
Madrid, 1987), Vol. 11D, Parti, European Physical Society (1987) 1306.<br />
[7] NAGAYAMA, Y., Jpn. J. Appl. Phys. 62 (1987) 2702.<br />
[8] GRANETZ, R.S., CAMACHO, J.F., Nucl. Fusion 25 (1985) 727.<br />
[9] EDWARDS, A.W., et al., Phys. Rev. Lett. 57 (1986) 210.<br />
[10] KADOMTSEV, B.B., Sov. J. Plasma Phys. 1 (1975) 389.<br />
[11] WESSON, J.A., et al., in Plasma Physics <strong>and</strong> Controlled <strong>Nuclear</strong> Fusion Research 1986 (Proc.<br />
11th Int. Conf. Kyoto, 1986), Vol. 2, <strong>IAEA</strong>, Vienna (1987) 3.<br />
[12] CAMPBELL, D.J., et al., Nucl. Fusion 26 (1986) 1085.<br />
[13] SATO, T., et al., Paper <strong>IAEA</strong>-CN-50/D-III-2, these Proceedings, Vol. 2.
STABILITY OF TFTR PLASMAS<br />
<strong>IAEA</strong>-CN-50/A-VH-4<br />
J. MANICKAM, V. ARUNASALAM, C.W. BARNES 1 , M.G. BELL,<br />
M. BITTER, H.-S. BOSCH 2 , N.L. BRETZ, R. BUDNY, C.E. BUSH 3 ,<br />
A. CAVALLO, T.K. CHU, S.A. COHEN, P.L. COLESTOCK,<br />
S.L. DAVIS, D.L. DIMOCK, H.F. DYLLA, P.C. EFTHIMION,<br />
A.B. EHRHARDT, R.J. FONCK, E.D. FREDRICKSON, H.P. FURTH,<br />
G. GAMMEL, RJ. GOLDSTON, G.J. GREENE, B. GREK,<br />
L.R. GRISHAM, G.W. HAMMETT, R.J. HAWRYLUK, H.W. HENDEL,<br />
K.W. HILL, E. HINNOV, J.C. HOSEA, R.B. HOWELL 1 , H. HSUAN,<br />
R.A. HULSE, K.P. JAEHNIG, A.C. JANOS, D.L. JASSBY, F.C. JOBES,<br />
D.W. JOHNSON, J.L. JOHNSON, L.C. JOHNSON, R. KAITA,<br />
C. KIERAS-PHILLIPS, S.J. KILPATRICK, V.A. KRUPIN 4 ,<br />
G. KUO-PETRAVIC, P.H. LaMARCHE, W.D. LANGER, B. LeBLANC,<br />
R. LITTLE, A.I. LYSOJVAN 5 , D.M. MANOS, D.K. MANSFIELD,<br />
E. MAZZUCATO, R.T. McCANN, M.P. McCARTHY, D.C. McCUNE,<br />
K.M. McGUIRE, D.H. McNEILL, D.M. MEADE, S.S. MEDLEY,<br />
D.R. MIKKELSEN, A. MILLER, D.A. MONTICELLO, R.W. MOTLEY,<br />
D. MUELLER, Y. MURAKAMI 6 , J.A. MURPHY, E.B. NIESCHMIDT 7 ,<br />
D.K. OWENS, H.K. PARK, W. PARK, A.T. RAMSEY, M.H. REDI,<br />
A.L. ROQUEMORE, P.H. RUTHERFORD, T. SAITO 8 ,<br />
N.R. SAUTHOFF, G. SCHILLING, J. SCHIVELL, G.L. SCHMIDT,<br />
S.D. SCOTT, J.C. SINNIS, J.E. STEVENS, W. STODIEK,<br />
B.C. STRATTON, G.D. TAIT, G. TAYLOR, J.R. TIMBERLAKE,<br />
H.H. TOWNER, M. ULRICKSON, S. VON GOELER, R.M. WIELAND,<br />
M.D. WILLIAMS, J.R. WILSON, K.-L. WONG, S. YOSHIKAWA,<br />
K.M. YOUNG, M.C. ZARNSTORFF, S.J. ZWEBEN<br />
Plasma Physics Laboratory,<br />
Princeton University,<br />
Princeton, New Jersey,<br />
United States of America<br />
1<br />
Los Alamos National Laboratory, Los Alamos, NM, USA.<br />
2<br />
Max-Planck-Institut Sir Plasmaphysik, Garching, Federal Republic of Germany.<br />
3<br />
Oak Ridge National Laboratory, Oak Ridge, TN, USA.<br />
4<br />
I.V. Kurchatov Institute of Atomic Energy, Moscow, USSR.<br />
5<br />
Institute of Physics <strong>and</strong> Technology, Khar'kov, USSR.<br />
6 University of Tokyo, Tokyo, Japan.<br />
7 EG&G Idaho Inc., Idaho Falls, ID, USA.<br />
6 Japan Atomic Energy Research Institute, Naka-machi, Japan.<br />
395
396 MANICKAM et al.<br />
Abstract<br />
STABILITY OF TFTR PLASMAS.<br />
TFTR is observed to have a /3* limit at high q which is close to that expected from a simple<br />
extrapolation of the Troyon formula. Experimentally the (3-limit is most often observed as a plasma<br />
disruption or a /3-collapse correlated with coherent MHD activity (m/n = 1/1, 3/2, <strong>and</strong> 2/1) which<br />
grows on a resistive time scale. The (3-collapse is also sometimes observed well below the /3-limit. Sawteeth<br />
have been stabilized for the entire beam injection phase (up to 2 s) for supershot plasmas. A new<br />
beam driven instability is observed at the start of neutral beam injection. The limiter H-mode has been<br />
obtained on TFTR <strong>and</strong> the Ha spikes (or edge relaxation phenomena) have been studied. A detailed<br />
theoretical study of the stability of TFTR discharges has been carried out, using for the first time a full<br />
set of measured time-dependent profiles of Tc(r), T;(r), <strong>and</strong> ne(r). Theoretically the /J-limit is found to<br />
be set by internal kink <strong>and</strong> ballooning modes at q < 9, <strong>and</strong> pressure driven external kink modes above<br />
this value.<br />
1. INTRODUCTION<br />
In order to reach the physics objectives of TFTR, which are the study of<br />
plasma phenomena at break-even conditions, it is important to underst<strong>and</strong> the<br />
gross stability of the plasma at high p. In our attempts to obtain reactor-relevant<br />
parameters we have reached plasma pressure greater than 4 x 10 5 Pa (4 atm) <strong>and</strong><br />
p(0) = 4% on axis, which is close to the ideal MHD limit for the peaked profiles<br />
observed in TFTR supershots.<br />
The organization of this paper is as follows: In section 2 we discuss the major<br />
disruptions observed close to the P-limit. In section 3 we discuss the MHD modes<br />
observed below the disruption limit: (m/n = 2/1, 3/2) coherent modes <strong>and</strong><br />
bursting m/n = 1/1 modes which couple to the plasma edge as higher-m modes, as<br />
in fishbones. In section 4 we discuss the stabilization of sawteeth observed in<br />
TFTR with neutral beam injection. In section 5 we discuss the ERP (edge<br />
relaxation phenomena) observed in TFTR limiter H-modes. Theoretical<br />
calculations of the stability of TFTR profiles to ideal <strong>and</strong> resistive modes are<br />
presented in section 6.<br />
2. DISRUPTIONS<br />
Disruptions on TFTR at the experimental P-limit of supershots [1] have been<br />
studied with many slow diagnostics 0= 1 ms) <strong>and</strong> on a fast time scale (10 us) with<br />
electron cyclotron emission, soft x-ray <strong>and</strong> Mirnov coil diagnostics. At least<br />
three different kinds of disruptions have been observed, a) with a precursor<br />
mode m/n = 1/1 in the center, coupled to a 5/1 or 6/1 at the edge, b) no precursor<br />
before the disruption <strong>and</strong> c) disruptions when ramping the plasma current at<br />
high p (<strong>and</strong> consequently high Te) through rational q values (especially q = 4, 5<br />
<strong>and</strong> 6). All three types of disruptions begin with a transport phase during which
<strong>IAEA</strong>-CN-50/A-VII-4 397<br />
the electron temperature falls to less than 50% of its initial value in ~ 1 ms. This<br />
precedes or is concurrent with a fast positive current spike, which is sometimes<br />
followed by a slow current quench. Estimates of the electron thermal diffusivity<br />
during the transport phase give values of order 120 m^/s. Some major<br />
disruptions are found to have no visible precursors, although locked modes (or<br />
extremely fast growing modes) would not normally be detectable. Occasionally<br />
low amplitude mode structure (m/n = 1/1 in core, coupled to m/n = 5/1 or 6/1 at<br />
edge) is observed preceding the electron temperature decay. Figure 1 shows such<br />
a disruption at high p on TFTR. It is typical of those observed at high beta<br />
poloidal, where the discharge is stable until about 1 ms before the disruption,<br />
when a mode appears with a growth time 1.2 MA ) or lower q,<br />
sawteeth or bursts of m/n = 1/1 activity are observed. These modes appear as<br />
m = 1 on the SXR diodes, but as higher m on the Mirnov coils due to mode<br />
coupling. The rise in stored energy <strong>and</strong> neutron emission slows at these bursts,<br />
indicating that the modes are affecting the plasma center <strong>and</strong> thus are harmful<br />
at present levels; in addition enhanced losses of fast ions [3] <strong>and</strong> high energy<br />
tritons are observed [4]. From the experimental data on'Mirnov coils or soft xrays,<br />
no direct evidence of ballooning modes (i.e. n > 2 ) has been found, even<br />
when the profiles are close to the high-n ideal MHD ballooning threshold. It<br />
should be noted that TFTR L-mode <strong>and</strong> ohmic discharges are generally free of<br />
coherent low-m MHD activity.<br />
4. SAWTOOTH STABILIZATION<br />
Stabilization of the sawtooth oscillation has been observed in the supershot<br />
regime for up to 2 s [5]. Transport analysis calculations using the TRANSP<br />
code [6] indicate that the stabilization is due to q0 rising above 1. The calculated<br />
increase in q0 for supershots is due in part to the presence of non-ohmic current<br />
drive which tends to broaden the q profile [7]. Figure 2 shows the onset of sawtooth<br />
stabilization for a) co- only, b) balanced <strong>and</strong> c) counter-injection on TFTR. It is<br />
clear from figure 2 that co- only <strong>and</strong> balanced are more effective at sawtooth<br />
stabilization than counter-injection. These results coincide with the TRANSP<br />
calculation which shows qo rising with co- <strong>and</strong> balanced neutral beam<br />
injection, but staying constant with counter-injection.
398 MANICKAM et al.<br />
1.6<br />
1.0<br />
30<br />
20<br />
10<br />
0<br />
3<br />
2<br />
1<br />
3.910<br />
1 1 1 1 1 1<br />
dBe/dtlarb.u.) i|<br />
SoftX-Rays(+iOcm) ^A/<br />
Soft X-Rays (-10 cm) AAV<br />
1 l l 1 1<br />
3.915<br />
TIME(s)<br />
l<br />
i i 1 r<br />
Ip(MA)<br />
I I I I<br />
i i i r<br />
Beam Power (MW)<br />
I 1 I I I<br />
Neutrons/s(10 16 )<br />
r i i i r<br />
Stored Energy (MJ)<br />
1 1<br />
17, 3.920<br />
FIG. 1. Major disruption at high 0 on TFTR which has an m/n = 111 mode in the plasma core <strong>and</strong><br />
an m/n = 6/1 mode at the plasma edge.
9<br />
8 —<br />
7<br />
6<br />
5<br />
4 -<br />
3<br />
2<br />
X<br />
• * •<br />
i •<br />
•<br />
•<br />
• •<br />
•<br />
•<br />
* *<br />
* < *<br />
i<br />
X<br />
m<br />
<strong>IAEA</strong>-CN-50/A-VW-4 399<br />
i<br />
•<br />
•<br />
•<br />
•<br />
i<br />
•<br />
X<br />
•<br />
i<br />
1<br />
•<br />
tO 15 20<br />
BEAM POWER (MW)<br />
•<br />
1 1<br />
CO- ONLY<br />
X Sawtooth<br />
• No Sawtooth<br />
-<br />
25 30<br />
FIG. 2. Onset of sawtooth stabilization for 1 s of neutral beam injection for (a) co-injection only,<br />
(b) balanced <strong>and</strong> (c) counter-injection on TFTR.
400 MANICKAM et al.<br />
5. TURBULENCE, ABM INSTABILITY AND LIMITER H-MODES<br />
Turbulent magnetic fluctuations have long been considered a possible cause<br />
of anomalous electron thermal transport. In TFTR, magnetic fluctuations in<br />
the scrape off region of the plasma have been measured with stationary poloidal<br />
field coils (Mirnov loops) <strong>and</strong> with a movable probe having poloidal <strong>and</strong> toroidal<br />
coils. Both coherent modes <strong>and</strong> a turbulent background level of fluctuations<br />
have been found [8]. The background turbulence is characterized by a spectrum<br />
that has an approximately 1/f dependence in the frequency range of 1 kHz to 1<br />
MHz. For some high power NB heated plasmas very large correlation lengths<br />
have been observed; essentially all coils located on the outer half of the machine<br />
are correlated at the 80-90% level. The correlation extends over the 30-50 kHz<br />
b<strong>and</strong>. The relative phases are consistent with an m = 1, n = 0 st<strong>and</strong>ing wave<br />
structure [9].<br />
Over a wide range of parameters the background turbulence has been<br />
measured <strong>and</strong> correlated with power balance estimates of the global<br />
confinement time. In general, very good correlation between the fluctuation<br />
level <strong>and</strong> the inverse of the global confinement time has been found for L-mode<br />
type discharges. Supershots are an exception to this correlation, where it is found<br />
that the fluctuation levels increase with beam power but the global confinement<br />
time does not change. Thus the cause <strong>and</strong> effect connection between transport<br />
<strong>and</strong> these measured magnetic fluctuations is not clear.<br />
A new type of instability is observed on TFTR when the neutral beams are<br />
first injected. This Axisymmetric Beam Mode (ABM) has a st<strong>and</strong>ing mode<br />
structure of m/n = 2/0, with an anti-node in BQ at 45 to the poloidal mid-plane.<br />
At high intensities the mode is coherent with a frequency in the range 30-60 kHz.<br />
This frequency is close to the fast ion poloidal transit time at the plasma edge,<br />
<strong>and</strong> the duration of the mode is comparable to the fast ion thermalization time.<br />
The amplitude of the mode correlates with the beam power (especially counter<br />
power) <strong>and</strong> with low target density. These features point to a fast ion resonant<br />
coupling, but the specific background plasma mode to which these ions couple<br />
has not yet been identified. In its present form this instability does not appear to<br />
have any detrimental effects on the plasma.<br />
Limiter H-mode discharges [10] have been obtained on TFTR, with Ip in the<br />
range of 0.9 to 1.25 MA <strong>and</strong> injected beam power of 14 to 24 MW. Figure 3 shows<br />
the characteristics of the TFTR limiter H-mode, the Ha signal drops <strong>and</strong> the<br />
edge density increases. Simultaneous with the ne increase is a rise in edge Te.<br />
In this example the H-mode is triggered by a sawtooth at 4.04 s, although this is<br />
not always the case. Gas puffing during neutral beam injection enhances the<br />
Ha spikes [or ERP/ELM's (edge localized modes)] during the H-mode phase. The<br />
Ha spikes are clearly observed on the Mirnov coils <strong>and</strong> soft x-ray signals. The<br />
spikes are dominated by an m/n = 1/0 mode at =• 0.5 kHz with a higher frequency<br />
mode at 5 - 20 kHz that also has an n = 0 component. The H-modes observed on
0.5<br />
' 0.4<br />
0.3 -<br />
3 0.2<br />
0.1<br />
-<br />
0<br />
—r"^ i i<br />
3 -<br />
<strong>IAEA</strong>-CN-50/A-VH-4 401<br />
1 1 1 1 1i<br />
|—i— 1 1 |<br />
li i —<br />
..li— 1 11 |r""\. —<br />
1 . . . » 1<br />
240_<br />
230<br />
2 =-<br />
4.00 4.05 4.10<br />
TIME (s)<br />
4.15 4.20<br />
FIG. 3. Limiter H-mode discharge on TFTR showing the edge Ha <strong>and</strong> n, signal with a transition at<br />
4.06 s, the beam injection from 3.5 to 4.3 s. A sawtooth is shown on the Te data at =*4.04 s <strong>and</strong> a<br />
400 eV increase in the edge Tt is observed after the transition.<br />
TFTK during supershot-like plasmas do not lead to an increase in TE (which is<br />
already greater than L-mode Tg )„ but rather a modest drop from the supershot<br />
level.<br />
6. MHD STABILITY CALCULATIONS<br />
The MHD properties of TFTR plasmas have been investigated with respect to<br />
both ideal <strong>and</strong> resistive MHD instabilities. The procedure requires appropriate<br />
modelling of the experimental discharge. This is done with the TRANSP code.<br />
The resultant safety-factor q(\y,t) <strong>and</strong> equivalent scalar pressure P(y,t) profiles
402 MANICKAM et al.<br />
sr 3<br />
£.2<br />
1<br />
Ballooning Boundary<br />
Internal<br />
Kink<br />
Boundary<br />
External<br />
Kink<br />
Boundary<br />
FIG. 4. Comparison of the calculated n — oo ideal MHD ballooning limit <strong>and</strong> the n = 1 kink limit<br />
for TFTR supershot type profiles. The shaded region is the operating space of TFTR supershots.<br />
(where P s 2/3(Pj_+ P||/2)) along with the outer boundary shape are transferred<br />
to a high resolution 2-d axisymmetric equilibrium code. The profiles are<br />
smoothed to eliminate any sharp local irregularities. While TFTR has a nearcircular<br />
cross-section, the strong Shafranov-shift associated with the high Pp<br />
achieved in supershots generally results in a slightly oblate ellipsoid, with an<br />
effective ellipticity of about 0.9. Equilibria corresponding to these timedependent<br />
profiles are generated <strong>and</strong> analysed for their MHD stability. To<br />
accurately determine the associated P-limits, the profile shapes are frozen, <strong>and</strong><br />
flux conserving sequences of increasing plasma pressure are generated as<br />
required. The ideal MHD modes of interest are n = 1 external <strong>and</strong> internal kink<br />
modes, as well as the high-n ballooning mode. The analysis of the former is<br />
done using the PEST codes [11,12]. The analysis for the ballooning modes is<br />
done with the full equations [13] <strong>and</strong> self-consistent equilibria, which is a more<br />
accurate approach than using the simpler s-a technique [14]. The resistive MHD<br />
calculation is done using a simple cylindrical delta-prime code as well as the<br />
resistive version of PEST <strong>and</strong> a toroidal non-linear resistive code, MH3D [15].<br />
The results may be summarized as follows: The observed experimental<br />
P-limit is calculated to be set by different modes in different operating regimes.<br />
In general at low q the p-limit is set by a combination of internal kink <strong>and</strong> broad<br />
b<strong>and</strong> ballooning modes. As q increases above 10 the external kink mode<br />
becomes the limiting instability. This is illustrated in figure 4, which shows the<br />
operating space of TFTR in the supershot regime, on a P* vs. q diagram. (See<br />
below for the definition of p* [16]). The shaded region indicates the experimental<br />
data. The dashed curve shows the computed p-limit based on the measured<br />
profiles, for onset of broad scale ballooning modes over a substantial region of<br />
the plasma. The hatched regions at low q indicate the onset of internal kink
0.4<br />
0.3<br />
0.2<br />
0.1<br />
n<br />
<strong>IAEA</strong>-CN-50/A-VH-4 403<br />
Balloon - critical<br />
Profile<br />
a)<br />
(b)<br />
-<br />
Equilibrium<br />
Profile<br />
i<br />
0.2 0.4 0.6 0.8 1.0<br />
V<br />
FIG. 5. Profile of the measured total pressure gradient <strong>and</strong> the profile that is marginally stable to<br />
high-n ideal ballooning modes as a junction of the poloidal flux * for a TFTR supershot at low q<br />
{a) near the operational fi-limit <strong>and</strong> (b) 35% below it.<br />
modes <strong>and</strong> at high q the external pressure driven kink modes. The shots with the<br />
highest P* / (I/aB) have pressure gradients which are close to the maximum<br />
allowed prior to onset of ballooning modes, over a wide region of the plasma.<br />
Furthermore, analysis of those discharges which are below the ballooning<br />
P-limit indicates that they would become unstable if the pressure is raised to<br />
reach the observed empirical limit. These results are indicated in figure 5,<br />
which compares the marginal dp/dy with the actual dp/d\|f for two cases, one very<br />
close to the experimental P-boundary <strong>and</strong> one at about 65% of the p-limit.<br />
In addition, the low-q shots, which usually have sawteeth <strong>and</strong> fishbone type<br />
oscillations during the beams, have a calculated q-axis well below unity, <strong>and</strong><br />
are consequently unstable to the internal kink mode, with a weak coupling to<br />
higher poloidal modes. Figure 6a shows the Fourier decomposition of the radial<br />
component of the displacement vector as a function of the plasma radius <strong>and</strong> the<br />
predicted flow patterns in the plasma. These aspects of the instability agree quite<br />
well with the experiment, figure 1.<br />
-
404 MANICKAM et al.<br />
FIG. 6. Radial dependence of the different Fourier components of \y along the 8=0 axis <strong>and</strong> the<br />
projection of the displacement vector, for an n = 1 free boundary (b/a = a>) mode for a TFTR super-<br />
x(m)<br />
shot at high /3 with (a) low q <strong>and</strong> @*/(I/aB) =3.37 <strong>and</strong> (b) high q <strong>and</strong> &*/(I/aB) = 3.05.<br />
In contrast, at higher q (>9), the theoretical analysis indicates that an<br />
external kink (3-limit appears below the ballooning limit. The kink mode does<br />
not have an eigenfunction dominated by a single high-m poloidal mode<br />
number. Instead the mode structure, figure 6b, shows very strong coupling<br />
between several poloidal modes. This is typical of pressure driven kinks as<br />
opposed to current driven kinks, where a single mode is strongly dominant.<br />
The strong coupling across the plasma cross-section implies a stronger effect of<br />
this instability on the plasma. This is consistent with the observation that<br />
disruptions occur more frequently at high P in this regime.<br />
Combining these two effects, it would appear from the stability calculations<br />
that the observed P-limits are set by internal kink <strong>and</strong> ballooning modes at low q<br />
<strong>and</strong> pressure driven kink modes at high q.<br />
In this context, it is worth noting that the definition of p used at PPPL has been,<br />
P-av=2u0JpdV/jBt 2 dV<br />
where B^ represents the square of the toroidal field strength.
Ip(MA)<br />
0.85<br />
0.89<br />
0.9<br />
0.9<br />
1.4<br />
<strong>IAEA</strong>-CN-50/A-VII-4 405<br />
Table 1<br />
Comparison of 3 values from TFTR supershots.<br />
Bt(T)<br />
5.1<br />
4.7<br />
2.9<br />
4.9<br />
4.7<br />
Pb(MW)<br />
10.5<br />
12.5<br />
10<br />
13.6<br />
22<br />
Broad profile at P-limit<br />
p-av %/IN<br />
1.7<br />
1.8<br />
2.2<br />
2.1<br />
2.2<br />
3.0<br />
p* %/IN<br />
2.7<br />
3.1<br />
3.4<br />
3.1<br />
3.5<br />
3.5<br />
IN =l/aB<br />
.20<br />
.21<br />
.40<br />
.22<br />
.37<br />
.39<br />
QDDdO" 4 )<br />
It is important to recognize that the fusion power obtained from a DT plasma<br />
will vary approximately as p 2 . Thus it is appropriate to judge supershot stability<br />
by the p* criterion, i.e.,<br />
p*= 2uo(Jp 2 dV/V) 1/2 Bz" 2<br />
where Bz is the vacuum toroidal magnetic field at the mid-point of the<br />
horizontal axis of the plasma.<br />
These values are presented in Table 1 for several TFTR shots. To facilitate<br />
comparison with other p-limit studies, the values for a broader pressure profile<br />
more typical of the optimal profiles are also included.<br />
It is worth noting that when the operating space diagram is drawn in terms of<br />
P-av, rather than P*, there is a strong drop in the observed p-limit, from the<br />
Troyon-Gruber limit, especially at high q [17]. This is attributable to the more<br />
peaked pressure profiles characteristic of supershots which is most pronounced<br />
at high q. This contrasts with the analytically predicted "optimal" pressure<br />
profiles which are significantly broader, since they are optimized for p rather<br />
than for fusion power production.<br />
In contrast to the broad agreement with ideal MHD, the linear resistive MHD<br />
studies have been less conclusive. Delta-prime calculations generally indicate<br />
that the 2/1 mode is close to marginal, <strong>and</strong> the 3/2 mode is stable. This is in<br />
contrast with the experiment which shows 3/2 <strong>and</strong>/or 2/1 activity frequently at<br />
high q. The discrepancies may be attributed to the fact that the profiles used in the<br />
analysis are obtained from a relatively coarse grid, while the stability depends<br />
quite strongly on the local details of the profile. This effect would be less<br />
important for ideal modes which are more dependent on the global properties of<br />
the profiles. Studies with a non-linear resistive MHD code [15] which includes<br />
both finite P <strong>and</strong> toroidal effects, have been successful in predicting the<br />
saturation behavior observed for the coherent MHD activity at q = 9 below the<br />
disruptive limit. In these studies the profiles obtained from the TRANSP code [6]<br />
are used to initialize a time-dependent code, which is then allowed to evolve<br />
7.8<br />
9.4<br />
5.7<br />
10.3<br />
13.6
406 MANICKAM et al.<br />
FIG. 7. Puncture plot showing the field lines associated with a saturated m/n = 2/1 isl<strong>and</strong> for a high-q<br />
TFTR supershot about 30% below the fi-limit. •<br />
toward a non-linear saturated state. The plasma is found to eventually relax to a<br />
state with an m/n = 2/1 isl<strong>and</strong> at the q = 2 surface, figure 7. This agrees very well<br />
with the observed coherent MHD activity in the experiment for this discharge.<br />
Studies of related profiles indicate an important role for the heat deposition<br />
profile in determining the final state. This remains an active area of study.<br />
7. CONCLUSIONS<br />
TFTR is approaching reactor-relevant parameters in the plasma<br />
with pressure greater than 4 x 10° Pa on axis. The resistive <strong>and</strong> ideal stability of<br />
discharges with high values of P* %/IN =• 3.5 <strong>and</strong> of p(0) = 4% at BT = 4.7 T have<br />
been studied on TFTR. Theoretically it is found that the pressure driven n = 1<br />
kink should set the limit at high q <strong>and</strong> the n —>
<strong>IAEA</strong>-CN-50/A-VH-4 407<br />
ACKNOWLEDGMENTS<br />
This work was supported by the U.S. Department of Energy Contract No.<br />
DE-AC02-76-CHO3073.<br />
REFERENCES<br />
[1] MORRIS, A.W., et al., "Beta limits <strong>and</strong> MHD activity in TFTR", Controlled Fusion <strong>and</strong><br />
Plasma Physics (Proc. 14th Eur. Conf. Madrid, 1987), Vol. 11D, Parti, European Physical<br />
Society (1987) 189-192.<br />
[2] FREDRICKSON, E.D., et al., Rev. Sci. Instrum. 59 (1988) 1797.<br />
[3] KAITA, R.,etal., Rep. PPPL-2493, Plasma Physics Lab., Princeton Univ., NJ, to be published.<br />
[4] STRACHAN, J.D., et al., Paper <strong>IAEA</strong>-CN-50/A-IV-5, these Proceedings, Vol. 1.<br />
[5] McGUIRE, K., et al., Plasma Phys. Control. Fusion, to be published.<br />
[6] HAWRYLUK, R., "Operational characteristics of intermediate <strong>and</strong> low field tokamaks",<br />
Physics of Plasmas Close to Thermonuclear Conditions (Proc. Course Varenna, 1979), Vol. 2,<br />
Commission of the European Communities, Brussels (1979) 503-533;<br />
GOLDSTON, R., et al., J. Comput. Phys. 43 (1981) 61.<br />
[7] SCOTT, S.D., et al., Paper <strong>IAEA</strong>-CN-50/A-III-5, these Proceedings, Vol. 1.<br />
[8] McGUIRE, K., et al., "Coherent <strong>and</strong> turbulent fluctuations in TFTR", Plasma Physics <strong>and</strong><br />
Controlled <strong>Nuclear</strong> Fusion Research 1986 (Proc. 11th Int. Conf. Kyoto, 1986), Vol. 1, <strong>IAEA</strong>,<br />
Vienna (1987) 421-431.<br />
[9] MALACARNE, M., DUPERREX, PA., Nucl. Fusion 27 (1987) 2113-2130.<br />
[10] SENGOKU, S., et al., Phys. Rev. Lett. 59 (1987) 450.<br />
[11] GRIMM, R.C., GREENE, J.G., JOHNSON, J.L., Methods Comput. Phys. 16 (1975) 253.<br />
[12] GRIMM, R.C., DEWAR, R.L., MANICKAM, J., J. Comput. Phys. 49 (1983) 94.<br />
[13] DOBROTT, D., et al., Phys. Rev. Lett. 39 (1977) 943.<br />
[14] LORTZ, D., et al., Phys. Lett., A 68 (1978) 49;<br />
CHOE, W., et al., Phys. Fluids 29 (1986) 1766.<br />
[15] PARK, W., personal communication.<br />
[16] TODD, A.M.M., et al., Nucl. Fusion 19 (1979) 743-752.<br />
[17] TROYON, F., et al., Plasma Phys. Control. Fusion 26 (1984) 209.
<strong>IAEA</strong>-CN-SO/A-VII-S<br />
MAGNETIC TURBULENCE AND RESISTIVE<br />
MHD INSTABILITIES IN A 0.6 < q < 3 POLOIDAL<br />
DIVERTOR TOKAMAK<br />
Y.Z. AGIM, J.D. CALLEN, Z. CHANG, R.N. DEXTER, J.A. GOETZ,<br />
D.E. GRAESSLE, E. HAINES, D. KORTBAWI, M.A. LaPOINTE,<br />
R.A. MOYER 1 , Z. NING, S.C. PRAGER, T.D. REMPEL,<br />
J.C. SPROTT, I. TAN, E. UCHIMOTO 2<br />
University of Wisconsin,<br />
Madison, Wisconsin,<br />
United States of America<br />
Abstract<br />
MAGNETIC TURBULENCE AND RESISTIVE MHD INSTABILITIES IN A 0.6 < q < 3<br />
POLOIDAL DIVERTOR TOKAMAK.<br />
Detailed statistical properties of internal magnetic turbulence, <strong>and</strong> internal disruptions in<br />
magnetically <strong>and</strong> materially limited discharges, are studied in the Tokapole II poloidal divertor tokamak<br />
over the safety factor range 0.6 < qa < 3. A non-linear MHD code treats tearing modes in the<br />
divertor geometry.<br />
I. INTRODUCTION<br />
The Tokapole II poloidal divertor tokamak is operated over<br />
the range of the cylindrical edge safety factor, qa, between<br />
0.6 <strong>and</strong> 3 [1], to investigate two topics - internal tokamak<br />
turbulence <strong>and</strong> resistive MHD instabilities in the presence of a<br />
divertor separatrix <strong>and</strong> scrape-off plasma. Both magnetically<br />
limited discharges (no scrape-off plates beyond the separatrix)<br />
<strong>and</strong> materially limited discharges (scrape-off plates inserted<br />
to the separatrix) are studied. Detailed spatial correlation<br />
properties of the magnetic turbulence are measured within the<br />
plasma using magnetic probes. Although the fluctuation<br />
amplitude increases as qa decreases, qualitative changes in the<br />
turbulence properties are not observed, implying that the<br />
turbulence over the range 0.6 < qa < 3 might be due to a single<br />
underlying cause or set of instabilities. Experimental results<br />
on disruptions <strong>and</strong> tearing modes have been compared with<br />
results from a non-linear MHD code which treats both the<br />
separatrix <strong>and</strong> the scrape-off plasma. In both code <strong>and</strong><br />
experiment it is observed that the m=2, n=1 (2/1) mode <strong>and</strong> its<br />
associated disruptions are suppressed as the q=2 surface<br />
1 University of California-Los Angeles, Los Angeles, CA 90024, USA.<br />
2 Courant Institute, New York University, 251 Mercer Street, New York, NY 10012, USA.<br />
409
410<br />
AGIM et al.<br />
, , , , I , , , ., I , , , , I , ,<br />
FIG. 1. Variation of normalized 8r fluctuations at r — 8 cm <strong>and</strong> energy confinement estimate with<br />
la-<br />
approaches the divertor separatrix. It has earlier been<br />
observed that during sawtooth oscillations in qa < 1<br />
magnetically limited plasmas, q at the centre remains fixed at<br />
0.6. This partial reconnection, recently observed in<br />
materially limited Tokapole II discharges as well, does not<br />
appear in the non-linear MHD code results.<br />
Plasma parameters for these experiments are R ~ 0.5m, a -<br />
0.09m (distance from magnetic axis to separatrix), Tg - 100eV,<br />
10 13 cnT 3 (high qa), to 1.0 x 10 13 cm" 3 n - 0.5 x<br />
cm (low qa), BT<br />
-2 kG (low qa) to 5 kG (high qa). Outside the four-node<br />
separatrix the scrape-off region extends about 13 cm to the<br />
square vacuum vessel wall.<br />
II. MAGNETIC TURBULENCE<br />
As qa is reduced from 3 to 0.6, the normalized radial<br />
magnetic field fluctuations below 400 kHz, Br/B, about one cm<br />
inside the separatrix, increase by about a factor of thirty<br />
(Fig. 1). A rough measure of the global energy confinement<br />
time, tE, correspondingly decreases by a factor of about eight.<br />
The transport evaluated for loss due to stochastic magnetic<br />
fields [2] can be greater than that measured here.
<strong>IAEA</strong>-CN-50/A-VII-5 411<br />
We compare turbulence properties at the extreme values of<br />
the q scan, qa = 2.8 <strong>and</strong> qa = 0.6. Near the separatrix the<br />
frequency spectra are quite similar at the two q values (with<br />
the rms field falling more than two orders of magnitude from 2°<br />
kHz to 400 kHz). In both cases the radial profiles of Br<br />
(measured from r = 6 cm to the edge) resemble the radial<br />
profiles of the equilibrium quantities (current density or<br />
pressure), being more peaked at high qa than at low qa.<br />
The measured radial correlation within the plasma appears<br />
independent of q. At both q values, the radial coherence length<br />
(e-folding distance of the two-point coherence) decreases with<br />
frequency from about 50 cm at 15 kHz to about one cm at 400<br />
kHz. At low q the correlation length is slightly shorter than<br />
at high q.<br />
The poloidal coherence length, L , is measured with two<br />
poloidally separated coils. One can infer the spread in<br />
poloidal mode numbers, Am, which results in the poloidal decay<br />
of the coherence, via the estimate Am = irr/Lp. At high q, Am<br />
increases with frequency from 2 to 15, whereas at low q, Am<br />
increases from 1 to 5. Qualitatively similar results are<br />
obtained from inferences of m from the radial fall-off of §r in<br />
the vacuum-like scrape-off region. The larger number of<br />
poloidal modes at low qa might account for the enhanced<br />
fluctuation level.<br />
Since L does not vary with radius (<strong>and</strong> is similar to<br />
values measured in larger tokamaks) the poloidal scalelength of<br />
the fluctuations might not be linked to the minor<br />
circumference, as are most MHD instabilities (characterized by<br />
fixed m values). Perhaps the modes are tied to an intensive<br />
parameter such as gyroradius or resistive layer width.<br />
The overall similarity of the turbulence over the range<br />
0.6 < qa
412 AGIM et al.<br />
to diminish <strong>and</strong> the radial coherence length decreases to the<br />
sub-gyroradius scale. Br/B over the range 0.5 Mhz to 10 Mhz is<br />
of the order of 10~ 7 . Although this value is small it greatly<br />
exceeds that expected for thermal fluctuations. Using the<br />
fluctuation dissipation theorem we calculate the fluctuation<br />
spectra from thermally generated Alfven <strong>and</strong> magnetosonic waves<br />
using fluid <strong>and</strong> kinetic models. With colliaionless dissipation<br />
(L<strong>and</strong>au, cyclotron damping, etc.) the k spectra are peaked at<br />
small values <strong>and</strong> decay with a half-width of Ak < topi/c. The<br />
resulting fluctuation amplitude is of order 10~ 10 .<br />
Fluctuations increase weakly with frequency.<br />
III. Resistive MHD Instabilities<br />
We report here experimental [3] <strong>and</strong> theoretical results on<br />
the effect of the separatrix <strong>and</strong> scrape-off plasma on 2/1<br />
disruptions in 1 < qa < 2 plasmas <strong>and</strong> on the oscillations in<br />
the central q value during sawtooth oscillations in qa < 1<br />
plasmas. Measurements are compared with a new 2-D finite<br />
difference, 1-D spectral non-linear resistive MHD code RPD<br />
[4,5]. The code adopts a full resistive MHD model in toroidal<br />
geometry, includes the separatrix <strong>and</strong> the scrape-off region<br />
within the computational domain <strong>and</strong> implements a new, efficient<br />
semi-implicit scheme [6] extending one proposed by Harned <strong>and</strong><br />
Kerner [7]. The code uses a magnetic Reynolds number of 10"<br />
<strong>and</strong> the aspect ratio of the perfectly conducting boundary (R/b,<br />
where b is the half-width of the square boundary)of five unless<br />
otherwise noted. Electrical resistivity is taken to be<br />
spatially constant <strong>and</strong> time independent.<br />
The code predicts that the 2/1 tearing mode is linearly<br />
stabilized as the q=2 surface approaches the separatrix(<strong>and</strong> the<br />
flux surfaces become progressively more non-circular).<br />
Experimentally, the 2/1 magnetic activity <strong>and</strong> associated<br />
disruptions are suppressed as qa is lowered <strong>and</strong> the q=2 surface<br />
moves towards the separatrix. The disruptions appear as giant<br />
sawtooth oscillations of period about 1 ms. In magnetic<br />
limiter discharges the 2/1 activity disappears as qa drops<br />
below about 2. The code also shows that addition of plasma<br />
current in the scrape-off region stabilizes the 2/1 mode with<br />
the q=2 surface further from the divertor separatrix. This is<br />
not due to a mere presence of the plasma current but to a<br />
modification of the current profile near the q=2 surface <strong>and</strong><br />
the divertor separatrix. Experimentally, the 2/1 magnetic<br />
activity disappears at a lower qa for the material limiter<br />
discharges (at qa about 1.5) than for the magnetic limiter<br />
discharges. Nonlinear runs of the 2/1 mode show that the<br />
usual non-linear saturation of the growth of the 2/1 magnetic<br />
isl<strong>and</strong> [8] occurs in a poloidal divertor tokamak. However,
y
414 AGIM et al.<br />
Hence, the prevention of total reconnect ion does not seem to<br />
result from the divertor geometry of Tokapole II. Indeed, this<br />
partial reconnection has now also been observed in materially<br />
limited Tokapole II discharges, <strong>and</strong>, recently, in larger<br />
non-diverted tokamaks. The explanation for the partial<br />
reconnection might lie outside the MHD model presently employed<br />
(unless the totally reconnected state is short lived, as may be<br />
true for at least some equilibria studied).<br />
ACKNOWLEDGEMENT<br />
This work is supported by the US Department of Energy <strong>and</strong><br />
by the National Science Foundation.<br />
REFERENCES<br />
[1] BRICKHOUSE, N.S., et al., in Plasma Physics <strong>and</strong> Controlled <strong>Nuclear</strong> Fusion Research 1984<br />
(Proc. 10th Int. Conf. London, 1984), Vol. 1, <strong>IAEA</strong>, Vienna (1985) 385.<br />
[2] KROMMES, J.A., OBERMAN, C, KLEVA, R.G., J. Plasma Phys. 30 (1983) 11.<br />
[3] MOYER, R.A., Magnetic <strong>and</strong> Material Limiter Discharges in Tokapole II, PhD Thesis,<br />
University of Wisconsin-Madison (1988).<br />
[4] UCHIMOTO, E., CALLEN, J.D., GARCIA, L., Bull. Am. Phys. Soc. 30 (1985) 1421.<br />
[5] UCHIMOTO, E., Numerical Simulations of Resistive Magnetohydrodynamic Instabilities in a<br />
Poloidal Divertor Tokamak, PhD Thesis, University of Wisconsin-Madison (1988).<br />
[6] UCHIMOTO, E., CALLEN, J.D., Sherwood Theory Conference, San Diego, California, 1987,<br />
Paper 1D18.<br />
[7] HARNED, D.S., KERNER, W., J. Comput. Phys. 60 (1985) 62.<br />
[8] WHITE, R.B., et al., Phys. Fluids 20 (1977) 800.<br />
[9] OSBORNE, T.H., DEXTER, R.N., PRAGER, S.C., Phys. Rev. Lett. 49 (1982) 734.
MEASUREMENT OF MHD INSTABILITIES<br />
IN HIGH BETA TOKAMAKS*<br />
M.E. MAUEL, T.H. IVERS, H.Y. CHE, D. CHEN, D. GATES,<br />
T.C. MARSHALL, G.A. NAVRATIL, J. WANG<br />
Plasma Physics Laboratory,<br />
Department of Applied Physics,<br />
Columbia University,<br />
New York, N.Y.<br />
D.S. DARROW, M. ONO<br />
Plasma Physics Laboratory,<br />
Princeton University,<br />
Princeton, New Jersey<br />
United States of America<br />
Abstract<br />
<strong>IAEA</strong>-CN-50/A-VH-6<br />
MEASUREMENT OF MHD INSTABILITIES IN HIGH BETA TOKAMAKS.<br />
Measurements of pressure driven <strong>and</strong> current driven MHD instabilities observed with arrays of<br />
internal <strong>and</strong> external probes in Columbia's high beta tokamak, HBT, <strong>and</strong> in Princeton's CDX tokamak<br />
are presented. The internal magnetic field measurements can be used to reconstruct the equilibrium <strong>and</strong><br />
permit comparison of the observed instabilities with the numerical predictions of ideal MHD theory.<br />
Near the Troyon-Sykes critical beta, the amplitude of the instability is concentrated in the outer region<br />
of bad curvature, illustrating the influence of high pressure on the mode's internal structure.<br />
1. Introduction<br />
The HBT experiment at Columbia University is a pulsed, high beta<br />
tokamak capable of producing either very high beta plasmas ( < 30%, Bt <<br />
0.4 T) by rapidly reversing the toroidal field or lower beta plasmas ( < 4%,<br />
Bt < 0.7 T) through intense ohmic heating [1,2]. A unique feature of the HBT<br />
tokamak is its small size <strong>and</strong> rapid, high voltage formation technique, permitting<br />
HBT to establish equilibrium more quickly than the characteristic times of ideal<br />
MHD instabilities <strong>and</strong> to operate with parameters well beyond the threshold for<br />
ideal MHD instability. For example, HBT can operate as a toroidal z-pinch (qa ~<br />
0.5), as a low beta tokamak Q3p ~ 1), or as a high beta tokamak (pp > Rla ~ 3)<br />
by independently varying the gas fill pressure, the toroidal field, <strong>and</strong> the plasma<br />
toroidal current. In each of these cases, we have observed toroidally nonaxisymmetric<br />
magnetic perturbations consistent with predictions for the onset of<br />
fast growing ideal n=\,m
416 MAUELetal.<br />
Small tokamak plasmas illustrating high beta instabilities with m ~ 4 have<br />
also been made in the CDX device at Princeton Plasma Physics Laboratory. The<br />
plasma parameters of CDX are R = 0.59 m, a = 0.04 m, Bt = 0.4 T, 5 < qa < 10,<br />
~ 2 x 10 19 m- 3 , <strong>and</strong> EJ3p < 1 [3]. These plasmas are formed <strong>and</strong><br />
maintained solely by a low energy (~ 400 V), high current (~ 125 A) electron<br />
beam which provides substantial heating power to the plasma [4],<br />
2. High-/} <strong>and</strong> low-? instabilities in the HBT pulsed tokamak<br />
The HBT diagnostic set includes several arrays of internal <strong>and</strong> external<br />
magnetic probes, a CO2 interferometer, a 16-channel IR tomography array, a 10point<br />
Thomson scattering system, a tunable monochromator for visible line<br />
emission detection <strong>and</strong> several Rogowski coils to measure the plasma current<br />
<strong>and</strong> various external coil currents. The poloidal beta, f3p, the cylindrical safety<br />
factor (q* = 2Tta 2 Bt/fjQRIp), <strong>and</strong> the central safety factor (jqeff(P) =BtAr/RABo)<br />
are measured magnetically throughout the shot [1]. The average beta is<br />
determined from the equilibrium relationship <strong>and</strong> is presented here normalized to<br />
the Troyon-Sykes critical beta (fic = 3.5 x 10~ 8 IlaBt) [5,6], The value of <br />
determined from the equilibrium relationship for a circular cross-section plasma<br />
is found to be in close agreement with Thomson scattering profile measurements<br />
<strong>and</strong> free boundary equilibrium calculations described in Section 3.<br />
Figure 1 illustrates the evolution of an ohmically sustained discharge (<br />
~ 10 eV, ~ 1.5 x 10 14 cm~^) in which the plasma current is steadily<br />
increased as the toroidal field decays (Figs, la <strong>and</strong> lb). The plasma is observed<br />
to become unstable as q* approaches 2 <strong>and</strong> //Jc exceeds 1.0 (Figs, lc <strong>and</strong><br />
le). The instability is characterized by the rapid onset of toroidally nonaxisymmetric<br />
fluctuations of the internal magnetic field <strong>and</strong> a gross inward<br />
motion of the plasma column as measured by two multi-channel magnetic probes<br />
(Figs, li <strong>and</strong> Id). The two internal probes, toroidally separated by A
10<br />
5<br />
2<br />
1<br />
4<br />
2<br />
+5<br />
0<br />
2.0<br />
1.0<br />
Plasma Currant (kA)<br />
Toroidal Field (kG)<br />
i i i I i i i i I i '<br />
Magnetic Center (cm)<br />
-*-+- I I ' I<br />
<strong>IAEA</strong>-CN-50/A-VII-6 417<br />
125 150 175 200 125 150 175 200<br />
M-S [is<br />
FIG. 1. Evolution of an example HBT discharge illustrating the onset of MHD activity as q*<br />
approaches 2 <strong>and</strong> {$)/&
418 MAUELetal.<br />
3. Mode structure of high /?, 0.5 < q < 2 discharges in HBT<br />
The measured internal poloidal field fluctuations were compared with the<br />
predictions of ideal MHD by first computing the equilibrium which minimizes the<br />
sum of the squares of the differences between the computed <strong>and</strong> measured<br />
internal poloidal <strong>and</strong> toroidal field, pressure, external poloidal flux, <strong>and</strong><br />
equilibrium field coil current. For this purpose, a new code was developed,<br />
combining the free boundary equilibrium procedures described by Johnson <strong>and</strong><br />
co-workers [7] with the repeated linearization of the toroidal current profile as<br />
described by Lao, et al. [8]. Since the internal magnetic fields are measured, f3p<br />
<strong>and</strong> k can be independently determined even for HBT's circular cross-sections.<br />
Furtheimore, within the limitations of the analytical model of the plasma current<br />
profile <strong>and</strong> the uncertainty of the measurements, very good agreement between<br />
the measured <strong>and</strong> computed pressure <strong>and</strong> poloidal field profiles has been<br />
obtained allowing accurate numerical estimation of the instabilities predicted by<br />
ideal MHD theory using PEST [9].<br />
Figure 3 illustrates the measured <strong>and</strong> computed fluid displacement for a<br />
high current discharge (q* = 0.56, Bt = 0.04 T, > 20%) <strong>and</strong> the high beta<br />
{q* ~ 2) discharge shown in Fig. 1. The low-
8.0<br />
% 6.0<br />
420<br />
100-<br />
350<br />
MAUEL et al.<br />
RAOIUS (cm)<br />
1.5 2.0 2.5<br />
LINE AVERAGE DENSITY (IO l3 cm" 2 )<br />
FIG. 4. (a) 140 kHz mode amplitude versus position in 600 A discharge; (b) 140 kHz mode amplitude<br />
versus density.<br />
modes are observed having a radial structure similar to that computed numerically<br />
using ideal MHD theory. Higher m, coherent electromagnetic modes are seen in<br />
the CDX plasma having the largest fluctuation amplitude concentrated in regions<br />
of bad curvature, <strong>and</strong> this mode is thought to be a pressure-curvature driven<br />
instability. In both experiments when q* > 2, the instabilities occur only near or<br />
above the Troyon-Sykes limit. These same instabilities may be responsible for<br />
the beta limits observed in larger tokamaks.<br />
3.0
<strong>IAEA</strong>-CN-50/A-VII-6 421<br />
REFERENCES<br />
[1] NAVRATIL, G.A., et a!., in PJasma Physics <strong>and</strong> Controlled <strong>Nuclear</strong> Fusion Research 1986<br />
(Proc. 11th Int. Conf. Kyoto, 1986), Vol. 1, <strong>IAEA</strong>, Vienna (1987) 299.<br />
[2] DENIZ, A., LI, X., MARSHALL, T.C., Phys. Fluids 30 (1987) 2527.<br />
[3] ONO, M., et al., Phys. Rev. Lett. 59 (1987) 2165.<br />
[4] ONO, M., et al., Paper <strong>IAEA</strong>-CN-50/H-I-1, these Proceedings, Vol. 3.<br />
[5] TROYON, F., et al., Plasma Phys. Comroll. Fusion 26 (1984) 209.<br />
[6] SYKES, A., TURNER, M.F., PATEL, S., in Controlled Fusion <strong>and</strong> Plasma Heating (Proc. 11th<br />
Eur. Conf. Aachen, 1983), Vol. 7D, Part II, European Physical Society (1983) 363.<br />
[7] JOHNSON, J.L., et al., J. Comput. Phys. 32 (1979) 212.<br />
[8] LAO, L.L., et al., Nucl. Fusion 25 (1985) 1611.<br />
[9] GRIMM, R.C., DEWAR, R.L., MANICKAM, J., J. Comput. Phys. 49 (1983) 94.<br />
[10] CHE, H.Y., IVERS, T.H., MAUEL, M.E., Rev. Sci. Instrum. 59 (1988) 1057.
STUDY OF PLASMA MHD STABILITY<br />
IN T-7 AND T-10 TOKAMAKS<br />
<strong>IAEA</strong>-CN-50/A-VII-7<br />
A.A. BAGDASAROV, V.V. CHISTYAKOV, A.N. CHUDNOVSKIJ,<br />
N.V. IVANOV, A.M. KAKURIN, P.P. KHVOSTENKO,<br />
P.E. KOVROV, D.A. MARTYNOV, N.L. VASIN, V.V. VOLKOV<br />
I.V. Kurchatov Institute of Atomic Energy,<br />
Moscow,<br />
Union of Soviet Socialist Republics<br />
Abstract<br />
STUDY OF PLASMA MHD STABILITY IN T-7 AND T-10 TOKAMAKS.<br />
The study of size, localization <strong>and</strong> time evolution of magnetic isl<strong>and</strong>s in tokamak plasmas is<br />
important because of their role in the plasma energy balance <strong>and</strong> in the formation of the current density<br />
profile. Experiments investigating the magnetic isl<strong>and</strong>s are described in the paper. — Poloidal magnetic<br />
field perturbations were measured on T-7 in the course of experiments on LH current drive <strong>and</strong> plasma<br />
heating at the second ECR harmonic. Measurements of m = 2 isl<strong>and</strong> position <strong>and</strong> width were performed<br />
on T-10 in the regime with auxiliary plasma heating at the fundamental ECR harmonic.<br />
Synchronous detection of coherent components in the plasma radiation signal at the second ECR<br />
harmonic <strong>and</strong> in the m = 2 Mirnov coil signal was used for these measurements. — The rate of current<br />
penetration into the plasma was measured on T-7 in a regime with pulsed discharge current. The variation<br />
of q = 2 magnetic surface position, identified with certain peculiarities in the visible bremsstrahlung<br />
profile, was recorded for this purpose. — A numerical simulation of the experiments was based<br />
on a transport code involving transport enhancement due to the destruction of magnetic surfaces as a<br />
result of the development of a small scale tearing mode.<br />
1. POLOIDAL FIELD PERTURBATIONS IN THE REGIMES WITH<br />
LH CURRENT DRIVE AND ECR HEATING<br />
The measurements were carried out on T-7 during experiments on current drive<br />
<strong>and</strong> plasma heating [1] in regimes with the following parameters: discharge current<br />
I = 140 kA; toroidal magnetic field BT = 11-18 kG; plasma minor radius<br />
aL = 26 cm; line average plasma density r^ = (1.2-9) x 10 12 cm" 3 . The poloidal<br />
field perturbations at the plasma edge in the frequency range of 1-10 kHz were<br />
recorded, together with an analysis of their spatial structure. In addition, the poloidal<br />
field perturbations in the range of 10-100 kHz (HF perturbations) were measured<br />
without spatial structure analysis.<br />
Oscillograms of the signals corresponding to the m = 2 mode amplitude, to the<br />
HF perturbation amplitude <strong>and</strong> to the plasma density measured with a microwave<br />
interferometer in the limiter shadow (along the vertical chord, r = 31 cm) are shown<br />
in Fig. 1. We see that 'switching on' the LH system results in destabilization of the<br />
423
424<br />
BAGDASAROV et al.<br />
0.1 0.2 0.3<br />
t (s)<br />
0.4 0.5<br />
FIG. 1. (a) Amplitude of m = 2 mode; (b) HF perturbation amplitude; (c) line average plasma density<br />
measured along the vertical chord r = 31 cm.<br />
m = 2 mode <strong>and</strong> in a reduction of the HF perturbation amplitude. Successive application<br />
of ECR heating resulted in m = 2 mode suppression <strong>and</strong> in the excitation of<br />
HF perturbations. In the given regime, the magnitude of the toroidal field corresponded<br />
to the position of the second ECR harmonic at the plasma centre. A<br />
comparison of the oscillograms (b) <strong>and</strong> (c) in Fig. 1 reveals similar time evolutions<br />
of the HF perturbation amplitude <strong>and</strong> the plasma density in the limiter shadow.<br />
In Fig. 2, where the loop voltage <strong>and</strong> the poloidal field perturbation amplitude<br />
versus the line average density are shown, we see that changes in the perturbation<br />
amplitudes on injection of an LH wave into the plasma are related to the current drive<br />
effect. These changes are maximum at low plasma density <strong>and</strong> decrease with rising<br />
iie simultaneously with the reduction in the fraction of driven current, determined<br />
as AU/U.<br />
An m = 2 mode suppression on EC wave injection is observed when the second<br />
ECR harmonic zone is in the interior of the plasma column (Fig. 3). An excitation<br />
of the poloidal field HF perturbations takes place in this case. A displacement of the<br />
second ECR harmonic zone towards the plasma periphery leads to m = 2 mode<br />
destabilization <strong>and</strong> a gradual reduction of the EC wave effect on the HF perturbation.<br />
We see in Fig. 3(c) that EC power deposition into the plasma results in plasma density<br />
reduction when the resonance zone is in the vicinity of the plasma column axis.<br />
The displacement of the resonance zone towards the plasma periphery results in the<br />
reduction of the EC power effect on the density; then, the derivative dn,./dt becomes<br />
positive.
1.5<br />
_ 1.0<br />
><br />
426 BAGDASAROV et al.<br />
_<br />
1.0 -<br />
15 r~*<br />
o x<br />
in * 1.0<br />
°S<br />
x 7<br />
(•a? ^ o.5 -<br />
0<br />
5<br />
•o -5 -<br />
t<br />
o' °o 0o<br />
/ \^<br />
? 58 • • »+t •+••>••.<br />
-«<br />
+4-<br />
+ ++ '°o I<br />
++4-4.<br />
+ \*<br />
OO<br />
O00OOO QO q^<br />
•<br />
+ 0*<br />
1 1 1<br />
+<br />
+ +<br />
°° 0 o 0 oo0<<br />
1 1 + 1<br />
++<br />
+ +<br />
•++<br />
1 1 1 •<br />
-30<br />
J<br />
-20<br />
J<br />
-10 0<br />
r (cm)<br />
11 12 13 14 15<br />
BT (kG)<br />
. . . . . . .<br />
+ +<br />
(a)<br />
'o°°o ****^£<br />
1 1 ° 1<br />
+<br />
+<br />
++ +<br />
1 1 1<br />
t<br />
1 1 1<br />
10 20 30<br />
16 ;<br />
I<br />
17 18<br />
FIG. 3. Dependence of (a) m = 2 mode amplitude, (b) HFperturbation amplitude <strong>and</strong> (c) the derivative<br />
dnjdt taken just after 'switching on' the EC system on the toroidal magnetic field: • — Ohmic<br />
regime; o — 30 ms after 'switching on' LH; H 30 ms after 'switching on' EC (LH is on).<br />
Mirnov coil signal amplitude at two values of the toroidal field are shown in Fig. 4.<br />
The duration of the EC pulse <strong>and</strong> the spatial position of the ECR point are also<br />
shown.<br />
In Fig. 5, the relationship between the isl<strong>and</strong> width <strong>and</strong> the m = 2 poloidal field<br />
amplitude at the plasma edge is shown. We see that within the experimental accuracy<br />
this dependence can be approximated by a square root dependence, W = 6.5 VSg,<br />
as is shown by the dashed line, where W is measured in cm <strong>and</strong> Be in G. The square<br />
root dependence corresponds to the theoretical prediction [5]. An estimate of the<br />
proportionality factor between W <strong>and</strong> Be, made similar to that in Ref. [4] for our<br />
experimental conditions, yields a value of 10 cm-G" 1/2 , which does not contradict
20<br />
£ 15 -<br />
" 10<br />
II<br />
5<br />
5 — ECH<br />
<strong>IAEA</strong>-CN-50/A-VTI-7 427<br />
(a)<br />
ECH<br />
r- ^<br />
(b)<br />
0.3 0.4 0.5 0.6 0.3 r 0.4 i 0.5 i 0.6<br />
FIG. 4. Time variations ofm = 2 magnetic isl<strong>and</strong> position <strong>and</strong> width (above) <strong>and</strong> m = 2 mode amplitude<br />
(below) at two values of toroidal magnetic field: (a) BT = 29.5 kG, (b) BT = 31.6 kG. Duration<br />
of heating <strong>and</strong> resonance zone position are shown by black lines.<br />
t(s)<br />
0.2 0.4 0.6 0.8 1.0<br />
FIG. 5. Relationship between magnetic isl<strong>and</strong> width <strong>and</strong> m — 2 mode amplitude.<br />
the result of the measurement. This conclusion seems to be important for underst<strong>and</strong>ing<br />
the role of the magnetic isl<strong>and</strong>s in the plasma energy balance <strong>and</strong> does not seem<br />
to be evident a priori. Indeed, the magnetic isl<strong>and</strong> width in theory is defined as the<br />
maximum distance between the separatrices limiting the isl<strong>and</strong>, i.e. as a magnetic<br />
structure characteristic, <strong>and</strong> the result of our measurement by the method of synchronous<br />
plasma radiation detection yields the width of the region where the electron<br />
temperature is equalized, i.e. the width of the region with enhanced heat conduction.<br />
The agreement between theoretical <strong>and</strong> experimental values of W means that<br />
enhanced electron heat conduction prevails just in the region that is limited by the<br />
magnetic isl<strong>and</strong> separatrices.
428 BAGDASAROV el al.<br />
3. RATE OF CURRENT PENETRATION INTO THE PLASMA<br />
Measurement of the current penetration rate is difficult because it must<br />
be done under non-stationary conditions. An oscillating discharge current regime<br />
was arranged on T-7 for such a measurement (BT = 17.6 kG, aL = 27 cm,<br />
n,, « 2 x 10 13 cm~ 3 ). The time dependence of the radius of the rational magnetic<br />
surface q = 2 was studied in this regime. The spatial position of this surface was<br />
determined by a method [6] based on the recording of certain peculiarities in the<br />
visible bremsstrahlung radiation profiles. The scanning system allowed the profile to<br />
be obtained in about 1 ms; the space resolving power was about 1 cm. The result of<br />
measuring the time behaviour of the q = 2 surface is shown by the dots in Fig. 6(b).<br />
With the accuracy of the experimental data scatter of about ± 10 ms, Fig. 6 demonstrates<br />
the absence of a time delay for rs2(t) as compared with I(t).<br />
The solid curve in Fig. 6(b) shows the variation in time of the q = 2 surface<br />
position as obtained by a solution of the plasma current diffusion equation in cylindrical<br />
geometry:<br />
dt r3r<br />
where y. is the inverse value of the safety factor. The radial distribution of the plasma<br />
electrical conductivity, a(r), was chosen so as to fit the time average experimental<br />
values of the loop voltage <strong>and</strong> the q = 2 surface radius. The results of the calculation<br />
were virtually independent of tr(r) distribution configuration if these conditions were<br />
satisfied.<br />
In Fig. 6(b), we see that the calculated curve is located outside the field of<br />
experimental points characterizing the dependence rs2(t) <strong>and</strong> is shifted to the right by<br />
about 30 ms in comparison with the discharge current oscillogram. The discrepancy<br />
between calculated <strong>and</strong> experimental dependences, rs2(t), implies that an anomalously<br />
rapid current penetration through the plasma layer between its edge <strong>and</strong> the<br />
q = 2 surface takes place in the T-7 discharge under study.<br />
The amplitudes of the poloidal magnetic field perturbation harmonics with<br />
2 < m < 5 at frequencies of a few kHz were changing in time, approximately<br />
repeating the changes in the discharge current. The time behaviour of the m = 6<br />
mode, which had a frequency of ~ 10 kHz, turned out to be different. The amplitude<br />
of this harmonic was oscillating, <strong>and</strong> the maxima of these oscillations corresponded<br />
to the phases of rise <strong>and</strong> drop in the discharge current. The HF poloidal field oscillations<br />
in the frequency range of 10-100 kHz (Fig. 6(f)), which probably are tearing<br />
modes with high m numbers, behaved similarly to m = 6 mode.
200 -<br />
<strong>IAEA</strong>-CN-S0/A-Vn-7 429<br />
I I I I<br />
0.1 0.2 0.3 0.4<br />
FIG. 6. Changes in time: (a) discharge current <strong>and</strong> voltage; (b) q = 2 magnetic surface radius;<br />
(c) isotherms, r(Te); (d) electron energy confinement time in the region r < 16 cm; (e) m = 2 poloidal<br />
field oscillation amplitude near the plasma edge; if) amplitude of HF poloidal field perturbation in<br />
10-100 kHz frequency range.
430 BAGDASAROV et al.<br />
1.5<br />
1.0<br />
0.5<br />
0<br />
' q(al = 3<br />
I I I I<br />
2 4 6 8<br />
ne (X10 13 crrT 3 )<br />
I<br />
10<br />
-60<br />
40 S.<br />
- 20<br />
FIG. 7. Calculated dependences of Tr(0) <strong>and</strong> rE on the line average electron density.<br />
4. PLASMA ENERGY BALANCE SIMULATION WITH<br />
ACCOUNT OF MAGNETIC SURFACE DESTRUCTION<br />
A possible explanation of the electron heat transport anomaly in tokamaks is<br />
based on the assumption that the tearing mode marginal stability condition is satisfied<br />
in the plasma [7]. This condition is determined by the shape of the current density<br />
radial distribution. It is reached by overheating of the plasma column interior, resulting<br />
in a peaking of the electron temperature profile <strong>and</strong>, hence, also in a peaking of<br />
the plasma conductivity profile. On attaining the threshold, the development of the<br />
instability results in a destruction of the magnetic surfaces <strong>and</strong> in an enhancement of<br />
transport which prevents further peaking of the radial distributions, such that a steady<br />
state is established in the plasma. In other words, the contradiction between two profiles<br />
— the tendency of the temperature profile to peaking <strong>and</strong> the impossibility of<br />
unbound peaking for the current profile — determines their steady state shape <strong>and</strong><br />
specifies the radial heat transport.<br />
According to Ref. [7], the destruction of the magnetic surface structure should<br />
occur when the tearing mode stability condition, £ = 0.4 7rr 2 (-j')/Be
60<br />
40<br />
20<br />
n<br />
/<br />
l<br />
<strong>IAEA</strong>-CN-S0/A-VII-7 431<br />
Se=7x10 13 cm" 3<br />
^ \<br />
^ ne = 2X10 I3 cm" 3<br />
I I 1 1<br />
FIG. 8. TE versus safety factor at the plasma edge.<br />
magnetic field perturbation. For a rough approximation, according to Ref. [7], we<br />
assume the magnetic isl<strong>and</strong> width to be W = r/m <strong>and</strong> the characteristic mode number<br />
m = 10. In this case, we obtain<br />
^ ini4<br />
Xe = 10<br />
2 R 2<br />
Tf 2<br />
where xe is measured in cm 2 -s"', Te in eV, n
432 BAGDASAROV et al.<br />
100<br />
80<br />
60<br />
40<br />
20<br />
ne = 7X10 13 cm" 3 /<br />
^ — - * ^<br />
ne = 2X10 13 cm" 3<br />
q(a) = -3<br />
n<br />
I I I I<br />
0 0.2 0.4<br />
Te(a) (keVI<br />
0.6 0.8<br />
FIG. 9. TE versus electron temperature at the plasma edge.<br />
15<br />
10<br />
100<br />
50<br />
+ P AUX (MW1<br />
/<br />
/<br />
8 10<br />
FIG. 10. TJO) <strong>and</strong> plasma energy content, E (r < 0.75 a), versus heating power P0H + PAUX.
LU<br />
30 -<br />
20 -<br />
10 -<br />
<strong>IAEA</strong>-CN-50/A-V1I-7 433<br />
\sBe = 7X10 13 cm" 3<br />
q(a) • 3<br />
-^___Re = 2X10 13 crrr 3<br />
~~ .<br />
1 1<br />
0.2 0.4<br />
r AUX /a<br />
_<br />
^--^<br />
FIG. 11. Change of plasma energy content, AE, under auxiliary healing, PAUX = 1 MW, versus the<br />
point of power deposition.<br />
of the electron heat diffusivity coefficient on whether the plasma stability condition<br />
is satisfied. Indeed, an increase in Te(a) broadens the electron temperature profile<br />
<strong>and</strong> thus assists stability improvement. Note that in the calculation of rE we use an<br />
excess of Te(r) over Te(a).<br />
Let us now simulate the regimes with auxiliary plasma heating. For the sake of<br />
definiteness, let us assume that the auxiliary heating power is deposited into the electron<br />
component locally along the plasma minor radius. The calculated dependences<br />
are shown in Fig. 10, where, according to the experiments [13], a deterioration of<br />
plasma thermal insulation takes place with rising POH + PAUX- The rE reduction<br />
with rising power is obtained both in the Ohmic regime with a change in the plasma<br />
current <strong>and</strong> in the auxiliary heating regime with fixed current.<br />
A displacement of the auxiliary power deposition point towards the plasma<br />
periphery, in both calculation (Fig. 11) <strong>and</strong> experiments [14], does not result in a<br />
strong deterioration of deposited energy confinement because it is accompanied by<br />
an improvement in the thermal insulation in the interior of the plasma column. The<br />
same explanation can be given for an effect that is, at a first glance, paradoxical; it<br />
is observed in the experiment [15] when the core temperature, Te(0), rises <strong>and</strong><br />
remains higher than the temperature at the point of auxiliary power deposition<br />
(Fig. 12).<br />
1<br />
0.6
434 BAGDASAROV et al.<br />
1.5<br />
- 1.0<br />
CD<br />
0.5<br />
0<br />
—Vl >v C<br />
1 MW<br />
b<br />
1 —,<br />
|<br />
0.5<br />
r/o<br />
ne = 2X10 13 cm" 3<br />
q(a) = 3<br />
FIG. 12. Variation of TJr) profile under non-central auxiliary heating: (a) before startup of heating;<br />
(b) 10 ms after 'switching on' the heating; (c) 30 ms after 'switching on' the heating.<br />
i<br />
o<br />
4 -<br />
3 -<br />
2 -<br />
- A<br />
r<br />
q(a)=4.8<br />
-02 -0.1 0 0.1<br />
(r AUX- r S )/a<br />
0.2 0.3<br />
FIG. 13. Calculated width of the m = 2 magnetic isl<strong>and</strong> under ECRH, normalized to isl<strong>and</strong> width in<br />
the Ohmic regime versus position of power deposition point with respect to q = 2 magnetic surface<br />
radius.<br />
The adopted model naturally describes the experimentally observed [16] nonlinear<br />
dependence of the radial heat flux on the electron temperature gradient. This<br />
dependence provides high rates of propagation for heat waves emerging in the plasma<br />
in the presence of sawtooth oscillations [17] <strong>and</strong> under pulsed auxiliary heating [18].<br />
In our calculations, the electron heat diffusivity coefficient found from the heat wave<br />
1.0
as<br />
if<br />
200 -<br />
100 --<br />
20 - I<br />
10 -<br />
15 — -<br />
5<br />
0<br />
20<br />
,*10<br />
-<br />
<strong>IAEA</strong>-CN-50/A-VII-7 435<br />
— •<br />
•<br />
t (0.1 s/div)<br />
(c)<br />
~"""""""* 0.5<br />
FIG. 14. Result of a numerical simulation of the regime with oscillating discharge current.<br />
propagation velocity, which is produced on the T(r) profile after switching on the<br />
auxiliary heating, exceeds the time averaged quasi-stationary coefficient by one to<br />
two orders of magnitude.<br />
The information on the current density profile obtained from the solution of the<br />
transport equations was used to calculate the m = 2 magnetic isl<strong>and</strong> evolution which<br />
is described in Rutherford's regime by the equation dW/dt = wRa 2 A' [5]. The<br />
results of calculations (Fig. 13) for the experimental conditions given in Fig. 4 show<br />
that isl<strong>and</strong> suppression is reached under core plasma heating <strong>and</strong> under heating of the<br />
region in the vicinity of the q = 2 surface. Between the suppression zones, there is<br />
a comparatively narrow region where magnetic isl<strong>and</strong> extension takes place. The<br />
obtained result is in general agreement with both the experimental data in Figs 3 <strong>and</strong><br />
4 <strong>and</strong> the data from Ref. [2]. The abrupt transition from the instability drive to its<br />
0.8<br />
(d)<br />
i<br />
i<br />
I<br />
I
436 BAGDASAROV et a!.<br />
suppression for heating of different sides of the q = 2 surface is related to the variation<br />
of current density gradient in the vicinity of this surface. The suppression of the<br />
m = 2 mode under on-axis heating is determined by an integral effect of the current<br />
profile on the stability. The main role is played here by the values of the shear <strong>and</strong><br />
the poloidal magnetic field in the vicinity of the q = 2 surface.<br />
One of the possible explanations for the result obtained on the anomalous rate<br />
of current penetration into the plasma is related to the destruction of the structure of<br />
the isolated magnetic surfaces which occurs at variations of the current density profile.<br />
The simple diffusion approximation for the current penetration through the<br />
plasma becomes invalid in this case. This is confirmed by the result of calculations<br />
(Fig. 14) made within the framework of our model. In Fig. 14, we see that in the<br />
calculations, as in the experiment, the phase of the oscillations of the q =2 surface<br />
radius virtually coincides with the phase of the discharge current oscillations. A rise<br />
in the electron energy confinement time at the stage of current increase (Fig. 14) is<br />
natural for the model since the variation in the current density profile assists in the<br />
improvement of tearing mode stability in the interior of the plasma column. A similar<br />
T£e behaviour is also observed in the experiment.<br />
REFERENCES<br />
[1] ALIKAEV, V.V., et al., in Controlled Fusion <strong>and</strong> Plasma Physics (Proc. 14th Eur. Conf.<br />
Madrid, 1987), Vol. 11D, Part I, European Physical Society (1987) 125.<br />
[2] ALIKAEV, V.V., et al., Pis'ma Zh. Ehksp. Teor. Fiz. 40 (1984) 327.<br />
[3] VOLKOV, V.V., et al., Rep. IAE-405577, Institute of Atomic Energy, Moscow (1984).<br />
[4] VASIN, N.L., et al., Fiz. Plazmy 12 (1986) 259.<br />
[5] RUTHERFORD, P.H., Phys. Fluids 16 (1973) 1903.<br />
[6] IVANOV, N.V., et al., Fiz. Plazmy 10 (1984) 432.<br />
[7] IVANOV, N.V., Fiz. Plazmy 9 (1983) 703.<br />
[8] DNESTROVSKIJ, Yu.N., et al., Computational Methods in Plasma Physics, Moscow (1984).<br />
[9] GONDHALEKAR, A., et al., in Plasma Physics <strong>and</strong> Controlled <strong>Nuclear</strong> Fusion Research 1978<br />
(Proc. 7th Int. Conf. Innsbruck, 1978), Vol. 1, <strong>IAEA</strong>, Vienna (1979) 199.<br />
[10] VLASENKOV, V.S., et al., ibid., p. 211.<br />
[11] MURAKAMI, M., et al., ibid., p. 269.<br />
[12] WAGNER, F., et al., in Plasma Physics <strong>and</strong> Controlled <strong>Nuclear</strong> Fusion Research 1982 (Proc.<br />
9th Int. Conf. Baltimore, 1982), Vol. 1, <strong>IAEA</strong>, Vienna (1983) 43.<br />
[13] GOLDSTON, R., Plasma Phys. Contrail. Fusion 26 (1984) 87.<br />
[14] ALIKAEV, V.V., et al., in Plasma Physics <strong>and</strong> Controlled <strong>Nuclear</strong> Fusion Research 1984 (Proc.<br />
10th Int. Conf. London, 1984), Vol. 1, <strong>IAEA</strong>, Vienna (1985) 419.<br />
[15] ALIKAEV, V.V., et al., in Plasma Physics <strong>and</strong> Controlled <strong>Nuclear</strong> Fusion Research 1986 (Proc.<br />
11th Int. Conf. Kyoto, 1986), Vol. 1, <strong>IAEA</strong>, Vienna (1987) 111.<br />
[16] BAGDASAROV, A.A., et al., in Plasma Physics <strong>and</strong> Controlled <strong>Nuclear</strong> Fusion Research 1982<br />
(Proc. 9th Int. Conf. Baltimore, 1982), Vol. 3, <strong>IAEA</strong>, Vienna (1983) 281.<br />
[17] FREDRICKSON, E.D., et al., Nucl. Fusion 26 (1986) 849.<br />
[18] T-10 GROUP, in Controlled Fusion <strong>and</strong> Plasma Physics (Proc. 12th Eur. Conf. Budapest, 1985),<br />
Vol. 9F, Part I, European Physical Society (1985).
RELAXATION OF q PROFILE IN A HIGH BETA<br />
VERY LOW q TOKAMAK PLASMA IN TPE-2<br />
H. KIYAMA, K. HAYASE, I. HIROTA, S. KIYAMA,<br />
Y. MAEJIMA, Y. SATO, S. TAKEDA, E. YAHAGI,<br />
H. ASHIDA, K. SUGISAKI, K. KOYAMA,<br />
A.A.M. OOMENS 1<br />
Electrotechnical Laboratory,<br />
Agency of Industrial Science <strong>and</strong> Technology,<br />
Tsukuba-shi, Ibaraki-ken,<br />
Japan<br />
Abstract<br />
<strong>IAEA</strong>-CN-50/A-VII-8<br />
RELAXATION OF q PROFILE IN A HIGH BETA VERY LOW q TOKAMAK PLASMA IN TPE-2.<br />
The initial q profiles of a high (3 plasma in TPE-2, which are produced by fast or slow programming<br />
of the toroidal <strong>and</strong> the poloidal fields, relax to a specific final q profile in a short time. The selforganized<br />
final q profile does not depend on the initial q profiles, the discharge modes, or the histories<br />
of the plasma. The electron density also relaxes to a profile depending on the q; value. A configuration<br />
with a specific final q profile might be in a minimum energy state. Confinement deteriorates when relaxation<br />
oscillations are observed. The formation of flat current density <strong>and</strong> flat electron density profiles<br />
seems to be essential for the stable confinement of a high p, low q plasma.<br />
1. INTRODUCTION<br />
TPE-2 is a toroidal screw pinch device with elongated cross-section (b/a =<br />
21 cm/13 cm, K = 1.6, A = 3.0) <strong>and</strong> a conducting shell [1, 2]. High (3 tokamak<br />
plasmas with 0, - 0.1, j3p ~ 1 <strong>and</strong> qf > 1.2 are produced by fast <strong>and</strong>/or slow<br />
pulsed discharges <strong>and</strong> are stably confined (TE > 1 ms) in the parameter ranges of T<br />
= 50-400 eV <strong>and</strong> ii,. = (0.5-5) x 10 20 irr 3 [3-5]. In the fast pulsed discharge, the<br />
implosion heated plasma (T; S> Te) is further heated by Ohmic dissipation in the<br />
confinement stage. In the slow pulsed discharge the plasma is heated mainly by<br />
Ohmic dissipation [6].<br />
The low q operation of tokamaks is of particular importance for realizing high<br />
/3 confinement <strong>and</strong> effective Ohmic heating. It is one of the c<strong>and</strong>idates for the<br />
improvement <strong>and</strong> optimization of the tokamak concept.<br />
Low q plasmas, such as in RFPs <strong>and</strong> spheromaks, have their inherent configurations<br />
of the self-organized magnetic state. The RFP configuration is, for example,<br />
described by the energy principle, in which the force free equilibrium of a constant<br />
1 FOM-Instituut voor Plasmafysica 'Rijnhuizen', Nieuwegein, Netherl<strong>and</strong>s.<br />
437
438 KIYAMA et al.<br />
H profile is in the minimum energy state [7]. In the tokamak regime, the magnetic<br />
configuration with the same minimum energy state should have an approximately<br />
constant pitch profile in a cylindrical plasma, which became apparent in the early<br />
stage of the screw pinch experiment [8]. The plasma, with a tight aspect ratio <strong>and</strong><br />
an elongated cross-section, has a tendency to increase q towards the periphery, even<br />
if it has a constant ^ profile. Recently, the minimum energy state of a high 0 tokamak<br />
plasma (jSp ~ 1) has been discussed, <strong>and</strong> it was shown that specific current <strong>and</strong><br />
pressure profiles exist [9]. These ideas suggest that the profiles should relax to a<br />
characteristic equilibrium state derived from the minimum energy state. The high 0<br />
plasma plays an important role in the process of self-organization. A deviation of the<br />
profiles causes the release of excess energy, which then degrades the confinement.<br />
In this paper, we study the formation <strong>and</strong> the relaxation of the q <strong>and</strong> density profiles<br />
in a wide range of discharge parameters. The relaxation towards a specific q profile<br />
is shown to exist. The profile is compared with a theoretical calculation. We also<br />
demonstrate the experimental evidence of such consideration in the high q to low q<br />
transition. Relaxation oscillations are clearly observed near the low q limit <strong>and</strong> in the<br />
low density region, <strong>and</strong> their relevance to confinement deterioration is presented.<br />
2. EXPERIMENTAL SET-UP<br />
Plasmas with various q values can be produced by fast or slow programming<br />
control of the poloidal <strong>and</strong> toroidal fields. Low q (qf ~ 1.2-1.8) or high q(q, > 2)<br />
stable plasmas with a nearly constant pitch profile are produced by setting up an operation<br />
with constant q at the wall, in a fast or slow screw pinch operation mode in<br />
which the rise time of the plasma current is 2.8 fts <strong>and</strong> 300 /xs, respectively (fast constant<br />
current mode <strong>and</strong> slow screw pinch mode) [5, 6]. The low q plasmas can be<br />
produced by decreasing qf from high q plasmas (Ip ramp-up mode). Furthermore,<br />
the various initial q profiles (hollow, flat <strong>and</strong> peaked) can be produced independently<br />
of j8p <strong>and</strong> qf by fast programming control, in which the time difference of the initiation<br />
of the poloidal <strong>and</strong> the toroidal fields is slightly changed, as is shown in<br />
Fig. l(a). The initial 0, <strong>and</strong> /3p values are also controlled by preheating parameters,<br />
filling pressures <strong>and</strong> implosion heating rates.<br />
3. RELAXATION OF q PROFILE<br />
3.1. Self-organized q profile<br />
Profiles of q, which are initially hollow or peaked, develop into a specific profile,<br />
as is shown in Fig. l(a). The specific q profile is self-organized through the<br />
relaxation process in several tens of microseconds after the initiation of the discharge,<br />
if the initially programmed q profiles deviate from the specific one, <strong>and</strong> this situation
0 0.5 1.0<br />
<strong>IAEA</strong>-CN-50/A-VII-8 439<br />
. • Const. :2.5 mlorr<br />
1 Romp:2.5mtorr<br />
:2.0<br />
:8.0<br />
^ Slow screw<br />
:2.5mton<br />
=(LP/27rf?rlic/ip<br />
F/G. 7. (a^ Initial q^ profiles, hollow or peaked at JO us after the initiation (solid line), <strong>and</strong> relaxed<br />
q profile (dotted line), at 150 us after the initiation. &t is the time delay of the plasma current with respect<br />
to the toroidal field, (b) Peripheral qia <strong>and</strong> near-axis q^of various plasmas versus q^ q^ is
440<br />
transition<br />
S<br />
2 0.5<br />
0<br />
KIYAMA et al.<br />
I I I . I ,<br />
D 0.5<br />
initial<br />
ranfip-up succeeded.<br />
ramp-up failed ]<br />
. . . i i<br />
1.0<br />
8»<br />
FIG. 2. $p immediately after the transition through q, = 2 (at 150 us after the initiation) versus initial<br />
@p (at 50 us after the initiation). Dots <strong>and</strong> crosses are for the cases of successful <strong>and</strong> failed ramp-up,<br />
respectively.<br />
the plasma state with the specific q profile might be in a minimum energy equilibrium<br />
state of the high & <strong>and</strong> low q tokamak.<br />
3.2. Effect of 13 on the transition from high q to low q<br />
The transition through qf ~ 2 from the high q plasma with high S number (S<br />
~ 10 6 ) can also be attained by slow ramping of the plasma current. The transition<br />
is usually accompanied by a rapid (one or two orders of magnitude shorter than the<br />
tearing mode growth time) <strong>and</strong> violent relaxation process. In this configuration, when<br />
qf = 2, q^ near the axis is about 2, instead of about 1, as in the usual tokamaks. The<br />
transition is sometimes not successful <strong>and</strong> results in plasma current limitation, especially<br />
for excessively elongated <strong>and</strong> inward shifted plasmas. The necessary condition<br />
of initial j3p to achieve the transition to the low q regime is shown in Fig. 2. This<br />
figure shows that /3p must be higher than the critical value before the transition. At<br />
the transition, the high /3 plasma causes an outward shift of the plasma column itself,<br />
which results in the reduction of q^ <strong>and</strong> a deepening of the magnetic well near the<br />
column axis. The initial high @ plasma can supply the energy which may be necessary<br />
to drive the transition.<br />
3.3. Relaxation of density profile<br />
The electron density profile also relaxes to a specific profile. A flat density profile<br />
of a high q plasma relaxes to a peaked profile, <strong>and</strong> a peaked density profile of<br />
a low q plasma relaxes to a flat profile. This occurs in most cases simultaneously with<br />
the q profile relaxation, <strong>and</strong> the profile stays roughly constant during the rest of the<br />
discharge. The profile changes drastically at qf ~ 2, as is shown in Fig. 3. At the<br />
high q to low q transition, the profile changes from peaked to flat, <strong>and</strong> vice versa<br />
at the transition from low q to high q. The volume averaged density of the constant
0 6 12 (Wall)<br />
r(cm)<br />
<strong>IAEA</strong>-CN-50/A-VH-8 441<br />
0 6 12 (Wall)<br />
r (cm)<br />
FIG. 3. Density profiles through the transition of qs ~ 2,<br />
qf plasma (constant current mode) is nearly constant during the discharge, except in<br />
high density plasmas (ne > 3 X 10 20 m" 3 ). In the ramp-up current mode, when qf<br />
passes through 2, the central density decreases rapidly to 2/3-1/2, mainly owing to<br />
flattening of the density profile, then it stays constant. The relaxation of the density<br />
profile suggests that it has a specific profile which mainly depends on the qf value.<br />
The profile of the ion temperature from C V Doppler broadening gradually<br />
becomes broad with time during the discharge. The profile of the electron temperature,<br />
measured by Thomson scattering, also broadens gradually. Since the temperature<br />
profile is steeper than the density profile, the pressure profile is not so flat as<br />
the density profile.<br />
4. ENERGY CONFINEMENT AND FLUCTUATIONS<br />
The global energy confinement time TE is evaluated from rE = Wp/(Vp Ip -<br />
dWp/dt). The plasma energy Wp is calculated from j8p. The relation of the global<br />
energy confinement time TE to the electron density <strong>and</strong> the plasma current is found<br />
to be close to the neoclassical scaling in the MHD region, that is, TE OC Ipn,., as is<br />
shown in Figs 4(a) <strong>and</strong> (b) [4, 5, 10]. The radiation loss has been reduced to less than<br />
one third of the total loss. However, confinement deteriorates when periodic, decaying<br />
oscillations appear on the one-turn voltage, the soft X-ray emission, the visible<br />
radiation, <strong>and</strong> the density. In particular, when q( approaches the lowest limit (qf ~<br />
1.2), the density <strong>and</strong> q profiles become very flat, <strong>and</strong> a periodic, decaying oscillation<br />
appears on the one-turn voltage, <strong>and</strong> the density of the peripheral region fluctuates<br />
Time
442 KIYAMA et al.<br />
1.0<br />
ne/ne<br />
0.5<br />
ne/ne<br />
10<br />
7<br />
5<br />
3<br />
2<br />
1<br />
0.7<br />
0.5<br />
0.3<br />
0.2<br />
_<br />
( b ) quiet<br />
• / ; • /<br />
*<br />
. 'A<br />
••£..*<br />
*<br />
/<br />
qj,3 q- -2<br />
i . ,i , , ,<br />
d \<br />
-.1 -<br />
°"<br />
\ noisy<br />
«'tf<br />
30 50 70 100 200<br />
[p (VA)<br />
tie<br />
0.5<br />
-3 0 *3 *6 *9 ,, „<br />
i rlrm. /Ishell<br />
centre<br />
ricmi /tube wall<br />
limiter<br />
FIG. 4. Global energy confinement time rE of noisy plasmas with relaxation oscillations <strong>and</strong> of quiet<br />
plasmas as functions of density (a) at Ip ~ 120-130 kA <strong>and</strong> (b) plasma current at n, ~ 10 20 m' 3 ;<br />
(c) profiles of densities <strong>and</strong> density fluctuations of noisy <strong>and</strong> quiet low q plasmas.<br />
intermittently. The density profiles <strong>and</strong> the intensity of their fluctuations are shown<br />
in Fig. 4(c). In the low q plasma, the density fluctuation level at the periphery is<br />
lower in the flat profile than in the peaked. In these noisy plasmas, rE decreases<br />
with decreasing density in the low density region (n,, < 10 20 m" 3 ) <strong>and</strong> also<br />
decreases with decreasing qf, as is shown in Figs 4(a) <strong>and</strong> (b). The deterioration of<br />
the confinement seems to be caused by the deviation from <strong>and</strong> the relaxation to the<br />
specific q profile, accompanied by the relaxation oscillations.<br />
A correlation analysis of horizontal multi-chord soft X-ray signals indicates the<br />
appearance of kink-like modes of low m <strong>and</strong> n numbers in the low q region. The perturbed<br />
poloidal field distribution on the wall surface also has a coherent structure,<br />
corresponding to the intermittent density fluctuation.<br />
Low level high frequency fluctuations are observed in n
5. CONCLUSIONS<br />
<strong>IAEA</strong>-CN-50/A-VH-8 443<br />
The experimental results can be summarized as follows:<br />
Relaxation <strong>and</strong> self-organization of the q profile are observed. The initial q profiles<br />
of a high jS plasma in TPE-2, which are produced by fast or slow programming<br />
of the toroidal <strong>and</strong> poloidal fields, relax to a specific final q profile within a short<br />
time. The current density is nearly flat over the cross-section. The profile does not<br />
depend on the initial q profiles, q( or rig either in the slow screw pinch mode or in<br />
the fast screw pinch mode, <strong>and</strong> does not depend on the plasma histories. The density<br />
profiles also relax to the profiles which depend on the qf value. The configuration<br />
with the specific q <strong>and</strong> density profiles might be in a minimum energy state of a high<br />
/3 <strong>and</strong> very low q plasma. The confinement deteriorates in the plasmas when relaxation<br />
oscillations appear. This could be interpreted to mean that the deterioration of<br />
the confinement is caused by the deviation from <strong>and</strong> the relaxation to the specific q<br />
profile, accompanied by the relaxation oscillations. The formation <strong>and</strong> the sustainment<br />
of the flat current <strong>and</strong> flat density profiles are considered to be essential for a<br />
stable confinement of high (3 <strong>and</strong> low q tokamak plasmas.<br />
ACKNOWLEDGEMENT<br />
This work was supported by the Atomic Energy Bureau, Science <strong>and</strong><br />
Technology Agency, Prime Minister's Office, Japan.<br />
REFERENCES<br />
[1] TAKEDA, S., et al., in Fusion Technology (Proc. 9th Symp. Garmisch-Partenkirchen, 1976),<br />
Vol. 2 (1976) 1943.<br />
[2] SATO, Y., et al., in Fusion Technology (Proc. 11th Symp. Oxford, 1980) 1563.<br />
[3] KIYAMA, S., et al., in Plasma Physics <strong>and</strong> Controlled <strong>Nuclear</strong> Fusion Research 1984 (Proc.<br />
10th Int. Conf. London, 1984), Vol. 1, <strong>IAEA</strong>, Vienna (1984) 393.<br />
[4] HAYASE, K., et al., in Plasma Physics <strong>and</strong> Controlled <strong>Nuclear</strong> Fusion Research 1986 (Proc.<br />
11th Int. Conf. Kyoto, 1986), Vol. 2, <strong>IAEA</strong>, Vienna (1986) 563.<br />
[5] KIYAMA, S., et al., Bull. Electrotech. Lab. 50 (1986) 95.<br />
[6] OOMENS, A.A.M., et al., in Controlled Fusion <strong>and</strong> Plasma Physics (Proc. 14th Eur, Conf.<br />
Madrid, 1987), Vol. 11D, Part II, European Physical Society (1987) 494.<br />
[7] TAYLOR, J.B., Plasma Phys. Controll. Fusion 27 (1985) 1439.<br />
[8] BOBELDIJK, C., et al., in Plasma Physics <strong>and</strong> Controlled <strong>Nuclear</strong> Fusion Research 1976 (Proc.<br />
6th Int. Conf. Berchtesgaden, 1976), Vol. 1, <strong>IAEA</strong>, Vienna (1976) 493.<br />
[9] KADOMTSEV, B.B., Sov. J. Plasma Phys. 13 (1987) 443.<br />
[10] KIYAMA, H., et al., Bull. Electrotech. Lab. 50 (1986) 122.
DISRUPTION CONTROL IN THE TOKAMAK<br />
T.C.HENDER, J. HUGILL, D.C. ROBINSON, T.N. TODD<br />
Culham Laboratory,<br />
Euratom-UKAEA Fusion Association,<br />
Abingdon, Oxfordshire,<br />
United Kingdom<br />
S. ARSHAD, A.W. MORRIS<br />
Oxford University,<br />
Oxford, United Kingdom<br />
K. GRASSIE<br />
Max-Planck-Institut fur Plasmaphysik,<br />
Garching,<br />
Federal Republic of Germany<br />
K.S. RIEDEL<br />
Courant Institute, New York University,<br />
New York, N.Y.,<br />
United States of America<br />
Abstract<br />
<strong>IAEA</strong>-CN-50/A-VII-9<br />
DISRUPTION CONTROL IN THE TOKAMAK.<br />
Analytic <strong>and</strong> numerical modelling shows that the effect of resonant helical fields, <strong>and</strong>/or a resistive<br />
wall, is to cause mode lock of the m = 2 pre-disruptive activity, the results being in close agreement<br />
with experiments on the TOSCA <strong>and</strong> DITE tokamaks. The disruptive density limit on DITE was<br />
extended by 20-25%, using off-axis (low power) ECRH, at 60 GHz. Calculations including toroidal<br />
effects show that an active feedback system using applied m = 2 fields should stabilize pre-disruptive<br />
activity.<br />
1 INTRODUCTION<br />
In most tokamaks the major disruption is preceded by magnetic fluctuations<br />
with poloidal mode number m=2 <strong>and</strong> toroidal mode number n=l. Often<br />
in larger tokamaks (e.g. JET [1]) these (2,1) magnetic fields lock to the wall<br />
<strong>and</strong> cease oscillating while continuing to grow. Mode lock due to magnetic<br />
field inhomogeneity is considered in Section 2.<br />
Neutral beam heating can extend the limit on the density imposed by<br />
the major disruption [2], <strong>and</strong> experiments on CLEO have shown that ECRH<br />
can produce similar effects [3]. In Section 3 we discuss improvements to the<br />
density limit from modest amounts of localized ECRH in DITE.<br />
445
446 HENDERetal.<br />
An alternative method of controlling the disruption is to directly stabilize<br />
the associated (2,1) oscillations using resonant magnetic feedback; as<br />
was achieved on the TO-1 tokamak [4]. In Section 4, we describe modelling<br />
of the magnetic feedback system being implemented on the DITE tokamak.<br />
2 MODE LOCKING<br />
We consider two factors contributing to mode lock. First, a rotating mode<br />
will drive eddy currents in the liner/wall, <strong>and</strong> the resistive damping of these<br />
currents leads to an energy loss, resulting in a reduction in mode frequency<br />
[5]. Secondly, there is a net torque between a rotating mode <strong>and</strong> a static<br />
helical field [6] (which might be imposed directly or be due to an error field).<br />
To elucidate these effects we consider a plasma surrounded by a resistive<br />
liner (time constant TW) which is in turn surrounded by a helical sheet<br />
current (/ — u>o), represents a viscous coupling between the bulk of the<br />
plasma which has toroidal velocity Ru>o/n <strong>and</strong> the plasma near the isl<strong>and</strong><br />
which has velocity Ru>/n. We have compared the predictions of Eq.(l) with<br />
the results of non-linear computations solving the reduced MHD equations,<br />
<strong>and</strong> find good agreement [5].<br />
We can place constraints on the inertia (i.e. a) involved by comparing<br />
the predictions of Eq.(l), <strong>and</strong> non-linear computations, with results from<br />
DITE. Figure 1 shows Be traces measured at two locations separated by<br />
45° poloidally. These signals are dominantly (2,1), with a coupled (3,1)<br />
component. There was 1.3MW of tangential NBI in this case. The strong<br />
distortion to the waveforms, <strong>and</strong> mode locking, from interaction with the<br />
bundle divertor, which induces ~12% (2,1) isl<strong>and</strong>s, is evident. From these
CD<br />
• CD<br />
<strong>IAEA</strong>-CN-50/A-VII-9 447<br />
Time (ms)<br />
FIG. 1. Be signals from DITE showing mode lock to bundle divertor.<br />
waveforms we estimate the required \dw/dt\ ~ 2 x 10 s rad. s 2 giving an<br />
inertial force of 32aN. Equating this force to the toroidal force from the<br />
bundle divertor ( ~ 0.5N when (2,1) Br = 6 x 1(T 4 T) shows that a < 0.016,<br />
i.e. to account for the observed waveforms the mode inertia is less than 1.6%<br />
of the total plasma inertia. This fraction is smaller than the plasma isl<strong>and</strong><br />
width but is approximately equal to the tearing layer width. It should be<br />
noted that we have been considering toroidal forces on the assumption that<br />
poloidal rotation is neo-classically inhibited. It may be, however, that the<br />
poloidal forces have transient effects, in which case a would be larger.<br />
Here we have been considering a situation in which the helical coil forces<br />
are dominant. However, in JET, for example, the damping force from the<br />
resistive wall appears dominant with a small error field ultimately causing<br />
the mode lock [1].<br />
3 DENSITY LIMIT WITH ECRH<br />
Studies on the improvement to the disruptive density limit in hydrogen on<br />
DITE have been made using ~ 85 kW of ECRH at 60 GHz (PRF/POH ~<br />
0.4), launched from a high field side X-mode antenna, 45° above the midplane.<br />
Two resonance locations have been studied; (a) BT = 2.2T giving a<br />
deposition profile from ray tracing peaking close to the magnetic axis <strong>and</strong><br />
extending to r ~ 5cm; (b) BT = 1.9T giving ~ 70% of the power deposited<br />
in a narrower profile (FWHM=2.7cm) peaking outside q = 2 at r ~ 20cm<br />
<strong>and</strong> the remainder mode converted <strong>and</strong> deposited inside q = 2. The launch<br />
angle was 30° from perpendicular but the calculated current drive is < 1%IP
448 HENDER et al.<br />
<strong>and</strong> Jdriven(max) & 4.5% J0hmic{local), so it is not expected to affect the stability<br />
significantly. To determine the density limit, Ohmic discharges were<br />
established just below their density limit, <strong>and</strong> then gas puffing was applied<br />
during the ECRH pulse (~100ms). The rate of gas feed was increased from<br />
shot to shot until a disruption, determined by a negative loop voltage spike<br />
(not necessarily a current termination), occurred during ECRH. The same<br />
gas feed rate was then used in a shot without ECRH, to determine the<br />
Ohmic limit.<br />
The best results were obtained with Ip ~ lOOkA {qcyi{a) ~ 4.5), using<br />
edge heating. Here the density limit increased from ne = 3.4 x 10 19 m~ 3<br />
(Ohmic) to ne = 4.1 x 10 19 m- 3 (ECRH) (Fig. 2). With central heating<br />
the improvements to the density limit were smaller, only ~ 10%. The<br />
pre-disruptive magnetic activity (Be) was similar in amplitude (~ 0.8%5e<br />
at r = 26cm), frequency(~ 5kHz) <strong>and</strong> growth time (0.5-1.5ms for the final<br />
phase) for both cases, with (2,1) structure dominating. For both the central<br />
<strong>and</strong> edge heating, the Ohmic power dropped by ~ 50kW from ~ 250kW<br />
when the ECRH was applied, but recovered in ~ 20ms for edge heating.<br />
The radiated power fraction is typically ~ 50% at the first disruption for<br />
both cases but only ~ 40% for the Ohmic disruptions.<br />
The soft X-rays show typically that the central heating increases the<br />
sawtooth inversion radius, r;nu ~ 2.5cm, by ~ 0.5cm, while the edge heating<br />
reduces it by ~ 0.5cm, suggesting that J(r) is changed. This is further<br />
supported by discharges where the pre-disruptive m = 2 growth appears<br />
just before the ECRH pulse <strong>and</strong> then stabilizes in 5-40ms to the background<br />
activity (/ ~ 10kHz, Be/Bg ~ 0.04%). We have examined these<br />
results using a 1-D transport code which shows that edge heating produces<br />
stabilizing changes to J(r) with reductions in r,A' ~ -1.0 on a timescale<br />
of 10-20ms.<br />
4 MAGNETIC FEEDBACK<br />
The DITE feedback system uses saddle coils to generate the helical fields.<br />
These saddle coils are mounted in pairs above <strong>and</strong> below the midplane, with<br />
two pairs separated by 180° toroidally, to generate dominantly m=2, n—1<br />
fields. Sine <strong>and</strong> cosine phases are generated by using two such sets of coils.<br />
The saddle coils are designed to maximize the required (2,1) component<br />
with the main sideb<strong>and</strong>s (1,1) <strong>and</strong> (3,1) minimized at < 10% of the (2,1)<br />
vacuum radial magnetic field.<br />
We have studied the interaction of these imposed helical fields with<br />
(2,1) tearing modes in cylindrical <strong>and</strong> toroidal geometries. In cylindrical
340<br />
350 360<br />
Time(ms)<br />
<strong>IAEA</strong>-CN-50/A-VII-9 449<br />
200 300<br />
Time(ms)<br />
400<br />
370 375 385 395<br />
Time (ms)<br />
FIG. 2. Plasma current (Ip) <strong>and</strong> line average density (ne) with ECRH (solid line) <strong>and</strong> without ECRH<br />
(dotted line). Central SXR <strong>and</strong> B} (6 = -124°) signals are shown at the first disruption for the same<br />
shots. Note the sawteeth continuing to the disruption <strong>and</strong> the series of soft disruptions before the current<br />
quench.<br />
geometry, we have made non-linear simulations using the reduced MHD<br />
equations. Figure 3 shows the response of a 4.2% (2,1) isl<strong>and</strong> to various<br />
helical coil currents (Ic), for q^ = 4.3. It can be seen that applying the<br />
current (Jc) causes the isl<strong>and</strong> width (W) to decrease (as desired for the<br />
feedback). However, W goes through zero <strong>and</strong> then grows to an enhanced<br />
value; this occurs because the isl<strong>and</strong> grows with its phase aligned to, <strong>and</strong><br />
enhanced, by the helical coil isl<strong>and</strong>. These processes impose limits on Ic -<br />
the current must be large enough that dW/dt < 0, but not so large that the<br />
405
450 HENDER et al.<br />
TJ<br />
:?<br />
Isl<strong>and</strong> V<br />
6<br />
2<br />
N<br />
0 11 y i 1<br />
100 200 300<br />
Time (TA)<br />
\<br />
\<br />
c=10" 3<br />
2-5x10'/'''<br />
/<br />
I<br />
400 500<br />
FIG. 3. Response of isl<strong>and</strong> width (W%) to applied helical currents (IJ.<br />
isl<strong>and</strong> flips phase in less than the response time of the system (in practice,<br />
this upper limit is not restrictive). For the DITE coil system we find that<br />
dW/dt < 0 requires<br />
IC{A) > 6.5W 2 (%)A' (2)<br />
where the conducting liner effect has been included. Thus for 'typical values'<br />
A' = 6, W = 3% we require Ic > 350A, which is well within the capabilities<br />
of the feedback amplifiers (7C < l.OkA at 5kHz). We have also studied<br />
the required feedback currents in toroidal geometry using an inverse aspect<br />
ratio expansion <strong>and</strong> the A' formalism of Ref [7]. We find that the toroidal<br />
calculations yield requirements that are very similar to Eq.(2).<br />
To determine the feedback response times we must examine the response<br />
of the mode phase to the applied helical field. The phase error (9B) between<br />
the feedback signal <strong>and</strong> the mode causes a torque [6] which acts to align their<br />
phases. The phase instability acceleration, dw/dt ~ 9.4 x<br />
s 2 (assuming the inertia to be that found in Section 2); thus for 9E =<br />
10° <strong>and</strong> W = 3% the time to accelerate from 6kHz to 10kHz is ~30ms<br />
(this frequency response is additional to that required to match the natural<br />
mode frequency, ~6kHz in DITE). As the necessary current (Jc) a W 2 <strong>and</strong><br />
the phase instability acceleration oc W 3 , the requirements on the feedback<br />
system are considerably reduced at the mode detection threshold (W < 1%).<br />
5 CONCLUSIONS<br />
Calculation of mode locking due to resonant helical fields from the DITE<br />
bundle divertor shows that £ 2% of the total plasma inertia is instantaneously<br />
involved.
<strong>IAEA</strong>-CN-50/A-VII-9 451<br />
Experiments on DITE using 60GHz off-axis ECRH, at modest powers<br />
(PRF/POH ~ 0-4), show a 20-25% increase in the disruptive density limit.<br />
The theoretical requirements on currents <strong>and</strong> response times for the m=2<br />
feedback system on DITE have been calculated <strong>and</strong> shown to be within the<br />
capabilities of the system, for typical isl<strong>and</strong> sizes.<br />
Acknowledgements<br />
We are indebted to Dr.K.Lackner for suggesting the possibility of the phase<br />
instability <strong>and</strong> thank P.C.Johnson for operating DITE <strong>and</strong> P.Mantica,<br />
P.Haynes, M.O'Brien, M.Turner, S.Cowley, <strong>and</strong> W.Millar for their help with<br />
computations <strong>and</strong> data analysis.<br />
REFERENCES<br />
[1] SNIPES, J.A., et al., Nucl. Fusion 28 (1988) 1085.<br />
[2] AXON, K.B., et al., in Plasma Physics <strong>and</strong> Controlled <strong>Nuclear</strong> Fusion Research 1980 (Proc. 8th<br />
Int. Conf. Brussels, 1980), Vol. 1, <strong>IAEA</strong>, Vienna (1981) 413.<br />
[3] TODD, T.N., et al., in Controlled Fusion <strong>and</strong> Plasma Physics (Proc. 12th Eur. Conf. Budapest,<br />
1985), Vol. 9F, Part HI, European Physical Society (1985) 76.<br />
[4] ARSENIN, V.V., et al., in Plasma Physics <strong>and</strong> Controlled <strong>Nuclear</strong> Fusion Research 1978 (Proc.<br />
7th Int. Conf. Innsbruck, 1978), Vol. 1, <strong>IAEA</strong>, Vienna (1979) 233.<br />
[5] HENDER, T.C., GIMBLETT, C.G., ROBINSON, D.C., in Controlled Fusion <strong>and</strong> Plasma<br />
Heating (Proc. 15th Eur. Conf. Dubrovnik, 1988), Vol. 12B, Part I, European Physical Society<br />
(1988) 437.<br />
[6] HENDER, T.C., RIEDEL, K.S., GRASSIE, K., Stabilisation of the m = 2 Tearing Mode, Rep.<br />
IPP 5/21, IPP Garching (1988).<br />
[7] CONNOR, J.W., et al., Phys. Fluids 31 (1988) 76.
<strong>IAEA</strong>-CN-50/A-VII-10<br />
PARTICLE REMOVAL CAPABILITIES<br />
OF THE TOROIDAL PUMP LIMITER ALT-II -<br />
POLOIDAL ASYMMETRIES AND ICR HEATING<br />
K.-H. DIPPEL, K.-H. FINKEN, A. HARDTKE, G.H. WOLF,<br />
TEXTOR TEAM<br />
Institut fur Plasmaphysik,<br />
Euratom-KFA Association,<br />
Kernforschungsanlage Jiilich GmbH,<br />
Jiilich, Federal Republic of Germany<br />
W.J. CORBETT, D.M. GOEBEL, R.W. CONN, R.A. MOYER<br />
Institute of Plasma Fusion <strong>and</strong> Research<br />
<strong>and</strong><br />
Department of Mechanical, Aerospace <strong>and</strong> <strong>Nuclear</strong> Engineering,<br />
University of California,<br />
Los Angeles, California,<br />
United States of America<br />
R.T. McGRATH, J.G. WATKINS<br />
S<strong>and</strong>ia National Laboratories,<br />
Albuquerque, New Mexico,<br />
United States of America<br />
A. MIYAHARA, A. SAGARA<br />
Institute of Plasma Physics,<br />
Nagoya University,<br />
Nagoya, Japan<br />
ICRH TEAM<br />
Ecole royale militaire/Koninklijke Militaire School,<br />
Association Euratom-Etat Beige/Associatie Euratom-Belgische Staat,<br />
Brussels, Belgium<br />
Abstract<br />
PARTICLE REMOVAL CAPABILITIES OF THE TOROIDAL PUMP LIMITER ALT-II —<br />
POLOIDAL ASYMMETRIES AND ICR HEATING.<br />
ALT-II is a segmented toroidal belt pump limiter in TEXTOR used to experimentally investigate<br />
the question of particle removal capability in this configuration. Specifically, experimental results from<br />
two effects are presented — the influence of poloidal plasma flow <strong>and</strong> density decay length asymmetries,<br />
<strong>and</strong> the impact of ICR heating. The exhaust efficiency, extrapolated from the presently available two<br />
pumping units to the full action of eight pumping units, reaches up to 8%. The dependence of particle<br />
removal on plasma density <strong>and</strong> on radial limiter position is briefly discussed. An evaluation of proposed<br />
design modifications shows that exhaust efficiencies of 15-20% may become achievable with this pump<br />
limiter configuration.<br />
453
454 DIPPELetal.<br />
1. INTRODUCTION<br />
ALT-II (ALT — advanced limiter test) [1] is a large area segmented toroidal<br />
belt pump limiter installed in Textor. The general objective of the ALT programme<br />
is the evaluation of the capabilities of pump limiters as an alternative to magnetic<br />
divertors. The main objective of ALT-II is to investigate the physics of particle<br />
removal <strong>and</strong> density control with a toroidal belt pump limiter protoypical for a reactor<br />
limiter. This investigation is inevitably connected to the question of heat load distribution<br />
over the limiter surface <strong>and</strong> neutralizer plates <strong>and</strong> the related release of impurities.<br />
In this paper, specifically the question of particle removal <strong>and</strong> ways of<br />
improving it are addressed.<br />
Results of the first period of experimental operation with this limiter configuration<br />
are reported in Refs [2-4]. During this period asymmetries in the plasma boundary<br />
were observed. Here, after a short description of the experimental arrangement<br />
(Section 2), more results on these asymmetries <strong>and</strong> related effects on particle removal<br />
are presented (Section 3). In Section 4, the increase of particle removal with additional<br />
heating (ICRH) will be addressed, <strong>and</strong> in Section 5 possibilities for optimizing<br />
the particle removal capability of the ALT-II system will be discussed.<br />
2. EXPERIMENTAL ARRANGEMENT<br />
ALT-II is a nearly axisymmetric toroidal belt pump limiter located on the outside<br />
of the TEXTOR torus at 45° below the horizontal midplane. The toroidal belt<br />
is segmented into eight radially movable blades, each about 1.50 m long <strong>and</strong> 0.28 m<br />
wide. A single blade consists of a 6 mm thick Inconel base plate covered by<br />
28 graphite tiles, with the plasma facing surface contoured to distribute the heat<br />
loads. Each blade is equipped on the back with a localized particle collection system<br />
(scoop, neutralizer plate, duct) leading to a pumping unit. At present, pumps are<br />
installed on only two blades. (For more details, see Ref. [2].)<br />
An array of Langmuir <strong>and</strong> flux probes provides local information on fluxes,<br />
electron temperatures, <strong>and</strong> densities in the scoops. Fast ionization gauges monitor the<br />
neutral density in each of the eight vacuum ductings. A pneumatically driven scanning<br />
double probe gives radial scrape-off layer (SOL) profiles of ion flux, <strong>and</strong> electron<br />
temperature <strong>and</strong> density in the outside horizontal midplane. Thermocouples <strong>and</strong><br />
two IR cameras provide information on the heat load distribution. In addition, the<br />
st<strong>and</strong>ard TEXTOR diagnostics are available, including two Li beam diagnostics<br />
[5, 6] on the top <strong>and</strong> bottom of TEXTOR used to determine the poloidal structure<br />
of the density SOL profiles. In the experiments reported here, TEXTOR<br />
(R = 1.75 m, amax = 0.48 m) is operated with Ip = 340 kA, BT = 2.0 T <strong>and</strong> a<br />
range of line averaged densities of n^ = (1-5.5) x 10 19 m~ 3 . The existing<br />
0-2.6 MW ICR heating system on TEXTOR is described in detail in Refs [7, 8].
<strong>IAEA</strong>-CN-50/A-VH-10 455<br />
3. POLOIDAL ASYMMETRIES AND THEIR EFFECT ON<br />
PARTICLE REMOVAL<br />
The ALT-II system has eight particle collection scoops facing the ion drift direction<br />
of the plasma current <strong>and</strong> four scoops facing the electron drift direction. With<br />
the 'normal' Ip <strong>and</strong> BT orientation in TEXTOR the ion drift points towards the bottom<br />
facing edge of the belt. While the flow to the collection scoops under the limiter<br />
has been found to be toroidally symmetric, the flow to the bottom facing <strong>and</strong> outside<br />
facing scoops is subject to two types of poloidal asymmetries. First, in the ion drift<br />
direction, the plasma flow to the limiter is up to a factor of three higher than the electron<br />
drift direction [3]. A similar result was found previously by probe <strong>and</strong> neutral<br />
pressure measurements on ALT-I [9]. This type of asymmetry is highest at low core<br />
plasma densities (high edge Te) <strong>and</strong> disappears for line averaged densities ne exceeding<br />
3 x 10" m~ 3 . Second, SOL profile measurements, using the scanning probe in<br />
the equatorial plane <strong>and</strong> a thermal Li beam at the bottom of the TEXTOR vessel,<br />
show that the flux <strong>and</strong> density profiles connecting to the top of the belt have a larger<br />
radial extension than those connecting to the bottom edge. The two decay lengths<br />
differ by up to a factor of two. The different flow <strong>and</strong> decay lengths on opposite sides<br />
of the belt almost compensate each other so that the currents collected in the outside<br />
<strong>and</strong> the bottom facing scoops are nearly balanced.<br />
To investigate the dependence of these asymmetries on the field geometry, both<br />
Ip <strong>and</strong> BT have been reversed. IR camera measurements show clearly that the reversal<br />
shifts the high plasma flow to the outside facing edge of the belt, which is now<br />
the ion drift direction side. This confirms that the flow asymmetry at low ne is<br />
related to the ion <strong>and</strong> electron drift direction. On the other h<strong>and</strong>, the influence of the<br />
Ip <strong>and</strong> BT reversal on the asymmetry of the SOL e-folding lengths is different. The<br />
radial flux <strong>and</strong> density profiles across the outside edge of the belt become even<br />
longer, whereas at the bottom edge the profile remains nearly constant. These results<br />
indicate that the e-folding length asymmetry is not related to the ion <strong>and</strong> electron drift<br />
directions, but to the poloidal location of the limiter. In the field reversed geometry,<br />
the higher flow on the outside edge in combination with the larger e-folding length<br />
on that side leads to an increase in particle collection <strong>and</strong> removal by a factor of 1.5<br />
to 2, as is shown by the signals of flux probes (Fig. 1). A possible explanation for<br />
the observed asymmetries, which is at least qualitatively in agreement with the<br />
experimental observations, is based on the effect of the toroidal belt limiter impeding<br />
secondary equilibrium currents <strong>and</strong> poloidal plasma rotation [10].<br />
4. INFLUENCE OF ICRH ON PARTICLE REMOVAL<br />
The application of ICR heating leads to a significant increase in the number of<br />
particles removed by the pump limiter. Figure 2 shows this increase both in the flux<br />
probe signal <strong>and</strong> in the particle removal rate
456 DIPPEL et al.<br />
100<br />
80<br />
>< 60<br />
< E<br />
40<br />
20<br />
0<br />
100<br />
80<br />
60<br />
40-<br />
20<br />
# 31799<br />
#31870<br />
ELECTRON ORIFT SIDE<br />
(bottom)<br />
lp <strong>and</strong> 8y NORMAL<br />
ELECTRON DRIFT SIDE<br />
(outside)<br />
DRIFT SIDE<br />
(bottom)<br />
lp <strong>and</strong> BT REVERSED<br />
1.0 2.0 3.0<br />
TIME (s)<br />
FIG. 1. Comparison of scoop currents measured by the flux probes in the scoops of blade 2 for normal<br />
<strong>and</strong> reversed directions of plasma current Ip <strong>and</strong> toroidal field BT.<br />
pumps) measured at a scoop facing the bottom of the machine in the presence of an<br />
ICRH power level of 2.3 MW; both quantities are elevated typically by a factor of<br />
three. In Fig. 3 the removal rate increases nearly linearly with ICRH power. In some<br />
cases, however, when the highest ICRH power levels (total power =3 MW) are<br />
approached, a saturation is observed.<br />
Scanning probe <strong>and</strong> Ha signals indicate that the particle confinement time rp<br />
decreases in proportion to the energy confinement time TE during (L-mode) ICRH<br />
power scans. Obviously, the observed increase in the particle removal rate is directly<br />
correlated with the decrease in rp; there is nearly no change in the exhaust efficiency,<br />
eexh = since both removal rate, 0r, <strong>and</strong> core efflux,
X<br />
><br />
o<br />
S<br />
6<br />
U-<br />
2-<br />
0<br />
160 •<br />
80<br />
0<br />
1<br />
0.1<br />
01<br />
• 32258<br />
<strong>IAEA</strong>-CN-50/A-VII-10<br />
1.<br />
I ^r SIDE X,<br />
V<br />
1.0 2.0<br />
TIME (s)<br />
2.3MW<br />
ICRH<br />
\ ^<br />
ELECTRON<br />
ORIFT<br />
SIDE<br />
FIG. 2. Effect of 2.3 MW ICRH power coupled to the plasma on the line averaged density, on the current<br />
into the scoops measured by flux probes <strong>and</strong> on the removal rate at blade 2.<br />
•£ 0.3-r<br />
1.0 2.0<br />
Total Power (MW)<br />
FIG. 3. Removal rate at blade 2 <strong>and</strong> total current collected by the 12 ALT-II scoops obtained from an<br />
integration of the flux probe data as a function of the total input power (ICRH + OH).<br />
3.0<br />
3.0<br />
457
458 DIPPEL et al.<br />
four outside facing scoops can show either increased or decreased particle fluxes,<br />
depending on the ICRH power level, the core densities, <strong>and</strong> the wall conditioning<br />
history in the tokamak. The scanning probe shows that these effects are probably<br />
related to ICRH induced profile modifications in the SOL [2]. Enhanced particle<br />
collection is always found in the scoops facing the bottom of the machine. With<br />
regard to the exhaust efficiency, ICRH induced changes of ii,, <strong>and</strong> Te profiles seem<br />
to be of minor importance.<br />
5. FURTHER PERSPECTIVES ON THE TOROIDAL BELT PUMP<br />
LIMITER CONFIGURATION<br />
The exhaust efficiencies eexh achieved so far, extrapolated from the presently<br />
available two pumping units to the combined action of eight pumping units, are in<br />
the range of eexh = 4-8%, slightly exceeding the design value. The maximum<br />
particle removal rate obtained with high power ICRH is r « 4 X 10 20 particles<br />
per second or « 6torr-L-s~'. These values do not, however, represent the<br />
maximum potential of this kind of pump limiter configuration. First, there are indications<br />
that the removal rate improves with increasing core density [2], <strong>and</strong> any further<br />
increase in ne would also improve the exhaust efficiency owing to the expected<br />
increase in TP with fL.. Unfortunately, no improvement can be expected from inserting<br />
the belt limiter to smaller minor radii. ALT-II seems to define the edge, <strong>and</strong> the<br />
SOL is independent of the limiter radius. This differs from the experimental<br />
experience with the modular pump limiter ALT-I (<strong>and</strong> other modular pump limiter<br />
devices), where by moving the limiter head more deeply into the plasma, strong rises<br />
in the removal rates <strong>and</strong> the plenum pressures have been found [9]. A possible reason<br />
for this difference was offered [10].<br />
Secondly, appreciable improvements in the ALT-II exhaust efficiency may be<br />
expected from blade design changes. Removal rate <strong>and</strong> exhaust efficiency depend on<br />
the relative fraction of the core efflux collected by the scoop entrance (collection<br />
efficiency econ = J
<strong>IAEA</strong>-CN-S0/A-VH-10 459<br />
between scoop conductance for particle backstreaming from the neutralizer plate to<br />
the plasma <strong>and</strong> the effective pumping speed at the neutralizer plate. At present,<br />
however, this pumping speed is limited by the conductance of the vacuum ducting.<br />
Any increase in this conductance could increase the effective pumping speed <strong>and</strong>,<br />
thereby, the removal efficiency, removal rate <strong>and</strong> exhaust efficiency. Combining<br />
both effects, i.e. improvements in the collection efficiency <strong>and</strong> in the removal efficiency,<br />
might lead to an overall improvement of particle removal by a factor of three<br />
to four, which would yield removal rates in excess of 10 21 particles per second <strong>and</strong><br />
exhaust efficiencies of 15-20%. Assuming that this exhaust efficiency can also be<br />
achieved for helium under reactor conditions, toroidal belt pump limiters can probably<br />
exhaust the a-products in steady state, a task for which the pump limiter was<br />
originally proposed <strong>and</strong> discussed [11] (as compared with density control in the<br />
presence of neutral beam <strong>and</strong> pellet injection). For INTOR conditions, for example,<br />
allowing for a core helium concentration of 10%, sufficient helium can be removed<br />
from the plasma if the a-particle confinement time, rp", is below 2-3 s, which seems<br />
to be a realistic value.<br />
6. CONCLUSIONS<br />
The experimental results have shown that taking advantage of the observed<br />
asymmetries in the plasma flow <strong>and</strong> in the SOL decay length increases the ALT-II<br />
removal rate <strong>and</strong> the exhaust efficiency by a factor of about 1.5. With ICR heating<br />
the removal rate rises up to a factor of three at high ICRH powers, whereas the<br />
exhaust efficiency remains nearly constant. Removal rates up to 4 X 10 20 particles<br />
per second <strong>and</strong> exhaust efficiencies up to 8 % have so far been achieved (extrapolated<br />
to eight active pumping units).<br />
The analysis shows that there is the potential of improving the performance of<br />
this toroidal belt limiter configuration by a factor of three to four, by modifying its<br />
geometrical design with the aim of increasing collection <strong>and</strong> removal efficiency. This<br />
requires a detailed knowledge of the SOL profiles, especially of the power decay<br />
length during full power operation. Exhaust efficiencies in the range 15-20% are<br />
feasible, which probably meets the a-particle removal requirements. The open question<br />
is the level of impurity release from such a limiter system. This second main<br />
objective of the ALT-II pump limiter programme will be addressed in the near future<br />
when the full 6-7 MW heating power <strong>and</strong> reactor relevant power fluxes at the limiter<br />
blades become available in TEXTOR.<br />
ACKNOWLEDGEMENTS<br />
The authors would like to thank K. Andrews A. Hiller, G. Kramer, M.<br />
Schumacher, T. Sketchley <strong>and</strong> A. Verberkmoes for technical support of the ALT-II<br />
programme. The work is supported by the US Department of Energy.
460 DIPPEL et al.<br />
REFERENCES<br />
[1] CONN, R.W., et al., J. Nucl. Mater. 121 (1984) 350.<br />
[2] GOEBEL, D.M., et al., in Plasma-Surface Interactions in Controlled Fusion Devices (Proc. 8th<br />
Int. Conf. Julich, 1988) 423.<br />
[3] FINKEN, K.H., et al., ibid.<br />
[4] CORBETT, W.J., et al., ibid.<br />
[5] HINTZ, E., BOGEN, P., J. Nucl. Mater. 128&129 (1984) 229.<br />
[6] POSPIESZCZYK, A., ROSS, G.G., in Controlled Fusion <strong>and</strong> Plasma Physics (Proc. 14th Eur.<br />
Conf. Madrid, 1987), Vol. 11D, Part III, European Physical Society (1987) 1280.<br />
[7] VAN OOST, G., et al., Fusion Technol. 12 (1987) 449.<br />
[8] MESSIAEN, A.M., et al., Plasma Phys. Control. Fusion 28 (1986) 71.<br />
[9] DIPPEL, K.H., et al., in Plasma Physics <strong>and</strong> Controlled <strong>Nuclear</strong> Fusion Research 1984 (Proc.<br />
10th Int. Conf. London, 1984), Vol. 1, <strong>IAEA</strong>, Vienna (1985) 249.<br />
[10] GERHAUSER, H., CLAASSEN, H.A., Institut fur Plasmaphysik, Kernforschungsanlage Julich,<br />
personal communication, 1988.<br />
[11] B1EGER, W., DIPPEL, K.H., FUCHS, G., WOLF, G.H., in Plasma-Wall Interaction (Proc.<br />
Symp. Oxford, 1976), Pergamon Press, Oxford (1976) 809.
THE ROLE OF LIMITERS AND WALLS<br />
IN IMPURITY PRODUCTION<br />
<strong>IAEA</strong>-CN-50/A-VII-U<br />
G.M. McCRACKEN, G.F. MATTHEWS, C.S. PITCHER 1 ,<br />
S.J. FIELDING, J. ALLEN, R. BARNSLEY, D.H.J. GOODALL,<br />
N. HAWKES, J. HUGILL, P.C. JOHNSON, L.N. KHIMCHENKO 2 ,<br />
P.C. STANGEBY 3 , A.M. TERNOPOL 4<br />
Culham Laboratory,<br />
Euratom-UKAEA Fusion Association,<br />
Abingdon, Oxfordshire,<br />
United Kingdom<br />
Abstract<br />
THE ROLE OF LIMITERS AND WALLS IN IMPURITY PRODUCTION.<br />
An impurity control limiter in DITE has been shown to be much more effective in helium than<br />
in deuterium discharges. This is because the wall impurity fluxes are higher in hydrogen <strong>and</strong> deuterium<br />
discharges than in helium. Measured yields of impurities from the wall indicate that they are<br />
predominantly due to chemical reactions, whereas the limiter impurities are predominantly due to physical<br />
sputtering. However, oxygen from the wall when it enters the discharge can enhance the yield of<br />
carbon from the limiter by the formation of CO. Experiments deliberately puffing CO show that the<br />
increases of oxygen <strong>and</strong> carbon levels are smaller than expected. It is proposed that charge exchange<br />
of oxygen ions with neutral hydrogen determines the equilibrium level of oxygen.<br />
1. INTRODUCTION<br />
If impurities are produced by physical sputtering at the limiter<br />
then a simple global model of impurity production can be derived<br />
[1]. Impurities released as sputtered atoms enter the plasma <strong>and</strong><br />
are ionised <strong>and</strong> dispersed. They produce line radiation which<br />
reduces the power flowing to the boundary <strong>and</strong> hence the edge<br />
temperature [2], thus reducing the rate of impurity production.<br />
This feedback mechanism leads to an equilibrium impurity<br />
concentration which depends primarily on the power input, the<br />
plasma density <strong>and</strong> the atomic number of the impurity. Thus the<br />
impurity production usually is determined by the global<br />
properties of the plasma. However, if there is an additional<br />
impurity influx from the wall then the simple feedback process is<br />
disturbed. Wall impurity processes are not so well understood<br />
1 Canadian Fusion Fuels Technology Project, Toronto, Ontario L5J IKS, Canada.<br />
2 I.V. Kurchatov Institute of Atomic Energy, Moscow, USSR.<br />
3 Institute of Aerospace Studies, University of Toronto, Toronto, Ontario, Canada.<br />
4 Institute of Physics <strong>and</strong> Technology, Khar'kov, USSR.<br />
461
462 McCRACKEN et al.<br />
<strong>and</strong> the way in which an equilibrium can be set up is not so<br />
obvious. In this paper we first discuss evidence for physical<br />
sputtering at the limiter <strong>and</strong> then consider conditions under<br />
which either wall or limiter sources are dominant.<br />
2. IMPURITY PRODUCTION AT LIMITERS<br />
Ions in the scrape-off layer are accelerated by the presheath <strong>and</strong><br />
sheath electric fields <strong>and</strong> cause physical sputtering of the<br />
limiter material. When attempting to compare quantitative<br />
estimates of the impurity fluxes produced by sputtering with the<br />
observed impurity concentration in the plasma there is<br />
uncertainty in the fluxes <strong>and</strong> energies of the incident particles<br />
<strong>and</strong> of the absolute sputter yield (because the surface state of<br />
the limiter during tokamak operation is difficult to<br />
characterize). It is usually found that impurity levels in<br />
tokamaks are consistent with physical sputtering, but there is<br />
sufficient uncertainty in the estimates that contributions from<br />
other sources cannot be ruled out. Evidence that physical<br />
sputtering is a dominant mechanism comes from a number of<br />
different experiments including the fact that both metals <strong>and</strong><br />
carbon impurity [3] densities decrease with plasma density in<br />
agreement with the predictions of a global sputtering model [1].<br />
In order to get further evidence on the mechanism of<br />
impurity production at limiters we have built an Impurity Control<br />
Limiter in DITE, shown schematically in Fig.lb. With this design<br />
atoms sputtered from the graphite surface are directed towards<br />
the wall, rather than into the plasma, as in conventional limiter<br />
geometry (Fig.la). Impurity atoms are either ionised in the<br />
scrape-off layer or travel directly to the wall as neutrals. A<br />
substantial improvement in plasma purity is predicted by Monte<br />
Carlo modelling [4] <strong>and</strong> observed experimentally [5]. In helium<br />
plasmas the global radiation is reduced by a factor of 2 <strong>and</strong> the<br />
impurity contribution to Zeff by up to 60%, compared to a rail<br />
limiter of conventional geometry. Local measurements of the<br />
spatial distribution of neutral carbon are also made. Using<br />
measured profiles of edge temperature <strong>and</strong> density the mean free<br />
path for ionisation can be deduced <strong>and</strong> hence the neutral atom<br />
energy. The energy distribution of the atoms is consistent with<br />
a surface binding energy of 8 eV, as has been obtained for<br />
sputtered carbon atoms [6].<br />
Physical sputtering clearly determines the minimum impurity<br />
level obtainable. Desorption or chemical processes will increase<br />
this level further. In deuterium plasmas the impurity control<br />
limiter was much less effective, reducing radiation by only 20%.<br />
We have ascribed this difference to the fact that wall impurity<br />
mechanisms are much more important in hydrogenic plasmas than in<br />
helium.
Shine through<br />
<strong>IAEA</strong>-CN-50/A-VH-ll 463<br />
(a) Conventional Limiter<br />
(b) Impurity Control Limiter<br />
Toroidal dispersal<br />
Wall<br />
Redeposition<br />
0<br />
FIG. 1. Schematic diagram oflimiler geometries: (a) conventional limiter directing impurities into the<br />
plasma; (b) impurity control limiter (ICL) directing impurities towards the wall.<br />
3. LIGHT IMPURITY PRODUCTION AT THE WALLS<br />
Spectroscopic measurements of impurity fluxes from the<br />
stainless steel walls have been made in DITE in both deuterium<br />
<strong>and</strong> helium discharges over a wide range of densities. Typical<br />
values are presented in Table I. These fluxes have been derived<br />
from chordal emissivities of visible spectral lines of these<br />
species <strong>and</strong> theoretical photon efficiencies [5]. In the<br />
deuterium discharges the effective yields of impurities are 0.3<br />
oxygen atoms per deuteron <strong>and</strong> 0.9 carbon atoms per deuteron.<br />
These values are much higher than the physical sputter yields <strong>and</strong><br />
indicate either a desorption process or a chemical reaction [7].<br />
Photodesorption can probably be ruled out because the yields are<br />
too low [7]. The absolute flux of oxygen is a factor of A higher<br />
in deuterium than in helium <strong>and</strong> the flux of carbon is a factor of<br />
7 higher in deuterium. Residual gas analysis also shows an order<br />
of magnitude increase in the impurity release rates (CH^ <strong>and</strong> CO)<br />
evolved from the vacuum vessel following hydrogen discharges<br />
compared to helium [7]. The impurity gas evolution increases<br />
only slowly after the change in working gas, taking 10 to 20<br />
discharges to reach equilibrium.<br />
Wall
464 McCRACKEN et al.<br />
TABLE I. IMPURITY FLUXES FROM THE WALL<br />
IN DEUTERIUM AND HELIUM DISCHARGES<br />
IN DITE<br />
Ip = 100 kA, ne = 3 x 10 19 nT 3<br />
DI<br />
on<br />
CII<br />
4<br />
1.1<br />
3.5<br />
D<br />
atoms •:m<br />
2 -s"<br />
x 10'"<br />
x 10'"<br />
x 10'"<br />
9 X<br />
2.7<br />
4.9<br />
i<br />
He<br />
X<br />
X<br />
10 13<br />
10 13<br />
10' 3<br />
Yield<br />
in D discharges<br />
The most probable mechanism for the increased importance of<br />
the wall as an impurity source in hydrogen discharges is chemical<br />
reactions at the surface. It is well known that H20, CO <strong>and</strong> CH,,<br />
can be formed by reactions on surfaces in the presence of atomic<br />
hydrogen [8]. The reaction rate is determined by the<br />
concentration of hydrogen isotopes implanted in the surface<br />
rather than the incident flux [9]. This is consistent with the<br />
slow changeover in impurity level when changing from.hydrogen to<br />
helium discharges; i.e. only as the hydrogen inventory in the<br />
surface changes, due to either implantation or desorption, does<br />
the impurity flux from the wall go up or down.<br />
The interactions of oxygen <strong>and</strong> carbon at graphite limiters<br />
are expected to be quite different. Carbon will be deposited<br />
with a self-sputtering yield less than unity, usually much less.<br />
At carbon limiters, oxygen has an effective sputtering yield •v. 1,<br />
due to the formation of CO [10,11]. The oxygen surface<br />
concentration increases linearly with incident fluence to a<br />
saturation level ^ 10 16 atoms.cm" 2 [11], depending weakly on<br />
incident energy. This means that the oxygen introduced from the<br />
wall recycles at the limiter <strong>and</strong> returns to the plasma; at each<br />
interaction it introduces another carbon atom. Direct<br />
experimental evidence for the production of CO has been obtained<br />
in TEXTOR [12]. Further evidence comes from experiments in which<br />
pure oxygen was puffed into deuterium discharges in DITE. It was<br />
found that when the local Oil emissivity at the graphite limiter<br />
doubled the CII also doubled. The carbon concentration is thus<br />
determined by the sum of physical sputtering at the limiter plus<br />
the flux of carbon from the wall <strong>and</strong> the carbon introduced by<br />
oxygen chemical sputtering. One consequence of this model is<br />
that in tokamaks with carbon limiters the carbon level will<br />
always be larger than the oxygen level. We are not aware of any<br />
counter examples.<br />
0.3<br />
0.9
3<br />
01<br />
£<br />
"c<br />
t=!<br />
o<br />
E<br />
c<br />
12<br />
10<br />
8<br />
6<br />
4<br />
2<br />
20<br />
1-5<br />
10<br />
0-5<br />
C<br />
n<br />
<strong>IAEA</strong>-CN-50/A-VH-ll 465<br />
— OVIII^-—^_<br />
/<br />
S* \ c<br />
*•*<br />
/ N<br />
Gas valve voltage<br />
i r/ / / A / / A<br />
100 200 300 400<br />
Time Ims)<br />
-T<br />
^<br />
*^<br />
^—<br />
——• "*• _<br />
• ~ — — — ^ — .<br />
i<br />
-<br />
4<br />
3<br />
2<br />
1<br />
100<br />
<<br />
50<br />
500 600<br />
FIG. 2. Effect of puffing CO gas from a probe limiter into a deuterium discharge. Gas puff rate:<br />
7.5 X IO !9 molecules-s' 1 . The dotted lines indicate typical behaviour in the absence of CO gas<br />
puffing.<br />
To assess the effect of impurities from the walls we have<br />
puffed carbon monoxide into deuterium discharges in DITE. At<br />
injection rates of 1.5 x 10 19 molecules's"" 1 we observed a plasma<br />
density rise rate of 6 x 10 19 electrons^" 1 . The intensities of<br />
both OVIII <strong>and</strong> CV rise linearly <strong>and</strong> then reach saturation levels<br />
after *v. 50 ms. They remain constant for the rest of the 200 ms<br />
gas pulse as shown in Fig.2. The low ionisation states, e.g. CII<br />
<strong>and</strong> Oil observed at the location of the gas injection, increase<br />
more rapidly than the higher states, as expected.<br />
There is a difficulty in underst<strong>and</strong>ing how a recycling<br />
impurity like oxygen reaches an equilibrium level when it is<br />
being continually injected from the wall. One possible loss<br />
mechanism is charge exchange of oxygen ions with neutral hydrogen<br />
in the SOL, with the charge exchange oxygen atoms sticking at the<br />
wall. A simple particle balance calculation using the measured<br />
flux of oxygen from Table I <strong>and</strong> neutral hydrogen densities<br />
estimated from DEGAS Monte Carlo calculations for DITE [13],<br />
leads to an equilibrium concentration of *v< 3 x 10 17 m~ 3 , in quite<br />
good agreement with experimental results of 4 x 10 17 m~ 3 from the<br />
OVIII measurements. Charge exchange is generally more<br />
significant than other loss mechanisms at the limiter.<br />
U.)<br />
<<br />
ensiity(<br />
i—i<br />
o
466 McCRACKEN et al.<br />
4. CONCLUSIONS<br />
There is good experimental evidence that impurity production<br />
at the limiter, in well conditioned machines, is predominantly<br />
due to physical sputtering. Although the evidence is not yet so<br />
convincing, it is probable that the main mechanism for impurity<br />
production at the wall is chemical reactions between the hydrogen<br />
isotope inventory in the surface <strong>and</strong> other surface impurities.<br />
Oxygen produced at the wall becomes ionised in the plasma <strong>and</strong><br />
then causes chemical sputtering of carbon limiters. Because<br />
oxygen recycles at the limiter <strong>and</strong> the yield per oxygen atom is<br />
high, this can be an additional potent source of carbon when the<br />
oxygen level is high, in the case of graphite limiters.<br />
The relative importance of the limiter <strong>and</strong> the walls depends<br />
on the state of cleanliness of the machine. Also, as the density<br />
increases <strong>and</strong> the edge temperature falls physical sputtering at<br />
the limiter decreases resulting in the wall impurity mechanisms,<br />
which are not so energy dependent, becoming relatively more<br />
important. Despite a continuous influx from the walls the oxygen<br />
generally reaches an equilibrium concentration in the plasma<br />
during a discharge. Charge exchange between oxygen ions <strong>and</strong><br />
neutral hydrogen in the scrape-off layer is a loss mechanism<br />
which might allow such an equilibrium to be reached.<br />
REFERENCES<br />
[1] McCRACKEN, G.M., Plasma Phys. Controll. Fusion 29 (1987) 1273.<br />
[2] ERENTS, S.K., TAGLE, J.A., McCRACKEN, G.M., STANGEBY, P.C., DE KOCK,<br />
L.C.J.M., Nucl. Fusion 28 (1988) 1209.<br />
[3] BEHRINGER, K., in Plasma-Surface Interactions (Proc. 8th Int. Conf., 1988), to be published<br />
in J. Nucl. Mater.<br />
[4] MATTHEWS, G.F., et al., Plasma Phys. Controll. Fusion 29 (1987) 187.<br />
[5] MATTHEWS, G.F., et al., Nucl. Fusion 28 (1988) 2209.<br />
[6] BOGEN, P., DOBELE, H.F., MERTENS, P., J. Nucl. Mater. 145-147 (1987) 434.<br />
[7] McCRACKEN, G.M., FIELDING, S.J., MATTHEWS, G.F., PITCHER, C.S., in Plasma-<br />
Surface Interactions (Proc. 8th Int. Conf., 1988), to be published in J. Nucl. Mater.<br />
[8] DIETZ, K.J., WAELBROECK, F., in Plasma-Wall Interactions (Proc. Int. Symp., 1976), Pergamon<br />
Press (1977) 441.<br />
[9] BRAGANZA, C, ERENTS, S.K., McCRACKEN, G.M., J. Nucl. Mater. 75 (1978) 220.<br />
[10] HECHTL, E., BOHDANSKY, J., J. Nucl. Mater. 154 (1988) 201.<br />
[11] VIETZKE, E., TANABE, T., PHILLIPS, V., ERDWEG, M., FLASKAMP, K., J. Nucl.<br />
Mater. 145-147 (1987) 425.<br />
[12] PHILLIPS, V., VIETZKE, E., ERDWEG, M., in Plasma-Surface Interactions (Proc. 8th Int.<br />
Conf., 1988), to be published in J. Nucl. Mater.<br />
[13] MADISON, G.P., MATTHEWS, G.F., J. Nucl. Mater. 145-147 (1987).
THE PLASMA BOUNDARY IN JET<br />
<strong>IAEA</strong>-CN-50/A-VII-12<br />
L. DE KOCK, P.E. STOTT, S. CLEMENT 1 , S.K. ERENTS 2 ,<br />
P.J. HARBOUR, M. LAUX 3 , G.M. McCRACKEN 2 , C.S. PITCHER 2 ,<br />
M.F. STAMP, P.C. STANGEBY 4 , D.D.R. SUMMERS, A.J. TAGLE<br />
JET Joint Undertaking,<br />
Abingdon, Oxfordshire,<br />
United Kingdom<br />
Abstract<br />
THE PLASMA BOUNDARY IN JET.<br />
The parameters of the scrape-off layer in JET are presented for the case of the new belt limiters<br />
<strong>and</strong> compared with the earlier case of eight discrete limiters. The scaling with the main plasma<br />
parameters is found to be similar <strong>and</strong> fits a model that correctly describes the dependence on the mean<br />
plasma density but shows a discrepancy with the input power. — The carbon influx relative to the deuterium<br />
influx, derived from spectroscopic measurements, is compared with the influx calculated from<br />
the measured SOL parameters using the physical sputtering plus carbon self-sputtering <strong>and</strong> the charged<br />
particle flux on the belt limiter. Both ratios show a decreasing trend with increasing density, although<br />
a discrepancy at low density remains. — The SOL in neutral beam heated discharges, although not<br />
steady state, shows a behaviour comparable with that in OH iimiter discharges. However, in discharges<br />
with radiofrequency heating the SOL parameters are instantaneously affected by the RF power <strong>and</strong> its<br />
behaviour depends on wall conditions. — Some typical measurements of the SOL parameters in divertor<br />
plasmas are given, showing that in the outer divertor the plasma is hotter than in the inner one (with<br />
correspondingly lower <strong>and</strong> higher density, respectively). The power flow to the outer divertor is higher<br />
than to the inner one, <strong>and</strong> the temperature difference indicates that net currents must flow in the SOL.<br />
1. INTRODUCTION<br />
Edge conditions are important in tokamaks as they determine<br />
impurity production by sputtering at the limiter, the ability of<br />
the scrape-off layer to screen impurities frcm the core of the<br />
discharge <strong>and</strong> the establishment of the H mode of enhanced<br />
confinement in discharges with a magnetic separatrix.<br />
Experimental measurements have been made with Langmuir probes<br />
<strong>and</strong> other diagnostics. Empirical seal ings of the scrape-off<br />
layer parameters in terms of the main discharge parameters have<br />
been established <strong>and</strong> compared with models of the scrape-off<br />
layer. In this paper we review our underst<strong>and</strong>ing of Ohmic <strong>and</strong><br />
additionally heated, discharges in limiter <strong>and</strong> divertor<br />
configurations.<br />
1 Asociaci6n Euratom/CIEMAT, Madrid, Spain.<br />
2 UKAEA Culham Laboratory, Abingdon, Oxfordshire, UK.<br />
3 Central Institute of Electron Physics, Academy of <strong>Sciences</strong>, Berlin, GDR.<br />
4 Institute for Aerospace Studies, University of Toronto, Toronto, Ontario, Canada.<br />
467
468 DE KOCK et al.<br />
2. EXPERIMENTAL RESULTS<br />
(a) Edge Parameters Measured by Means of Langmuir Probes<br />
During the past year JET has operated in limiter <strong>and</strong> divertor<br />
configurations. The limiters are two carbon belts, located on<br />
the outboard side of the discharge, approximately ± 1 m from the<br />
mid-plane. The divertor operation has been mainly single-null<br />
with the power deposited on carbon tiles at the top of the<br />
vessel. Profiles of scrape-off layer parameters have been<br />
measured with a reciprocating Langmuir probe located at the top<br />
of the vessel, roughly mid-^way between the divertor target tiles<br />
<strong>and</strong> the upper belt limiter. Additional data have been obtained<br />
with fixed probes mounted in belt limiters, ICRH antennas <strong>and</strong><br />
divertor target tiles, <strong>and</strong> also with a variety of other<br />
diagnostics including infrared cameras, spectroscopy, microwave<br />
reflectometry <strong>and</strong> a high resolution ECE system.<br />
Measurements at different toroidal <strong>and</strong> poloidal positions<br />
indicate that these observations are representative of the SOL.<br />
A extensive data base of scrape-off layer parameters was<br />
established with fixed probes during previous years of operation<br />
of JET when there were 8 discrete carbon limiters on the torus<br />
mid plane [1]. Measurements with the reciprocating probe in the<br />
new belt limiter configuration (the points in Fig. 1) are<br />
consistent with the discrete limiter data base (the lines in<br />
Fig. 1) . In the discrete limiter case the density at the last<br />
closed flux surface nQ(a) scales as Ip <strong>and</strong> the temperature<br />
Te(a) as Ip 2 / 2 [2]. Care has been Taken to make these<br />
measurements when particle <strong>and</strong> energy balance have reached<br />
steady state. The e-folding length of SOL density at the outer<br />
midplane ^ is usually in the range of 10 mm <strong>and</strong> thescaling<br />
with Ip appears to be Xj^ cc I - l rather than ^ cc I_~" which<br />
might Be expected due to constant D|, plasma q <strong>and</strong> connection<br />
length effects. ~<br />
During NB heating in limiter discharges the central density<br />
increases <strong>and</strong> a steady state cannot be obtained. Two competing<br />
processes take place in the SOL. The higher power conducted to<br />
the SOL causes the edge temperature initially to rise, delayed<br />
by the slowing down time of the fast particles, while later the<br />
edge temperature decreases when the density rise due to beam<br />
fuelling reaches the edge [3] . There is little change in SOL<br />
thicknesses. With RF heating the SOL parameters react nearly<br />
instantaneously to the applied power indicating a direct power<br />
deposition. Edge temperature <strong>and</strong> density both increase.<br />
Scrape-off lengths frequently increase but ^ is not affected<br />
for a very well conditioned vessel (low impurity influx; low gas<br />
release) [4] . In these cases the discharge usually reaches a<br />
steady state. Mixed heating schemes show a mixture of these
o<br />
x<br />
CO<br />
o<br />
3.0<br />
2.0<br />
.2-0.5<br />
'in<br />
c<br />
0.3<br />
100<br />
co 50<br />
LL<br />
i<br />
Q. 20<br />
<strong>IAEA</strong>-CN-50/A-Vn-12 469<br />
1MA 2MA<br />
1_MA .<br />
2 MA<br />
O3-3.3MA<br />
x 4MA -<br />
V 5MA<br />
i i<br />
3 MA<br />
0.5 1.0 2.0 5.0<br />
Line Av. Density < ne > (x 10 19 nr 3 )<br />
FIG. 1. (A) Edge density ne(a) as a Junction of {ne}. Eight-limiter case is shown as drawn lines<br />
(from [2]) <strong>and</strong> belt limiter case as discrete data points. (B) Edge temperature Te(a) as a Junction of{ne)<br />
with Ip as parameter.<br />
effects <strong>and</strong> can only be used for approximate studies of<br />
operational conditions <strong>and</strong> limitations.<br />
In the divertor configuration, profiles along a poloidal contour<br />
obtained from fixed Langmuir probes in the target tiles are<br />
shown in figure 2 for a 4.5 MA discharge for both OH <strong>and</strong><br />
H-modes. The inner <strong>and</strong> outer separatrix positions are<br />
indicated. The inner divertor plasma is colder <strong>and</strong> denser than<br />
the outer; more power is carried to the outer.<br />
Detailed rreasurements of radial profiles have been made with the<br />
reciprocating probe. Figure 3 shows profiles obtained in the
470 DE KOCK et al.<br />
Profiles in divertor rj<br />
#18341 ;4.6MA;PNBI=14MW i_<br />
100 200 mm<br />
P2 P3 P4 P5 P6 P7 P8<br />
Probe number (see inset)<br />
FIG. 2. Profiles of ne <strong>and</strong> Te along poloidal contour of divertor target plates. Both Ohmic <strong>and</strong> Hmode<br />
phases are shown. Discharge parameters: Ip — 4.6 MA; BT = 2.7 T, PNB = 14 MW.<br />
Ohmic <strong>and</strong> Ohmic + ICRH phase of a 3 MA.; 3.4 T discharge (taken<br />
fran two similar discharges). The change in slope in the<br />
density SOL is interpreted as indicating that the probe has<br />
crossed the LCFS. Figure 4 shows a similar case for a 3 MA; 2.1<br />
T diverted discharge in H-node conditions (ie. with NBI).<br />
Scrape-off lengths from this probe can only be compared to those<br />
obtained with the fixed probes in the target tiles by taking the<br />
magnetic configuration, ie. compression of magnetic flux<br />
surfaces, into account [5]. The ratio of the saturation current<br />
on ion <strong>and</strong> electron side is shown to range from 0.3 to 3. It is<br />
less than unity near the outer separatrix but further out it<br />
exceeds unity.<br />
(b) Spectroscopic studies of iirpurity influxes<br />
The main impurities in JET are carbon <strong>and</strong> oxygen. Some nickel<br />
is introduced from the antenna screens during RF heating.<br />
The SOL parameters have been used to calculate the carbon<br />
influxes using physical sputtering yields [6] <strong>and</strong> including<br />
carbon self sputtering. The influxes have been integrated over<br />
the SOL. The results are presented here as the ratio of<br />
sputtered carbon flux rc to the deuterium, flux rD incident on<br />
the belt limiter (Fig. 5).<br />
For the spectroscopic measurements of influxes, plasma light<br />
emitted from, areas in front of limiters or wall is collected by
1<br />
10"<br />
<strong>IAEA</strong>-CN-50/A-VI1-12<br />
LCFS LCFS<br />
(magnetics) (exper.)<br />
# 15431<br />
20 40 60 80<br />
SOL Distance (mm)<br />
} 3 MA; 3.4 T<br />
OHMIC<br />
ICRH<br />
(12 MW)<br />
100<br />
ICRH<br />
(12 MW)<br />
OHMIC<br />
20 40 60 80 100<br />
SOL Distance (mm)<br />
FIG. 3. Reciprocating probe measurements ofne(r) <strong>and</strong> Tc(r) in one Ohmic <strong>and</strong> one Ohmic + ICRH<br />
discharge of /„ = 3 MA; BT = 3.4 T, PICRH = 12 MW.<br />
telescopes <strong>and</strong> transmitted by means of a quartz optical fibre<br />
(100 m) to spectrometers or detectors equipped with narrow b<strong>and</strong><br />
interference filters. Using atomic constants the influx can be<br />
derived from the spectroscopic line intensities <strong>and</strong> the measured<br />
density <strong>and</strong> temperature profiles. The telescopes observe only a<br />
small part of the interaction area. Usually simultaneous<br />
measurements of hydrogen, impurities <strong>and</strong> continuum (for<br />
are taken [7] .<br />
The ratio of carbon to deuterium influx is also obtained<br />
experimentally from spectroscopy (Fig. 5). In steady state the<br />
local recycling must be close to R=l <strong>and</strong> the deuterium influx<br />
must be equal to the flux onto the surface. The data refer to a<br />
series of discharges where density flat-tops at various values<br />
were obtained after pellet injection. Both calculated <strong>and</strong><br />
spectroscopic results show a decreasing trend with<br />
471
472 DE KOCK et al.<br />
rrr 3<br />
Ja.<br />
eV<br />
lion<br />
'sat<br />
'sat<br />
10"<br />
10" r<br />
100<br />
60<br />
40<br />
20<br />
10<br />
2<br />
1<br />
0.5<br />
Profiles in Scrape-off Layer<br />
T 1 1 1 1 1 r<br />
#15797; 3 MA;<br />
2.1 T; H-mode;<br />
PNBI=7.6MW<br />
i<br />
\T=30mm<br />
#15797;<br />
2.1T;3MA; H-mode<br />
Flow away<br />
Irom divertor<br />
#15797; 3 MA; 2.1 T<br />
0.2<br />
H-mode<br />
0.1<br />
-20 20 40 60<br />
RpK>b. - R plasma) /mrn<br />
FIG. 4. Reciprocating probe measurements ofnjr), TJr) <strong>and</strong> I^p<br />
diverted discharge in the H-mode phase. PNB =7.6 MW.<br />
in an Ip = 3 MA, BT = 2.1 T<br />
Oxygen influxes often behave erratically <strong>and</strong> are only partially<br />
understood. Coitparison of the behaviour of D2 <strong>and</strong> He-discharges<br />
indicates that chemical processes involving oxygen are important<br />
[8].<br />
Metal impurities, such as nickel, originating from the inconel<br />
wall or from the nickel Faraday screen of the RF antennas during<br />
the application of RF povrer are due to localised effects <strong>and</strong> are<br />
not easily explained by the overall SOL parameters. However the
o<br />
•£<br />
0.15<br />
'o<br />
= 0.05<br />
C<br />
O<br />
J3<br />
o 0.0^<br />
0.0<br />
<strong>IAEA</strong>-CN-50/A-Vn-12 473<br />
; o<br />
* Probe (Calculated)<br />
o Spectroscopy<br />
1.0 1.5 2.0 2.5<br />
Volume Average Density (10' 9 rrv 3 )<br />
F/G. 5. /totias of TC/TD from calculations using measured edge parameters <strong>and</strong> known sputtering<br />
data <strong>and</strong> from spectroscopic measurements using low ionization states of carbon + Da as a function<br />
of {ne} in a 3 MA, q = 3.5 limiter discharge (Nos 17274-17281). Lines are added as guidance.<br />
removal of metals from the limiters is consistent with the<br />
limiter sputtering model [10] .<br />
3. INTERPRBIATiaN AND DISCUSSION<br />
The experimental scalings of Te(a) <strong>and</strong> rig(a) as a function of L<br />
<strong>and</strong> , are shown in figures 1A, IB. The indication that JET<br />
has a relatively uniform SOL, has stimulated an effort to model<br />
the SOL behaviour froti basic principles. The experimental<br />
scaling ne(a) colp may be approximated by ne(a) cc 2 <strong>and</strong><br />
this relation can be modelled by simple particle diffusion<br />
[11,12,13]. The power to the SOL, PL, ie. the difference<br />
between input power <strong>and</strong> the radiation losses, was then taken as a<br />
variable. The carbon impurity influx was calculated using the<br />
physical sputtering model for carbon [6]. Radiation losses were<br />
derived frcm central carbon concentrations obtained by the<br />
analytical transport model of Engelhardt [11].<br />
Assuming simple parallel transport without impurity production<br />
we obtain: Te(a) ccPL '3/ '3. Including physical sputtering<br />
<strong>and</strong> radiation in a self consistent way yields T^(a) a<br />
PL 07 [14]. For the comparison of the experiment with the<br />
model we note that the loop voltage Vj ~ 1 V <strong>and</strong> is<br />
approximately constant so that Ip a P. Since the radiated power<br />
is 40-60% of the input power we obtain for the experimental<br />
scaling Te(a) ocP 2 - 2 . We note that the density scaling<br />
agrees well, but that the scaling with power shows a<br />
3.0
474 DE KOCK et al.<br />
discrepancy. However, the strong dependence on density shows<br />
that this is the main controlling factor in the decrease of the<br />
temperature <strong>and</strong> thus sputtering (due to the fall in yield at<br />
lower impact energies). The discrepancy with power dependence<br />
is due to the change of the SOL thickness with current <strong>and</strong> more<br />
careful examination <strong>and</strong> further refinement is required for<br />
underst<strong>and</strong>ing.<br />
Transport of particles <strong>and</strong> energy described by Di <strong>and</strong> xi can in<br />
principle be derived from ^ <strong>and</strong> X^. \~ is approximately<br />
constant over several orders of magnitude in the SOL profile<br />
indicating that Di cc T % (locally) . Values of Di ^ 0.5 to 4<br />
m 2 /s have been deduced [14,15].<br />
Experimental <strong>and</strong> calculated results for the relative carbon<br />
influxes (Fig. 5) are similar. At low density the spectroscopic<br />
results show a higher relative carbon influx. Mast of this<br />
discrepancy is due to the difference between the charged ion<br />
flux onto the limter <strong>and</strong> that inferred from Da measurements.<br />
The decrease in the relative carbon influx with increasing <br />
is also reflected in the behaviour of the central concentration<br />
of carbon which falls with increasing <strong>and</strong> increases with<br />
Ip[8]. The apparent agreement is maybe fortuitous because there<br />
are indications that the sputtering yield under high ion fluxes<br />
[9] is higher than the values used in the sputtering model <strong>and</strong><br />
the sputtering of carbon by oxygen has been ignored.<br />
The data for divertor discharges, which show the outer<br />
separatrix hotter than the inner one, suggest that a net<br />
thermo-electric current must flow in the SOL [16]. This current<br />
has been observed (I ^ 10 5 A/m 2 ) [17,18]. The high ratio of the<br />
ion saturation current on opposite sides of the probe (Fig. 4)<br />
indicates a flow towards the divertor in the outer region of the<br />
SOL <strong>and</strong> the low ratio implies a reverse flow closer to the<br />
separatrix, consistent with high recycling conditions there.<br />
It is sometimes argued that the local recycling in the divertor<br />
enables the main plasma to be screened from impurities, but this<br />
flow out of a divertor will tend to degrade this screening<br />
effect.<br />
4. CONCLUSION<br />
Although many uncertainties remain, it appears that the main<br />
mechanisms describing the SOL parameters in relation to the main<br />
plasma parameters can be identified <strong>and</strong> have been modelled<br />
analytically with a fair degree of success. In limiter<br />
discharges the impurity influx of carbon has been calculated<br />
from a sputtering model using measured SOL parameters. It is in<br />
good agreement with spectroscopic measurements at higher
<strong>IAEA</strong>-CN-50/A-VIM2 475<br />
densities, but shews a deviation at the low densities. The<br />
equivalent impurity influx calculation in diverted discharges is<br />
not yet possible. The non-steady state of the additionally<br />
heated discharges makes them less accessible to accurate<br />
modelling. However, the trends can be recognised by taking the<br />
observed density rise <strong>and</strong> the increased power conducted to the<br />
SOL <strong>and</strong> referring to the experimental scaling of the limiter<br />
discharges. To obtain the lowest possible carbon impurity<br />
concentration in JET, discharges have to be operated at the<br />
highest possible density at any given level of input power.<br />
REFERENCES<br />
[1] ERENTS, S.K., TAGLE, J.A., McCRACKEN, G.M., STANGEBY, P.C., DE KOCK, L.,<br />
Nucl. Fusion 26 (1986) 1591.<br />
[2] TAGLE, J.A., ERENTS, S.K., McCRACKEN, G.M., PITTS, R.A., STANGEBY, P.C.,<br />
LOWRY, C.C., STAMP, M.F., in Controlled Fusion <strong>and</strong> Plasma Physics (Proc. 14th Eur.<br />
Conf. Madrid, 1987), Vol. 11D, Part n, European Physical Society (1987) 662.<br />
[3] ERENTS, S.K., TAGLE, J.A., McCRACKEN, G.M., ibid., p. 740.<br />
[4] TAGLE, J. A., et al., in Plasma-Surface Interactions (Proc. 8th Int. Conf., 1988), to be published<br />
in J. Nucl. Mater.<br />
15] ERENTS, S.K., et al., ibid.<br />
[6] BOHDANSKY, J., Data Compendium for Plasma-Surface Interactions, Nucl. Fusion Special<br />
Supplement 1984 (1984) 61.<br />
[7] STAMP, M.F., BEHRINGER, K.H., FORREST, M.J., MORGAN, P.D., SUMMERS, H.P.,<br />
in Plasma-Surface Interactions (Proc. 8th Int. Conf., 1988), to be published in J. Nucl. Mater.<br />
[8] BEHRINGER, K., DENNE, B., FORREST, M.J., MORGAN, P.D., STAMP, M.F., ibid.<br />
[9] GOEBEL, D.M., et al., Nucl. Fusion 28 (1988) 1041.<br />
[10] McCRACKEN, G.M., GOODALL, D.H.J., STANGEBY, P.C., COAD, J.P., ROTH, J., in<br />
Plasma-Surface Interactions (Proc. 8th Int. Conf., 1988), to be published in J. Nucl. Mater.<br />
[11] ENGELHARDT, W., et al., J. Nucl. Mater. Ill & 112 (1982) 337.<br />
[12] ALEXANDER, K.F., et al., Nucl. Fusion 26 (1986) 1575.<br />
[13] STANGEBY, P.C., et al., J. Nucl. Mater. 145-147 (1987) 105.<br />
[14] ERENTS, S.K., TAGLE, J.A., McCRACKEN, G.M., STANGEBY, P.C., DE KOCK, L.,<br />
Nucl. Fusion 28 (1988) 1209.<br />
[15] STANGEBY, P.C., TAGLE, J.A., ERENTS, S.K., LOWRY, C.J., Plasma Phys. Controll.<br />
Fusion (in press).<br />
[16] HARBOUR, P.J., Workshop on Plasma Edge Theory in Fusion Devices, Augustusburg, GDR,<br />
1988, to be published in Contributions to Plasma Physics (Akademie-Verlag, Berlin, GDR).<br />
[17] HARBOUR, P.J., et al., in Plasma-Surface Interactions (Proc. 8th Int. Conf., 1988), to be published<br />
in J. Nucl. Mater.<br />
[18] KEILHACKER, M., et al., Paper <strong>IAEA</strong>-CN-50/A-III-2, these Proceedings, Vol. 1.
INVESTIGATION OF<br />
LIMITER SCRAPE-OFF LAYER<br />
ON LEBTOR TOKAMAK<br />
V.M. LEONOV, N.P. MALAKHOV, V.G. ZHUKOVSKIJ<br />
I.V. Kurchatov Institute of Atomic Energy,<br />
Moscow,<br />
Union of Soviet Socialist Republics<br />
A.M. ALABYAD, N.M. BHIEH, A.M. HASHKEL,<br />
S.A. SEGHAYER<br />
Plasma Physics, Tajura Center,<br />
Tripoli, Libyan Arab Jamahiriya<br />
Abstract<br />
<strong>IAEA</strong>-CN-50/A-VH-13<br />
INVESTIGATION OF LIMITER SCRAPE-OFF LAYER ON LIBTOR TOKAMAK.<br />
The paper discusses the screening properties of the limiter scrape-off layer, defines the optimum<br />
width of this layer <strong>and</strong> investigates energy <strong>and</strong> particle fluxes in the boundary plasma. The limiter layer<br />
is created by insertion of a rail molybdenum limiter, up to the optimum depth, inside the discharge<br />
chamber. It is shown that the limiter layer consists of two regions with different diffusion coefficients.<br />
The insertion of the limiter allows substantial shielding of the chamber wall from interaction with the<br />
plasma column <strong>and</strong> decreases the particle flux onto the wall. The particle flux onto the surface surrounding<br />
the plasma is partly non-ambipolar. The main mechanism of limiter erosion in the stationary part<br />
of a discharge is ion sputtering. It is possible to change the rate of limiter sputtering <strong>and</strong> the particle<br />
fluxes by changing the limiter potential with respect to the discharge chamber. The particle confinement<br />
time within the plasma column <strong>and</strong>, probably, also the energy confinement time are varied by a change<br />
in the limiter potential. Such an active control over the limiter sputtering, over the heat <strong>and</strong> particle<br />
fluxes onto the limiter <strong>and</strong> over the plasma confinement time can be found to be of importance for the<br />
prospects of limiter application as an alternative to the divertor in a tokamak reactor.<br />
1. INTRODUCTION<br />
The behaviour <strong>and</strong> the parameters of the boundary plasma define the plasmawall<br />
<strong>and</strong> plasma-limiter interactions <strong>and</strong>, in this way, exert a direct influence on the<br />
character of the main plasma. In Ref. [1], it had been shown that the amount of impurities<br />
<strong>and</strong> the discharge characteristics change with different limiter radii (limiter<br />
scrape-off layer (LSL) width). The main purpose of this paper is to investigate<br />
the screening properties of the LSL, to define the optimum width of this layer<br />
<strong>and</strong> to study how energy <strong>and</strong> particle fluxes are transferred from the plasma to the<br />
surrounding material surfaces.<br />
477
478 LEONOV et al.<br />
2. INSTALLATION AND METHODS<br />
The main parameters of the Libtor tokamak <strong>and</strong> the discharge used are:<br />
R = 53 cm, a = 11.5 cm, fixed limiter radius = 10 cm, Bo = 2.6 T, Ip = 30 kA,<br />
He = (0.5 - 2) x 10 13 cm" 3 . Two moving molybdenum plates, a large one<br />
(9x9x2 cm 3 ) as a working limiter <strong>and</strong> a small one (4.5 x 4.5 x 0.5 cm 3 ) as a<br />
probe limiter (single probe), are used as additional limiters placed at the bottom of<br />
the tokamak 90° apart along the torus. The experiment showed that the ion <strong>and</strong><br />
electron branches of the single probe characteristics are fairly distinct <strong>and</strong> the movement<br />
of the probe limiter does not affect the LSL structure.<br />
3. EXPERIMENTAL RESULTS<br />
3.1. The results of the LSL screening properties versus its width on the Libtor tokamak<br />
are shown in Fig. 1. When the LSL width increases up to 3 cm, no great change<br />
in the parameters is to be seen, except for an increase in the impurity fluxes from<br />
the limiter <strong>and</strong> an increase of heat <strong>and</strong> current flowing to the limiter. At further<br />
increase of Ar, the rate of impurity influx from the limiter decreases <strong>and</strong> so does the<br />
flux of light <strong>and</strong> heavy impurities from the wall. From this, we may conclude that<br />
the total impurity flux also drops. The hydrogen flux from the wall decreases, too.<br />
At the same radius, the average plasma density <strong>and</strong> the radiated power decrease. The<br />
current between the limiter <strong>and</strong> the wall changes polarity <strong>and</strong> becomes negative.<br />
Thus, as in Ref. [1], we can distinguish an optimum limiter radius, which corresponds<br />
to Ar « 4.5-5.5 cm for these discharge parameters. It should be noted<br />
that, when the limiter radius is near its optimum value, the negative limiter-wall<br />
current is maximum <strong>and</strong> decreases with changing Ar in any direction.<br />
3.2. The purpose of further investigations was to study the distribution of particle<br />
<strong>and</strong> energy fluxes to the limiter surface at LSL width near optimum (Ar = 4.5 cm).<br />
In so doing, the probe limiter was removed in the shadow of the working limiter —<br />
the LSL width being fixed — <strong>and</strong> heat fluxes <strong>and</strong> currents to both limiters were measured.<br />
In Fig. 2(a) the radial distributions of the energy having passed to the limiter<br />
have two distinct zones. At the edge of the limiter a sharper decrease in energy<br />
(e-delay length =3.5 mm) is observed in a zone of 1 cm width. In the zone away<br />
from the limiter edge, the energy density decrease occurs more slowly, with an<br />
e-delay length of »7 mm.<br />
In Fig. 2(b), the radial dependence of the current density having passed to the<br />
limiter is shown for two Bo directions. The electron current passes at the edge of the<br />
limiter; closer to the wall, the current becomes positive. It should be noted that the<br />
position of the negative <strong>and</strong> positive current zones coincides well with the position<br />
of negative <strong>and</strong> positive current zones in Fig. 1, i.e. this layer structure not only<br />
characterizes the shadow of the limiter, but the entire near-wall layer, in general. The
-o.i<br />
0<br />
0<br />
-0.2<br />
.J-\<br />
I I I<br />
2 4 6 8<br />
ar = r,.,-r. (cm)<br />
<strong>IAEA</strong>-CN-50/A-VIM3<br />
F/G. 7. Variation of discharge parameters with limiter layer width. Ar is the LSL width; IWL <strong>and</strong> IPL<br />
are the working <strong>and</strong> probe limiter short circuit currents to the chamber wall (probe limiter at wall<br />
radius); I (Mo I, C II) are the spectral line intensities near the limiter, I (Fe I, O II) are line intensities<br />
far from the limiter; Prad is the amplitude of the signal from the collimated pyroelectric detector. The<br />
toroidal magnetic field direction corresponds to the ion drift towards the limiter (Bo+).<br />
electron temperature in the layer is 25-50 eV; it increases towards the limiter edge.<br />
The plasma density at the limiter edge has decreased in the negative current layer with<br />
a constant of 8 = 7 mm. The rate of density decrease in the positive current layer<br />
is a few times smaller. An estimation of the diffusion coefficient for the electron<br />
current range yielded a value of Dxl ~6 2 VTe/irqRVmi « (2.5-3.5) X 10 3 cm 2 -s"'<br />
~ (0.3-0.5) DBO,,,,,. In the range of ion current the diffusion coefficient turned out<br />
to be a few times greater <strong>and</strong> approximately equals D±1 = D^i,,,,.<br />
Comparing the ion saturation current to the limiter with the limiter-wall short<br />
circuit current, we can draw a conclusion on ambipolar <strong>and</strong> non-ambipolar particle<br />
fluxes to the limiter <strong>and</strong> to the wall. In our case, the ion saturation current is a few<br />
times greater than the short circuit current at different positions of the probe limiter.<br />
Thus, the non-ambipolar particle flux to the surfaces surrounding the plasma did not<br />
exceed 10 to 20%.<br />
479
480 LEONOV et al.<br />
&r (cm)<br />
0.2<br />
-0.2<br />
0.1<br />
0<br />
-0.2<br />
-0.4<br />
-0.6<br />
J<br />
~ (b)<br />
-<br />
_<br />
- Wall<br />
/<br />
I J<br />
-x—* *<br />
—•—•--v<br />
ar (cm)<br />
\<br />
B I<br />
°*\ 1<br />
1<br />
Limiter *.<br />
1<br />
I<br />
1<br />
|<br />
1<br />
1 1<br />
)<br />
FIG. 2. (a) Radial distribution of energy passing to the limiter within the discharge time (20 ms), with<br />
opposite Bo directions; (b) radial distribution of current density passing to the limiter for two Bo<br />
directions.<br />
3.3. To clarify the mechanism of limiter surface erosion, the effective temperature<br />
of the molybdenum atoms was measured from the Doppler broadening of the Mo I<br />
line (\ = 3798.25 A). The temperature did not exceed 5 to 7 eV, which indicates<br />
that the ion sputtering is the main erosion mechanism of the limiter surface <strong>and</strong> the<br />
effect of the unipolar arcs is small, unlike the situation in Ref. [2], where a significantly<br />
higher average energy of the Mo atoms was found <strong>and</strong> it was concluded that<br />
the effect of the unipolar arcs was significant.<br />
3.4. As was shown in Ref. [3], it is possible to change the wall sputtering <strong>and</strong> the<br />
particle confinement in the plasma column by changing the potential of the plasma<br />
periphery with respect to the wall. An attempt to actively control the limiter sputtering<br />
<strong>and</strong> the particle confinement in the plasma by applying potentials of both signs<br />
between the working limiter <strong>and</strong> the discharge chamber wall has also been made on<br />
Libtor tokamak. The experimental results are shown in Fig. 3. Evidently, also in our<br />
case it was possible to change the limiter sputtering by changing its potential. A<br />
change in the intensity of the Mo I line from the limiter location zone, when positive<br />
or negative potentials are applied, proves this statement. The intensities of the carbon<br />
<strong>and</strong> hydrogen lines in the neighbourhood of the limiter have also been changed in the<br />
same way. Meanwhile, the spectral line intensities at a distance from the limiter were<br />
changed slightly.<br />
A considerable increase in the mean plasma density occurs when a positive<br />
potential is applied to the limiter. It drops when a negative potential is applied. Such
m 2<br />
3 -<br />
4<br />
><br />
o<br />
3<br />
2 -<br />
_ 5 -50<br />
-100<br />
| i<br />
0<br />
50<br />
2 -<br />
2 -<br />
<strong>IAEA</strong>-CN-50/A-VU-13 481<br />
}'•••<br />
Y<br />
-1<br />
n<br />
j<br />
/<br />
V<br />
s +200 V<br />
-^—<br />
u"L"-<br />
U. = 0<br />
+200 V<br />
o<br />
-200 V<br />
0<br />
U ~ 200 x/<br />
•••' v^, . "<br />
U<br />
L = -200 V<br />
U<br />
L = -200 V<br />
U<br />
L = +200 V<br />
^•'<br />
+200 \ I<br />
N \<br />
^ \<br />
*V \<br />
U<br />
L = o y<<br />
1 1 i i<br />
5 10 15 20<br />
t (ms)<br />
FIG. 3. Discharge characteristics with active change of Umiter-wall voltage.<br />
a behaviour of the mean plasma density attests to a change in the particle confinement<br />
time within the plasma column, as it is impossible to explain it by a change in the<br />
particle influx to the plasma column. A change in the C V line intensity under a<br />
corresponding potential variation also indicates a change in the particle confinement<br />
time.<br />
The mean plasma electrical conductivity is reduced when potentials of both<br />
signs are applied to the limiter. This is verified by the increase in the loop voltage,<br />
l\
482 LEONOV et al.<br />
Uo, at constant plasma current. The change in the limiter potential also results in a<br />
change in the current passing from the limiter to the liner, IWL. The amount of heat<br />
released on the limiter is also varied.<br />
4. CONCLUSIONS<br />
4.1. The introduction of a limiter allows a substantial shielding of the chamber wall<br />
from the interaction with plasma <strong>and</strong> a reduction in the impurity influx into the<br />
plasma column. The optimum radius of the limiter corresponds to a region of fastest<br />
change in the discharge parameters <strong>and</strong> to a maximum negative current passing<br />
between the short circuited limiter <strong>and</strong> the liner.<br />
4.2. The limiter layer consists of two regions with different diffusion coefficients.<br />
4.3. The particle flux onto the surfaces surrounding plasma is partly nonambipolar.<br />
4.4. The main mechanism of limiter erosion in the stationary part of a discharge is<br />
ion sputtering, in our case.<br />
4.5. It is possible to change the rate of limiter sputtering <strong>and</strong> the fluxes of particles<br />
<strong>and</strong> heat onto the limiter by changing its potential with respect to the discharge<br />
chamber wall.<br />
4.6. The particle confinement time within the plasma column <strong>and</strong>, probably, the<br />
energy confinement time in it are varied by a change in the limiter potential.<br />
REFERENCES<br />
[1] LEONOV, V.M., Rep. IAE-3232/7, Institute of Atomic Energy, Moscow (1980).<br />
[2] DEMIDENKO, I.I., et al., Fiz. Plazmy 10 (1984) 504.<br />
[3] OREN, L., et al., J. Nucl. Mater. Ill & 112 (1982) 34.
<strong>IAEA</strong>-CN-50/A-VII-14<br />
MEASUREMENTS OF CORRELATIONS BETWEEN<br />
THERMAL AND PARTICLE TRANSPORT IN JET<br />
A.D. CHEETHAM, A. GONDHALEKAR, J.C.M. DE HAAS 1 ,<br />
O.N. JARVIS, P.D. MORGAN, J. O'ROURKE, G. SADLER,<br />
M.L. WATKINS<br />
JET Joint Undertaking,<br />
Abingdon, Oxford,<br />
United Kingdom<br />
Abstract<br />
MEASUREMENTS OF CORRELATIONS BETWEEN THERMAL AND PARTICLE TRANSPORT<br />
IN JET.<br />
Radial thermal <strong>and</strong> particle diffusivities have been measured by using transient methods yielding<br />
X <strong>and</strong> D simultaneously in the plasma interior at 0.5 £ r/a S 0.7. Values of xe = 2.9 ± 0.4 m 2 -s"'<br />
<strong>and</strong> De = 0.4 ± 0.1 m 2 -s"' have been measured in OH plasmas, giving xe/De = 7.2 ± 3. NBI<br />
heated H-mode plasmas are indistinguishable from OH plasmas in respect of xe, De <strong>and</strong> xj®c in the<br />
region specified. The ion thermal diffusivity has also been measured in H-mode plasmas, giving<br />
1 < Xi (m 2 -s~') < 3, simultaneously with xe = 3 ± 0.5 m 2 -s""', thus 0.3 < x/Xe < 1- The<br />
large value of xe/De would suggest that micro-magnetic stochasticity, rather than E x B convection,<br />
may be the key mechanism in anomalous thermal transport.<br />
1. INTRODUCTION<br />
An important objective in tokamak research is to find<br />
suitable descriptions for the measured radial thermal <strong>and</strong> particle<br />
fluxes, <strong>and</strong> to identify underlying mechanisms of transport.<br />
Many models for transport in tokamaks have been developed which<br />
make specific predictions for correlations between thermal <strong>and</strong><br />
particle transport [1,2,3]. Correlations amongst the transport<br />
coefficients arise due to mutual interference between the simultaneously<br />
occurring processes in the system, which is described<br />
by some form of Onsager relations. In order to exclude some of<br />
the contending models, accurate measurements of the correlations<br />
are required. To reduce uncertainties arising from shot-to-shot<br />
<strong>and</strong> spatial variations it is necessary to determine these<br />
coefficients simultaneously in the same spatial region of the<br />
plasma. Static experiments involving steady-state analysis for<br />
determination of correlations between the coefficients are<br />
likely to be inconclusive <strong>and</strong> transient methods which do not<br />
strongly perturb the plasma are needed.<br />
FOM Instituut voor Plasmafysica 'Rijnhuizen', Nieuwegein, Netherl<strong>and</strong>s.<br />
483
484 CHEETHAM et al.<br />
We present simultaneous measurements of radial thermal <strong>and</strong><br />
particle transport coefficients using a method that satisfies<br />
the above requirements, namely, the analysis of the inward<br />
propagation of temperature <strong>and</strong> density perturbations produced<br />
when a small pellet is injected into the plasma. The results<br />
are compared with those obtained by analysis of electron<br />
temperature <strong>and</strong> density pulses propagating outwards following<br />
sawtooth collapse, <strong>and</strong> time dependent transport analysis applied<br />
to non-stationary plasmas. In this paper the pellet injection<br />
method is extended to H-mode plasmas, <strong>and</strong> to measurement of Xi<br />
simultaneously with xe <strong>and</strong> D e" The P a P er incorporates results<br />
from earlier publications [4,5] where details of the applied<br />
methods are given. Other transient methods to measure electron<br />
density <strong>and</strong> thermal transport, by modulating the sources, have<br />
also been used in JET [6, 7,8]. However, these methods cannot<br />
be applied simultaneously.<br />
In the following we contrast thermal <strong>and</strong> particle transport<br />
behaviour in Ohmically heated (OH) deuterium plasmas in the<br />
outer-limiter configuration in the parameter range I(J)=3MA,<br />
2.8
<strong>IAEA</strong>-CN-50/A-VII-14<br />
have arbitrary spatial profiles. Because the applied perturbation<br />
is small QD(r) <strong>and</strong> S(r) are assumed to remain stationary<br />
during Te profile evolution, allowing them to be combined into<br />
e<br />
an effective source, Seff(r) so that eq.1 becomes<br />
dWe/dt=div|nexeVTe} + Seff,<br />
Seff -divQp+S -2aexeV<br />
(b) Non-linear model for xe in which Qe=-nexeVTe where<br />
Xe(r)=xool|vTe|/(To/a)} 6 + xo{i +a(r/a) e }, (TQ/a) is a normalizing<br />
parameter. The first term with xoo dominates everywhere except<br />
near the plasma center where it is zero, <strong>and</strong> in the edge region<br />
where global power balance requires that xe(r) increase sharply.<br />
The second term with Xp adjusts these two end regions <strong>and</strong> is<br />
negligible elsewhere. Thus in the measurement region, the nonlinear<br />
xe is emphasized. This idealized non-linear Xo model<br />
does not admit any thermal pinch. A non-linear xP model has<br />
o.o<br />
0.2 0.4 0.6 0.8<br />
Minor Radius (r/a)<br />
1.0 0.2 0.4 0.6 0.8<br />
Minor Radius (r/a)<br />
FIG. 1. Radial electron temperature <strong>and</strong> density profiles for OH {#12770) <strong>and</strong> NBI heated H-mode<br />
(#15925) plasmas.<br />
(a) Pre-pellet equilibrium electron density profile (1), calculated pellet deposition profile (3), <strong>and</strong> total<br />
post-pellet density profile (2).<br />
(b) Pre-pellet equilibrium electron temperature profile (1), <strong>and</strong> post-pellet Te profile (2). The circles<br />
denote the measurements. The solid circles denote the points for which comparisons of measurement <strong>and</strong><br />
modelling of temperature evolution are made.<br />
The profiles (a2) <strong>and</strong> (b2) are the initial conditions for the transport calculation.<br />
1.0<br />
485
486<br />
CHEETHAM et al.<br />
0 20 40 60 30 100 120 140 160 180 200<br />
At (ms)<br />
FIG. 2. Temporal evolution of electron temperature at four radii after injection of a pellet into the Hmode<br />
plasma (til5925). The full line is the measured electron temperature using ECE, <strong>and</strong> the dashed<br />
line is the modelled evolution using the diffusive model with thermal pinch.<br />
also been proposed for modelling of TFTR electron temperature<br />
profiles [10]. Eq.1 then becomes<br />
dWe/dt=div[(nexool|VTe|/(To/a)} 6 +nexo{i+a(r/a) B })VTe] +S -2b-<br />
After pellet injection, evolution of Te(r) takes place initially<br />
in the presence of strong temperature gradients. Thus this<br />
method will be a sensitive test of the VTe dependence of xe-<br />
The initial conditions for solving eq.2a <strong>and</strong> 2b, the<br />
temperature <strong>and</strong> density profiles instantly after pellet injection,<br />
are determined from measurements of Te(r), ne(r), pellet<br />
mass, ablation rate <strong>and</strong> penetration depth. Fig. 1 shows Te(r)<br />
<strong>and</strong> ne(r) immediately before <strong>and</strong> after pellet injection. During<br />
evolution of Te(r) the perturbed density profile is assumed to<br />
be stationary. This is justified a posteriori because the density<br />
perturbation travels much more slowly than the temperature<br />
perturbation, as will become clear in the following.<br />
Fig. 2 shows a representative comparison between the<br />
measured <strong>and</strong> modelled Te(r,t) at four radii for a H-mode plasma,<br />
applying diffusive model with thermal pinch, eq.2a. Assuming<br />
Xe(r), Seff(r) is calculated for the equilibrium pre-pellet<br />
plasma <strong>and</strong> maintained stationary thereafter. The modelled evolution<br />
of T is found to be sensitive only to the local value of
<strong>IAEA</strong>-CN-50/A-VH-14 487<br />
TABLE I. SOME ELEMENTS OF THE RADIAL TRANSPORT MATRIX<br />
a b<br />
c<br />
a b<br />
c<br />
Xe(m 2 /s)<br />
2.8+0.3<br />
2.9+0.4<br />
-<br />
Xe(m 2 /s)<br />
3±0.5<br />
3±0.6<br />
2(d)<br />
OH limiter plasma [5]<br />
De(m 2 /s)<br />
0.4±0.1<br />
0.4+0.2<br />
o^-8:f<br />
(10 l8 ?m 2 s)<br />
2±0.7<br />
NBI heated H-mode plasmai<br />
De(m 2 /s)<br />
0.3-0.6<br />
0.2-0.3<br />
0.3-0.4<br />
Xi(m 2 /s)<br />
1-3<br />
-<br />
p = r/a<br />
0.5Sp
488 CHEETHAM et al.<br />
o<br />
LU<br />
3.0<br />
2.8 •<br />
a> 2.6<br />
2?<br />
a.<br />
I<br />
2.4 -•<br />
2.2 •<br />
2.0<br />
i<br />
#12770<br />
= 0.50 .<br />
_X^^^^__^a^,55 '<br />
•fr^-M^s^e^<br />
10 20<br />
At (ms)<br />
r/a =<br />
Pellet penetration: r/a -0.65<br />
= 0.60<br />
30 50 60<br />
FIG. 3. Temporal evolution of electron temperature at three different radii after injection of a pellet<br />
into the OH plasma (#12770). The full line ( ) is the measured electron temperature using ECE.<br />
The modelled temperature evolution using the non-linear x, model with 5 = 0 ( ), 8 = 0.5<br />
(- o -) <strong>and</strong> 6 = 1 (- & -) is also shown.<br />
Fig.3 shows such a comparison for three values of 6. The modelled<br />
Te evolut-ion can be understood as follows. Immediatelyafter<br />
pellet injection VTe is largest, <strong>and</strong> therefore xe» closest<br />
to the pellet penetration radius. This causes a fast initial<br />
drop in T in the measurement region. As VT <strong>and</strong> xe decrease the<br />
rate of change of Te decreases. As 6 is reduced, the initial fg<br />
becomes smaller, giving better match with measurement. The best<br />
overall match always requires xe=3m 2 /s in the measurement<br />
region. In order to obtain as good a match as in fig.2, the<br />
non-linearity must be very weak, 0
<strong>IAEA</strong>-CN-50/A-VII-14 489<br />
r =-D Vn +r (r), S is the electron source, <strong>and</strong><br />
r (r)=ne(r)V (rfa convective (pinch) particle flux. The diffusion<br />
coefficient is taken as De(r)=D0[i+a(r/a)p], giving a minimum<br />
in the core <strong>and</strong> a sharp increase at the plasma edge. This<br />
form for D(r) is justified by our previous measurements of density<br />
profile dynamics in JET [6,7], where details of determining<br />
the source Se(r) are also given. D. is iterated until a good<br />
match between the modelled <strong>and</strong> measured np(r,t) is achieved. For<br />
'e;<br />
the OH plasma<br />
D =0.4±0.1 m 2 /s,<br />
<strong>and</strong> the corresponding<br />
V(r)«-V (r/a)\ with V0-1m/s, giving r =-(2±0.7).10 l8 /m 2 .s. For<br />
the H-mode plasma De=0.3-0.6 mVs, the large uncertainty arising<br />
due to uncertainties in determining the particle source.<br />
2.3 Ion thermal diffusivity, Xj> is determined by analyzing<br />
propagation of an ion temperature perturbation using a transport<br />
CHORD # 15<br />
0 100 200<br />
At(ms)<br />
FIG. 4. Evolution of line integrated neutron emission after pellet injection along chords with major<br />
radius between 3.78 m (chord 19) <strong>and</strong> 3.02 m (chord 15).<br />
Ul
490 CHEETHAM et al.<br />
sior<br />
CO<br />
111<br />
c<br />
o<br />
B"<br />
ZA-<br />
22-<br />
ZO-<br />
E<br />
1.8-<br />
•a.<br />
K<br />
2 '<br />
O)<br />
£_c<br />
CD<br />
C<br />
_J<br />
1.6-<br />
1.4-<br />
1.2-<br />
• ^ .<br />
- X^^Cs Vv:<br />
-I ^^~-^_<br />
E<br />
"J
<strong>IAEA</strong>-CN-50/A-VII-14 491<br />
thermonuclear neutron yield, which is deduced from a model<br />
calculation of the neutral beam dynamics within the TRANSP code<br />
[131- The model calculation also gives spatial neutron emissivity<br />
profiles for neutrons from each of the two reactions.<br />
After pellet injection the beam-plasma neutron emissivity<br />
profile is assumed to remain unchanged, which is reasonable<br />
since the pellet produces only a small perturbation of the<br />
plasma parameters, <strong>and</strong> the NBI power remains constant. The<br />
observed perturbations in the total neutron yield are attributed<br />
to perturbations of ion temperature <strong>and</strong> its consequences for the<br />
thermonuclear neutrons. The initial condition for solving the<br />
diffusion equation for Xi» analogous to eq.2a, is the deuteron<br />
density <strong>and</strong> temperature profiles immediately after pellet injection.<br />
n^(r,t=0) is deduced as before from pellet deposition,<br />
<strong>and</strong> T^(r,t=0) is derived by assuming adiabatic response of the<br />
ion temperature. The temporal evolution of ^(r), the corresponding<br />
thermonuclear neutron emissivity, <strong>and</strong> the total lineintegrated<br />
neutron emission observed in each cord of the neutron<br />
camera are calculated. The perturbed n^(r) is assumed to be<br />
stationary during evolution of T^(r). The value of Xi in the<br />
measurement region is iterated until a match is obtained with<br />
the observed temporal evolution of the emission, fig. 5. This<br />
procedure yields 1
492 CHEETHAM et al.<br />
reported from other experiments [14,15], where thermal ^<strong>and</strong> particle<br />
diffusivities of equal magnitude are deduced <strong>and</strong> JExj3 transport<br />
inferred. The critical temperature gradient model of<br />
anomalous transport [16,173, which invokes magnetic stochasticity,<br />
has been used to interpret energy transport in JET. The<br />
large value of Xe/ D e seems to be consistent with the model<br />
expectations. The similarity of OH limiter plasmas <strong>and</strong> NBI<br />
heated H-mode plasmas in respect of electron thermal <strong>and</strong> particle<br />
transport behaviour in the plasma interior suggests that<br />
the same underlying mechanism of anomalous transport is operative<br />
in the two cases, although they are quite different in<br />
respect of magnetic configuration, temperature range, <strong>and</strong><br />
density profile shape. The intrinsically better particle (vs<br />
thermal) confinement witnessed here, which will similarly affect<br />
recycled impurities <strong>and</strong> helium ash, may pose the more severe<br />
barrier in future reactor oriented tokamak experiments.<br />
ACKNOWLEDGEMENTS<br />
The authors are grateful to J Fessey <strong>and</strong> D Garton for<br />
computational support, to J M Adams, M von Hellermann, D Muir,<br />
P D Larsen <strong>and</strong> N Watkins for providing <strong>and</strong> validating data, <strong>and</strong><br />
to J D Callen <strong>and</strong> R Galvao for valuable discussions.<br />
REFERENCES<br />
[1] Callen, J.D., Physics models used to describe plasma<br />
confinement <strong>and</strong> heating. JET Report JET-IR(87)07, JET<br />
Joint Undertaking, (1987).<br />
[2] Callen, J.D., Physical Review Letters 39(1977)1540.<br />
[3] Lee, G.S. <strong>and</strong> Diamond, P.H., Phys. Fluids 29(1986)3291.<br />
[4] Gondhalekar, A., et al., 15th Euro. Conf. on Controlled<br />
Fusion <strong>and</strong> Plasma Physics, Dubrovnik, 1988. Europhys.<br />
Cont. Abstracts, Vol.12b, part I, p.151.<br />
[5] Gondhalekar, A., et al., to be published in Plasma Physics<br />
<strong>and</strong> Controlled Fusion, 1988.<br />
[6] Gondhalekar, A., et al., Bull. Am. Phys. Soc. 30(1985)1525<br />
<strong>and</strong> JET Report JET-P(85)31.<br />
[7] Cheetham, A.D., et al., 13th Euro. Conf. on Controlled<br />
Fusion <strong>and</strong> Plasma Physics, Schliersee, 1986. Europhys.<br />
Conf. Abstracts Vol.10c, part I, p.240.<br />
[8] Start, D.F.H., et al., 12th <strong>IAEA</strong> Conf. on Plasma Physics<br />
<strong>and</strong> Controlled <strong>Nuclear</strong> Fusion Research, Nice, France, 1988.<br />
Paper <strong>IAEA</strong>-CN-50/E-2-3.<br />
[9] Callen, J.D., et al., <strong>Nuclear</strong> Fusion 27 (1987) 1857.<br />
[10] Boyd, D.A., et al., 11th <strong>IAEA</strong> Conf. on Plasma Physics <strong>and</strong><br />
Controlled <strong>Nuclear</strong> Fusion Research, Kyoto 1986.<br />
Proceedings, 1(1987)387.
<strong>IAEA</strong>-CN-50/A-VIM4 493<br />
[11] Christiansen, J.P., JET Joint Undertaking, private<br />
communication.<br />
[12] Adams, J.M., et al., 14th Euro. Conf. on Controlled Fusion<br />
<strong>and</strong> Plasma Physics, Madrid 1987. Europhys. Conf. Abstracts<br />
Vol. 11d, part III, p.1224.<br />
[13] Goldston, R.J., et al., J. Comput. Physics 43(1981)61.<br />
[14] Kim, S.K., et al., 15th Euro. Conf. on Controlled Fusion<br />
<strong>and</strong> Plasma Physics, Dubrovnik 1988. Europhys. Conf.<br />
Abstracts Vol.12b, part I, p.187.<br />
[15] Efthimion, P.C., et al., 12th <strong>IAEA</strong> Conf. on Plasma Physics<br />
<strong>and</strong> Controlled <strong>Nuclear</strong> Fusion Research, Nice, 1988. Paper<br />
<strong>IAEA</strong>-CN-50/A-V-4.<br />
[16] Rebut, P.H., et al., 11th <strong>IAEA</strong> Conf. on Plasma Physics <strong>and</strong><br />
Controlled <strong>Nuclear</strong> Fusion Research, Kyoto 1986.<br />
Proceedings, 2(1987)187.<br />
[17] Rebut, P.H., et al., 12th <strong>IAEA</strong> Conf. on Plasma Physics <strong>and</strong><br />
Controlled <strong>Nuclear</strong> Fusion Research, Nice, 1988. Paper<br />
<strong>IAEA</strong>-CN-5O/D-4-1.<br />
[18] Hubbard, A., et al., 13th Euro. Conf. on Controlled Fusion<br />
<strong>and</strong> Plasma Physics, Schliersee, 1986. Europhys. Conf.<br />
Abstracts Vol.iOC, part I, p.232.<br />
[19] Tubbing, B.J.D., et al., <strong>Nuclear</strong> Fusion 27(1987)1843, <strong>and</strong><br />
Lopes-Cardozo, N.J., et al., <strong>Nuclear</strong> Fusion 28(1988)1173.
<strong>IAEA</strong>-CN-S0/A-Vn-15<br />
EXPERIMENTAL RESULTS FROM INITIAL<br />
OPERATION OF THE TOKAMAK DE VARENNES<br />
R.A. BOLTON 1 , G. ABEL 2 , C. BELANGER 2 , A. BOILEAU 1 ,<br />
C. BOUCHER 2 , J. CASTRACANE 3 , G. CHEVALIER 2 , P. COUTURE 1 ,<br />
R. DECOSTE 1 , Y. DEMERS 4 , K. DIMOFF 2 , V. GLAUDE 5 ,<br />
B.C. GREGORY 2 , E. HADDAD 3 , C. JANICKI 3 , J. KALNAVARNS 3 ,<br />
J.-L. LACHAMBRE 1 , G. LeCLAIR 3 , C. MacLATCHY 6 , H.H. MAI 2 ,<br />
C.R. NEUFELD', G.W. PACHER 1 , H.D. PACHER 2 , R. PAYNTER 2 ,<br />
D. POIRIER 2 , G. RATEL 1 , N. RICHARD 3 , G. ROSS 2 ,<br />
R.A. SAINT-JAGQUES 2 , M. SAINT-ONGE 3 , C. SIMM 2 ,<br />
B.L. STANSFIELD 2 , B. TERREAULT 2 , D. THERIAULT 2 ,<br />
G. VEILLEUX, D. WHYTE 2 , W. ZUZAK 2<br />
Centre canadien de fusion magne'tique,<br />
Varennes, Quebec,<br />
Canada<br />
Abstract<br />
EXPERIMENTAL RESULTS FROM INITIAL OPERATION OF THE TOKAMAK DE<br />
VARENNES.<br />
Initial results from the Tokamak de Varennes, Canada's main tokamak experiment, are reported.<br />
Low-q (2.1) operation <strong>and</strong> disruption-free forced current rampdown (4 MA-s" 1 ) have been obtained.<br />
Measurements of central plasma <strong>and</strong> plasma-wall interaction parameters are presented <strong>and</strong> compared<br />
with expected values. UV <strong>and</strong> glow discharge conditioning is discussed, <strong>and</strong> first experiments with thick<br />
TiC limiter coatings are presented.<br />
INTRODUCTION<br />
The Tokamak de Varennes''' 2 represents Canada's main experimental contribution<br />
to fusion research based on magnetic confinement. Since the toroidal field is capable of 30<br />
second pulses, the device is particularly suited to the study of long pulses. Accordingly, the<br />
major emphasis of the program is the study of impurity transport, plasma-wall interactions,<br />
<strong>and</strong> limiter <strong>and</strong> divertor plate materials, as well as the development of advanced diagnostics<br />
<strong>and</strong> the study of plasma current variation. After the present experimental period, the device<br />
will be equipped with a double-null divertor using coils internal to the vacuum vessel, fast<br />
position control, <strong>and</strong>, in a future upgrade, with a lower hybrid current drive <strong>and</strong> heating<br />
system.<br />
1 Hydro-Quebec, Varennes, Quebec, Canada.<br />
2 INRS-Energie, Varennes, Quebec, Canada.<br />
3 MPB Technologies, Dorval, Quebec, Canada.<br />
4 Ecole polytechnique, Montreal, Quebec, Canada.<br />
5 University de Montreal, Montreal, Quebec, Canada.<br />
* Acadia University, WolfVille, Nova Scotia, Canada.<br />
495
496 BOLTON et al.<br />
70<br />
60<br />
50-<br />
£ 40<br />
£ o<br />
< 30<br />
20<br />
10-<br />
in iKi<br />
60<br />
50-<br />
ae40- o<br />
20<br />
10<br />
0<br />
70<br />
60<br />
50-<br />
* 40<br />
< 30<br />
20<br />
10<br />
0<br />
•—• 1 1<br />
(a)<br />
V'"''<br />
.••"" ^ " * ~ j ' "<br />
\ •<br />
\ ...:••" \l '""<br />
(c)<br />
1<br />
*<br />
s<br />
—'—' "^ r 7<br />
___--<br />
-*** — c<br />
....0<br />
-- Fe<br />
^S r^- £<br />
\i — N '<br />
\l VC KLL Auger line<br />
A<br />
• 1 ><br />
" :*• ***":<br />
Depth (nm)<br />
— c<br />
— o<br />
— Fe<br />
...... Cr<br />
Ni<br />
c<br />
—-0<br />
-- Fe<br />
/ — Cr<br />
1 Ni<br />
FIG. 1. Auger electron depth profiles of SS samples: (a) before glow discharge; (b) after 4 h of DC<br />
glow at 0.2 mbar; (c) after DC glow <strong>and</strong> 1/2 h RF assisted glow at 10~ 3 mbar.<br />
...<br />
12
<strong>IAEA</strong>-CN-50/A-VII-15 497<br />
800 (a) _<br />
-0.24 0.24<br />
FIG. 2. (a) Vertical profiles of electron temperature (X-ray spectroscopy) <strong>and</strong> ion temperature (O VII<br />
<strong>and</strong> C IV Doppler broadening), <strong>and</strong> (b) radial profile of electron density (6-channel 214 micrometer<br />
interferometer). Error bars indicate statistical error only.<br />
At present, the Tokamak de Varennes operates with ohmic heating only <strong>and</strong> single<br />
pulses. The plasma aperture is limited by four poloidal graphite limiters. The vacuum vessel<br />
is stainless steel. The major radius is 0.86 m, the maximum minor radius is 0.27 m (presently<br />
0.24 m), <strong>and</strong> the maximum toroidal field is 1,5 T (presently 1.42 T). The plasma current is<br />
normally 200 kA (q=3) but operation up to 280 kA (q=2.1) has been achieved. Normal line<br />
average densities are ?.2-X0 ;? m , <strong>and</strong> density rampup to 3.8-10 m' 3 has been possible.<br />
Hard X-ray production during a series of discharges conducted at low densities has<br />
led to measurable photonuclear activiatipn of the limiter supports (stainless steel). Gammaray<br />
spectroscopy of these components has shown the occurrence of the reactions<br />
52 Cr(gamma,n) 5 *Cr (threshold 12.04 MeV) <strong>and</strong> • 58 Ni(gamma,n) 57 Ni (threshold 12.2 MeV).<br />
These measurements indicate that runaway electrons in excess of 12 MeV can be produced<br />
<strong>and</strong> therefore indicate good single-particle confinement,
498 BOLTON et al.<br />
*<br />
3 -<br />
5 T<br />
3 -<br />
•<br />
la)<br />
(b)<br />
)<br />
0.5<br />
t (s)<br />
Profile<br />
» Peak<br />
J Average<br />
$ Calculated from Vi<br />
0.1 0.2<br />
r (ml<br />
FIG. 3. Xeg versus time (a) <strong>and</strong> minor radius (b), from visible bremsstrahlung; single point from<br />
resistivity.<br />
VACUUM VESSEL CONDITIONING<br />
Prior to discharge cleaning, the vacuum vessel wall has been outgassed by ultra-violet<br />
radiation from 4 mercury arc lamps (7 watts each). This outgassing method, novel for<br />
tokamaks, has been found to be effective in reducing the level of all monitored gases (mass<br />
2,16,18,28,44), resulting in the removal of about IS equivalent monolayers in 4 hours <strong>and</strong><br />
a pressure reduction by a factor of 5 to a final pressure of 8-10" 8 mbar.<br />
Discharge cleaning has been carried out in hydrogen both by DC glow at 0.2 mbar<br />
<strong>and</strong> RF-assisted glow at 10 mbar. Auger electron depth profiles are shown in Fig. 1 before<br />
<strong>and</strong> after the two types of glow discharge. It is concluded that the DC glow discharge leads<br />
to an erosion of the surface contamination (C <strong>and</strong> O) at the rate of 0.6 nm/h (Fig. lb) while<br />
the low-pressure RF-assisted glow discharge leads to efficient removal of the surface oxygen<br />
but also deposition of carbon (Fig. ic) probably originating from the graphite limiters. The<br />
form of the C KLL peak (insert) <strong>and</strong> the ratio Fe/C in the latter case indicate carbide<br />
u<br />
1.0<br />
-
<strong>IAEA</strong>-CN-50/A-VII-15 499<br />
formation. At intermediate pressures (hydrogen glow discharge at 2-10" 2 mbar for 22 hours),<br />
surface carbon <strong>and</strong> oxygen can be reduced to 30% while the surface metal concentration<br />
attains 60%.<br />
PLASMA CHARACTERISTICS<br />
Radial profiles of the electron <strong>and</strong> ion temperatures <strong>and</strong> the electron density are<br />
shown in Fig. 2 as deduced from a series of 200 kA plasma shots (error bars indicate<br />
statistical error only). The electron temperature profile measured by soft X-ray spectroscopy<br />
gives a central value of 850 eV (a slight overestimation due to possible runaway electrons<br />
is not excluded). Preliminary measurements by Thomson scattering (multipulse Nd-YAG<br />
system) give lower values. The ion temperature, measured by Doppler broadening of<br />
impurity lines (O VII near the center, CIV at the edge), is found to exceed 400 eV at<br />
r=0.11 m. The electron density is measured by a 6-channel 214 micrometer interferometer.<br />
The electron temperature profile is relatively flat near the center, while the electron density<br />
profile is near parabolic. Using these values, the global energy confinement time is found<br />
to be 9.3 ms, consistent with 8.6 ms obtained from neo-Alcator scaling for Ohmic plasmas .<br />
The Z-y profile is deduced from a multichannel measurement of the bremsstrahlung<br />
continuum in the visible (Fig. 3), <strong>and</strong> is found to be relatively flat with a central value of<br />
3.4. This value is in reasonable agreement with the value, 4.2, deduced from Spitzer<br />
resistivity (without neoclassical corrections) using the measured electron temperature profile.<br />
The e-folding length of the ion saturation current in the scrapeoff layer is 25 mm.<br />
Sawteeth are observed (Fig. 4) both in the soft X-ray emission (20% peak-to-peak<br />
measured by a diode array) <strong>and</strong> in the line-averaged density (1% p-p measured by the 214<br />
micrometer interferometer). The radius of inversion of the soft X-ray emission is found to<br />
be 0.086 m, in agreement with the radius of the q=l surface deduced from the electron<br />
temperature profile <strong>and</strong> the plasma current. Sawteeth are also observed in visible radiation<br />
from the edge of the plasma. The sawtooth period is found to scale linearly with density, in<br />
agreement with TFR scaling*.<br />
FIG. 4. Sawteeth in soft X-ray emission (central diode channel — 20% peak-to-peak) <strong>and</strong> central line<br />
density (214 micrometer interferometer — 1% peak-to-peak).<br />
0.51
500<br />
BOLTON et al.<br />
SMM<br />
1.0 (s)<br />
0.5 t(s) 0.7<br />
FIG. 5. Dynamic variation of radial position from magnetics (top) <strong>and</strong> centroid of electron density profile<br />
(bottom). Offset of curves arbitrary.<br />
PLASMA CONTROL<br />
Plasma position, density, <strong>and</strong> current control is carried out using a digital feedback<br />
system incorporating a programmable high speed controller with a cycle time of 0.4 ms .<br />
This system permits dynamic variation of the gains <strong>and</strong> transfer functions during rampup,<br />
plateau, <strong>and</strong> rampdown of the plasma current.<br />
The plasma position is dynamically controlled at the present time within 10 mm.<br />
Fig. 5 shows the plasma position as a function of time deduced from magnetic<br />
measurements <strong>and</strong> from the in-out asymmetry of the electron density distribution as<br />
measured by the six-channel interferometer. The latter signal is obtained from the<br />
difference of the inboard <strong>and</strong> outboard channels weighted by the path length <strong>and</strong><br />
normalized to the total number of electrons. The absolute position agrees within 5 mm. The<br />
dynamic agreement between these two measurements is remarkable.<br />
Low-q operation has been achieved on the Tokamak de Varennes, as shown in Fig. 6.<br />
The current <strong>and</strong> the density are simultaneously ramped up, with no observable macroscopic<br />
effect when q=3 (1=195 kA) is passed. A current plateau is maintained for 0.4 s at<br />
1=280 kA (q=2.1±.l) at a line average density of 2.5-10 m , followed by a disruptionfree<br />
rampdown of the current to zero. Further increase of the current to 290 kA, however,<br />
leads to a disruption, presumably because q=2 is reached.
300<br />
4X10' 3 -<br />
<strong>IAEA</strong>-CN-50/A-VII-15 501<br />
FIG. 6. Plasma current, voltage, radial <strong>and</strong> vertical position, <strong>and</strong> line density versus time at 280 kA<br />
(q =2.1).<br />
4X10<br />
250<br />
0.69<br />
0.79<br />
3.O5<br />
-0.05<br />
+0.05<br />
-0.05<br />
FIG. 7. Plasma current, voltage, radial <strong>and</strong> vertical position, <strong>and</strong> line density versus time at 200 kA<br />
during rampdown of plasma current at 4 MA-s' .
502 BOLTON et al.<br />
The Tokamak de Varennes is equipped to study forced rampdown of the plasma<br />
current* 5 , particularly once the fast position control system using coils internal to the vacuum<br />
vessel is installed. This is important for CIT, for example. At the present time, a combined<br />
preprogrammed <strong>and</strong> feedback-controlled vertical field has been used during the rampdown<br />
phase. The field is generated by coils external to the vacuum vessel (penetration time 5 ms).<br />
Fig. 7 shows forced plasma current rampdown at the rate of 4 MA/s (inverse loop voltage<br />
45 V). For the first two-thirds of the rampdown, the radial excursion is limited to 26 mm<br />
peak-to-peak. Although the last third of the rampdown is accompanied by both vertical <strong>and</strong><br />
radial motion, the current is ramped smoothly to zero without disruption.<br />
MATERIALS STUDIES AND PLASMA-WALL INTERACTION<br />
Initial investigations on exposure of thick (250 micrometers) refractive TiC coatings<br />
to the plasma have been carried out. This coating, applied by plasma spray at the Industrial<br />
Materials Research Institute, Boucherville, Quebec, withstood heat deposition by an electron<br />
beam at 30 MW/nr . To facilitate plasma spraying, only the singly curved surface<br />
terminating a cylindrical test limiter head was coated, unfortunately allowing direct heating<br />
by the plasma of the substrate, <strong>and</strong> consequent flaking of the coating edge. This heating of<br />
the substrate is confirmed by the observation by electron microscope of tension fractures in<br />
the remaining layer of the flaking zone. A ratio of Fe to Ti of less than 5% was found,<br />
indicating good adhesion of the coating to the substrate. An improved limiter head geometry<br />
will be used for future experiments.<br />
The analysis by Auger electron spectroscopy, calibrated with Rutherford<br />
backscattering, of long-term silicon samples exposed in the Tokamak de Varennes for the<br />
425 first discharges has revealed a deposit of "tokamakium" composed of: C: 5.5-10 ;9 ,<br />
O: 4.2-10 79 , metals: 73-10 79 , <strong>and</strong> H: 8.8-10 ip atoms/m 2 .<br />
Implanted hydrogen has been analysed by ExB filtered elastic recoil detection 70 as<br />
shown in Fig. 8. The width of the implanted profile corresponds to an incident hydrogen ion<br />
temperature of 380 to 465 eV, which agrees well with the measured central ion temperature<br />
of 400 eV. The implantation depth would also agree with a monoenergetic ion energy of<br />
450 eV, consistent with the 400 V applied during low-pressure glow discharge cleaning, so<br />
that neither Tokamak nor glow plasma can be ruled out as source of the implanted<br />
hydrogen.<br />
20<br />
Depth (nm)<br />
FIG. 8. Hydrogen depth profile from ExB filtered elastic recoil detection after exposure to the<br />
plasma (top curves) <strong>and</strong> masked (lower curve).
CONCLUSION<br />
<strong>IAEA</strong>-CN-50/A-VU-1S 503<br />
Well-controlled tokamak discharges with q values as low as 2.1 have been obtained<br />
in initial ohmic operation of the Tokamak de Varennes with graphite limiters. Disruptionfree<br />
current rampdown at 4 MA/s has been achieved. Measurements of the temperature <strong>and</strong><br />
density profiles, global confinement time, Ze» <strong>and</strong> sawtooth inversion radius agree with the<br />
expected values, as does the hydrogen implantation depth. UV outgassing has been found<br />
to be effective for wall conditioning, as has low pressure glow discharge cleaning.<br />
Expe'riments with refractive TiC coatings, while not yet successful, have nevertheless<br />
indicated adhesion of the coating. Future experiments on the Tokamak de Varennes will be<br />
carried out using a double-null divertor.<br />
ACKNOWLEDGEMENTS<br />
Successful construction <strong>and</strong> operation of the Tokamak de Varennes is in large<br />
measure due to the unstinting efforts of the technical staff, the engineering staff, the control,<br />
data acquisition, <strong>and</strong> programming staff, the theory <strong>and</strong> interpretation group <strong>and</strong> the staff<br />
of the Centre canadien de fusion magn6tique. We gratefully acknowledge their<br />
contributions. The Centre canadien de fusion magn6tique is funded by Atomic Energy of<br />
Canada Limited, Hydro-Que"bec, <strong>and</strong> Institut national de la recherche scientifique.<br />
REFERENCES<br />
[1] COUTURE, P., GEOFFRION, J., GREGORY, B.C., VAN ANDEL, H.W.H., BOLTON,<br />
R.A., in Engineering Problems of Fusion Research (Proc. 9th Symp. Chicago, 1981), Vol. 2<br />
(1981) 1701.<br />
[2] HARBEC, G., et al., in Proc. 12th SOFT, Julich (1982) 411.<br />
[3] GOLDSTON, R.J., Plasma Phys. Controll. Fusion 26 (1984) 87.<br />
[4] TFR GROUP, in Plasma Physics <strong>and</strong> Controlled <strong>Nuclear</strong> Fusion Research 1976 (Proc. 6th Int.<br />
Conf. Berchtesgaden, 1976), Vol. 1, <strong>IAEA</strong>, Vienna (1977) 279.<br />
[5] KALNAVARNS, J., et al., in Fusion Engineering (Proc. 12th Symp. Monterey, 1987) 1370.<br />
[6] PACHER, H.D., GREGORY, B.C., PACHER, G.W., Nucl. Fusion 26 (1986) 507.<br />
[7] STOTLER, D., BATEMAN, G., Simulation of a Compact Ignition Tokamak Discharge,<br />
Rep. PPPL-2415, Plasma Physics Laboratory, Princeton Univ., NJ (1987).<br />
[8] BRUNET, C, et al., J. Vac. Sci. Technol. A 3(6) (1985) 2503.<br />
[9] TERREAULT, B., et al., in Plasma-Surface Interactions in Controlled Fusion Devices (Proc.<br />
8th Int. Conf. Julich, 1988), to be published in J. Nucl. Mater.<br />
[10] ROSS, G.G., et al., J. Nucl. Mater. 128&129 (1984) 730.
CHARACTERISTICS OF BANANA REGIME<br />
CONDUCTIVITY IN JT-60<br />
<strong>IAEA</strong>-CN-50/A-VH-16<br />
M. KIKUCHI, T. HIRAYAMA, H. KUBO, M. AKIBA, T. ANDO,<br />
K. ANNOH, T. AOYAGI, K. ARAKAWA, M. AZUMI, T. FUJE,<br />
T. FUKUDA, A. FUNAHASHI, K. HAMAMATSU, M. HONDA,<br />
H. HORDXE, N. HOSOGANE, T. IUIMA, Y. JXEDA, T. IMAI,<br />
S. ISHIDA, K. ITAMI, T. ITO, Y. KAMADA, K. KAWASAKI,<br />
Y. KAWANO, H. KIMURA, T. KIMURA, H. KISHIMOTO, Y. KOIDE,<br />
T. KOIKE, I. KONDO, S. KONOSHIMA, S. KUNIEDA,<br />
K. KURIHARA, M. KURIYAMA, Y. KUSAMA, S. MAEHARA,<br />
K. MAENO, T. MATOBA, S. MATSUDA, M. MATSUKAWA,<br />
T. MATSUKAWA, M. MATSUOKA, Y. MATSUZAKI, N. MIYA,<br />
K. MIYACHI, M. MIZUNO, M. NAGAMI, A. NAGASHIMA,<br />
K. NAGASHIMA, T. NAGASHIMA, O. NAITO, H. NAKAMURA,<br />
M. NEMOTO, Y. NEYATANI, H. NINOMIYA, T. NISHITANI,<br />
K. ODAZIMA, N. OGIWARA, T. OHGA, M. OHTA, K. OMORI,<br />
S. OMORI, T. OZEKI, M. SAIGUSA, K. SAKAMOTO, A. SAKASAI,<br />
M. SATO, M. SEIMIYA, M. SEKI, S. SEKI, K. SHIMIZU,<br />
M. SHIMIZU, Y. SHIMOMURA, H. SHIRAI, H. SHIRAKATA,<br />
T. SUGIE, S. TAKAHASHI, H. TAKATSU, H. TAKEUCHI,<br />
S. TAMURA, Y. TANAKA, K. TANI, K. TOBITA, N. TOYOSHIMA,<br />
S. TSUJI, M. TSUNEOKA, K. UEHARA, K. USHIGUSA,<br />
I. YONEKAWA, H. YOSHIDA, R. YOSHINO<br />
Naka Fusion Research Establishment,<br />
Japan Atomic Energy Research Institute,<br />
Naka-machi, Naka-gun, Ibaraki-ken,<br />
Japan<br />
Abstract<br />
CHARACTERISTICS OF BANANA REGIME CONDUCTIVITY IN JT-60.<br />
The characteristics of the plasma conductivity are studied with respect to the bootstrap current.<br />
The measured resistive loop voltage is compared with the results of calculations using neoclassical<br />
resistivity with <strong>and</strong> without bootstrap current <strong>and</strong> Spitzer resistivity for a wide range of plasma current<br />
(Ip = 0.5-2 MA) <strong>and</strong> poloidal beta 0p = 0.1-2.0). The measured loop voltage seems to be lower<br />
than that calculated with neoclassical resistivity including the bootstrap current in a wide range of<br />
0P (0.1-2.0).<br />
505
506 KIKUCH1 et al.<br />
1. INTRODUCTION<br />
Non-inductive current drive is one of the most important issues in a tokamak<br />
system. Various active <strong>and</strong> passive current drive principles are proposed <strong>and</strong> confirmed<br />
experimentally. The recent observation of bootstrap current in TFTR [1] has<br />
created renewed interest in the neoclassical transport process parallel to the magnetic<br />
field. JT-60 can provide highly collisionless plasmas by both Ohmic heating <strong>and</strong> high<br />
power neutral beam heating up to 24 MW. Since JT-60 is the only large tokamak<br />
device providing nearly perpendicular NBI heating, the characteristics of the plasma<br />
resistivity <strong>and</strong>/or the driven current in the highly collisionless regime can be investigated<br />
without any ambiguity as to the beam driven current. Since the neoclassical<br />
bootstrap current increases with /Jp, the plasma resistivity is analysed for a wide<br />
range of /?p (0.1-2.0) using the Ohmic <strong>and</strong> high power beam heated discharges.<br />
High density <strong>and</strong> clean Ohmic discharges were produced in JT-60 outside the X-point<br />
divertor with a TiC coated Mo limiter. The effective ionic charge Zeff calculated<br />
with neoclassical resistivity in these Ohmic discharges is found to be less than 1.0<br />
in JT-60 [2J. To resolve this apparent contradiction, experiments are conducted to<br />
increase the poloidal beta value where the neoclassical bootstrap current shares a significant<br />
fraction of the plasma current. The discharge conditions are restricted to<br />
cases with the calculated inductive loop voltage less than 0.1 V since the time variation<br />
of the plasma internal inductance will increase the estimation error of the resistive<br />
loop voltage.<br />
2. RESISTIVITY AND DRIVEN CURRENT<br />
Ohm's law parallel to the magnetic field is expressed in the neoclassical theory<br />
by E = r)(Jn - Ji NC ), where Jf 0 is the bootstrap current driven by plasma diffusion.<br />
The resistive loop voltage is estimated from the measured loop voltage <strong>and</strong> the change<br />
of the plasma internal inductance by VR = Vs - "4 4 /i0 RIp, where Vs is the surface<br />
loop voltage which is slightly different from the loop voltage (typically less than<br />
20 mV) in the JT-60 measurement. The internal inductance £ is basically estimated<br />
from the diamagnetic measurement <strong>and</strong> the Shafranov A. The resistive loop voltage<br />
is also calculated by using the measured Te, rie (Thomson scattering <strong>and</strong> FIR interferometers)<br />
<strong>and</strong> the chord averaged Zeff (visible bremsstrahlung), where neoclassical<br />
[3] <strong>and</strong> Spitzer-type (without trapped electron correction) resistivities are used.<br />
The neoclassical bootstrap current is estimated by using the Hinton-Hazeltine<br />
formula [4], which, typically, yields a 30-160 kA driven current by plasma diffusion.<br />
If we use this calculated driven current to estimate the Ohmic current, the<br />
calculated resistive loop voltage decreases, especially in the high beta poloidal<br />
regime.<br />
Various discharge conditions <strong>and</strong> plasma equilibria are used for this study. The<br />
equilibrium flux shapes <strong>and</strong> typical time evolutions of the discharge parameters are
o sz.<br />
It<br />
11!<br />
<strong>IAEA</strong>-CN-50/A-VII-16 507<br />
•5TE<br />
I<br />
1<br />
5<br />
8.<br />
I-3<br />
3 o
508 KIKUCHI et al.<br />
1.0<br />
o.s<br />
1<br />
—<br />
- A<br />
-<br />
-<br />
1 1<br />
%<br />
><br />
1 |<br />
•<br />
i<br />
1<br />
•<br />
1 1 1 1<br />
A m •<br />
# •<br />
1 1 1 1<br />
1 1<br />
1 1<br />
1 1<br />
T<br />
1 1<br />
1 1 1 1<br />
80.5 MA "<br />
T0.7MA<br />
• 1.0 MA "<br />
A 1.5 MA ~<br />
• 2.0 MA "<br />
9 «<br />
T *<br />
1 I 1 I<br />
0.5 1.0 1.5 2.0<br />
FIG. 2. Variation of the resistive loop voltage VR as a junction of @p for Ohmic <strong>and</strong> NB heated<br />
plasmas. The discharge conditions are restricted such that the inductive voltage estimated by diamagnetic<br />
measurements <strong>and</strong> Shafranov shift is less than 0.1 V.<br />
VR(calculated)<br />
Vit(nieasured)<br />
FIG. 3. Comparison of measured resistive loop voltage <strong>and</strong> calculated resistive loop voltages using<br />
neoclassical resistivity (open circles), neoclassical resistivity including bootstrap current (+ symbols)<br />
<strong>and</strong> Spitzer-type resistivity (closed circles).<br />
shown in Fig. 1. Figure l(a) shows a typical example of an Ohmic discharge where<br />
the data are taken near the end of the flat-top to ensure current penetration. The minimum<br />
electron collisionality parameter v* = 0.5 in this case, <strong>and</strong> the calculated bootstrap<br />
current is only 40 kA. The estimated inductive loop voltage is only 3 mV, <strong>and</strong><br />
the resistive loop voltage VR = 0.91 V is lower than the calculated neoclassical<br />
resistive loop voltage (including the bootstrap current) VR (NCB) = 0.98 V.<br />
Figure l(b) shows a typical example of a long pulse, NB heated discharge in the low<br />
/3p regime. The minimum vf = 0.09 <strong>and</strong> the calculated bootstrap current is 114 kA.
<strong>IAEA</strong>-CN-50/A-VIM6 509<br />
The estimated inductive loop voltage is again negligible (£ = 0.1 <strong>and</strong> the calculated bootstrap current is 140 kA. The measured<br />
VR = 0.12 V is fairly lower than the calculated VR (NCB) = 0.26 V. The thermal<br />
j3p of this discharge is 1.0, <strong>and</strong> the beam component shares a significant fraction of<br />
the total plasma pressure. However, the beam driven current is less than 10 kA for<br />
this condition, which is effective in separating the physical process underlying the<br />
plasma current drive. The measured VR is plotted as a function of the j3p in Fig. 2.<br />
The resistive loop voltage VR decreases monotonically with increasing 0P but does<br />
not reach below zero. A comparison between measured <strong>and</strong> calculated resistive loop<br />
voltages for various discharges is shown in Fig. 3. The calculated resistive loop voltage<br />
using neoclassical resistivity (open circle) VR (NC) is higher than the measured<br />
resistive loop voltage. The neoclassical resistive loop voltage including the bootstrap<br />
current effect VR (NCB) is shown in the figure (+ symbol). The resistive loop voltage<br />
calculated with the Spitzer-type resistivity, VR (Sp), is also plotted (closed<br />
circle). The measured resistive loop voltage lies between the neoclassical calculation<br />
VR (NC) <strong>and</strong> the Spitzer-type calculation VR(Sp) for the relatively low /3P ( 1.5) regime. The fraction of the bootstrap<br />
component increases with /3p but is not enough to explain this difference. We note<br />
that the calculation from the Hirshman-Sigmar formulation [5] increases the bootstrap<br />
current by only about 30%. One of the possible explanations for this<br />
discrepancy is the effect of the beam component on the classical bootstrap current.<br />
In this high j3p regime, a significant fraction of the diamagnetic (3P± (typically,<br />
30-47%) comes from the beam component. The bootstrap current driven by this<br />
beam pressure is not included in this calculation.<br />
ACKNOWLEDGEMENTS<br />
The authors would like to thank the members of JAERI who have contributed<br />
to the JT-60 project throughout its progress <strong>and</strong> also to Drs S. Mori, K. Tomabechi<br />
<strong>and</strong> M. Yoshikawa for continued encouragement <strong>and</strong> support.
510 KIKUCHIetal.<br />
REFERENCES<br />
[1] ZARNSTORFF, M.C., et al., Phys. Rev. Lett. 60 (1988) 1306.<br />
[2] HIRAYAMA, T., et al., in Controlled Fusion <strong>and</strong> Plasma Heating (Proc. 15th Eur. Conf.<br />
Dubrovnik, 1988), Vol. 12B, Part m, European Physical Society (1988) 1065.<br />
[3] MRSHMAN, S.P., HAWRYLUK, R.J., BIRGE, B., Nucl. Fusion 17 (1977) 611.<br />
[4] HINTON, F.L., HAZELTINE, R.D., Rev. Mod. Phys. 48 (1976) 239.<br />
[5] HIRSHMAN, S.P., SIGMAR, D., Nucl. Fusion 21 (1981) 1079; TOKUDA, S.,<br />
personal communication, 1988.
PLASMA HEATING AND CURRENT DRIVE<br />
(Session E)<br />
Chairmen<br />
Session E-I M. YOSHIKAWA Japan<br />
Session E-II Yuanxi WAN China<br />
Session E-IH F. WAGNER Federal Republic of Gerpiany<br />
Session E-IV<br />
(Posters)
STUDY OF DENSITY LIMIT AND LOW q(aL)<br />
REGIMES WITH ECRH ON T-10<br />
<strong>IAEA</strong>-CN-50/E-I-l-l<br />
V.V. ALIKAEV, A.A. BAGDASAROV, Yu.V. BALABANOV,<br />
E.L. BEREZOVSKU, A.B. BERLIZOV, G.A. BOBROVSKIJ,<br />
A.A. BORSHCHEGOVSKU, N.L. VASIN, V.A. VERSHKOV,<br />
V.P. VLASOV, V.V. VOLKOV, Yu.A. GORELOV,<br />
A.V. GORSHKOV, S.A. GRASHIN, V.V. DREVAL, M.M. DREMIN,<br />
S.M. EGOROV, Yu.V. ESIPTCHUK, S.L. EFREMOV,<br />
V.A. ZHURAVLEV, V.S. ZAVERYAEV, N.V. IVANOV, V.I. IL'IN,<br />
A.M. KAKURIN, Yu.Yu. KARZHAVIN, Yu.N. KILPIO,<br />
A.Ya. KISLOV, P.E. KOVROV, V.V. KUZNETSOV, Yu.S. MAKSIMOV,<br />
A.A. MEDVEDEV, I.V. MIROSHNIKOV, A.L. NABATOV,<br />
S.V. NEUDACHIN, V.M. NOVIKOV, G.E. NOTKIN, A.B. PIMENOV,<br />
V.I. POZNYAK, LA. POPOV, S.V. POPOVICHEV, N.R. POTEMKIN,<br />
K.A. RAZUMOVA, I.G. RODICHKIN, I.N. ROJ, P.V. SAVRUKHIN,<br />
V.V. SANNIKOV, V.Yu. SERGEEV, M.M. SOKOLOV,<br />
A.M. SOLNTSEV, M.M. STEPANENKO, V.S. STRELKOV,<br />
A.V. SUSHKOV, A.V. TARAKANOV, K.N. TARASYAN,<br />
V.V. TIMONIN, K.B. TITISHOV, V.M. TRUKHIN, V.L. YGOLEV,<br />
A.N. FYAKHRETDINOV, A.V. CHANKIN, V.V. CHISTYAKOV,<br />
D.Yu. SHUGAEV, A.F. SHERBAK, G.S. YARAMISHEV,<br />
V.A. MARKELOV, B.V. SHISHKIN 1 , S.A. HOKIN 2<br />
I.V. Kurchatov Institute of Atomic Energy,<br />
Moscow, Union of Soviet Socialist Republics<br />
Abstract<br />
STUDY OF DENSITY LIMIT AND LOW qCaJ REGIMES WITH ECRH ON T-10.<br />
The studies of ECRH with a gyrotron set, with about 4 MW of total power, have been continued<br />
on T-10, in regimes with low q(aL) values of -2.5. It has been shown that the dependence of the<br />
energy confinement time on the power deposited in the plasma is the same as that for high qfej (~5).<br />
The RF power deposition profile prevents an increase in the amplitude of the sawtooth oscillations during<br />
the heating process. The radial profiles of the plasma parameters <strong>and</strong> the local energy balance with<br />
on-axis ECRH are studied in the presence of sawtooth oscillations <strong>and</strong> with their suppression due to<br />
changes in the ECRH power deposition profiles. The energy confinement in the plasma is shown to be<br />
weakly dependent on the plasma current for constant r^ under conditions of ECRH.<br />
1 Institute of Applied Physics, USSR Academy of <strong>Sciences</strong>, Moscow, USSR.<br />
2 MIT Plasma Fusion Center, Cambridge, MA, USA.<br />
513
514 ALIKAEVetal.<br />
1. INTRODUCTION<br />
The main problems to be solved in the recent experiment on T-10 in 1988 were:<br />
(a) The dependence of the energy confinement on the power deposited in the<br />
plasma;<br />
(b) The dependence of the energy confinement on the plasma current.<br />
A set of 11 gyrotrons, the same as was used in the work described in [1], with<br />
a total power of PRF « 3.5 MW, was used on T-10. The absorbed power was<br />
determined from the derivatives of a diamagnetic signal; the power profile, Pab (r),<br />
was found from the derivatives of the radiation intensities at the second ECR harmonic.<br />
The wavelengths of the gyrotrons were \{ = 3.7 mm <strong>and</strong> X2 = 4 mm, the<br />
same as in [1].<br />
2. DEPENDENCE OF ENERGY CONFINEMENT ON<br />
PLASMA PARAMETERS<br />
The results of research work on the time dependence of energy confinement on<br />
the plasma line averaged density, r^, <strong>and</strong> on the plasma current, Ip, with ECRH on<br />
T-10 were given in [1].<br />
The dependence W(n
<strong>IAEA</strong>-CN-50/E-I-l-l 515<br />
1 2 3 4 5<br />
ne(10 13 cm- 3 )<br />
FIG. 1. Increment of energy content versus ne for plasma currents Ip = 130 kA (+), 155 kA (x),<br />
210 kA (•), 400 kA (oh<br />
20 40 60<br />
E (keV)<br />
FIG. 2. X-ray spectrum measured with Si(Li), Ge <strong>and</strong> Nal detectors <strong>and</strong> designated by O, +, <strong>and</strong><br />
• , respectively.<br />
80
516 ALIKAEVetal.<br />
The profiles of ne (r) <strong>and</strong> Te (r) under Ohmic heating (I = 200 kA,<br />
BT = 2.8 T, n,, = 1.5 X 10 13 cm" 3 , aL = 32 cm) <strong>and</strong> under ECRH<br />
(Pab < 1.9 MW) are shown in Fig. 3.<br />
3. EFFECT OF THE PERIPHERAL ZONE ON PARTICLE CONFINEMENT:<br />
S AND B MODES<br />
According to the previously developed ideas of self-consistent profiles in tokamaks,<br />
the radial Te <strong>and</strong> rie distributions in the plasma zone external to the magnetic<br />
surface where q = 2-2.2, have a great effect on energy <strong>and</strong> particle confinement.<br />
The study of the impurity behaviour in the B <strong>and</strong> S modes has been continued.<br />
According to the previously developed ideas [2], a change in the radial Te (r) <strong>and</strong><br />
rie (r) distributions at the plasma column periphery results in a qualitative change in<br />
the nature of a discharge, i.e. an S — B mode transition takes place. The very fact<br />
of this transition is related to a change in the parameter rjei = 5 In Tei/S In n
/ /<br />
<strong>IAEA</strong>-CN-50/E-I-l-l 517<br />
/ /<br />
/ /<br />
/ /<br />
2 \ Ny<br />
N . \ t = 450 ms<br />
\ \<br />
\ \<br />
\ \<br />
\ \<br />
\ \<br />
1 \ \<br />
t = 400ms\ \<br />
\ \<br />
\ \<br />
\ \<br />
\ \<br />
\ \<br />
-40 -30 -20 -10 0 10 20 30 40<br />
R-Ro (cm)<br />
- 7<br />
r\ f/<br />
g \ECRH<br />
f -4 \<br />
I -3 ^<br />
1<br />
/ ,*'*''<br />
2 \<br />
OH \<br />
-30 -20 -10 10 20 I 30<br />
R-Ro (cm)<br />
FIG. 3. ne (r) <strong>and</strong> Tt (r) profiles for Ohmic stage (dashed line) <strong>and</strong> ECRH (solid line).
518 ALIKAEV et al.<br />
4<br />
~<br />
S<br />
" 3<br />
1<br />
b<br />
(J<br />
n 3<br />
o<br />
? 2<br />
i<br />
o ' 1<br />
<strong>IAEA</strong>-CN-50/E-M-1 519<br />
1<br />
0.2<br />
1 2<br />
3<br />
r"\<br />
y<br />
1<br />
i i<br />
/v<br />
i i<br />
(a)<br />
(c)<br />
i i<br />
0.4 0.6 0.8<br />
FIG. 5. (a) Electron density, (b) turbulence <strong>and</strong> (c) turbulence amplitude A as functions of time for one<br />
of the discharge regimes for variations in gas valve operation <strong>and</strong> in ECR zone positions: tt (valve<br />
switching off), t2 (off-axis ECRH), t3 (on-axis ECRH), t4 (valve switching on).<br />
Such changes in the levels of turbulence, substantially exceeding the perturbing<br />
effects on the plasma, are shown in Fig. 6. Small periodic changes in the gas puffing,<br />
due to feedback operation, with Anyn,. = 5-7% result in 30-40% oscillations in the<br />
level of turbulence within the plasma column interior (r < 20 cm). At the plasma<br />
column periphery, these oscillations in the level of turbulence have opposite phase<br />
<strong>and</strong> lower amplitude. The sign of the turbulence response to an external effect corresponds<br />
to a faster recovery of the violated profile.<br />
4.3. In most cases, the oscillation amplitudes are increased under ECRH (during 20<br />
to 30 ms after switching the microwave power on), <strong>and</strong> the maximum of the frequency<br />
spectrum is shifted towards higher frequencies. There is, however, no rigid<br />
correlation between the rise in the heating power <strong>and</strong> the level of turbulence. As a<br />
rule, with off-axis ECRH (AR > 15 cm), the turbulence is changed noticeably less<br />
than with on-axis heating, as is shown in Fig. 5 (instants of time t2 <strong>and</strong> t3). In the<br />
regimes with Ip = 400 kA (qL = 2.4), all other parameters being equal, the<br />
increase in the level of turbulence under ECRH is lower than that at<br />
Ip = 200 kA (Oj. = 4.5).<br />
t(s)
520 ALIKAEV et al.<br />
u<br />
n<br />
<<br />
3 -<br />
2<br />
r ,<br />
4<br />
3<br />
2<br />
1<br />
A(\(\(\/<br />
- y/Vl/vy<br />
- /<br />
i i<br />
\<br />
(a)<br />
(b)<br />
1<br />
0 0.2 0.4 0.6 0.8<br />
FIG. 6. (a) ne (£AJhe = 5-7%) <strong>and</strong> (b) turbulence level as functions of time under periodic gas<br />
puffing.<br />
=>. 2<br />
g 1<br />
ui<br />
— 1<br />
t(s)<br />
J 1 1 I I I I 1 I I I I<br />
-I 1 1 I I I i i ' I i i ' ' ' '<br />
_i i I i i , j I—TTT—r<br />
380 430 480<br />
t (ms)<br />
530 580<br />
FIG. 7. MHD perturbations as functions of time under ECRH.<br />
i
0.03 -<br />
0.02 -<br />
0.01 -<br />
<strong>IAEA</strong>-CN-50/E-I-l-l 521<br />
P(MW)<br />
FIG. 8. MHD amplitudes as junctions of time versus ECRH power.<br />
0.03 -<br />
_ 0.02 -<br />
0.01 -<br />
FIG. 9. MHD amplitudes versus discharge current under Ohmic heating (Q) <strong>and</strong> ECRH (*).<br />
4.4. Measurements of MHD perturbations in the poloidal magnetic field at the<br />
plasma column edge in the frequency range of 20 to 100 kHz were also carried out<br />
during the experiments. A rise in the amplitudes of the MHD perturbations, with a<br />
delay of a few milliseconds with respect to the time of switching the heating on<br />
(Fig. 7), was observed. The amplitudes increase with ECRH power (Fig. 8).<br />
The amplitudes of the MHD perturbations in a given frequency range rise with<br />
increasing discharge current in both Ohmic <strong>and</strong> ECRH regimes, but substantially<br />
more weakly in the latter case (Fig. 9).
522 ALIKAEV et al.<br />
FIG. 10. Diamagnetic signal, A(p, <strong>and</strong> density averaged over central chord ne as junctions of time<br />
under ECRH with additional gas puffing. The dashed line corresponds to the ne limit for the Ohmic<br />
regime <strong>and</strong> given chamber conditions.<br />
5. RISE OF PLASMA DENSITY LIMIT WITH ECRH<br />
A possibility of increasing the plasma density in comparison with the density<br />
limit in the Ohmic regime was studied in ECRH experiments with additional gas<br />
puffing.<br />
By using external gas puffing, an increase in n,. results in a cooling of the<br />
plasma column periphery. This cooling leads to current channel shrinkage <strong>and</strong>,<br />
finally, to a steep rise in the m = 2 activity with subsequent discharge disruption.<br />
Therefore, we could expect that ECRH power deposition into the electrons would<br />
allow us to increase the density limit. The experiments were carried out in the regime<br />
with low Ip = 200 kA (qL « 4.5).<br />
Since, as is well known, the density limit rises with increasing plasma current,<br />
we have to study the charge of n|im at ECRH for low Ip in order to avoid strong<br />
refraction or even cut-off of the cyclotron radiation (in our case, X = 3.7 <strong>and</strong> 4 mm).<br />
The experimental results with additional gas puffing during ECRH by seven<br />
gyrotrons (two of them (X = 3.7 mm) have the ECR zone at the centre of the chamber<br />
<strong>and</strong> five of them at R = 15 cm) are shown in Fig. 10. The dashed line shows<br />
the density limit in the initial Ohmic regime.<br />
We see that ECRH allows us to increase the plasma density at least twice in<br />
comparison with the limiting value in the Ohmic regime.<br />
There are some grounds to believe that the densities exceeding Greenwald's<br />
limit [4] by 10-15% <strong>and</strong> achieved in the ECRH experiments with additional gas<br />
puffing are not the limiting densities. The further increase in density was limited by<br />
such a strong microwave refraction at fig > x 10 13 cm" 3 that, first, the<br />
microwave power absorption zone was shifted towards the plasma periphery <strong>and</strong>,<br />
second, the fraction of microwave power absorbed within the plasma was<br />
680
CO<br />
u<br />
CO<br />
"o<br />
IC<br />
7 -<br />
6 —<br />
5 -<br />
4 -<br />
3<br />
1<br />
J m<br />
tc<br />
/<br />
/<br />
_ ^ kL<br />
560<br />
1 "* 1<br />
600<br />
<strong>IAEA</strong>-CN-50/E-M-1<br />
_/— N.<br />
K<br />
\<br />
ECR H<br />
1 1 1<br />
640<br />
t (msl<br />
1 J<br />
680<br />
MHD<br />
ft<br />
ID<br />
1<br />
I<br />
720<br />
11. A(p <strong>and</strong> ne as junctions of time when the valve is switched on later than in Fig. 10.<br />
substantially reduced. The plasma density at the plasma column centre, n,. (0),<br />
reached n,, (0) > 10 14 cm" 3 in these experiments <strong>and</strong> by far exceeded the critical<br />
density for microwaves.<br />
At the time, the absorption zone redistribution was accompanied by current density<br />
redistribution, j(r), <strong>and</strong>, as a result, m = 2 bursts limiting the further increase<br />
in the plasma density were observed by the end of a gyrotron pulse.<br />
Owing to the time delay between switching on the additional gas valve <strong>and</strong> the<br />
start of the microwave pulse the plasma energy content reduction started later <strong>and</strong> the<br />
j(r) redistribution was not that significant.<br />
This allowed higher n
524 ALIKAEV et al.<br />
3.2<br />
_<br />
^ 3.1<br />
CO<br />
3.0<br />
- f 4<br />
CO<br />
it? 2<br />
MHO<br />
^ ~ ^ 1 '<br />
if<br />
i i<br />
t (ms)<br />
520 580 640<br />
ne(10 13 cm" 3 )/<br />
40 20 0 20 40<br />
AR (cm)<br />
6 \<br />
AX 1 \ 640 ms<br />
FIG. 12. Rise of ne limit with variations in ECR zone positions by changes in the longitudinal<br />
magnetic field.<br />
6. SUMMARY<br />
(1) The independence of additionally stored plasma energy from Ip has been confirmed:<br />
W oc n,. 1% (Y « 0).<br />
(2) It has been shown that ECRH allows the plasma density to be increased at least<br />
twice in comparison with the density limit for the Ohmic regime for the given<br />
chamber conditions. The Greenwald density limit [4] is exceeded by 10 to 15%<br />
in this case. A further density rise in our experiment is limited, probably<br />
because of refraction <strong>and</strong> poorer absorption of the microwave power.
<strong>IAEA</strong>-CN-50/E-I-l-l<br />
REFERENCES<br />
52 5<br />
[1] ALIKAEV, V.V., et al., Plasma Phys. Controll. Fusion 30 (1987) 381.<br />
[2] T-10 GROUP, in Controlled Fusion <strong>and</strong> Plasma Physics (Proc. 12th Eur. Conf. Budapest, 1985),<br />
Vol. 9F, Part I, European Physical Society (1985) 42.<br />
[3] VERSHKOV, V.A., ZHURAVLEV, V.A., Zh. Tekh. Fiz. 41 (1986) 858.<br />
[4] GREENWALD, M., TERRY, F., WOLFE, S., Rep. PFC/JA-86-22, Plasma Fusion Center,<br />
MIT, Cambridge, MA (1988).
<strong>IAEA</strong>-CN-50/E-I-2<br />
ELECTRON CYCLOTRON HEATING EXPERIMENTS<br />
IN THE DIII-D TOKAMAK<br />
R. PRATER, N.H. BROOKS, K.H. BURRELL, T.N. CARLSTROM,<br />
M.S. CHANCE 1 , M.S. CHU, D. CONTENT 2 , J.C. DeBOO,<br />
T. EDLINGTON 3 , J. FERRON, R. FREEMAN, P. GOHIL,<br />
R.J. GROEBNER, R.W. HARVEY, D.N. HILL 4 , C.L. HSIEH,<br />
R.A. JAMES 4 , S. JANZ 5 , A.G. KELLMAN, L.L. LAO, J.M. LOHR,<br />
T.C. LUCE, J.L. LUXON, M.A. MAHDAVI, K. MATSUDA,<br />
C.P. MOELLER, T. OKAZAKI 6 , T.H. OSBORNE, T. OZEKI 7 ,<br />
M. PERRY 2 , K. SAKAMOTO 7 , T.C. SIMONEN, R.T. SNIDER,<br />
B.W. STALLARD 4 , R.D. STAMBAUGH, R.E. STOCKDALE,<br />
E.J. STRAIT, T. TAYLOR, R. WOOD 4<br />
General Atomics,<br />
San Diego, California,<br />
United States of America<br />
Abstract<br />
ELECTRON CYCLOTRON HEATING EXPERIMENTS IN THE DIU-D TOKAMAK.<br />
Electron cyclotron heating (ECH) experiments in the DIII-D tokamak have been performed at<br />
power levels around 1 MW using outside launch of both the extraordinary <strong>and</strong> the ordinary mode, <strong>and</strong><br />
inside launch of the extraordinary mode. Effective plasma heating has been obtained, with central electron<br />
temperatures above 5 keV. In addition to simple bulk heating, the localized nature of ECH has been<br />
used to obtain the H-mode, to suppress internal disruptions (sawteeth), <strong>and</strong> to suppress MHD activity<br />
at the plasma edge. Suppression of edge localized modes results in a clear improvement of the confinement<br />
properties of the H-mode, with the improvement manifested in both density <strong>and</strong> electron<br />
temperature.<br />
1<br />
Permanent address: Plasma Physics Laboratory, Princeton University, Princeton, NJ, USA.<br />
2<br />
Permanent address: Johns Hopkins University, Baltimore, MD, USA.<br />
3<br />
Permanent address: Culham Laboratory, UKAEA, Abingdon, Oxfordshire, United Kingdom.<br />
4<br />
Permanent address: Lawrence Livermore National Laboratory, Livermore, CA, USA.<br />
5<br />
Permanent address: University of Maryl<strong>and</strong>, College Park, MD, USA.<br />
6<br />
Permanent address: Hitachi Ltd, Japan.<br />
7<br />
Permanent address: Japan Atomic Energy Research Institute, Japan.<br />
527
528 PRATER et al.<br />
1. INTRODUCTION<br />
Electron cyclotron heating (ECH) in tokamaks is an effective means<br />
of heating plasma to high temperature, <strong>and</strong> this has been demonstrated in<br />
a number of devices [1,2]. On the basis of this work <strong>and</strong> of the apparent<br />
advantages of ECH to the design <strong>and</strong> engineering of a tokamak reactor,<br />
ECH has been assigned a role in heating plasma in CIT'to ignition. The<br />
principal modes of heating have been studied in experiments on DIII-D,<br />
including outside launch of the ordinary mode (O-mode) at the fundamental<br />
frequency (the mode chosen for CIT) <strong>and</strong> the extraordinary mode<br />
(X-mode) at the fundamental <strong>and</strong> second harmonic, <strong>and</strong> inside launch<br />
of the fundamental X-mode. Central electron temperatures above 5 keV<br />
have been achieved.<br />
In addition to bulk heating, ECH has potential applications affecting<br />
confinement <strong>and</strong> stability. In DIII-D experiments, central application<br />
of ECH has been shown to generate the H—mode of improved confinement<br />
[3,4]; heating near the q = 1 surface has suppressed sawteeth [5];<br />
<strong>and</strong> applying ECH with the resonance near the edge has stabilized the<br />
edge localized modes (ELMs), leading to improved energy confinement<br />
for plasmas in which the H-mode was generated by neutral injection.<br />
These ECH experiments at 60 GHz have used two antenna systems.<br />
For the outside launch, a system of eight antennas is located on the outer<br />
wall near the plasma midplane. The horns radiate with a Gaussian pattern<br />
with an 11° e-folding half width. Each horn radiates typically 150 kW in<br />
the desired polarization <strong>and</strong> 25 kW in the cross polarization. For inside<br />
launch, ten antennas have been placed on the inboard wall of the vacuum<br />
vessel near the plasma midplane. These antennas are mirrors which are<br />
located behind the graphite armor that covers the wall, <strong>and</strong> the power<br />
is radiated through holes in the graphite. The radiation pattern is a<br />
Gaussian 12° in width, with the center of the pattern oriented 15° from<br />
radial in the same toroidal direction as the plasma current.<br />
In the experiments described here, the DIII-D tokamak was run<br />
in the divertor configuration, with major radius 1.68 m, minor radius<br />
0.62 m, <strong>and</strong> elongation 1.7 (volume 21 m 3 ). In most cases, the working<br />
gas was deuterium. Plasma energy W was determined from a full MHD<br />
equilibrium analysis using magnetic measurements as input, or from measurements<br />
of plasma diamagnetism. Uncertainty is typically 0.05 in /?„. A<br />
multichannel Thomson scattering system is available for which the laser<br />
beam travels vertically at a major radius of 1.94 m; for this system, the<br />
data point closest to the center of the plasma lies near rfa « 0.3. A CO2<br />
interferometer is used to determine line-averaged density along a vertical<br />
chord at the same major radius. Electron cyclotron emission power at<br />
the second harmonic is measured by an absolutely calibrated ten channel<br />
polychrometer for determination of the electron temperature profile.<br />
CIT: Compact Ignition Tokamak.
<strong>IAEA</strong>-CN-50/E-I-2 529<br />
2. ELECTRON CYCLOTRON HEATING<br />
The results of experiments on rf heating are best described by placing<br />
them in the context of the theory of wave propagation <strong>and</strong> absorption. In<br />
the electron cyclotron frequency range, wave propagation is limited by<br />
cutoffs or resonances which place upper limits on the density. For the<br />
ordinary mode, the propagation limit is simply the condition wp < u>,<br />
where w is the applied frequency <strong>and</strong> u>p is the plasma frequency. For<br />
the extraordinary mode at the fundamental frequency, the propagation is<br />
limited by the left-h<strong>and</strong> cutoff to the condition Wp < u>(o; + fle)(l — njj)<br />
when the power is launched from the high field side, but to nearly zero<br />
density by the right-h<strong>and</strong> cutoff when the power is launched from the<br />
low field side. Here, fie is the electron cyclotron frequency <strong>and</strong> n\\ is the<br />
parallel index of refraction. At the second harmonic, the launch can be<br />
either high or low field side, <strong>and</strong> the density is limited by the right-h<strong>and</strong><br />
cutoff to the limit wp < u>(w — ne)(l — n 2 ).<br />
Wave absorption has been summarized by Bornatici [6]. Ordinary<br />
mode (O-mode) absorption is proportional to the density ne for quasiperpendicular<br />
propagation, <strong>and</strong> second harmonic O-mode damping is<br />
weaker than at the fundamental by the small factor Te/mec 2 . Extraordinary<br />
mode (X-mode) absorption at the fundamental is proportional<br />
to n?,/ne. In order to calculate the expected wave absorption in an experimental<br />
situation, a ray tracing code like TORAY [7] can be used to<br />
integrate the absorption along a ray started at the edge of the plasma,<br />
using measured profiles of electron temperature <strong>and</strong> density <strong>and</strong> a measured<br />
magnetic equilibrium. Figure l(a) shows the calculated absorption<br />
for the DIII-D experiments, using 30 rays per antenna to simulate<br />
the radiation pattern. The curves are calculated for a model density<br />
profile ne(r) = n.o[l — (r/a) 2 ] 0-e <strong>and</strong> an electron temperature profile<br />
Te(r) = Teo[l - {r/a) 2 } 1 - 5 typical of DIII-D experiments.<br />
Comparison of experimental heating efficiency with theory is complicated<br />
by the effect of the heating on global confinement, since it is<br />
difficult to discern between a reduction in absorption <strong>and</strong> a deterioration<br />
in confinement due to the auxiliary power. An additional factor is<br />
that in divertor discharges in DIII-D, density is constrained to a narrow<br />
range, the limits of which scale in proportion to plasma current. Therefore,<br />
a scan in density over a wide range requires operation at different<br />
currents, which by the Kaye-Goldston L—mode scaling [8] changes the confinement<br />
time. Nevertheless, when the efficiency 77 of the heating process<br />
neATe(0)V r //fecH is plotted, as in Fig. l(b), the nature of the dependence<br />
on density can be seen <strong>and</strong> compared qualitatively with Fig. l(a). Here,<br />
V is the plasma volume <strong>and</strong> PECK is the total ECH power incident on the<br />
plasma.<br />
As expected, the measurements shown in Fig. l(b) indicate that the<br />
central heating extends to highest density, above 4 x 10 1B m~ 3 , by use of<br />
the inside launch of the X-mode. For outside launch of the O-mode, the<br />
peak in central heating is at slightly lower density than expected, about
530 PRATER et al.<br />
0.8<br />
0.6<br />
0.4<br />
0.2<br />
nn<br />
(a)<br />
100<br />
80-<br />
60-<br />
20-<br />
150<br />
•Z 100-<br />
a.<br />
2 50-<br />
1y*2ND<br />
><br />
\\ ^<br />
\ \ •<br />
ne
4.0<br />
3.0<br />
2.0<br />
1.0<br />
0.0<br />
6.0<br />
4.0-<br />
2.0-<br />
0.0-<br />
(a)<br />
°°oa<br />
<strong>IAEA</strong>-CN-50/E-I-2 531<br />
ECH<br />
\ \<br />
2 3<br />
Se(10 19 m- 3 )<br />
9\ ELECTRON CYCLOTRO<br />
«/ EMISSION<br />
• THOMSON SCATTERING<br />
OH ECH<br />
0.52 MA O •<br />
0.72 MA O •<br />
1.10MA o »<br />
(b)<br />
1.5 1.6 1.7 1.8 1.9 2.0 2.1 2.2 2.3 2.4<br />
R(m)<br />
FIG. 2. (a) Central electron temperature from ECE as a Junction of ne, for central heating<br />
(B, = 2.14 T) with the 0-mode. ECH power was 0.9 to 1.1 MW, <strong>and</strong> Ip was varied from 0.52 to<br />
1.1 MA; (b) electron temperature profile from ECE <strong>and</strong> Thomson scattering for the 1.2 X 10 19 m' 3<br />
case of Fig. 2(a).
532 PRATER et al.<br />
1.5 x 10 19 m~ 3 , but the heating extends slightly above the expected cutoff.<br />
For X—mode heating at the second harmonic [9], the falloff with density<br />
is about as predicted by theory in Fig. l(a). The curve is a scaling of the<br />
second harmonic data according to the experimentally determined scaling<br />
of confinement with Bt found for ohmic <strong>and</strong> ECH discharges, re ex B{? 75 .<br />
Although the central heating, ATe(0), shows the effect of the propagation<br />
limits, in most cases the net change in plasma energy, AW, does<br />
not, <strong>and</strong> large increases in W are found even at the highest densities. This<br />
behavior is shown in Fig. l(c). This has been a common feature of ECH<br />
experiments in tokamaks for which a magnetic determination of W was<br />
available, <strong>and</strong> it may be due to multiple passes of the rays through the<br />
plasma following reflection at the vessel walls. (See [1] for a discussion.)<br />
This should result in decreased central heating, without much decrease in<br />
AW if the global confinement is not strongly dependent on the heating<br />
profile. In the case of inside launch X-mode, mode conversion to <strong>and</strong> subsequent<br />
damping of electron Bernstein waves at the upper hybrid layer<br />
may account for the behavior at high density.<br />
For the ECH discharges, Te(0) is larger at low densities, reflecting<br />
the very weak dependence of confinement time on density in the L-mode.<br />
Figure 2(a) shows this behavior for fundamental heating with the 0mode.<br />
Central temperatures above 5 keV are observed at low density,<br />
1 x 10 19 m" 3 .<br />
Even in the high temperature <strong>and</strong> low density discharges there is<br />
no experimental evidence of a non-thermal component of the electron<br />
distribution. There is good agreement between ECE measurements <strong>and</strong><br />
Thomson scattering measurements, as shown in the profiles of Fig. 2(b)<br />
for a discharge with central temperature of 4 keV at the time of the Thomson<br />
scattering, although the Thomson measurements cannot be made at<br />
the center of the plasma where the temperature is highest. The ECE<br />
temperatures of Fig. 2 (a) show no evidence of transition to a runaway<br />
regime.<br />
These results are in accord with modeling of the electron distribution<br />
function. The Fokker-Planck equation balancing quasilinear diffusion<br />
induced by ECH, acceleration by the ohmic electric field, <strong>and</strong> collisional<br />
slowing of the electrons on the background Maxwellian is solved for the<br />
2D momentum distribution at each radius of a radial array of plasma<br />
flux surfaces [10]. Quasilinear damping of the incoming EC waves is selfconsistently<br />
calculated. The non-thermal component calculated in this<br />
way constitutes approximately 4% of the plasma energy. This component<br />
lies in the energy range of 20 to 150 keV, amounting to approximately 7%<br />
of the particles in the region of interaction between the axis <strong>and</strong> 0.2a. Calculations<br />
of the ECE spectra from these distributions [11] for frequencies<br />
in the vicinity of the second harmonic showed that away from the region<br />
of third harmonic overlap the non-thermal electrons contribute less than<br />
10% to the relativistically down shifted signal.
<strong>IAEA</strong>-CN-50/E-I-2<br />
3. CONFINEMENT WITH ECH<br />
Confinement in the L—mode discharges using O—mode heating tends<br />
to be better than the Kaye-Goldston scaling [8]. Although re does decrease<br />
from ohmic levels during ECH, re remains about a factor of 2<br />
above L-mode scaling. This is similar to results from outside launch of<br />
the fundamental X-mode [9], in which case the heating is believed to be<br />
due to 0-mode heating also [12]. Here, re = W/(Pa + JF^CH), where<br />
•ffecH is the total ECH power incident on the plasma. Measurements of<br />
the absorbed power from dW/dt at the start of the heating are typically<br />
65% to 75% of the incident power; however, the power balance of input<br />
power with radiated power <strong>and</strong> power flow to the divertor usually shows<br />
good accounting of all the incident power [9].<br />
The deterioration of confinement from ohmic levels to L-mode levels<br />
appears to be prompt in most cases. Magnetic fluctuations measured in<br />
the divertor region grow during the first 5 to 10 msec following application<br />
of ECH, <strong>and</strong> it is on this time scale that confinement decreases [4]. In<br />
the H-mode, these magnetic fluctuations decrease in amplitude to ohmic<br />
levels. A good correlation between confinement <strong>and</strong> the inverse of the<br />
magnitude of the fluctuations has been found to hold for ohmic, L—mode,<br />
<strong>and</strong> H-mode discharges with either ECH or neutral injection heating [4].<br />
Second harmonic heating at 1.07 T was found to be effective at<br />
generating a transition to H-mode at power levels above 0.75 MW [3,4].<br />
200<br />
i 100<br />
OHMIC<br />
KAYE-GOLDSTON<br />
PTot(MW)<br />
FIG. 3. Energy confinement time as a junction of total input power for central heating using the second<br />
harmonic X-mode. Plasma current is 0.48 MA <strong>and</strong> toroidal field is 1.07 T. This figure includes H-mode<br />
data for which the density was rising during the H-mode phase, so that a dW/dt correction is needed<br />
to account for the changing ECH power absorption.<br />
533
534 PRATER et al.<br />
10 1<br />
0.75<br />
0.25 0.75<br />
FIG. 4. Calculation of the electron <strong>and</strong> ion thermal diffusivities as a Junction of p, the normalized<br />
minor radius, for (a) L-mode <strong>and</strong> (b) H-mode. I = 0.5 MA, BT = 2.1 T, PFrH = 0 9 MW<br />
n. = 1.2 x 10' 9 m' 3 in (a) <strong>and</strong> 2 X 10 19 m' 3 in (b).<br />
This was the first demonstration of the H-mode using solely ECH, which<br />
does not generate an ion tail as the previous heating methods attaining<br />
the H-mode (neutral injection <strong>and</strong> ICRF) do. The H-mode so generated<br />
demonstrated the characteristics of the H-mode generated by neutral injection<br />
in DIII-D: an increase in plasma energy, signifying an improvement<br />
in re; an increase in n^ <strong>and</strong> a decrease in the Da emission, signifying an<br />
improvement in particle confinement time rp; <strong>and</strong> a broadening of the<br />
pressure profile <strong>and</strong> development of a very steep density gradient at the
2.0<br />
. P« (MW)<br />
\PNBI<br />
800 1000 1200 1400 1600 1800<br />
TIME (msec)<br />
<strong>IAEA</strong>-CN-50/E-I-2<br />
61393 61393<br />
535<br />
800 1000 1200 1400 1600 1800<br />
TIME (msec)<br />
FIG. 5. Traces for a discharge (61393) with 1.25 MW of neutral deuterium injection <strong>and</strong> 0.9 MW of<br />
ECH. Plasma current is 0.6 MA <strong>and</strong> toroidal field is 2.1 T. W is determined from MHD analysis, Da<br />
emission is measured in the divertor region, <strong>and</strong> Te(0) is determined from ECE.<br />
plasma edge. The improvement in re, from values near the Kaye-Goldston<br />
level to the ohmic value, is shown in Fig. 3. The correction to re due to<br />
dWfdt is necessary because after the transition to H-mode the density begins<br />
rising <strong>and</strong> continues to rise until the ECH cutoff density is exceeded,<br />
at which time a reverse transition to L-mode takes place. For this reason,<br />
no steady state in fie or W was obtained during the H-mode. Using outside<br />
launch 0-mode fundamental heating at 2.1 T, the H-mode regime of<br />
improved confinement was not attained at the ECH power levels available<br />
(1.1 MW).<br />
Transport analysis of the H-mode discharges generated by second<br />
harmonic ECH shows a decrease in electron thermal diffusivity Xc by a<br />
factor of 2 to 4 compared to that during the L-mode [9]. The ECH data<br />
has been analyzed with the l|D transport code ONETWO [13], with<br />
the power deposition calculated by TORAY. Electron temperature <strong>and</strong><br />
density profiles are found from Thomson scattering <strong>and</strong> ion temperature<br />
profiles are obtained from charge exchange recombination emission. The<br />
values of Xe <strong>and</strong> %i are determined for the region 0.25 < r/a < 0.75, <strong>and</strong><br />
the largest decrease in Xe occurs for r/a < 0.5. The xi * s found to be<br />
roughly a factor 6 larger than neoclassical, <strong>and</strong> it is not much affected by<br />
the H-mode transition. This behavior is shown in Fig. 4. These results<br />
show that the increase m energy following the H-mode transition is due<br />
to an improvement in electron thermal diffusivity as well as in particle<br />
confinement.<br />
In order to determine the scaling of the power threshold for H-mode<br />
with Bt, experiments were performed with combined neutral injection<br />
<strong>and</strong> ECH using the fundamental 0-mode. Figure 5 shows data from a<br />
discharge which entered the H-mode promptly when 1.0 MW of ECH was
536 PRATER et al.<br />
added to 1.25 MW of neutral injection. With ECH alone no transition was<br />
obtained <strong>and</strong> with neutral injection alone (D° —* D + ) the power threshold<br />
was about 1.3 MW. These results, taken with the second harmonic heating<br />
threshold of 0.75 MW, support a scaling of Pthreshold °c Bt. This scaling<br />
appears to hold in DIII-D for neutral injection experiments as well.<br />
4. STABILIZATION OF MHD ACTIVITY<br />
MHD activity is known to reduce confinement or lead to disruptions<br />
in tokamak plasmas. The effect of the internal disruption associated with<br />
the sawtooth crash is to limit the attainable central electron temperature<br />
<strong>and</strong> to increase the energy <strong>and</strong> particle transport in the central region of<br />
the plasma. Activity with m = 2 is believed to lead to disruptions, <strong>and</strong><br />
in H-mode discharges the edge localized modes (ELMs) reduce confinement<br />
<strong>and</strong> decrease the quality of the H-mode. Because of its localized<br />
absorption, ECH can be used to affect these phenomena with relatively<br />
little power [1].<br />
In order to investigate the effect of the heating location on sawteeth<br />
in DIII-D, a detailed scan of toroidal field was performed using the second<br />
harmonic X-mode launched from the outside, with 0.85 MW of ECH<br />
power. A summary of the results is displayed in Fig. 6. A maximum<br />
was found in both the sawtooth period <strong>and</strong> amplitude when the ECH<br />
resonance was placed near the sawtooth inversion surface, with the effect<br />
sensitive to the resonance placement near that location. In this case, the<br />
resonance surface was on the outboard side of the plasma center. A shift<br />
of 3 cm in resonance location changed the sawtooth period by a factor<br />
of three from 25 to 80 msec. In general the sawtooth period was still<br />
evolving to longer periods when the 500 msec ECH pulse ended. The<br />
length of the time scale for the sawtooth period to come to equilibrium<br />
suggests that it is a result of a slow transport process such as a plasma<br />
current redistribution <strong>and</strong> not an energy redistribution. We speculate<br />
that the sawtooth period extension is due to an effect on the sawtooth<br />
trigger mechanism. Support for this idea is found in the sharp peak in<br />
the effect with the heating at the sawtooth inversion radius, where, for<br />
example, the m = 1, n = 1 instability is thought to originate. Depending<br />
on the form of the instability, changes in the local parameters or gradients<br />
(current or pressure) can change the growth rates of the modes or saturate<br />
them [14,15].<br />
A second set of sawtooth modification experiments were performed<br />
with higher power (1.1 MW) using the 0-mode outside launch system at<br />
the fundamental frequency. In this case the sawtooth period was greater<br />
than the 400 msec length of the if pulse when the ECH resonance was<br />
placed near the sawtooth inversion surface <strong>and</strong> the line-averaged density<br />
was below 1.2 x 10 19 m~ 3 . The sawtooth period was essentially unchanged<br />
from the ohmic value when the heating was shifted 4 cm from<br />
the sawtooth inversion toward either the center or the edge of the plasma.<br />
The resistivity profiles calculated from the diagnostic measurements (visible<br />
bremsstrahlung for Zeff, density <strong>and</strong> temperature profiles) became
S<br />
Q<br />
o<br />
ERH<br />
a.<br />
HI<br />
Q<br />
-<br />
AMPL<br />
80-<br />
60-<br />
40-<br />
20-<br />
0.4-<br />
0.3-<br />
0.2-<br />
0.1-<br />
0-<br />
1.10<br />
(r/a = 0.<br />
<strong>IAEA</strong>-CN-50/E-I-2 537<br />
a -400 ms ECH<br />
O -500 ms ECH PULSE *<br />
Filled points<br />
still evolving<br />
n<br />
s I<br />
D<br />
a<br />
PULSE #<br />
1 •<br />
SAWTOOTH INVERSION "<br />
a<br />
_ ^OHMIC<br />
•9<br />
1.15<br />
a<br />
BIT)<br />
t<br />
a<br />
a<br />
1.20 1.25<br />
(r/a = 0.43}<br />
FIG. 6. Scan of resonance location for discharges with 0.5 MA of plasma current, ne of 1.5 x 10'<br />
m~ 3 , <strong>and</strong> incident ECH power of 0.85 MW at the second harmonic.<br />
monotonically broader as the heating was moved off axis. This implies<br />
that the sawtooth suppression was not due to q(0) > 1, since heating just<br />
outside the q '= 1 surface does not suppress sawteeth while heating just<br />
inside does. In both the second harmonic <strong>and</strong> fundamental experiments,<br />
the key to sawtooth stabilization was heating at the q — 1 surface.<br />
Suppression of ELMs by application of ECH has also been demonstrated<br />
in Dili—D. In the first experiments [16], the second harmonic resonance<br />
was placed near the outboard edge of the plasma by reducing the<br />
toroidal field to 1.4 T. Waves were launched in the X-mode polarization<br />
from the outside antennas into a divertor plasma with 2.8 to 4.3 MW of<br />
neutral injection. Without ECH these plasmas were in the H-mode, but<br />
the ELMs were present during the entire H-mode period. When ECH was<br />
applied, the ELMs disappeared, <strong>and</strong> re increased by over 50%. The rate<br />
of rise of the density also increased when the ELMs disappeared, <strong>and</strong> after<br />
about 200 msec the density even at the plasma edge was above the cutoff<br />
density. After this time, the suppression of ELMs ended, <strong>and</strong> confinement<br />
time dropped.<br />
The process behind the suppression of the ELMs remains unclear.<br />
Thomson scattering measurements show little increase in the edge temperature<br />
when ECH is added, but SXR emission from the edge increases<br />
faster than expected from increases in the density of electrons or impurities<br />
at the edge. Comparison of measurements of the shear <strong>and</strong> pressure gradient<br />
at the edge during the ELM-free periods with the stability criterion
538 PRATER et al.<br />
2.0<br />
1.5<br />
1.0<br />
0.5<br />
/<br />
L-MODE<br />
0.0<br />
i<br />
900 msec<br />
OHMIC<br />
. i ..<br />
130 150 170 190<br />
R (m)<br />
1500 msec<br />
H-MODE<br />
s^~ ELM-FREE<br />
k 1320 msec<br />
^K^. H-MODE<br />
FIG. 7. Electron temperature profiles from ECE for the discharge of Fig. 5.<br />
for the ballooning mode fails to show that the plasma has approached the<br />
second stability region, although the edge pressure gradient is clearly<br />
higher when the ELMs are suppressed [16].<br />
More recent discharges using outside launch 0-mode have shown<br />
similar effects. For the discharge of Fig. 5, 1.25 MW of neutral injection<br />
power failed to attain the H-mode, but when 0.9 MW of ECH was added<br />
the transition started promptly. Following the transition to H-mode, the<br />
density began rising, although large frequent ELMs were present. After<br />
100 msec the ELMs disappear, for a period of 200 msec. Discharges<br />
without the ECH do not show this ELM-free behavior. What may be happening<br />
is that as the density rises during the early H-mode, the plasma<br />
enters the density regime for which the first pass absorption is rapidly<br />
dropping [Fig. l(a) <strong>and</strong> (b)]. The power balance measurements imply<br />
that the ECH power which is not absorbed at the first pass is apparently<br />
deposited in the plasma nearer the edge. This edge absorption may be<br />
similar to that of the earlier experiment in which the resonance was placed<br />
near the plasma edge. The end of the ELM-free period may be due to a<br />
gradual increase of the edge pressure gradient into the ballooning unstable<br />
region, or due to increasingly poor absorption of the ECH even at the<br />
plasma edge because of the increasing density.<br />
Energy confinement improves dramatically during the ELM-free period.<br />
Figure 5 shows that there is little improvement in re after the<br />
H—mode transition, presumably because of the giant ELMs. When the<br />
ELMs disappear confinement improves dramatically, becoming comparable<br />
to ohmic confinement, but with 5 times the plasma energy.<br />
210<br />
230
<strong>IAEA</strong>-CN-50/E-I-2 539<br />
The ELM-free period is characterized by improved confinement of<br />
electron heat as well as density. Figure 7 shows profiles of electron temperature<br />
for the ohmic, NBI L-mode, NBI plus ECH H-mode, <strong>and</strong> ELM-free<br />
H-mode phases of the discharge of Fig. 5. These profiles show that the<br />
effect of ELMs is not just on the density, but that by suppression of ELMs<br />
the electron temperature may be increased. If the ECH is not being absorbed<br />
near the plasma center, as expected during the ELM-free period,<br />
improvement in confinement of electron heat near the center of the plasma<br />
is even greater.<br />
ACKNOWLEDGEMENT<br />
This work was supported by the U.S. Department of Energy under<br />
Contracts DE-AC03-84ER51044 <strong>and</strong> W-7405-ENG-48. The authors<br />
would like to acknowledge outst<strong>and</strong>ing engineering support by D. Bell,<br />
E. Hoffman, <strong>and</strong> A. Nerem.<br />
REFERENCES<br />
[1] PRATER, R., in Proc. Course <strong>and</strong> Workshop on <strong>Applications</strong> of RF Waves to Tokamak<br />
Devices, Varenna, 1985 (BERNABEI, S., et al., Eds), Int. School of Plasma Physics, Varenna<br />
(1985) 354.<br />
[2] ALIKAEV, V., et al., Plasma Phys. Control. Fusion 29 (1987) 1285.<br />
[3] LOHR, J.M., et al., Phys. Rev. Lett. 60 (1988) 2630.<br />
[4] PRATER, R., et al., in Proc. 6th Joint Workshop on Electron Cyclotron Emission <strong>and</strong> Electron<br />
Cyclotron Resonance Heating, Oxford, 1987, Culham Lab., Abingdon (1987) 195.<br />
[5] SNIDER, R.T., et al., Rep. GA-A19057, General Atomics, San Diego, CA (1988); accepted for<br />
publication in Phys. Fluids.<br />
[6] BORNATICI, M., et al., Nucl. Fusion 23 (1983) 1153-1257.<br />
[7] KRITZ, A.H., et al., in Heating in Toroidal Plasmas (Proc. 3rd Joint Varenna-Grenoble Int.<br />
Symp. Grenoble, 1982), Rep. EUR 7979EN, Vol. 2 (1982) 7O7.This code was extended to noncircular<br />
tokamaks by G.R. Smith et al.<br />
[8] KAYE, S.M., GOLDSTON, R.J., Nucl. Fusion 25 (1985) 65-69.<br />
[9] STALLARD, B., et al., Rep. GA-A19349, General Atomics, San Diego, CA (1988); to be submitted<br />
to Nucl. Fusion.<br />
[10] HARVEY, R.W., McCOY, M.G., KERBEL, G.D., "3D bounce averaged Fokker-Planck calculation<br />
of electron cyclotron current drive efficiency", Proc. 7th Topical Conf. on <strong>Applications</strong><br />
of Radiofrequency Power to Plasmas, Kissimmee, FL, 1987, AIP, New York (1987) 49-52.<br />
[11] HARVEY, R.W., O'BRIEN, M.R., Paper 2D30, Sherwood Theory Mtg Gatlinburg, MD,<br />
1988.<br />
[12] PRATER, R., et al., "Electron cyclotron heating using the fundamental extraordinary mode<br />
launched from the low field side on DIII-D", Proc. 7th Topical Conf. on <strong>Applications</strong> of<br />
Radiofrequency Power to Plasmas, Kissimmee, FL, 1987, AIP, New York (1987) 9-12.<br />
[13] PFEIFFER, W.W., et al., ONETWO: a Computer Code for Modeling Plasma Transport in<br />
Tokamaks, Rep. GA-A16178, General Atomics, San Diego, CA (1980) 201 pp.<br />
[14] PARK, W., MONTICELLO, D.A., CHU, T.K., Phys. Fluids 30 (1987) 285.<br />
[15] WESTERHOF, E., GOEDHEER, W.J., in Controlled Fusion <strong>and</strong> Plasma Heating (Proc. 13th<br />
Eur. Conf. Schliersee, 1986), Vol. 10C, Part I, European Physical Society (1986) 132.<br />
[16] STAMBAUGH, R., et al., High 0 <strong>and</strong> ECRH Studies in DIII-D, Rep. GA-A19306, General<br />
Atomics, San Diego, CA (1988).
INSIDE LAUNCH ELECTRON CYCLOTRON<br />
HEATING AND CURRENT DRIVE ON DITE<br />
<strong>IAEA</strong>-CN-50/E-I-3<br />
M. ASHRAF, R. BARNSLEY 1 , N. DELIYANAKIS 2 , T. EDLINGTON,<br />
S.J. FIELDING, J. HUGILL, P.C. JOHNSON, B. LLOYD, S. MANHOOD,<br />
P. MANTICA 3 , G.F. MATTHEWS, W. MILLAR, M. O'BRIEN,<br />
R.A. PITTS 4 , A.C. RIVIERE, D.C. ROBINSON, A. SIMONETTO 5 ,<br />
G. VAYAKIS 2<br />
Culham Laboratory,<br />
Euratom-UKAEA Fusion Association,<br />
Abingdon, Oxfordshire,<br />
United Kingdom<br />
Abstract<br />
INSIDE LAUNCH ELECTRON CYCLOTRON HEATING AND CURRENT DRIVE ON DITE.<br />
Electron cyclotron resonance heating at 60 GHz has been carried out on DITE (R = 1.2 m,<br />
a = 0.24 m) to investigate heating <strong>and</strong> current drive using the extraordinary mode launched with finite<br />
k| from the high field side. The first clear evidence of Doppler shifted resonance absorption in a nearthermal<br />
plasma is obtained. The heating efficiency is observed to fall sharply at densities above cut-off<br />
for the wave. At lower densities the increment in power to the limiter is measured during ECRH <strong>and</strong><br />
is compared with that expected from the global power balance. The degradation in particle confinement<br />
often associated with ECRH is observed as an increased particle flux at the boundary driven by local<br />
electrostatic fluctuations. Initial experiments on the electron cyclotron wave driven current at the second<br />
harmonic show effects that are consistent with the low efficiency expected from theory including trapped<br />
particle effects.<br />
1 INTRODUCTION<br />
At the fundamental EC resonance the right h<strong>and</strong> cut-off prevents X-mode<br />
access to the plasma when the wave is launched from the low field side.<br />
When launched from the HFS this limit is avoided <strong>and</strong> the cut-off density<br />
is then given by<br />
for a semi-infinite slab plasma. Here u> is the applied wave frequency, wp<br />
is the electron plasma frequency, n\\ — ck\\/u> <strong>and</strong> u>c = eB/m0. Earlier<br />
' Leicester University, Leicester, United Kingdom.<br />
2 Oxford University, Oxford, United Kingdom.<br />
3 Istituto di Fisica del Plasma, Consiglio Nazionale delle Ricerche, Milan, Italy.<br />
Royal Holloway <strong>and</strong> Bedford New College, University of London, London, United<br />
Kingdom.<br />
Attached under a Euratom Fellowship.<br />
541
542 ASHRAF et al.<br />
experiments on FTI [1] <strong>and</strong> Dili [2] showed that significant heating can be<br />
achieved at line average densities (ne) up to more than double the value<br />
at which this X-mode left-h<strong>and</strong> cut-off is present on axis but this is not<br />
observed in the present experiments. In addition, HFS launch requires<br />
fc|| 7^ 0 for effective absorption. This leads to damping of the rf wave<br />
on tail electrons <strong>and</strong> is of interest for down-shifted resonance heating [3].<br />
Absorption can only occur where the resonance condition is satisfied, that<br />
is,<br />
— = 7(1 - nfli cos 0) (2)<br />
where 7 = (1 — v 2 /c 2 )~"i,n = ck/u!,fi\\ = v\\jc <strong>and</strong> 9 is the angle between k<br />
<strong>and</strong> B. With appropriate values of 7, /?|| <strong>and</strong> cos 0,(2) can be satisfied for<br />
wc/u >1, the down-shifted resonance condition. In previous down-shifted<br />
resonance experiments (in WT2 [4] <strong>and</strong> PLT [5] for example) power was<br />
absorbed under conditions where a substantial distortion of the electron<br />
distribution was present, due either to lower hybrid heating or operation<br />
under slide-away conditions. In BITE the distribution was close to thermal.<br />
2 EXPERIMENTAL ARRANGEMENT<br />
The rf power was launched from the HFS from three antennas [6] designed<br />
to overcome the problem of breakdown at the point where the cyclotron<br />
resonance occurs in the waveguide. The mirrors used to direct the rf power<br />
towards the magnetic axis could be rotated so that the launch angle 0 with<br />
respect to the toroidal field could be varied between nominally parallel <strong>and</strong><br />
antiparallel values. A residual rf power detector, placed 135° toroidally from<br />
the antennas, was used to estimate the fraction of the power absorbed by<br />
the plasma. The experiments were made in H2, D2 <strong>and</strong> He plasmas. The<br />
latter provided good density control in the presence of ECRH <strong>and</strong> allowed<br />
tokamak operation at electron densities well above the X mode cut-off value,<br />
even at plasma currents of 100 kA.<br />
3 EXPERIMENTAL RESULTS<br />
Doppler Shifted Absorption<br />
The extent of Doppler shifted absorption depends on the electron temperature<br />
(Te) since the absorption occurs when the condition (2) is satisfied <strong>and</strong><br />
there are an adequate number of electrons present at that point with the<br />
required V||. In addition, the absorption coefficient is inversely proportional
0-20<br />
0-15<br />
a<br />
CO.<br />
0-10<br />
0-05<br />
0-0<br />
5S<br />
g. 10<br />
I. S<br />
So 0-6<br />
•o a<br />
I 02<br />
<strong>IAEA</strong>-CN-50/E-I-3 543<br />
Magletic<br />
axis<br />
/<br />
• 1.3-1-6x10 l9 m" 3<br />
A 2-5-3-1 x10 l9 m' 3<br />
1 1 t<br />
A<br />
(a)<br />
(b)<br />
^ \ \ l-33xlO l9 m" 3<br />
\ \i-5keV<br />
\2-67xl0 19 m" 3<br />
10keV<br />
1 1 !<br />
1-10 1-15 1-20 1-25 1-30 1-35<br />
Resonance position (m)<br />
1.40 1-45<br />
FIG. 1. (a) Variation of A(ip as a function of resonance position for two ranges of ne. [R = 1.2 m,<br />
a = 0.21 m, Ip = 100 kA, PECRH = 315 kW]; (b) variation of single pass absorption from ray tracing<br />
calculations for the two sets of conditions of (a) as a function of resonance position.<br />
to ne. Thus with a sufficiently high value of Te <strong>and</strong> low ne effective central<br />
heating can be expected with the cyclotron resonance zone displaced<br />
towards the low field side. Results obtained at a power of 315 kW using<br />
all three antennas (66% of the power in the X-mode) are shown in Figure<br />
l(a) for two ranges of ne. It is clear that at the lower densities optimum<br />
heating occurs when the unshifted resonance lies well towards the low field<br />
side. Corresponding single-pass absorption values for the X-mode from ray<br />
tracing calculations are plotted in Figure l(b). For these calculations a<br />
Maxwellian electron distribution was used. The absorption zone for the<br />
conditions corresponding to point A of Figure l(b) lies close to the axis,<br />
not at the unshifted cyclotron resonance. The parallel energy of the electrons<br />
in Doppler resonance with the wave where the absorption occurs is<br />
close to 5 keV whereas Te(0) = 1.5 keV. There is no evidence from the SXR<br />
or HXR diagnostics that a significant hot electron population is present,
544<br />
1.1<br />
ASHRAF et al.<br />
Absorption zone from<br />
modulation analysis<br />
i ; ! ! !i:!i:; : !iiii? Absorption zone by<br />
ray tracing<br />
-0-1 o 0-1<br />
Position of absorption zone with<br />
respect to magnetic axis (m)<br />
FIG. 2. Major radius of unshifted resonance against location of absorbed power from modulated<br />
ECRH analysis f- o -) for three values of he. The shaded areas show the absorption zone calculated by<br />
ray tracing. [R = 1.2 m, a = 0.21 m, Ip = 100 kA, PECRH = 120 kW, Te(0) ~ 800 eV.]<br />
but the ECE spectrum at the lower densities shows a downshifted peak<br />
consistent with the presence of a hot electron group (estimated to have<br />
T « l50keV,n = 3*10~ 5 rze). Ray tracing shows that the addition of this<br />
group has a less than 1 per cent effect on the results obtained with the thermal<br />
plasma assumption. The experiment therefore provides clear evidence<br />
for Doppler shifted resonance absorption (down shifted resonance) in a near<br />
thermal plasma.<br />
Further evidence in support of this is provided by the results of modulated<br />
ECRH experiments [7]. The power deposition profile is obtained from
<strong>IAEA</strong>-CN-50/E-I-3 545<br />
0.25 • (a) 10<br />
020<br />
015<br />
005<br />
1°<br />
0075<br />
0050<br />
0-025<br />
0-0<br />
-0025<br />
(b)<br />
o»x mode<br />
240 kW<br />
neao'V)<br />
FIG. 3. (a) Variation of A@p as a junction of ne with the unshifted resonance radius at 1.29 m.<br />
[R = 1.2 m, a = 0.21 m, lp = 100 kA]; (b) as for (a), with the unshifted resonance radius at 1.17 m.<br />
[R = 1.19 m, a = 0.24 m, Ip = 100 kA.] Both (a) <strong>and</strong> (b) refer to He discharges. The indicated cutoff<br />
density, nc, is calculated from Eq. (1).<br />
analysis of the phase <strong>and</strong> amplitude of the plasma response as seen by the<br />
SXR diode array <strong>and</strong> multi-channel ECE. The results for three electron densities<br />
are plotted in Figure 2 together with the unshifted resonance location<br />
(solid line). The region;of absorption obtained from ray tracing calculations<br />
for the appropriate plasma conditions are shown as the shaded areas, <strong>and</strong><br />
are in good agreement with the experimental results.<br />
Density Limit to Propagation<br />
The behaviour of A(3P as ne is increased is shown in Figures 3(a) <strong>and</strong> (b)<br />
for which the unshifted resonant surface was respectively +6 cms <strong>and</strong> -6<br />
0-8
546 ASHRAF et al.<br />
cm from the magnetic axis. The calculated value of ne at which the cut-off<br />
defined by Eqn (1) appears on axis or at the resonance line (nc), is indicated<br />
in each case <strong>and</strong> clearly the heating effect falls to zero above this value. At<br />
densities just below the cut-off, the ECRH power is absorbed off-axis <strong>and</strong> as<br />
a consequence the sawtooth inversion radius contracts when the ECRH is<br />
turned on <strong>and</strong> exp<strong>and</strong>s again afterwards as the current profile responds to<br />
changes in Te(r). The time constant of the response (~ 12 ms) is consistent<br />
with classical resistive diffusion of the small current profile changes implied<br />
(A q(o) w 0.03). The difference in the behaviour above cut-off compared<br />
with that in Dili may be due to the edge heating produced by ECRH at<br />
high ne reversing the degradation in r^ in the ohmic discharge in that case.<br />
Current Drive Efficiency<br />
Observation of electron cyclotron current drive at 2wc in the CLEO Tokamak<br />
has recently been reported [8] where the current drive efficiency was found<br />
to be a factor x 3 below theoretical expectations. Recent attempts have<br />
been made to repeat <strong>and</strong> extend these experiments in DITE using HFS<br />
launch.<br />
These initial experiments were performed at 2wc with a total RF power<br />
of ~ 200kW (net power delivered to the plasma). Plasma currents in the<br />
range 40 — 60kA were employed. For ne < 6 x 10 18 m~ 3 the discharges were<br />
observed to become significantly non-thermal whilst the heating efficiency<br />
decreased rapidly as ne increased beyond 1 x 10 19 m~ 3 ; hence most work<br />
was carried out at ne =(8 — 9)x 10 18 m~ 3 . For such conditions, theoretical<br />
predictions indicate that for quasi-perpendicular propagation (strongest<br />
damping) trapping effects can reduce the driven current by an order of<br />
magnitude. The trapping effects are less severe for more oblique propagation,<br />
resulting in an optimum angle for current drive of 60° to the toroidal<br />
direction. Assuming Teo ~ lkeV the optimised current drive efficiency is<br />
•q = n2oRIrj/Prf = 1.3 x 10~ 3 . Thus for our experimental conditions an<br />
RF-driven current of only 2.6kA is expected (ie.,5% of Ip). The current is<br />
in the same toroidal direction as the launched wave.<br />
The launched waves were directed both parallel <strong>and</strong> anti-parallel to Ip at<br />
an angle of 60° <strong>and</strong> during the course of the experiments Ip was also reversed<br />
several times. Both ECE measurements of Teo <strong>and</strong> magnetic measurements<br />
of /3 consistently indicated that for the same injected power the electron<br />
temperature was higher when the waves were directed anti-parallel to Ip. In<br />
this case the residual microwave power was lower indicating more complete<br />
absorption of the injected power. Furthermore there was good agreement in
<strong>IAEA</strong>-CN-50/E-I-3 547<br />
A/3 deduced from the equilibrium <strong>and</strong> from the diamagnetic loop indicating<br />
a similar inductance <strong>and</strong> no significant pressure anisotropy in ohmic <strong>and</strong> all<br />
centrally ECR-heated plasmas considered here, irrespective of the relative<br />
directions of k <strong>and</strong> Ip. Differences in /? /Bo. The total particle flow<br />
to the limiters was also estimated from the «/,„< profile measured by a probe<br />
mechanically swept through the scrape-off layer up to 1 cm behind the last<br />
closed flux surface at an equivalent poloidal location to the 4 pin probe. The<br />
behaviour of the total particle flow derived from the fluctuations, measured<br />
1 cm behind the last closed flux surface <strong>and</strong> assumed constant on the surface,<br />
agrees well with that of the flux from the J3at profile as illustrated in Figure<br />
4(b), although the absolute value is 1.8 times higher. The rms level of<br />
broad-b<strong>and</strong> magnetic fluctuations (Be) observed inside the vacuum vessel<br />
[9] also increases with ECRH <strong>and</strong> decreases with density in both ohmic <strong>and</strong>
548 ASHRAF et al.<br />
20<br />
4<br />
I ,5<br />
£ 10<br />
.y 5<br />
o<br />
a.<br />
300<br />
- 200:<br />
_o<br />
Hi<br />
1 100<br />
5300<br />
Ji<br />
«D > 200<br />
100<br />
(b)<br />
ECRH<br />
1 2 3 4!<br />
Line average density (10 l9 m" 3 )<br />
Jf"<br />
OH<br />
ECRH<br />
0 100 200 300 400<br />
Fluctuation equivalent flow (A)<br />
500r (c) - A<br />
400<br />
Edge density Ho'V)<br />
ECRH<br />
10 12<br />
FIG. 4. (a) Panicle confinement lime from limiter probe measurements as a function of ne in He discharges.<br />
[Ip = 40 kA, Bj, = 2.1 T, PECRH = 130 kW]; (b) local parallel particle flux from Jsar profile<br />
in the scrape-off layer as a function of fluctuation driven cross-field flux 1 cm behind last closed flux<br />
surface in H2 discharges. [Ip = 40 kA, Bt = 1.1 T, PECRH = 155 kW]; (c) broadb<strong>and</strong> (40 to 250 kHz)<br />
root mean square poloidal field fluctuation level 1 cm behind the last closed flux surface as a function<br />
of edge density with conditions as for (a). For (a), (b) <strong>and</strong> (c), R = 1.19 m, a = 0.24 m.
<strong>IAEA</strong>-CN-50/E-I-3 549<br />
ECRH phases as shown in Figure 4(c). The magnetic fluctuations however<br />
make an insignificant contribution to the local particle transport.<br />
4 CONCLUSIONS<br />
• The first clear evidence is found for Doppler shifted resonance absorption<br />
in plasmas with a near-thermal electron energy distribution .<br />
• At electron densities above the cut-off value for HFS launch the heating<br />
efficiency decreases sharply.<br />
• At the higher densities the absorption occurs off-axis due to the effect<br />
of refraction. The timescale for the subsequent change in the current profile<br />
is consistent with classical resistive diffusion.<br />
• Analysis of the rise in temperature <strong>and</strong> the fall in loop voltage with<br />
changes in k.Ip indicate an rf driven current consistent with that predicted<br />
from a theoretical model which has the effects of trapped particles <strong>and</strong><br />
the ohmic electric field included. Such predictions are not a significant<br />
underestimate of the efficiency of ECCD.<br />
• The particle flux to the limiter during both OH <strong>and</strong> ECRH is consistent<br />
with the measured electrostatic fluctuations in the boundary region.<br />
REFERENCES<br />
[1] BARANOV, Yu.F., et al., Sov. J. Plasma Phys. 8 (1982) 383.<br />
[2] PRATER, R., et al., in Plasma Physics <strong>and</strong> Controlled <strong>Nuclear</strong> Fusion Research 1986 (Proc.<br />
11th Int. Conf. Kyoto, 1986), Vol. 1, <strong>IAEA</strong>, Vienna (1987) 587.<br />
[3] FIDONE, I., GIRUZZI, G., MAZZUCATO, E., Phys. Fluids 28 (1985) 1224.<br />
[4] ANDO, A., et al., Nucl. Fusion 26 (1986) 107.<br />
[5] MAZZUCATO, E., et al., Nucl. Fusion 26 (1986) 1165.<br />
[6] DELLIS, A.N., et al., MOELLER, C.P., et al., in Electron Cyclotron Emission <strong>and</strong> Electron<br />
Cyclotron Heating (Proc. 6th Joint Workshop, Oxford, 1987), Culham Rep. CLM-ECR (1987)<br />
347 <strong>and</strong> 355.<br />
[7] ASHRAF, M., et al., Paper <strong>IAEA</strong>-CN-50/A-V-2-1, these Proceedings, Vol. 1.<br />
[8] LLOYD, B., et al., Nucl. Fusion 28 (1988) 1013.<br />
[9] MANTICA, P., ARGENTI, L., CIRANT, S., in Controlled Fusion <strong>and</strong> Plasma Heating<br />
(Proc. 15th Eur. Conf. Dubrovnik, 1988), Vol. 12B, Part II, European Physical Society (1988)<br />
815.
HIGH POWER ECRH AND<br />
ICRF HEATING EXPERIMENTS IN<br />
THE HELIOTRON E AND DR DEVICES<br />
Heliotron E:<br />
O. MOTOJIMA, T. MUTOH, M. SATO, H. ZUSHI, H. OKADA,<br />
N. NODA, H. KANEKO, T. MIZUUCHI, K. KONDO, S. SUDO,<br />
Y. TAKEIRI, F. SANO, K. ITOH, S. MORIMOTO,<br />
K. HANATANI, K. AKAISHI, T. OBIKI, A. IIYOSHI<br />
Heliotron DR:<br />
S. MORIMOTO, N. YANAGI, M. SATO, S. BESSHOU,<br />
S. KOBAYASHI, M. IIMA, K. ICHIGUCHI,<br />
M. WAKATANI, T. OBIKI, A. IIYOSHI<br />
Plasma Physics Laboratory,<br />
Kyoto University,<br />
Gokasho, Uji, Kyoto,<br />
Japan<br />
Abstract<br />
<strong>IAEA</strong>-CN-50/E-I-4<br />
HIGH POWER ECRH AND ICRF HEATING EXPERIMENTS IN THE HELIOTRON E AND DR<br />
DEVICES.<br />
In the Heliotron E device, high power ECRH was carried out to extend the parameter regime <strong>and</strong><br />
to study the effects of the radial electric field on the local electron thermal conductivity. By shifting the<br />
magnetic axis 2 cm inward, a plasma with a temperature higher by 15% <strong>and</strong> a central confinement better<br />
by 20% was obtained. High energy protons (< 100 keV) produced by ion cyclotron range of frequency<br />
(ICRF) heating were observed. The creation conditions <strong>and</strong> confinement properties of these high energy<br />
protons were investigated. This is the first experimental evidence showing the possibility of confining<br />
high energy particles in a helical system such as a heliotron/stellarator. In the Heliotron DR device, the<br />
second <strong>and</strong> third harmonic ECRH have been studied by using a 28 GHz, 200 kW gyrotron. Efficient<br />
heating was observed for both kinds of harmonic heating at electron densities of n^,
552 MOTOJIMA et al.<br />
ICRF <strong>and</strong> plasma-wall interaction [1, 2]. In this section, we discuss the effects of<br />
a radial electric field on the local transport coefficient <strong>and</strong> the observed improvement<br />
of the confinement properties by an inward shift of the magnetic axis in ECRH<br />
plasmas. The creation conditions <strong>and</strong> confinement properties of high energy minority<br />
protons produced by ICRF are also discussed.<br />
1.1. ECRH experiments<br />
ECRH experiments were carried out using five gyrotrons (frequency =<br />
53.2 GHz, power < 720 kW, pulse width < 100 ms). TE02 circular mode waves<br />
were launched from open ended antennas. The parameter range of the ECRH plasmas<br />
was extended by increasing the heating power. In particular, a plasma with higher<br />
density (n
<strong>IAEA</strong>-CN-50/E-I-4 553<br />
0-1 Jr<br />
FIG. 2. xf versus Te at r/a = 0.5. x? C (Er * 0) <strong>and</strong> x? c (Er = 0) are also calculated by using<br />
measured profiles.<br />
The transport coefficients in non-axisymmetric toroidal devices can be reduced<br />
by a radial electric field Er, which appears to satisfy the ambipolarity condition. For<br />
example, the electron thermal conductivity xe NC (Er = 0) has a temperature dependence<br />
of Te 3 5 in the \lv regime. However, with Er ^ 0 this strong temperature<br />
dependence should be reduced to a milder dependence on Tf (a = 1-3) [6]. By<br />
using the electron density <strong>and</strong> temperature <strong>and</strong> ion temperature profiles, xl xp at<br />
r/a = 0.5 was evaluated [3]. Here, the radiation loss was small <strong>and</strong>, therefore,<br />
neglected. The power absorption profile was evaluated by measuring the decay<br />
process of the electron stored energy after RF turnoff [4]. The observed x l xp (V2)<br />
had a dependence on Tf (0 « 2.5), which was slightly more favourable than xe NC<br />
(Er = 0). The theoretical heat flux was calculated by using Er as determined from<br />
the ambipolar condition. The value of xe NC (Er ^ 0) was evaluated from the heat<br />
flux divided by the observed i^ VTe. The absolute value of x" p (ap/2) was larger, by<br />
a factor of three to four, than xe NC (Er * 0). It is shown in Fig. 2 that xf p is<br />
between xe NC (Er = 0) <strong>and</strong> x^ c (Er ^ 0) in the rare collisional regime for<br />
Te > 700 eV. The reduction of xf p from xe NC (Er = 0) indicated the effects of Er.<br />
The radial electric field at r/a = 0.7-0.9 was estimated from measurements of<br />
the poloidal rotation [2]. Figure 3 (a) shows the Te dependence of the rotation velocity<br />
for two different density regimes. Te was changed by varying the RF power. It<br />
was observed that the plasma rotated in the ion diamagnetic direction, which suggested<br />
the presence of positive Er. The rotation velocity increased with increasing<br />
Te. This Te dependence was compared with the neoclassical prediction using<br />
approximated profiles of n,., Te <strong>and</strong> TL. The result is shown in Fig. 3(b). A good<br />
qualitative agreement between experiment <strong>and</strong> prediction is obtained. However, Er<br />
evaluated from the rotation is found to be smaller, by a factor of two to five, than<br />
the predicted neoclassical value.
554 MOTOJIMA et al.<br />
(a)<br />
0.6SneS0.9x10 1J cm" J<br />
0.S 1.0<br />
TglO) (keV)<br />
0.5 1.0<br />
Te(0) (keV)<br />
FIG. 3. (a) Observed poloidal rotation velocity versus Tc; (b) calculated result for Er obtained by onedimensional<br />
simulation code.<br />
An attempt to reduce ripple transport was made by shifting the magnetic axis<br />
inward. By using an additional vertical field Bv, the magnetic axis could be shifted<br />
inward or outward, depending on the direction of Bv. When the magnetic axis was<br />
shifted inward (A < 0), the helical ripple became localized on the inboard side of<br />
the torus. An improvement of transport was expected [7]. In the opposite direction<br />
(A > 0), transport was expected to be enhanced. Figure 4 shows the dependences<br />
of the Te, Tj, at <strong>and</strong> the decay time rd of Te after RF turnoff on the axis shift, A.<br />
The line density was kept constant around 7 x 10 14 cm" 2 , with constant gas puffing<br />
rate. When A = -2 cm (A/a,, - 0.1), Te <strong>and</strong> Ts increased by -15%. At further<br />
inward shift, A = -4 cm, Te <strong>and</strong> Tj started to decrease. In the case of an outward<br />
shift, they decreased monotonically. To indicate the improvement of the confinement<br />
in the central region, TA within r/a < 0.2 was also plotted. It was the longest at<br />
A = -2 cm, being improved by ~ 20% over the case of A = 0 cm. Thus, aplasma<br />
with higher temperature <strong>and</strong> longer confinement time was obtained by shifting the<br />
magnetic axis inward. This improvement factor was larger than the expected value<br />
(~ 10%), if rE scaled as a£. Considering the deviation of the magnetic axis from the<br />
unshifted mod-B structure, both inward <strong>and</strong> outward shifts were expected to cause<br />
almost the same change in the absorption profile. Therefore, even if the confinement<br />
was related to the absorption profile, the fact of an improvement for A = -2 cm <strong>and</strong><br />
a degradation by A = +2 cm could not be explained by this profile effect. The fact<br />
of higher Te <strong>and</strong> longer rd suggested a reduction of the transport coefficient.
1.2. ICRF experiments<br />
<strong>IAEA</strong>-CN-50/E-I-4<br />
-6 -4 -2 0 »2<br />
Magnetic axis shift (cm)<br />
FIG. 4, Te, Tj, ni <strong>and</strong> rd versus magnetic axis shift.<br />
The confinement of helically trapped ions was investigated by using perpendicularly<br />
injected NBI fast ions with an injection energy Einj of 26 keV [8]. In the fast<br />
wave heating mode, measuring the minority protons with higher perpendicular<br />
energies of E > 30 keV yielded further useful information. Eight ICRF antenna<br />
loops were installed on the high field side inside the vacuum chamber [9]. The bulk<br />
ion temperature was increased from 250 eV (ECRH) to 650 eV in the case of a<br />
proton minority <strong>and</strong> to 1000 eV in the case of a 3 He minority by using 1 to 2 MW<br />
ICRF power at H,, = 1.5 to 2.5 x 10 13 cm" 3 . Effective heating in the case of the<br />
3<br />
He minority was considered to be due to the better confinement of the energetic<br />
3 ++<br />
He ions, the lower tail temperature <strong>and</strong> the reduced charge exchange loss<br />
[10, 11].<br />
High energy protons were measured in the case of proton minority heating by<br />
using a EllB type charge exchange neutral particle analyser (NPA) with detected<br />
energies of up to 100 keV. This analyser viewed both passing <strong>and</strong> helically trapped<br />
particles according to the individual pitch angle (70°-110°) along the sight line<br />
of the NPA. We studied the conditions for creation of high energy protons as functions<br />
of Se, the magnetic field strength B0) <strong>and</strong> the RF power, PICRF- The tail<br />
temperature, T^, measured in the energy range of 20-60 keV was used as a measure<br />
of the tail creation condition. It was observed that T^ was increased up to<br />
40 keV at h; = 0.8 x 10" cm" 3 , <strong>and</strong> up to 8-10 keV at n,. ~ 2.5 X 10 l3 cm" 3 .<br />
The dependence of Tuii on Bo was obtained by varying Bo from 1.72 T to 1.94 T at<br />
900 kW of ICRF power. The applied frequency was 26.7 MHz, which corresponded<br />
to the hydrogen cyclotron frequency at BQ = 1.75 T. The value of T^ became<br />
highest by adjusting the hydrogen cyclotron layer close to the plasma centre, which<br />
is similar to the results in the PLT tokamak [12]. The ICRF power dependence of<br />
555
556 MOTOJIMA et al.<br />
0 20 W 60 80 100<br />
ENERGY (keV)<br />
FIG. 5. Charge exchange NPA spectra of minority protons (nH/nD = 0.1).<br />
0 50 100<br />
ENERGY (keV)<br />
FIG. 6. Decay time of NPA flux after ICRF pulse turnoff.<br />
Taj, was studied by varying the RF power from 120 kW to 1 MW for different Bo<br />
(1.76 or 1.86 T). At a low power level of 120 kW, Tteil was observed to be<br />
— 13 keV. T^ increased proportionally to the RF power with an efficiency of<br />
AT^/APICRF « 40eV-kW-' for B0=1.76T. However, this efficiency was<br />
decreased to ~9eV-kW" ] for Bo = 1.86 T. A typical example for the energy<br />
spectra of the minority proton is shown in Fig. 5. It was found that there was no<br />
observable limit to the energy spectrum below 100 keV. The decay time of the energetic<br />
proton flux rdecay (e-folding time of the flux) varied between 2 <strong>and</strong> 6 ms, as is<br />
shown in Fig. 6. Here, rdtCiy was correlated with the slowing-down rate of the<br />
energetic protons. These protons slowed down because of the electron drag since<br />
their energy was much higher than the critical energy (Ec = 9.3 Te). We found<br />
that Tdecay was proportional to the slowing-down time due to the electron drag,<br />
TS1 = t/J In [(E 15 + Ec 15 )/ (0.22 E 15 + Ec 15 )], where t, is Spitzer slowing-down<br />
time <strong>and</strong> rsl was evaluated from n
<strong>IAEA</strong>-CN-50/E-I-4 557<br />
This effect might explain the fact that C was less than 1. However, the energy<br />
dependence of C suggested that the direct orbit loss was not negligible for higher<br />
energetic protons.<br />
It is concluded that this observation is the first experimental evidence showing<br />
the possibility of confining high energy particles in a heliotron configuration. The<br />
above-described results partially support our view that a reactor might be designed<br />
on the basis of helical systems such as the heliotron/stellarator.<br />
2. CHARACTERISTICS OF OVERDENSE PLASMAS DURING THE<br />
SECOND AND THIRD HARMONIC ELECTRON CYCLOTRON<br />
HEATING IN HELIOTRON DR<br />
Experiments on the second <strong>and</strong> the third harmonic electron cyclotron heating<br />
have been carried out in Heliotron DR (t = 2, m = 15, major radius R = 0.9 m,<br />
mean minor radius a = 0.07 m, plasma volume Vp = 90 L) by using a 28 GHz,<br />
200 kW gyrotron. The heating power'density attains ~2.4 W-cirT 3 , on the<br />
average, which is fairly large compared with the values attained in Heliotron E<br />
<strong>and</strong> Wendelstein VII-A (0.3 keV) signal, SX, is increased with n 100 keV) intensity, HX, is enhanced in the low density phase of<br />
iie = (0.2-0.3) x 10 l3 cm" 3 <strong>and</strong> also during the rising phase of Wp. However, it is<br />
strongly suppressed in the overdense regime. The time evolution of the soft X-ray<br />
profile has been measured with a 12-chord silicon diode array. It shows that the
558<br />
5<br />
4<br />
3<br />
2<br />
1<br />
0<br />
60<br />
40<br />
20<br />
0<br />
la)<br />
cutoff^<br />
Pref<br />
Teo(100eV)<br />
T, IV<br />
^SX(ch,6) L<br />
2 4 6 8 10<br />
t ime (msI<br />
MOTOJIMA et al.<br />
H12659<br />
Ibl<br />
p<br />
Hms)<br />
axis<br />
1 HA/di V<br />
1 2 3 4 5 6 7 8 9 1011 12<br />
Ma j o r<br />
Ax i s<br />
Chann eI<br />
FIG. 7. (a) Temporal behaviour of typical overdense ECH plasma (Plnj ~ 200 kW, Bo = 0.5 T);<br />
(b) time evolution of soft X-ray intensity profile. Arrows on both sides indicate outermost closed magnetic<br />
surface.<br />
plasma is well defined within the last closed magnetic surface throughout the discharge<br />
as is shown in Fig. 7(b). In the overdense phase, the central part of the profile<br />
is mainly enhanced. Its peak tends to shift outwards during the discharge. Magnetic<br />
fluctuations with f > 100 kHz are observed during the discharges; they tend to grow<br />
with Wp. When Wp (n«.) is raised too much, the low frequency instability is<br />
enhanced <strong>and</strong> determines the maximum value.<br />
2.2. Dependence of magnetic field intensity <strong>and</strong> the third harmonic heating<br />
Overdense plasmas can be produced in a wide range of magnetic field intensity.<br />
However, the attainable stored energy depends on whether Bo is higher or lower<br />
than the resonance field, B^. Figure 8 shows the maximum stored energy, Wp>max,<br />
as a function of Bo for overdense plasmas. For Bo > 0.5 T, Wpmax can be raised up<br />
to a corresponding averaged beta value of ~0.5%, which is limited by onset<br />
of the MHD instability. Although the pressure profile is expected to be changed by<br />
moving the region of resonance, the observed soft X-ray profiles are centrally peaked<br />
<strong>and</strong> almost independent of Bo. For Bo < 0.5 T, Wpmax is substantially lowered as<br />
Bo is reduced from 0.5 T. This result might be explained by the observed weaker<br />
absorption of the RF power <strong>and</strong> stronger magnetic fluctuations (enhanced transport)<br />
in this range of Bo.<br />
The overdense plasmas are also heated efficiently by the third harmonic heating<br />
as is shown in Fig. 8. Fourth <strong>and</strong> fifth harmonic heating was also possible although<br />
these discharges were assisted by a small Ohmic power of < 1 kW. Basically, the<br />
same phenomena as in second harmonic heating are observed in the third harmonic<br />
heating when the density exceeds the cutoff value. The heating takes place more
100<br />
50<br />
4th<br />
2.0 3,0<br />
<strong>IAEA</strong>-CN-50/E-I-4<br />
3rd<br />
.."«•<br />
2nd<br />
4.0 5.0 6.0<br />
B0(kG)<br />
F/G. S. Maximum stored energy Wpmax of overdense plasmas versus Bo. Arrows indicate resonant<br />
magnetic field intensities for each harmonic heating. Each range ofB0 where a resonance layer exists<br />
in the outermost closed magnetic surface is also shown.<br />
effectively on the higher field side as long as a resonance layer exists in the last closed<br />
magnetic surface. The maximum is again limited to —0.5%, because of the<br />
MHD instability.<br />
A possible heating mechanism in the overdense regime is absorption of the electron<br />
Bernstein (B) wave, which is mode converted from the extraordinary (X) <strong>and</strong><br />
ordinary (O) modes through X-B (after tunnelling through the evanescent layer) <strong>and</strong><br />
O-X-B conversion processes. These processes would be possible because of the relatively<br />
short density scale-length in Heliotron DR. Multiple reflection of the RF wave<br />
at the vacuum wall would improve the absorption efficiency for both processes. It<br />
is, however, noted that the central part is effectively heated, even under off-axis<br />
resonant condition. If the RF power is absorbed around the resonant layer, it should<br />
be transferred to the interior of the plasma. The dependence on Bo suggests that<br />
orbits of accelerated electrons play a role in power deposition.<br />
2.3. MHD stability analyses<br />
Properties of the MHD instability have been studied, both experimentally <strong>and</strong><br />
theoretically. Measurements with magnetic probes <strong>and</strong> a soft X-ray diode array show<br />
that the instability has a mode number of m = n = 1 <strong>and</strong> is localized near the t = 1<br />
surface. It rotates in the direction of the electron diamagnetic drift with a frequency<br />
of 1-5 kHz. The most plausible c<strong>and</strong>idate for this instability is the pressure driven<br />
interchange mode. The pressure profile was estimated by measuring the vertical field<br />
produced by Pfirsch-Schluter currents; it was shown to be close to [1 — (r/a) 2 ] 2<br />
[13]. The observed limit is fairly independent of Bo, which might be due to the<br />
unchanged pressure profile mentioned above. The instability is also affected by the<br />
plasma current, which modifies the shape of the rotational transform. A small current<br />
559
560 MOTOJIMA et al.<br />
3 0.005<br />
0 0.2 0A 0.6 0.6 1.0 1.2<br />
FIG. 9. Growth rate ofm = n = 1 ideal interchange mode versus for different pressure profiles.<br />
Calculation is based on STEP code under free boundary conditions.<br />
(tp(a) > 0.05), which decreases the vacuum rotational transform <strong>and</strong>, consequently,<br />
increases the shear, stabilizes the instability.<br />
We have numerically analysed the MHD stability against the ideal interchange<br />
mode by using the STEP code [14], under free boundary conditions. It is found that<br />
the limit is 0.47% for a pressure profile of [1 — ^] 2 (\p is the flux function).<br />
It is very close to the experimentally observed value. It is, however, lower than the<br />
previous result (0.8%) [15], which was calculated from the BETA code under fixed<br />
boundary conditions. The difference might be due to different mesh sizes <strong>and</strong><br />
boundary conditions. A finer mesh size (ten times) is used in the STEP code <strong>and</strong>,<br />
therefore, the present calculation seems to be more accurate than the previous one.<br />
The stability was also investigated for different pressure profiles; the results are<br />
shown in Fig. 9. It shows that a steeper pressure gradient at t = 1 surface reduces<br />
the attainable
<strong>IAEA</strong>-CN-50/E-I-4 561<br />
[3] SATO, M., et al., in Controlled Fusion <strong>and</strong> Plasma Heating (Proc. 15th Eur. Conf. Dubrovnik,<br />
1988), Vol. 12B, Part II, European Physical Society (1988) 470.<br />
[4] ZUSHI, H., et al., Nucl. Fusion 28 (1988) 1801.<br />
[5] ITOH, K., ITOH, S.I., J. Phys. Soc. Jpn. 57 (1988) 1269.<br />
[6] SHAING, K.C., Phys. Fluids 27 (1984) 1567.<br />
[7] MYNICK, H.E., Phys. Rev. Lett. 48 (1982) 322.<br />
[8] HANATANI, K., et al., Nucl. Fusion 25 (1985) 259.<br />
[9] MUTOH, T., et al., in Plasma Physics <strong>and</strong> Controlled <strong>Nuclear</strong> Fusion Research 1986 (Proc. 1 lth<br />
Int. Conf. Kyoto, 1986), Vol. 2, <strong>IAEA</strong>, Vienna (1987) 473.<br />
[10] FUKUYAMA, A., et al., 1st US-Japan Workshop on New Generation Experiments <strong>and</strong> Reactors,<br />
Kyoto, 1988.<br />
[11] OHNISHI, M., et al., to be published in Nucl. Fusion.<br />
[12] CHRIEN, R.E., STRACHAN, J.D., Phys. Fluids 26 (1983) 1953.<br />
[13] MORIMOTO, S., et al., to be published in Nucl. Fusion.<br />
[14] ANANIA, G., JOHNSON, J.L., Phys. Fluids 26 (1983) 3070.<br />
[15] WAKATANI, M., et al., in Plasma Physics <strong>and</strong> Controlled <strong>Nuclear</strong> Fusion Research 1986 (Proc.<br />
11th Int. Conf. Kyoto, 1986), Vol. 2, <strong>IAEA</strong>, Vienna (1987) 625.
RF CURRENT DRIVE AND MHD INSTABILITY<br />
CONTROL BY EC AND LH WAVES<br />
ON THE WT-3 TOKAMAK<br />
S. TANAKA, Y. TERUMICHI, T. MAEKAWA,<br />
M. NAKAMURA 1 , A. ANDO 2 , K. OGURA, H. TANAKA,<br />
M. IIDA, S. IDE, K. IWAMURA, A. YAMAZAKI, T. ITOH,<br />
M. IWAMASA, K. HANADA, R. ITATANI 3 , M. FUKAO 3 ,<br />
T. FUJIMOTO 3 , H. SUEMITSU 3<br />
Department of Physics,<br />
Faculty of Science,<br />
Kyoto University,<br />
Kyoto, Japan<br />
Abstract<br />
<strong>IAEA</strong>-CN-50/E-I-5<br />
RF CURRENT DRIVE AND MHD INSTABILITY CONTROL BY EC AND LH WAVES ON THE<br />
WT-3 TOKAMAK.<br />
Electron cyclotron current drive at the second harmonic (2fle ECCD) <strong>and</strong> MHD instability<br />
suppression <strong>and</strong> excitation by lower hybrid current drive (LHCD) have been studied on the WT-3 tokamak.<br />
EC driven current up to 27 kA is generated <strong>and</strong> sustained at constant plasma current with zero<br />
loop voltage as long as the EC power is applied. The line average electron density nc of the EC<br />
sustained plasma i^2x 10 12 cm" 3 <strong>and</strong> the average temperature of the bulk electrons Te is 200 eV.<br />
The efficiency of the 2fie ECCD t\ » 0.04 x 10" rrT 2 -A-W~'. Unidirectional high energy tail electrons,<br />
which pre-exist in an OH target plasma, are heated <strong>and</strong> carry the plasma current. The equivalent<br />
temperature of the hard X-ray spectrum, which is emitted by the high energy, current carrying electrons,<br />
is about 100 keV. The ratio of the total number of the high energy electrons to that of the bulk electrons<br />
is about 7.5%. When an LH driven current is superimposed on the OH discharge with sawtooth oscillations,<br />
the oscillations are suppressed <strong>and</strong> then reappear, following m = 1 MHD oscillations. The latter<br />
sawteeth have a large amplitude <strong>and</strong> a long period <strong>and</strong> sometimes there is no precursor or successor.<br />
1. INTRODUCTION<br />
There has been a great interest in non-inductive current drive to realize steady<br />
state operation of tokamaks. LHCD has. been able to start up, ramp up <strong>and</strong> sustain<br />
the plasma current successfully in many tokamaks. Meanwhile, there are a few<br />
ECCD experiments. We have carried out a series of LHCD, ECCD <strong>and</strong> combined<br />
CD experiments in the WT-2 <strong>and</strong> WT-3 tokamaks [1-14].<br />
In this paper, we report experimental results on 2$)e ECCD <strong>and</strong> MHD<br />
instability control by LHCD.<br />
1 Osaka Institute of Technology, Osaka, Japan.<br />
2 Institute of Plasma Physics, Nagoya University, Nagoya, Japan.<br />
3 Faculty of Engineering, Kyoto University, Kyoto, Japan.<br />
563
564<br />
* 0<br />
2<br />
' 0<br />
20<br />
?<br />
I 0<br />
§ 0<br />
50 100<br />
Time (ms)<br />
TANAKA et al.<br />
3<br />
3 1<br />
— in<br />
S3<br />
/ \<br />
(e)<br />
(h)<br />
(d)<br />
150 0 50 100<br />
Time (ms)<br />
FIG. 1. Temporal evolution of (a) loop voltage VL, (b) plasma current lp, (c) line averaged electron<br />
density ne measured by a 4 mm interferometer along the vertical chord, (d) soft X-ray emission Isx<br />
(0.2 keV), (e) lsx (0.9 keV), (f) Isx (2.5 keV), (g) hard X-ray emission l^ (35 keV), <strong>and</strong> (h) electron<br />
cyclotron emission /„ (70 GHz). Full curves refer to operation with 20e EC heating power<br />
pEC = 48 kW, T = 75 ms (parallel injection), <strong>and</strong> dotted curves designate operation without PEC. The<br />
initial filling gas pressure is p = 8.4 x 10' 3 Pa in H2 <strong>and</strong> additional gas is puffed during PEC.<br />
B, = 1.09 T.<br />
2. ECCD AT THE SECOND HARMONIC [12]<br />
A series of ECCD experiments was performed with a 56 GHz gyrotron on the<br />
WT-3 tokamak. Microwave power of up to 100 kW was injected from the low field<br />
side in the X-mode after OH power had been turned off. In the target plasma (electron<br />
density ne « 2 X 10 12 cm" 3 , temperature Te « 200 eV), there was a small fraction<br />
of high energy tail electrons. When an EC pulse was injected, this tail was EC heated,<br />
<strong>and</strong> a plasma current, Ip, of up to 27 kA was generated. A flat-top discharge was<br />
realized for an injected power of PEC « 50 kW <strong>and</strong> a ramp-up discharge for<br />
PEC > 50 kW.<br />
The typical waveforms of a flat-top discharge are shown in Fig. l(a)-(h). The<br />
solid curves refer to discharges with EC pulse <strong>and</strong> the dotted curves to those without<br />
EC pulse. When the EC pulse was injected, the constant current Ip = 16 kA was<br />
sustained with a loop voltage of VL = 0 as long as the EC power was applied<br />
(Figs l(a) <strong>and</strong> (b)). Thus, the plasma (n, * 2 X 10 12 cm" 3 <strong>and</strong> Te « 200 eV) was<br />
sustained by the EC driven current composed of high energy tail electrons. Tail<br />
buildup was observed in the hard X-ray (HXR) <strong>and</strong> the electron cyclotron emissions<br />
(Figs l(e)-(h)). When the pulse was injected, the equivalent temperature Th of the<br />
observed HXR spectrum increased from 40 to 90 keV at the end of the EC pulse <strong>and</strong><br />
the photon count (hi> > 90 keV) increased <strong>and</strong> became saturated. The effect of the<br />
location of the second harmonic resonance layer on ECCD was investigated by<br />
150
<strong>IAEA</strong>-CN-50/E-I-5 565<br />
80<br />
PEC
566<br />
TANAKA et al.<br />
<strong>and</strong> one order smaller than that of LHCD in WT-3 [10]. Furthermore, this value is<br />
one order smaller than the theoretical prediction. In the experiments, no 3£2e EC<br />
driven current is generated, in contrast to what was predicted theoretically (Fig. 2).<br />
3. MHD INSTABILITY CONTROL BY LHCD<br />
Recently, much interest has arisen in the suppression of sawtooth oscillations<br />
(STO) <strong>and</strong> MHD instabilities by LHCD, since the plasma current profile could be<br />
controlled independently of the electron temperature profile Te(r); in particular, the<br />
intense suprathermal electron tail associated with LHCD could alter plasma stability<br />
<strong>and</strong> transport.<br />
The safety factor at the limiter, qa, was varied from 5 to 2.7 by changing the<br />
plasma current, Ip, at constant toroidal field, BT(0) = 1.4 T. The density was kept<br />
at 2 x 10 13 cm" 3 . STO were observed in OH discharges with q,, < 5, <strong>and</strong> an<br />
m = 2, n = 1 mode was excited in the interval 3.2 < qa < 4. A major disruption<br />
occurred in the range of qa < 2.7. When LHCD was superimposed on the OH<br />
discharges with qa < 3.2, where there were no m = 2 activities, m = 2, n = 1<br />
oscillations were excited, grew up, <strong>and</strong> then the major disruption occurred. The<br />
m = 2 MHD activities in the OH discharges with qa > 3.2 could be suppressed by<br />
LHCD.<br />
MOO<br />
n<br />
0<br />
? 1. 2<br />
3 ouu 1<br />
Time(ms)<br />
(a)<br />
(b) .<br />
(c)<br />
(d)<br />
80<br />
130<br />
kW<br />
1,<br />
SXR<br />
" \<br />
, P LH ,<br />
MP<br />
Impurity Line (OV)<br />
1 i<br />
(e)<br />
(f)<br />
(9)<br />
§67<br />
(i) .<br />
-<br />
+ 71<br />
35<br />
1 1<br />
75<br />
FIG. 3. Temporal evolution of (a) plasma current Ip, (b) loop voltage VL, (c) line averaged electron<br />
density iie, (d) ECE at f = 100 GHz, (e) LH injection power (net) P^, (f) MP signal, (g) SXR intensity,<br />
(h) impurity line intensity <strong>and</strong> (i) radial position of the plasma current centre. Dotted lines refer<br />
to case with Pw. Figures (e)-(i) are on an enlarged time-scale.<br />
11.<br />
\
of<br />
x<br />
o<br />
o i<br />
L_<br />
t<br />
<strong>IAEA</strong>-CN-50/E-I-5 567<br />
•— r ^<br />
UXS<br />
I<br />
" V<br />
• V 3 5<br />
3 a I<br />
•^<br />
i?<br />
s<br />
f<br />
5<br />
ci -a.<br />
1 -5<br />
s « g<br />
a ^ -2 ^<br />
x i^* .r- 7<<br />
•a.<br />
3<br />
"8 i2
568 TANAKA et al.<br />
Figures 3(a)-(i) show the temporal evolution of the plasma parameters in the<br />
case of the STO suppression by LHCD. When PLH (=130 kW) is injected into an<br />
OH plasma with Ip = 110 kA (a), the loop voltage VL decreases (b) <strong>and</strong> the EC<br />
emission at f = 100 GHz increases (d). These data show the generation of LH driven<br />
current carried by suprathermal tail electrons. The electron density increases continuously<br />
from rie = 1.0 to 1.8 (X 10 13 cm" 3 ) at the end of the LH pulse (c). In<br />
Figs 3(e)-(i), the detailed temporal evolution of MHD phenomena is shown. The<br />
SXR signal along the central chord (g) shows that STO appearing in the OH plasma<br />
are suppressed by LHCD. After the suppression, the MHD oscillation appears at<br />
t = 52 ms <strong>and</strong> then STO with a large amplitude <strong>and</strong> a long period reappears at<br />
56 ms. Weak MHD activity is observed on the MP signal at t = 52 ms (f). The<br />
impurity line (O V) intensity decreases slightly at the beginning of the PLH injection<br />
<strong>and</strong> then increases.<br />
Figures 4(a)-(c) show the detailed temporal evolution of the SXR signals <strong>and</strong><br />
its spatial profiles in the case of complete stabilization <strong>and</strong> subsequent destabilization<br />
of STO by LHCD. In the enlarged figures (b), showing successive crash phases of<br />
STO in the LHCD plasma, the sawteeth crash very fast (t < 20 ps). Furthermore,<br />
the two early sawteeth ((1) <strong>and</strong> (2)) accompany the precursor, while the two late sawteeth<br />
((3) <strong>and</strong> (4)) accompany neither precursor nor successor. As is shown in<br />
Fig. 4(c), the inversion radii of both STO appearing in the OH <strong>and</strong> LHCD plasmas<br />
are nearly identical <strong>and</strong> rinv « 5 cm (rinv/a = 1/4), <strong>and</strong> the radial profile of the<br />
MHD oscillation (m = 1) of the SXR signals has a peak near r = rinv. The results<br />
suggest that there is no change in the location of the q = 1 surface between these two<br />
OH <strong>and</strong> LHCD plasmas.<br />
Figure 5 shows the temporal evolution of the contour curves of the SXR signal<br />
intensity in the crash phase of STO, which is similar to (2) in Fig. 4(b). These figures<br />
were reconstructed from the SXR intensities measured by three fan diode arrays<br />
(60 SSB detectors) by means of computer tomography. These characters suggest the<br />
formation of cold plasma STO bubbles as predicted by Wesson et al. [15].<br />
4. CONCLUSIONS<br />
The 2Qe EC driven current is generated in a target plasma with pre-existing<br />
high energy tail electrons. The flat-top <strong>and</strong> ramp-up discharges are realized without<br />
OH power. The current is carried by the EC heated high energy tail electrons. The<br />
2fie ECCD efficiency is one order smaller than that of LHCD in WT-3.<br />
The MHD instability (m = 2 mode) appearing in the high current OH discharge<br />
can be suppressed by LHCD. The sawtooth oscillations in the OH discharge are<br />
suppressed <strong>and</strong> then other sawteeth appear, following the m = 1 MHD oscillation<br />
in the LHCD plasma. The latter sawteeth are not accompanied by precursors or<br />
successors <strong>and</strong> have a long period <strong>and</strong> a large amplitude compared with those in the<br />
OH discharge. Computer tomography of the SXR intensities shows the formation of<br />
cold plasma STO bubbles similar to those of JET.
<strong>IAEA</strong>-CN-50/E-I-5 569<br />
FIG. 5. Contour plots of soft X-ray emissivity during sawtooth crash phase similar to (2) in Fig. 4(b).<br />
Core rotation is seen in A, B, C, D <strong>and</strong> E. Rapid cooling is seen between D <strong>and</strong> E. At time F, the core<br />
is gradually heated up again. The time t <strong>and</strong> the relative peak emissivities P are as follows:<br />
A(t = 73.62 ms, P = 1.00), B (73.74, 0.94), C (73.78, 0.88), D (73.82, 0.78), E (73.86, 0.63) <strong>and</strong><br />
F (74.56, 0.75).<br />
ACKNOWLEDGEMENTS<br />
The authors wish to thank Drs M. Nakajima <strong>and</strong> O. Wada for the design of the<br />
ECH antenna <strong>and</strong> to thank the other members of WT-3 for discussions. This work<br />
was supported by a grant-in-aid for scientific research from the Ministry of Education<br />
of Japan.<br />
REFERENCES<br />
[1] TANAKA, S., et al., in Plasma Physics <strong>and</strong> Controlled <strong>Nuclear</strong> Fusion Research 1982 (Proc.<br />
9th Int. Conf. Baltimore, 1982), Vol. 1, <strong>IAEA</strong>, Vienna (1983) 199.<br />
(ms)
570 TANAKA et al.<br />
[2] TANAKA, S., et al., in Plasma Physics <strong>and</strong> Controlled <strong>Nuclear</strong> Fusion Research 1984 (Proc.<br />
10th Int. Conf. London, 1984), Vol. 1, <strong>IAEA</strong>, Vienna (1985) 623.<br />
[3] ANDO, A., et al., Phys. Rev. Lett. 56 (1986) 2180; J. Phys. Soc. Jpn. 56 (1986) 4259.<br />
[4] SHIMOZUMA, T., et al., J. Phys. Soc. Jpn. 54 (1985) 1360.<br />
[5] ANDO, A., et al., Nucl. Fusion 26 (1986) 107.<br />
[6] KUBO, S., et al., Phys. Rev. Lett. 50 (1983) 1994.<br />
[7] OGURA, K., et al., J. Phys. Soc. Jpn. 55 (1986) 13.<br />
[8] NAKAMURA, M., et al., J. Phys. Soc. Jpn. 53 (1984) 3399.<br />
[9] TANAKA, H., et al., Jpn. J. Appl. Phys. 24 (1985) 644.<br />
[10] TANAKA, S., et al., in Plasma Physics <strong>and</strong> Controlled <strong>Nuclear</strong> Fusion Research 1986 (Proc.<br />
11th Int. Conf. Kyoto, 1986), Vol. 1, <strong>IAEA</strong>, Vienna (1987) 553.<br />
[11] NAKAMURA, M., et al., Nucl. Fusion 27 (1987) 779.<br />
[12] TANAKA, H., et al., Phys. Rev. Lett. 60 (1988) 1033.<br />
[13] IDE, S., et al., J. Phys. Soc. Jpn. 57 (1988) 2605.<br />
[14] IIDA, M., et al., J. Phys. Soc. Jpn. (to be published).<br />
[15] WESSON, J.A.i KIRBY, P., NAVE, M.F.F., in Plasma Physics <strong>and</strong> Controlled <strong>Nuclear</strong> Fusion<br />
Research 1986 (Proc. 11th Int. Conf. Kyoto, 1986), Vol. 2, <strong>IAEA</strong>, Vienna (1987) 3.
HEATING AND CONFINEMENT STUDIES<br />
WITH LOW FIELD SIDE ICRH IN TEXTOR<br />
<strong>IAEA</strong>-CN-50/E-II-l<br />
R.R. WEYNANTS 1 , J.-M. BEUKEN, L. DE KEYZER, T. DELVIGNE,<br />
P. DESCAMPS 2 , F. DURODIE, M. GAIGNEAUX, M. JADOUL,<br />
R. KOCH, D. LEBEAU, A.M. MESSIAEN 1 , J. ONGENA, X.M. SHEN 3 ,<br />
D. VAN EESTER 2 , R. VAN NIEUWENHOVE, G. VAN OOST,<br />
G. VAN WASSENHOVE, P.E. VANDENPLAS<br />
Laboratoire de physique des plasmas/Laboratorium voor Plasmafysica,<br />
Ecole Royale Militaire/Koninklijke Militaire School,<br />
Association Euratom-Etat Belge/Associatie Euratom-Belgische Staat,<br />
Brussels, Belgium<br />
G. BERTSCHINGER, P. BOGEN, Y. CAO 3 , H. CONRADS,<br />
K.-H. DIPPEL, H.G. ESSER, K.-H. FINKEN, G. FUCHS, B. GIESEN,<br />
E. GRAFFMANN, H. HARTWIG, E. HINTZ, F. HOENEN,<br />
K. HOTHKER, B. KARDON 4 , L. KONEN, M. KORTEN, Y.T. LIE,<br />
A. POSPIESZCZYK, D. RUSBULDT, U. SAMM, J. SCHLUTER,<br />
B. SCHWEER, H. SOLTWISCH, F.L. WAELBROECK, G. WAIDMANN,<br />
P. WIENHOLD, J. WINTER, G.H. WOLF<br />
Institut fur Plasmaphysik,<br />
Euratom-KFA Association,<br />
Kernforschungsanlage Jiilich GmbH,<br />
Julich, Federal Republic of Germany<br />
R.W. CONN, W.J. CORBETT, D.M. GOEBEL<br />
Institute of Plasma <strong>and</strong> Fusion Research<br />
<strong>and</strong><br />
Department of Mechanical, Aerospace<br />
<strong>and</strong> <strong>Nuclear</strong> Engineering,<br />
University of California, Los Angeles, California,<br />
United States of America<br />
Abstract<br />
HEATING AND CONFINEMENT STUDIES WITH LOW FIELD SIDE ICRH IN TEXTOR.<br />
New low field side antennas have been installed in TEXTOR. At the maximum available power<br />
of 2.6 MW a doubling of electron <strong>and</strong> ion temperature is now obtained at ne = 2.5 X 10 13 cm" 3 .<br />
Excellent conditions for density <strong>and</strong> impurity control are achieved with appropriate antenna phasing <strong>and</strong><br />
use of novel wall conditioning techniques. The low metallic pollution is particularly encouraging.<br />
' Research director at Fonds national de la recherche scientifique, Brussels, Belgium.<br />
2 EEC grantee at the Institut fur Plasmaphysik, KFA, Julich, Federal Republic of Germany.<br />
3 Institute of Plasma Physics, Academia Sinica, Hefei, China.<br />
4 Central Research Institute for Physics, Budapest, Hungary.<br />
571
572 WEYNANTS et al.<br />
Important anisotropic tails are produced, leading to an apparent lower confinement of the thermal<br />
plasma component but improved overall confinement. The tail also appears to play a role in sawtooth<br />
stabilization. Excellent agreement is further obtained between theory <strong>and</strong> experiment with respect to<br />
antenna coupling, wave absorption <strong>and</strong> tail production.<br />
1. INTRODUCTION<br />
With the installation of the ALT II pump limiter, the ICRH system of TEXTOR<br />
was converted from a high field side (HFS) to a low field side (LFS) launch. At the<br />
same time, an antenna spectrum shaping capability was provided by pairwise<br />
grouping of the total of four antennas, with each antenna in a pair fed in phase or<br />
out of phase with respect to the other. The out-of-phase or dipole mode of operation<br />
is found to be superior to the monopole in all aspects of plasma-wall interaction<br />
(density rise, impurity production) <strong>and</strong> hence in ease of ICRH operation. Quite<br />
significantly, the antenna coupling in the dipole mode is as good as, or even slightly<br />
better than, the monopole configuration.<br />
Wall <strong>and</strong> limiter conditioning plays an important role. Appropriate conditioning<br />
techniques prevent high recycling conditions leading to deteriorated confinement<br />
('detaching' conditions [1]) in Ohmic as well as in auxiliary heated discharges, <strong>and</strong><br />
strongly affect the RF induced increments in density <strong>and</strong> particle fluxes. By means<br />
of wall carbonization with the liner brought to a temperature of 400°C during<br />
tokamak discharges or, even better, wall boronization [2], the fraction of the radiated<br />
power during the application of ICRH drops substantially with respect to Ohmic<br />
discharges, <strong>and</strong> long pulse, low impurity operation is possible.<br />
The confinement scaling of the thermal part of the plasma energy remains in<br />
line with the TEXTOR scaling [3]. In addition, however, <strong>and</strong> in good agreement with<br />
theory, an energetic hydrogen tail is observed during the usual scenario of hydrogen<br />
minority heating in deuterium plasmas. At low density this tail contribution can<br />
significantly increase the incremental confinement time, as the tail confinement time<br />
is found to be about twice that of the thermal component.<br />
Several observations relate directly to the change in wave launching geometry.<br />
Firstly, the need for adequate wall preparation <strong>and</strong> antenna spectrum shaping is<br />
greater in the LFS mode. Secondly, the wave physics changes over from a mode<br />
conversion dominated regime with HFS launch to a predominantly minority heating<br />
mode in the LFS case. A detailed study is presented based on sawtooth analysis,<br />
power modulation experiments <strong>and</strong> hydrogen tail analysis. Finally, although the<br />
power density deposited in the electrons inside the q = 1 surface is very similar in<br />
the two cases, only the LFS mode allows for a significant increase in sawtooth period<br />
amplitude. The period appears to increase in proportion to the tail energy.
R 6<br />
<strong>IAEA</strong>-CN-50/E-IM<br />
0.5 10 1.5<br />
Ne(rr40cm) fio'cn<br />
FIG. 1. Specific loading resistance versus edge density at r = 40 cm (a = 46 cm). The lines are the<br />
computed results. The right ordinate gives the required antenna voltage VA to launch 1 MW.<br />
2. ANTENNA PROPERTIES<br />
The 3 MW of installed power are delivered to two antenna pairs, each one<br />
radially movable with respect to the plasma [4, 5], The antenna pairs are situated in<br />
diametrically opposite toroidal positions <strong>and</strong> are fed in phase (0) or out of phase (IT).<br />
•K phasing voids the antenna spectrum of less damped low toroidal wavenumbers<br />
kz [5]. The practical problem encountered in most experiments with ir phasing [6] is<br />
a sometimes strongly reduced loading with respect to the in-phase operation,<br />
resulting in more stringent voltage requirements. Figure 1 demonstrates that this<br />
need not always be the case: our experimental loading results for the ir phasing are<br />
even somewhat higher than for the 0 phasing. The voltage VA to be applied to a pair<br />
in order to launch 1 MW remains reasonably low, as can be seen on the right<br />
ordinate of Fig. 1. One also notes the good agreement with the specific resistance<br />
predicted by our coupling codes [5]. The beneficial effects of ir phasing to be<br />
reported in Section 4 are thus obtained without extra electrical solicitation of the<br />
ICRH system. The reasons for this are extensively discussed in Ref. [5].<br />
3. ELEMENTS FROM WAVE PHYSICS<br />
Changing from HFS to LFS launch is expected to switch the dominant heating<br />
scenario from mode conversion (MC) to minority heating (MH) <strong>and</strong> to strongly<br />
modify the wave absorptivity, as confirmed by detailed studies using a 1-D full wave<br />
code [7]. Figure 2(a) shows, for a typical plasma condition, the damping capability,<br />
defined as the fraction Ps of the launched power that is absorbed after the wave has<br />
made two transits over the plasma cross-section (e.g. from LFS to HFS back to LFS),<br />
for the old HFS scheme <strong>and</strong> the 0 <strong>and</strong> the ir LFS mode. The calculations are<br />
2.0<br />
573
574 WEYNANTS et al.<br />
05-<br />
(c)<br />
V.<br />
V<br />
DI "<br />
DE<br />
ME<br />
MI<br />
0.05 0.W<br />
FIG. 2. (a) Power deposited after two transits as a junction of minority concentration, (b, c) Distribution<br />
of total absorbed power between species <strong>and</strong> absorption mechanism (PKF = 1.5 MW), showing<br />
(b) the old <strong>and</strong> (c) the ir configuration. The common plasma conditions are ne0 = 4 X lO 13 cm' 3 ,<br />
Tt0 = 1.4keV, 7]-0 = 1.0keV, f = 29MHz.<br />
performed using the average lq of the relevant antenna spectrum. It is clear that the<br />
number of transits before total absorption, <strong>and</strong> therefore the likelihood of power<br />
deposition in the plasma edge, is strongly increased in the LFS schemes.<br />
Figures 2(b) <strong>and</strong> 2(c) show, as a function of minority concentration, for a<br />
typical plasma condition <strong>and</strong> PRF = 1.5 MW, the fraction of the total absorbed<br />
power fG received by the different plasma species <strong>and</strong> the identification of the<br />
receiving channel. We distinguish between the electrons receiving energy directly<br />
(DE) through MC or indirectly via minority heating (ME) <strong>and</strong> the majority ions being<br />
heated either directly (DI) by first harmonic damping (co = 2wcD) or via the<br />
minority tail (MI). The tail characteristics <strong>and</strong> the partition of the collisional transfer<br />
between electrons <strong>and</strong> ions are found from Ref. [8] using the power densities<br />
reported in Section 5 below. In agreement with the experiment, no substantial change<br />
in relative electron or ion heating can be expected below nH/n,, = 0.05 (the range<br />
favoured for experimentation because of high Ps).<br />
IT
<strong>IAEA</strong>-CN-50/E-II-l<br />
FIG. 3. Total radiated power (Prad) <strong>and</strong> part emitted from within r = a/2 (Prad,m) versus total input<br />
power Plo, for carbonized (C) <strong>and</strong> boronized (B) walls <strong>and</strong> different antenna phasings.<br />
4. LOW IMPURITY OPERATION AND DENSITY CONTROL<br />
The application of ICRH usually leads to an increased interaction with the walls<br />
(e.g. a rise in density, radiation <strong>and</strong> impurity concentration). As reported previously<br />
[9, 10], stationary low impurity conditions with modest density rises were<br />
achieved with the old HFS scheme; carbonization was an essential requisite. In the<br />
LFS mode of operation, with the same wall preparation techniques, the density<br />
control in particular turned out to be more dem<strong>and</strong>ing. This could be due to the lower<br />
bulk absorptivity indicated in Section 3. With further improved machine conditioning<br />
(carbonized walls at 400°C or boronization) <strong>and</strong> appropriate antenna phasing, conditions<br />
could be reached [5] which are even substantially better than those achieved<br />
with the old antennas. Under the optimal condition of boronization, density feedback<br />
control can maintain ne at a pre-ICRH level as low as 2.2 X 10 13 cm" 3 at<br />
PRF = 2.6 MW.<br />
Figure 3 shows the total radiation loss Prad (from bolometry) as a function of<br />
the total input power PI0I for different conditions. One notes that strong improvements<br />
can be achieved in y = Prad/Ptof Under all conditions y decreases with<br />
respect to its Ohmic value <strong>and</strong> can reach values as low as 0.2 with boronization. The<br />
575
576 WEYNANTS et al.<br />
3<br />
eff.o<br />
2<br />
1<br />
•<br />
\ \<br />
\<br />
s<br />
1<br />
'ne[10 13 cmT<br />
• OH<br />
» gF = 1.75 MW<br />
FIG. 4. Central Ztg versus nefor Ohmic <strong>and</strong> ICRH (P^ = 1. 75 MW) plasmas with boronized walls.<br />
plasma purity in the latter case can also be inferred from Fig. 4, showing Zeff on<br />
axis (from resistivity with q(0) = 0.85) for a density scan in OH <strong>and</strong> with ICRH at<br />
PRF = 1.75 MW. Of particular interest is the contribution of the metallic impurities<br />
to the radiation. To this end, we also show in Fig. 3 the part of the radiation coming<br />
from the plasma cross-section within half-radius Pra(j,i/2- For the highest power<br />
levels this part can remain as low as 6% of Ptot with boronization. These results <strong>and</strong><br />
supporting spectroscopic measurements show that excessive metal pollution, in<br />
particular from the carbonized stainless steel antenna Faraday screens (as observed<br />
in some other ICRH experiments [11]) can apparently be ruled out both with<br />
carbonization <strong>and</strong> boronization. These excellent conditions can be maintained during<br />
long pulse plasma operation, as illustrated in Fig. 5 showing a 2.3 MW shot lasting<br />
for 2 s. The analysis shows that Prad,[/2 is constant throughout the ICRH pulse, the<br />
gradual increase of Prad being due to enhanced radiation in the outer plasma layers,<br />
as confirmed by a gradual rise of O(VI) emission (not shown), which is presumably<br />
due to oxygen released from the limiters, subjected to a ninefold increased heat load.<br />
5. PERFORMANCE<br />
5.1. Central power density<br />
The power density deposited in the plasma centre pRF can be evaluated by<br />
different techniques. The part transferred via the electrons pRFe is found from the<br />
sawtooth heating rate [10] <strong>and</strong> from power modulation techniques, <strong>and</strong> the fraction<br />
given to the ions pRFii from the central ion power balance assuming neoclassical<br />
conductivity [10] <strong>and</strong> from modulation.<br />
The sawtooth <strong>and</strong> the modulation analyses both make it possible to discriminate<br />
between the power directly given to the species <strong>and</strong> that delayed by slowing down<br />
of the hydrogen tail. Upon RF switch-on a clear break develops in the temperature<br />
<strong>and</strong> density sawtooth (a 'broken' sawtooth) corresponding to the heating through
<strong>IAEA</strong>-CN-50/E-II-l 577<br />
1.0 2.0<br />
Time (s)<br />
FIG. 5. Time evolution of central line density ne0, central electron temperature Te0, diamagnetic<br />
energy Edia <strong>and</strong> radiated power Prajfor long pulse 1CRH with boronized walls (#32189).<br />
mode conversion, followed by a gradual heating over 10 to 20 ms dictated by the<br />
energy slowing down time T5 = TXTJ{TX + rsi) (see Fig. 6).<br />
The application of the power modulation technique is particularly challenging<br />
in view of the absence of a convenient ordering in the characteristic times: the<br />
slowing down of the electrons rse <strong>and</strong> of the majority ions rsi, the electron-ion<br />
equipartition Tei <strong>and</strong> the sawtooth repetition all occur on comparable time-scales.<br />
Defining the central energy densities we = 3/2 NKTe, W; = 3/2 NKTi <strong>and</strong> wmin for<br />
the tail contribution as well as the power densities pmc (to the electrons via mode<br />
conversion), p^,, (taken up by the minority) <strong>and</strong> p0H (Ohmic), we solve the<br />
equations:<br />
dt<br />
dwi<br />
~dt~<br />
•nin . Wm,n I Wmjn<br />
dt<br />
Tsi Tse<br />
W<br />
— = —^^ + Pmc + POH<br />
Te Tse<br />
~ W; + Wj,<br />
3.0
578<br />
WEYNANTS et al.<br />
2.06 2.10 2.14<br />
Time (s)<br />
FIG. 6. Time evolution of Te0 before <strong>and</strong> after RF switch-on at t = 2.102 s (PSF = 1.75 MW,<br />
iie = 2.6 x 10 u cm~ 3 ) (#32470).<br />
04<br />
0.3<br />
2 e,o<br />
0.2<br />
keV]<br />
0.1<br />
0<br />
\<br />
10 20<br />
F (Hzl<br />
(a)<br />
30 40<br />
0<br />
[degrees] \<br />
-90<br />
2.18<br />
• •<br />
(b)<br />
10 20 30 4<br />
F [Hz]<br />
FIG. 7. Amplitude (a) <strong>and</strong> phase (b) variation of modulated electron energy density weI versus modulation<br />
frequency (F = Q/2ir). The lines are the theoretical results yielding pme = 23, pmin e = 68,<br />
pmini = 92 (all in units of mW-cm' 3 -UVT 1 ). (PMI = 0.35 MW, P^o = 1.0 MW, rse = 30 ms,<br />
rsl = 22 ms, TC = T,- = Tmin = ».;<br />
Te, T, <strong>and</strong> Tmin are the central confinement times for electrons, deuterons <strong>and</strong> tail ions<br />
respectively. Linearization of the form X = Xo + X] exp (ifit) makes it possible to<br />
solve for the modulation frequency spectrum of the various quantities. The results<br />
of the procedure are the values of pmc <strong>and</strong> pmin yielding the best fit for the amplitude<br />
<strong>and</strong> phase variation of wel <strong>and</strong> wu with respect to Q, using computed values of TSC,<br />
Tsi <strong>and</strong> Tei. An example of fitting wel is given in Fig. 7. The interference of the<br />
sawtooth crash with the raw modulation signal [12] dem<strong>and</strong>s appropriate measures<br />
[13]. The sum of pmc <strong>and</strong> pminTs/7se then yields pRF,e, whereas pRF>i equals
<strong>IAEA</strong>-CN-50/E-II-l 579<br />
TABLE I. SUMMARY OF RESULTS FOR STANDARD HFS, LFS 0 AND<br />
LFS 7T OPERATIONS<br />
HFS<br />
LFS 0<br />
LFS ir<br />
nH/ne<br />
0.05<br />
0.02<br />
0.06<br />
A<br />
(mW-cra-'-MW 1 )<br />
225<br />
250<br />
200<br />
A: pRF = pRF e + pRF L; B: the percentage of A going to the electrons at the centre according to experiment;<br />
C: the percentage of A going to the electrons globally according to theory; D: the percentage of<br />
the total power input attributable to mode conversion centrally (experiment); E: the percentage of the<br />
total power input attributable to mode conversion globally (theory). For all three modes broad deposition<br />
profiles are obtained (compare with p0H = ±200 mW/cm 3 for 0.35 MW of OH).<br />
1.6<br />
(keVl XL<br />
0.8<br />
0.4<br />
H. t *><br />
°o<br />
•<br />
B<br />
65<br />
60<br />
45<br />
*• OH<br />
o 0<br />
C<br />
85<br />
75<br />
65<br />
1.75<br />
MW<br />
0 2 U 6<br />
M10 l3 cnf 3 ]<br />
FIG. 8. Central electron <strong>and</strong> ion temperature versus tfe for Ohmic <strong>and</strong> ICRH discharges<br />
(PRF = 1.75 MW).<br />
Good agreement is obtained between the different types of analysis. The results<br />
are summarized in Table I for the st<strong>and</strong>ard HFS conditions [10] as well as the LFS 0<br />
<strong>and</strong> ir operations.<br />
5.2. Heating <strong>and</strong> confinement<br />
Figure 8 shows a density scan of the central electron <strong>and</strong> ion temperatures for<br />
Ohmic discharges <strong>and</strong> with ICRH in the IT mode at PRF =1.75 MW. The heating<br />
efficiency neA(Te + Ti)/PRF reaches about 1.6 at high density (in units 10 13 cm" 3 ,<br />
eV <strong>and</strong> MW), in close agreement with earlier HFS results. At low density up to 40%<br />
-<br />
D<br />
60<br />
20<br />
10<br />
E<br />
80<br />
45<br />
30
580<br />
20<br />
EH.rh [kJl<br />
WEYNANTS et al.<br />
30 0 10<br />
tkJ]<br />
FIG. 9. Comparison between theoretical (solid line) <strong>and</strong> experimental tail energies for (a) Tmin = oo<br />
<strong>and</strong> (b) Tmm = 25 ms. Fair agreement is obtained for a tail confinement time of 25 + 5 ms.<br />
lower values are systematically observed. The same observation is made for the<br />
incremental confinement time Tinc of the kinetic energy Ekin, defined at constant<br />
density <strong>and</strong> considering only electrons <strong>and</strong> majority ions, which attains only at high<br />
density the usual TEXTOR scaling [3] value of 12.5 ms at Ip = 340 kA. At low<br />
density, however, the growing discrepancy between the diamagnetic energy Edia, the<br />
energy derived from the MHD equilibrium Eequi <strong>and</strong> the kinetic energy reveals the<br />
development of a significant tail of energy EH. If the latter had an infinite<br />
confinement time, its presence could not affect the energy balance for the thermal<br />
component, as all the power going to the tail would be passed on without loss to the<br />
electrons or the majority ions. We interpret the observed deficiencies in the thermal<br />
content as being due to the finite, though better than thermal (see Section 5.3),<br />
confinement of the tail.<br />
5.3. Energy <strong>and</strong> confinement of the minority tail<br />
The relations linking Edia, E^, Ekin <strong>and</strong> EH are well known: EH = a<br />
(Edia - Ekin) = (3 (Eequi - Ekin), with a = j3 = 1 for an isotropic tail or a = 213<br />
<strong>and</strong> /3 = 4/3 for an anisotropic purely perpendicular tail. Notwithst<strong>and</strong>ing the large<br />
error bars on the individual energy measurements, the data clearly favour /3/a = 2,<br />
thus confirming the tail's anisotropy. Using the power densities obtained in<br />
Section 5.1 <strong>and</strong> the power splitting between MC <strong>and</strong> MH given by theory, the tail<br />
energies found from the Stix model [8] can only be made to agree with the<br />
experimental values at high EH provided that a tail confinement time of 25 + 5 ms<br />
is introduced (see Fig. 9), i.e. about two times higher than that of the thermal<br />
component. As a result, inclusion of the tail component in the incremental confinement,<br />
such that 7*nc = (AEiun + EH)/Pinc, allows for an average improvement of<br />
30% with respect to the st<strong>and</strong>ard conditions [3].<br />
20
6. SAWTOOTH BEHAVIOUR<br />
<strong>IAEA</strong>-CN-50/E-II-l 581<br />
Switching over from HFS to LFS operation has also led to interesting<br />
differences in the sawtooth behaviour. Previously the sawtooth period could sometimes<br />
increase proportionally to the RF induced density rise, whereas under other<br />
circumstances it could decrease [14]. The relative modulation Te(max)/Te(min), on<br />
the other h<strong>and</strong>, retained roughly its Ohmic value. The present observations can be<br />
summarized as follows.<br />
In OH TEXTOR plasmas the modulation equals 1.1 to 1.15 <strong>and</strong> the period<br />
increases with density to saturate around 20 ms under strong gas puffing. Removal<br />
of the puffing leads to a peaking of the density profile at roughly constant ne leading<br />
to periods of 30 ms at the highest densities at Ip = 340 kA [1]. With LFS TT RF<br />
operation, the modulation can increase up to 1.4 (see Fig. 5) <strong>and</strong> the period can be<br />
stretched at a maximum rate of about 8 ms/MW at constant density. In comparing<br />
this difference in sawtooth behaviour it should be noted that no fundamental change<br />
has occurred in the power deposited centrally in the electrons, the deposition profile<br />
remaining equally broad. The period enhancement is, however, clearly related to the<br />
tail occurrence: the highest stretching rates are obtained when the energy in the tail<br />
is highest. An intriguing observation relates to the minority concentration: the same<br />
tail energy appears to lead to longer periods with increasing hydrogen content.<br />
Occasionally even longer, strongly modulated sawteeth are obtained lasting up to<br />
45 ms (see Fig. 8), reaching thus 3-4 incremental energy replacement times. No<br />
systematic picture is as yet available for their occurrence.<br />
REFERENCES<br />
[1] WEYNANTS, R.R., et al., Plasma confinement in attached <strong>and</strong> detached limiter tokamak<br />
plasmas, submitted to Nucl. Fusion.<br />
[2] TEXTOR TEAM, Paper <strong>IAEA</strong>-CN-50/A-VI-l, these Proceedings, Vol. 1.<br />
[3] VANDENPLAS, P.E., et al., "Confinement studies on TEXTOR with high power, long pulse<br />
ICRH", Plasma Physics <strong>and</strong> Controlled <strong>Nuclear</strong> Fusion Research 1986 (Proc. 11th Int. Conf.<br />
Kyoto, 1986), Vol. 1, <strong>IAEA</strong>, Vienna (1987) 485-493.<br />
[4] DURODIE, F., et al., "Installation, testing <strong>and</strong> first results of TEXTOR's new ICRH system",<br />
Proc. 15th Symp. on Fusion Technology, Utrecht, 1988.<br />
[5] MESSIAEN, A.M., et al., Effect of antenna phasing <strong>and</strong> wall conditioning on ICRH in<br />
TEXTOR, submitted to Plasma Phys. Control. Fusion.<br />
[6] BURES, M., et al., Plasma Phys. Control. Fusion 30 (1988) 149.<br />
[7] VAN EESTER, D., et al., in preparation.<br />
[8] STIX, T.H., Nucl. Fusion 15 (1975) 737-754.<br />
[9] WEYNANTS, R.R., et al., in Proc. 6th Topical Conf. on Radiofrequency Plasma Heating,<br />
Callaway Gardens, GA, 1985, AIP Conf. Proc. 129, p. 40.<br />
[10] MESSIAEN, A.M., et al., Plasma Phys. Control. Fusion 28 (1986) 71.
582 WEYNANTS et al.<br />
[II] JACQUINOT, J., et al., "High power ICRH heating in JET", Controlled Fusion <strong>and</strong> Plasma<br />
Heating (Proc. 15th Eur. Conf. Dubrovnik, 1988), Vol. 12B, European Physical Society (1988).<br />
[12] GIANNELLA, R., et al., Nucl. Fusion 28 (1988) 193-206.<br />
[13] LEBEAU, D., et al., in preparation.<br />
[14] WOLF, G.H., Plasma Phys. Control. Fusion 28 (1986) 1413.
<strong>IAEA</strong>-CN-50/E-II-2<br />
LONG PULSE HIGH POWER ION CYCLOTRON<br />
RESONANCE HEATING ON ASDEX<br />
J.-M. NOTERDAEME, F. RYTER, F. WESNER, B. BOMBA,<br />
H.-S. BOSCH, M. BRAMBILLA, K. BUCHL, A. EBERHAGEN,<br />
H.-U. FAHRBACH, O. GEHRE, O. GRUBER, H. HERRMANN,<br />
F. HOFMEISTER, G. JANESCHITZ, O. KLUBER, M. KORNHERR,<br />
R.S. LANG, V. MERTENS, E.R. MULLER, H. NIEDERMEYER,<br />
W. SANDMANN, K.-H. STEUER, F. WAGNER, J. BAUMLER,<br />
G. BECKER, W. BECKER, K. BRAU 1 , F. BRAUN, H. BRUHNS,<br />
R. BUCHSE, A. CARLSON, B. DE SUTTER 2 , G. DODEL 3 , R. FRITSCH,<br />
G. FUSSMANN, K.W. GENTLE 4 , J. GERNHARDT, L. GIANNONE,<br />
G. VON GIERKE, E. GLOCK, S. VON GOELER 5 , G. HAAS,<br />
J. HOFMANN, E. HOLZHAUER 3 , K. HUBNER 6 , A. KALLENBACH,<br />
F. KARGER, M. KAUFMANN, K. KRIEGER, K. LACKNER,<br />
G. LISITANO, M. LORCHER, H.M. MAYER, K. McCORMICK,<br />
D. MEISEL, H.D. MURMANN, A.B. MURPHY, J. NEUHAUSER,<br />
R. NOLTE, Y. OGAWA 7 , W. POSCHENRIEDER, S. PURI,<br />
D.E. ROBERTS 8 , H. ROHR, A. RUDYJ, F. SCHNEIDER,<br />
U. SCHNEIDER, E. SEVILLANO 9 , G. SILLER, E. SIMMET,<br />
F.X. SOLDNER, E. SPETH, A. STABLER, K. STEINMETZ 10 ,<br />
U. STROTH, N. TSOIS 11 , O. VOLLMER, H. WEDLER, H. WURZ 12<br />
Max-Planck-Institut fur Plasmaphysik,<br />
Euratom-IPP Association,<br />
Garching,<br />
Federal Republic of Germany<br />
Abstract<br />
LONG PULSE HIGH POWER ION CYCLOTRON RESONANCE HEATING ON ASDEX.<br />
Following the modifications made to ASDEX, <strong>and</strong> to the ICRF heating system to allow high power<br />
long pulse operation, it has been possible to extend the investigated parameter space to coupled powers of up to<br />
2.5 MW <strong>and</strong> to pulse lengths of up to 2 s. A new operating scenario, in which neutral injection is used only<br />
1<br />
Massachusetts Institute of Technology, Cambridge, MA, USA.<br />
2<br />
University of Ghent, Ghent, Belgium.<br />
3<br />
University of Stuttgart, Stuttgart, Federal Republic of Germany.<br />
4<br />
University of Texas at Austin, Austin, TX, USA.<br />
5<br />
Princeton University, Princeton, NJ, USA.<br />
6<br />
University of Heidelberg, Heidelberg, Federal Republic of Germany.<br />
7<br />
Nagoya University, Nagoya, Japan.<br />
8<br />
Atomic Energy Corporation of South Africa, Pretoria, South Africa.<br />
9<br />
General Atomics, San Diego, CA, USA.<br />
10<br />
Association "Euratom-Belgian State", Brussels, Belgium.<br />
" <strong>Nuclear</strong> Research Centre Demokritos, Attiki, Greece.<br />
12<br />
Kemforschungszentrum Karlsruhe, Karlsruhe, Federal Republic of Germany.<br />
583
584 NOTERDAEME et al.<br />
in the start-up phase of the ICRH, made possible long pulses with ICRH alone at high power. These<br />
experiments allowed the investigation of the plasma evolution on previously inaccessible time-scales. For the<br />
first time, ICRH in the second harmonic hydrogen regime (2 Wcn) <strong>and</strong> repetitive pellet refueling were<br />
successfully combined. The density profiles became peaked (ne(0)/ = 1.75) <strong>and</strong> the confinement time<br />
increased from 50 to 70 ms. H° <strong>and</strong> D° neutral beam healing were added to second harmonic heating. D° neutral<br />
injection occasionally resulted in large density increases, with only slight confinement lime improvement.<br />
Minority heating with D° injection produced similar density increases, but with peaked profiles <strong>and</strong><br />
confinement time improvement. H modes lasting 0.5 s were also obtained with D° neutrdl injection <strong>and</strong> D(H)<br />
minority heating. The ICRH power triggered the transition.<br />
1. INTRODUCTION<br />
Between April 1986 <strong>and</strong> April 1987, ASDEX was modified [1] to allow long pulse<br />
additional heating. The ICRH system was also upgraded : the generators can deliver Pgcn = 2 x<br />
2 MW [2], the two low field side antennas are now water cooled [3], <strong>and</strong> the voltage st<strong>and</strong>-off<br />
of transmission line components has been improved [4].<br />
The actual operating space has to date been extended from Pgen = 2.5 MW [5] to 3 MW<br />
for 0.5 s <strong>and</strong>, at Pgen = 2MW, from a pulse length of 1 s [5] to presently 2 s. The coupled<br />
power (PIC) is estimated to be 0.85 x P Experiments were performed at the second<br />
harmonic frequency of hydrogen (67 MHz) in various H/D mixtures, with <strong>and</strong> without H° or<br />
DO neutral injection <strong>and</strong> at the fundamental frequency (33.5 MHz) in D+ plasmas (npj/np = 10<br />
%) with D° injection. The vessel wall was carbonized <strong>and</strong> the parameters were: R = 1.67 m, a<br />
= 0.4 m, Ip = 380 kA, Bt (at 1.65 m ) = 2.42 T.<br />
In mis paper we report a novel scenario used to couple high power at 2 cH for long<br />
pulses, <strong>and</strong> for the first time results obtained in combination with repetitive pellet refueling.<br />
The confinement in the second harmonic <strong>and</strong> minority heating regimes is analysed. Finally H<br />
mode transitions obtained with ICRH + NI are discussed.<br />
2. BRIEF APPLICATION OF NI AT THE BEGINNING OF THE ICRH PULSE<br />
The turn-on of the ICRH is usually accompanied by a density increase, which leads, at<br />
high power, to a disruption. The effect can be partly alleviated by operation of ICRH in<br />
combination with NI. At a given ICRH power, the density increase is smaller with NI, <strong>and</strong><br />
the maximum RF power that can be coupled increases. However, combination with NI makes<br />
ICRH specific properties st<strong>and</strong> out less clearly. Recent experiments have shown that only a<br />
short NI pulse is required at the beginning of the ICRH pulse. At the turn-off of the Nl-pulse,<br />
the density still increases somewhat, but this density increase (also present without ICRH) is<br />
independent of the ICRH power. The reason for the favourable influence of the NI on the<br />
ICRH is still unclear although a number of explanations have been put forward [6-9].<br />
A further interesting observation [1] was that, after the NI is turned off, the antenna resistance<br />
<strong>and</strong> the reflected power change slowly on a long (Is) time-scale. This could be due to a slowly<br />
changing isotope concentration (the decrease in resistance, with increasing H concentration,<br />
would then indicate that eigenmodes play a role). However, a slow change of boundary<br />
density gradients cannot be excluded.<br />
3. RF HEATING AND PELLET REFUELING<br />
The long ICRH pulse, described above, that can be applied to an OH plasma after an<br />
initial NI pulse, was used to combine ICRH (PjC =1.4 MW; the absorbed power, for ICRH<br />
alone, is about 0.6 of PjC ) <strong>and</strong> pellet refueling (up to 15 pellets, every 67 ms, velocity 600<br />
m/s, mass = 1 x 10 20 D atoms). In contrast to other attempts to heat a pellet refueled plasma,<br />
we started pellet injection during the RF pulse. The resonance layer was located at r = 15 cm<br />
(with q = 1 at r = 13 cm <strong>and</strong> q = 2 at about r = 22 cm). Figure 1 presents some of the<br />
experimental traces on which two phases are clearly observed.
<strong>IAEA</strong>-CN-50/E-II-2 585<br />
23996<br />
2 3 0<br />
US] Us]—-<br />
FIG. J. Experimental traces showing the two phases in a discharge with pellet injection. Pellets are<br />
injected from 1.5 s to 2.5 s. The pellet repetition time is 67 ms. The transition from the first to the second<br />
phase occurs at the eighth pellet at 2 s. For the Qn (density peaking factor, nJ0)/(nt}) <strong>and</strong> Q, (temperature<br />
peaking factor, Te(0)KTt)) traces, the open circles indicate the values 3 ms after each pellet,<br />
<strong>and</strong> the filled triangles the values 54 ms after each pellet. The open squares are used for the times outside<br />
the pellet injection phases.
586 NOTERDAEME et al.
<strong>IAEA</strong>-CN-50/E-II-2 587<br />
TABLE I. a) COMPARISON OF H° INJECTION ALONE WITH<br />
H° INJECTION IN COMBINATION WITH ICRH; b) COMPARISON<br />
BETWEEN S2H°, S2D° AND SID 0 PHASES; c) MINORITY HEATING:<br />
COMPARISON OF TWO SHOTS WITH LARGE AND SMALL DENSITY<br />
INCREASES FOR COMPARABLE HEATING POWER.<br />
a)<br />
b)<br />
c)<br />
NI<br />
+ICRH<br />
S2H°<br />
S2D°<br />
SID 0<br />
S3<br />
S4<br />
P,o,<br />
(MW)<br />
2.05<br />
3.8<br />
2.04<br />
2.29<br />
2.38<br />
2.01<br />
2.26<br />
588 NOTERDAEME et al.<br />
with the time at which the sawteeth start to lock to the pellet period. There are also similarities<br />
to transitions from the SOC (saturated ohmic confinement) to the IOC (improved ohmic<br />
confinement) regime [13]. The transition could be consistently observed. The liming of the<br />
transition is related to the programming of the gas valve. An earlier closing of the gas valve<br />
leads to an earlier transition.<br />
4. HEATING AND CONFINEMENT<br />
4.1. Second harmonic heating<br />
4.1.1. Maximum heating power<br />
The maximum coupled RF power (PJC = 2.5 MW, 0.5s) was reached in combination<br />
with 2.05 MW H° injection leading to a total deposited heating power of 3.8 MW, almost<br />
equally divided between the two heating methods. Table I.a. compares plasma parameters of<br />
these L mode discharges without <strong>and</strong> with RF during stationary periods of 0.4 s duration.<br />
The profiles are similar in both phases <strong>and</strong> the confinement agrees with results<br />
previously reported [5], showing that the new divertor does not affect the confinement of<br />
ICRH L-discharges. The neutron rate increases by a factor of 4 with RF, of which a factor of<br />
1.7 is due to the density increase. When the RF is applied the plasma rotation decreases by<br />
30%. The increase of Zeff with RF is almost equally divided between oxygen, carbon <strong>and</strong><br />
iron. The concentrations or iron <strong>and</strong> titanium increase by a factor 2 <strong>and</strong> 5-10 respectively (the<br />
antenna Faraday screen is coated with TiC <strong>and</strong> the side protection plates of one antenna are<br />
made of titanium).<br />
4.1.2. Comparison of harmonic heating combined with Ho <strong>and</strong> Do injection<br />
We compared ICRH combined with H° <strong>and</strong> D° injection fired successively in the same<br />
discharge <strong>and</strong> separated by a time gap of 100 ms. In a first series (SI), an injection power<br />
scan (H° <strong>and</strong> D°) was performed, <strong>and</strong> the two phases are labelled S1H° <strong>and</strong> S1D°<br />
respectively. Unusual <strong>and</strong> reproducible density behaviour was observed in S1D°, as illustrated<br />
in Fig. 3.a. It must be noted that the density decreases in the middle of the stationary phase,<br />
before the heating ends <strong>and</strong> without any external change. Only ten ohmic D+ shots later <strong>and</strong><br />
with the same machine parameters, we made an extended RF power scan S2 (Pic= 0 to 2 MW)<br />
with PHo=0.85 MW (S2H) <strong>and</strong> PDo=l.l MW (S2DO), in which, however, the density<br />
remained constant (Fig. 3.b). The results of S1 <strong>and</strong> S2 are compared in Table I.b. Although<br />
the density <strong>and</strong> temperature peaking factors are very similar, the S1D° density profiles are<br />
slightly more triangular in the centre <strong>and</strong> steeper at the plasma edge, which may be related to<br />
0.7<br />
, , 24Q5O 24032<br />
-100<br />
- 50<br />
FIG. 3. Time evolution of the line averaged density (he), loop voltage (VJ, <strong>and</strong> plasma energy given<br />
by the diamagnetic loop (WJ for Prf = 0.85 MW, PDo = 1.1 MW <strong>and</strong> P,c = 1.4 MW. (a) Series<br />
SI: density increase in phase SID 0 ; (b) series S2: constant density.<br />
-100<br />
- 50
t<br />
a<br />
ce><br />
03<br />
E<br />
cs<br />
o.<br />
otal<br />
100<br />
90<br />
80<br />
70<br />
60<br />
50<br />
40<br />
30<br />
20<br />
10<br />
-<br />
-<br />
-<br />
1<br />
OH<br />
<strong>IAEA</strong>-CN-50/E-II-2 589<br />
0 1 2 3<br />
Total deposited heating power [MW] ><br />
FIG. 4. Plasma energy versus total deposited heating power (P,o, = P0H + 0.85 Pm + 0.7 Plc)<br />
for Plc scans (0-2 MW, second harmonic hydrogen heating). Squares are with hydrogen neutral injection<br />
(PHo = 0.85 MW, series S1H° <strong>and</strong> S2H°), T'£ C - 25 ms; circles with deuterium neutral injection<br />
without density increase (PD° = 1.1 MW, series S2D°), T'£ C = 30 ms; crosses with deuterium neutral<br />
injection with density increase (PDo = 1.1 MW, series SID 0 ). The lines give the jits for the incremental<br />
confinement time T'£ C .<br />
t<br />
590 NOTERDAEME et al.<br />
the small improvement in confinement. A comparison of heating properties of both ICRH<br />
combinations with H° or D° injection is given in Fig. 4, which shows that an offset linear<br />
scaling is followed. The slight difference of the incremental confinement times is attributed to<br />
isotope effects [14].<br />
Direct ion heating by ICRH could be measured in S2H° <strong>and</strong> S2D? where the relative<br />
contribution of the ions to the plasma energy increases with PJQ, whereas it is partly hidden by<br />
the large density increase in SID 0 . The neutron flux increases with Prc = 2 MW by factors of<br />
10 <strong>and</strong> 3.5 above the levels with injection for H° <strong>and</strong> D° respectively. For SID 0 , the neutron<br />
flux does not increase with ICRH.<br />
The total impurity level is higher in the D° than in the H° case, but the relative<br />
contribution of each impurity is similar in both phases <strong>and</strong> comparable to the discharges<br />
described in 4.1.1. The Zeff profile is flat, or somewhat hollow, as with NI, <strong>and</strong> 70 % of the<br />
radiated power originates from the outer plasma region (r > 20 cm). In the S2 series Zgff is<br />
10% higher than in S1 due to a somewhat higher content of metallic impurities, a consequence<br />
of the erosion of the carbonization. The magnitude of the density increase in the SID 0 phase<br />
depends on the heating power, but is not due to the impurity increase. The H a radiation at the<br />
plasma edge increases immediately with the density, indicating that the density behaviour<br />
cannot be explained by a confinement change. We know, however, from other studies [15],<br />
that small changes in recycling can affect transport features, perhaps related here to particular<br />
conditions of the carbonized wall <strong>and</strong> edge plasma.<br />
4.2. Minority heating<br />
Hydrogen minority heating at 33.5 MHz was performed in deuterium plasmas<br />
combined with D° injection. During the whole experimental period (10 weeks, 1500 shots)<br />
<strong>and</strong> despite CD4 carbonization <strong>and</strong> D2 <strong>and</strong> He glow discharges, the hydrogen concentration<br />
remained around 10%, probably due to a constant desorption in the divertor. Under these<br />
conditions, neutral injection was necessary for high power ICRH : with 2.0 MW <strong>and</strong> 1.1 MW<br />
D°-injection, the maximum RF power was 2.5 MW <strong>and</strong> 2.0 MW,respectively. The density<br />
increase with ICRH above the value with NI alone varied from 10% (series S3) to 50% (series<br />
S4), depending on the wall conditions. Table I.e. <strong>and</strong> Fig. 5 compare these two cases. In the<br />
large increase case (S4), the density profile becomes somewhat peaked <strong>and</strong> the plasma energy<br />
|<br />
t<br />
o<br />
£<br />
ai<br />
100<br />
80<br />
60 •<br />
20 •<br />
o<br />
" OH<br />
a<br />
X<br />
O<br />
A<br />
X<br />
X<br />
Do •**••* " O n B ^<br />
IC+D°<br />
D° H-Mode<br />
IC+D° H-Mode<br />
IC+D° High ne (S4)<br />
0 1 2 3<br />
Total deposited heating power [MW]<br />
FIG. 6. Energy confinement time versus total deposited heating power for minority heating <strong>and</strong> D°<br />
neutral injection L <strong>and</strong> H discharges.<br />
-
<strong>IAEA</strong>-CN-50/E-H-2 591<br />
<strong>and</strong> confinement time increase by 25 %. Figure 5 shows that the offset linear scaling is valid<br />
in both cases, indicating that the beneficial effect of the peaking does not degrade with the<br />
ICRH power in the range PJQ = 0-2 MW. The confinement time improvement from harmonic<br />
heating (S2) to minority heating (S3) is mainly due to the higher deuterium concentration, <strong>and</strong><br />
that observed between S3 <strong>and</strong> S4 is correlated with profile peaking.<br />
5. H-MODE WITH COMBINED ICRH AND NEUTRAL INJECTION<br />
Since the divertor modification, characterized by a higher by-pass conductance between<br />
divertor <strong>and</strong> main plasma chamber, the attainment of the H mode with NI alone requires more<br />
heating power than in the past, <strong>and</strong> the H phase is generally perturbed by frequent ELM's.<br />
Minority heating combined with D° injection in D+ plasmas (H/D = 10%) systematically<br />
brought the plasma into the H-mode for powers above (PIC=1.6 MW)+(PN1=1.87 MW) for a<br />
vertically centered plasma, <strong>and</strong> an H-phase of 0.25 s was obtained with PjC = 1.9MW. The<br />
H-transition was clearly triggered by the ICRH. This H-mode exhibited frequent ELM's which<br />
degrade the confinement time [16], which is not higher than for the high density shots (S4)<br />
presented in the previous paragraph (see Fig.6). Also shown for comparison is the<br />
confinement time for an H-mode due to injection alone in +2cm vertically shifted plasmas with<br />
similar ELM activity. In +2 or -2 cm shifted plasmas the H-phase lasted for the whole ICRH<br />
pulse (0.5 s), but the increased ELM frequency further degraded the confinement.<br />
It should be noted that the change in antenna resistance due to the H transition, which<br />
previously limited the experiments [17], could, in the present experiments, be h<strong>and</strong>led with the<br />
upgraded ICRH system.<br />
6. CONCLUSIONS<br />
Following the modification of ASDEX <strong>and</strong> the ICRH system, it has been possible to<br />
increase the ICRH pulse length <strong>and</strong> power. In particular, it was found that the beneficial effect<br />
of NI, observed in earlier experiments, could be exploited by application of the NI at the<br />
beginning of the ICRH pulse only. Long ICRH pulses achieved in this way also show<br />
changes which are not visible in short pulses. The combination of ICRF heating with pellet<br />
refueling yielded peaked density profiles with increases in confinement time <strong>and</strong> neutron rates,<br />
without impurity accumulation.<br />
Heating <strong>and</strong> confinement studies of hydrogen second harmonic heating combined with<br />
either H° or D° injection in various hydrogen/deuterium mixtures did not show any<br />
fundamental differences of the global properties. The application of D(H) minority hearing,<br />
combined with D° injection, exhibits better confinement than the harmonic heating due to<br />
density profile peaking. More generally, we showed that it is possible to peak the density<br />
profile using ICRH combined with neutral injection in the power range studied here, leading to<br />
an improvement of the confinement time. This effect depends critically on plasma edge<br />
properties.<br />
It was further confirmed that sufficient ICRH power (at present in combination with NI)<br />
could bring the plasma into the H mode, <strong>and</strong> that the improved design of the system made it<br />
possible to withst<strong>and</strong> the transition.<br />
ACKNOWLEDGEMENTS<br />
The authors wish to thank the members of the technical <strong>and</strong> operations teams of<br />
ASDEX, the ion cyclotron heating group, the neutral injection group <strong>and</strong> the pellet group.<br />
REFERENCES<br />
[1] NIEDERMEYER H. et al., "Long pulse heating of ASDEX plasmas", Controlled Fusion <strong>and</strong> Plasma<br />
Heating (15th Eur. Conf., Dubrovnik, 1988) to be published in Plasma Physics <strong>and</strong> Controlled Fusion,<br />
<strong>and</strong> IPP HI/136, Max-Planck-Instilut fiir Plasmaphysik (1988).<br />
[2] SCHMINKE W., WYSS }., WESNER F., BRAUN F., "Upgrading of ICRH generators for<br />
ASDEX/WVII <strong>and</strong> ASDEX Upgrade", Fusion Engineering (12th Symp., Monterey, 1987), Vol.1 , IEEE,<br />
Piscataway, NJ (1987) 383-384
592 NOTERDAEME et al.<br />
13] NOTERDAEME J.-M. et al., "The ASDEX ICRF antennae in their uncooled <strong>and</strong> cooled versions",<br />
Fusion Technology (14th Symp., Avignon, 1986), Vol.1, Pergamon Press, Oxford (1986) 795-800.<br />
[4] WEDLER H. et al., "Technical <strong>and</strong> operational experience with the long pulse 1CRH Transmission on<br />
ASDEX", to be presented at the 15th symposium on Fusion Technology, Utrecht, 1988.<br />
[5] STEINMETZ K. et al., "Ion cyclotron resonance heating <strong>and</strong> lower hybrid experiments on ASDEX",<br />
Plasma Physics <strong>and</strong> Controlled <strong>Nuclear</strong> Fusion Research, (1 lth Int. Conf., Kyoto, 1986), Vol. 1, <strong>IAEA</strong>,<br />
Vienna (1987) 235.<br />
[6] JANESCMTZ G. et al., "Impurity production during ICRF heating". Controlled Fusion <strong>and</strong> Plasma<br />
Physics (13th Eur. Conf., Schliersee, 1986), Europhysics Conference Abstracts Vol. 10 C, part I,<br />
(KAUFMANN M, BRIFFOD G., ed.), EPS (1986) 407-410.<br />
[7] NOTERDAEME J.-M. et al., "Plasma edge effects with ICRF in ASDEX", Controlled Fusion <strong>and</strong><br />
Plasma Physics (14th Eur. Conf., Madrid, 1987), Europhysics Conference Abstracts Vol. 11 D, part II,<br />
(ENGELMANN F., ALVAREZ RIVAS J.L., ed.), EPS (1987) 678-681.<br />
[8] VAN NIEUWENHOVE R. et al., "Parametric decay in the edge plasma of ASDEX during fast wave<br />
heating in the ion cyclotron frequency range", Nucl. Fusion 28 (1988) 1603.<br />
[9] NOTERDAEME i .-M. et al., "Parametric decay in the edge plasma of ASDEX during fast wave heating in<br />
the ion cyclotron frequency range", Controlled Fusion <strong>and</strong> Plasma Heating (15th Eur. Conf., Dubrovnik,<br />
1988). Europhysics Conference Abstracts Vol. 12 B, part II. (PESlC S., JAQUINOT J., ed.), EPS<br />
(1988)762-765.<br />
[10] BUCHL K., VLASES G.C., SANDMANN W., LANG R., Correlation of pellet penetration depth on<br />
ASDEX for ohmic <strong>and</strong> auxiliary discharges, Nucl. Fusion, 27 (1987) 1939-1945.<br />
[11] CARLSON et al., "Mass loss with pellet refuelling on ASDEX during neutral injection heating",<br />
Controlled Fusion <strong>and</strong> Plasma Heating (15th Eur. Conf., Dubrovnik, 1988), Europhysics Conference<br />
Abstracts Vol. 12 B, part III, (PESit S., JAQUINOT J., ed.), EPS (1988) 1069-1072.<br />
[12] MERTENS V. et al., "Improvement of beam heated discharges by repetitive pellet fuelling in ASDEX",<br />
Controlled Fusion <strong>and</strong> Plasma Healing (15th Eur. Conf., Dubrovnik, 1988), Europhysics Conference<br />
Abstracts Vol. 12 B, part I, (PESIC S., JAQUINOT J., ed.), EPS (1988) 39-42.<br />
[13] MULLER E.R. ct al., " Improved Confinement al high densities in Ohmically heated <strong>and</strong> gas refueled<br />
divertor discharges is ASDEX" Controlled Fusion <strong>and</strong> Plasma Heating (15th Eur. Conf., Dubrovnik,<br />
1988), Europhysics Conference Abstracts Vol. 12 B, part I, (PESIC S., JAQUINOT J., ed.), EPS (1988)<br />
19-22.<br />
[14] MURMANN H., WAGNER F. et al., "The isotope dependence of global confinement in Ohmically <strong>and</strong><br />
auxiliary heated ASDEX plasmas", Controlled Fusion <strong>and</strong> Plasma Heating (15th Eur. Conf., Dubrovnik,<br />
1988). Europhysics Conference Abstracts Vol .12 B, part I, (PE§IC S., JAQUINOT J., ed.), EPS (1988)<br />
3-6.<br />
[15] FUSSMANN G., Paper <strong>IAEA</strong>-CN-S0/A-III-1, these Proceedings, Vol. 1.<br />
[16] WAGNER F. et al., "The power dependence of Tg in the H-mode of ASDEX", Controlled Fusion <strong>and</strong><br />
Plasma Heating (15th Eur. Conf., Dubrovnik, 1988), Europhysics Conference Abstracts Vol. 12 B, part<br />
I, (PESIC S.. JAQUINOT J., cd.), EPS (1988) 207-210.<br />
[17] STEINMETZ el al.. Observation of the H mode with ion cyclotron resonance heating on ASDEX, Phys.<br />
Rev. Lett. 58 (1987) 124.
<strong>IAEA</strong>-CN-50/E-n-3<br />
EXPERIMENTAL AND THEORETICAL STUDIES OF<br />
ION CYCLOTRON HEATING ON JET<br />
D.F.H. START, V.P. BHATNAGAR, D.A. BOYD 1 , M. BURES,<br />
D.J. CAMPBELL, J.P. CHRISTIANSEN, P.L. COLESTOCK 2 ,<br />
J.G. CORDEY, W. CORE, G.A. COTTRELL, L.G. ERIKSSON 3 ,<br />
M.P. EVRARD 4 , T. HELLSTEN, J. JACQUINOT, O.N. JARVIS,<br />
S. KISSEL, S. KNOWLTON 5 , H.W. LEAN 6 , P.J. LOMAS, C. LOWRY,<br />
A.L. MCCARTHY 7 , P. NIELSEN, J. CROURKE, G. SADLER,<br />
A. TANGA, P.R. THOMAS, K. THOMSEN, B. TUBBING,<br />
P. VAN BELLE, J.A. WESSON<br />
JET Joint Undertaking,<br />
Abingdon, Oxfordshire,<br />
United Kingdom<br />
Abstract<br />
EXPERIMENTAL AND THEORETICAL STUDIES OF ION CYCLOTRON HEATING ON JET.<br />
Minority ICRF experiments are described which exploit the special features of highly localised<br />
heating <strong>and</strong> fast ion production. Power modulation during sawtooth stabilised periods has provided<br />
power deposition profiles, direct electron heating fractions <strong>and</strong> electron thermal diffusion coefficients<br />
inside the q = 1 surface. 3 He-D fusion reaction experiments with energetic 3 He minority ions have<br />
produced 60 kW of fusion power (Q = 0.5%). These results agree well with both a Stix model <strong>and</strong><br />
a combined global wave/Fokker-Planck model. On-axis ICRH during the current rise of high current<br />
discharges (Ip > 5 MA) has achieved central electron temperatures <strong>and</strong> D-D reaction rates up to twice<br />
as high as those obtained with heating in the current flat-top. The first JET H-modes with substantial<br />
combined RF <strong>and</strong> neutral beam injection heating have been produced in a double-null X-point<br />
configuration.<br />
l. INTT-JODUCTION<br />
Ion Cyclotron Resonance Heating (ICRH) on JET has reached<br />
a coupled power level of 18MW in limiter discharges. Such<br />
heating has achieved central electron <strong>and</strong> ion temperatures of<br />
11.5keV <strong>and</strong> 8keV respectively, with H or He 3 minority heating of<br />
pellet fuelled plasmas in which the peaked density profile was<br />
1 University of Maryl<strong>and</strong>, College Park, MD, USA.<br />
2 Plasma Physics Laboratory, Princeton University, Princeton, NJ, USA.<br />
3 Chalmers University of Technology, Goteborg, Sweden.<br />
4 Plasma Physics Laboratory, Association "Euratom-Belgian State", ERM/KMS, Brussels,<br />
Belgium.<br />
5 Massachusetts Institute of Technology, Cambridge, MA, USA.<br />
6 UKAEA, Culham Laboratory, Abingdon, Oxfordshire, United Kingdom.<br />
7 Flinders University, Bedford Park, South Australia, Australia.<br />
593
594 START et al.<br />
sustained for 1.2 sec. During this time the electron thermal<br />
transport was approximately halved [1,2]. A plasma energycontent<br />
of 7MJ has been attained with 13MW of RF power in a 5MA.<br />
limiter discharge <strong>and</strong> about 0.7MJ of this energy resides in the<br />
H minority ions [2] . These energetic ions are presently thought<br />
to be a possible stabilising agent responsible for 'Monster 1<br />
sawteeth [3,4]. Sawtooth-free periods have been produced by<br />
ICRH for up to 3 sees in deuterium <strong>and</strong> helium plasmas with<br />
either H or He 3 minority ions <strong>and</strong> occur for safety factors cu,-,<br />
^ 3.3 [5] . At Qcyi ^ 3.3, optimum values of the incremental<br />
confinement time are found in RF heated limiter discharges.<br />
This effect is consistent with on-axis power deposition <strong>and</strong> a<br />
thermal diffusivity, Xe' which decreases with increasing plasma<br />
current but increases as the size of the q = 1 surface increases<br />
[6] . Most recently combined RF + NBI (neutral beam injection)<br />
experiments have obtained D-D reaction rates up to 2.2 x 10 16<br />
s" 1 in low density, inner wall plasmas [7] . In all the above<br />
experiments, the localised on-axis RF power deposition <strong>and</strong> the<br />
energetic minority ions play a key role. These aspects are also<br />
central to three of the studies presented in this paper, namely:<br />
RF power deposition <strong>and</strong> heat transport measurements using power<br />
modulation during sawtooth-free periods; He 3 -D fusion<br />
experiments with He 3 minority energies in the MeV range; <strong>and</strong><br />
improved heating of 5MA discharges by ICRH in the plasma current<br />
rise phase. The final section describes recent results of RF<br />
heating of double-null X-point plasmas.<br />
2. MODULATION EXPERIMENTS DURING MONSTER SAWTEETH<br />
Sawtooth-free periods enable power deposition profiles <strong>and</strong><br />
electron transport to be studied inside the q = 1 surface without<br />
the complications caused by internal disruptions either<br />
locking to the modulation [8] or redistributing fast ions [9] .<br />
Experiments have been carried out with (H)He 3 <strong>and</strong> (He 3 )D minority<br />
heating schemes <strong>and</strong> an example of the latter is described<br />
here. The deuterium limiter discharge parameters were as<br />
follows: plasma current, Ip = 2MA, central toroidal field,<br />
BT= 3.4T, elongation, b/a = 1.5, central electron density,<br />
ne(0) = 4.2 x 10' 19 irr 3 , He 3 concentration, ^3 = 3 x 10 18 rrr 3<br />
<strong>and</strong> effective ionic charge state, Zeff = 1.9. The ICRH was<br />
applied with monopole phasing at a frequency of 32MHz to give<br />
on-axis heating. The power was square wave modulated at 4Hz<br />
between 6MW <strong>and</strong> 9MW. The response in the central electron<br />
temperature, TQ(0) during the 1.5s" sawtooth-free period was a<br />
triangular modulation with an amplitude of 0.25keV about a<br />
steady value of 7.7keV. The electron temperature profile was<br />
measured by a 12 channel ECE polychromator <strong>and</strong> the amplitude<br />
(Fig. la) <strong>and</strong> phase (Fig. lb) of the 4Hz component Tewas<br />
extracted by Fourier analysis. The amplitude is peaked in the
§<br />
1PUTUDE (<br />
$<br />
#•14613<br />
200<br />
(a)<br />
180 -<br />
160<br />
140<br />
120<br />
100<br />
80<br />
60<br />
40<br />
20<br />
' //*'<br />
-<br />
180 -<br />
•7
596 START et al.<br />
300<br />
200<br />
Te (eV)<br />
100<br />
Te (eV)<br />
-100<br />
0.1 0.2<br />
TIME (s)<br />
FIG. 2. Comparison of 'box-car' averaged signals at R = 3.26 m <strong>and</strong> R = 2.93 m with model<br />
calculations.<br />
plasma centre <strong>and</strong> is almost gaussian in shape with a maximum of<br />
200eV <strong>and</strong> an e-folding width of 0.3m. The phase lag with<br />
respect to the RF power is close to 90° on axis <strong>and</strong> increases<br />
with increasing minor radius.<br />
These results have been modelled by solving the heat<br />
diffusion equation for electrons in cylindrical geometry. The<br />
source term consisted of direct electron heating (by TTMP, electron<br />
L<strong>and</strong>au damping <strong>and</strong> mode conversion) <strong>and</strong> indirect heating by<br />
collisions with the minority ions. For simplicity, each component<br />
was assumed to be gaussian in profile with a width, W. The<br />
direct heating power density (50kW nr 3 on axis) was obtained<br />
from the changes in (8Te/3t) at the RF switch-up (<strong>and</strong> switchdown)<br />
times so that the only free parameters in the model were W<br />
<strong>and</strong> Xe-
<strong>IAEA</strong>-CN-50/E-II-3 597<br />
The results of the calculations are shown in Figs, la <strong>and</strong><br />
lb for pairs of values of x^ <strong>and</strong> W which fit both the amplitude<br />
<strong>and</strong> phase data. Values of Xg less than 1.4m 2 s" 1 <strong>and</strong> greater<br />
than 2.8m 2 s- 1 lead, respectively, to too large <strong>and</strong> too small<br />
values of the peak Te amplitude. The observed modulated waveforms<br />
are also well reproduced when the exact power waveform is<br />
used as shown by the 'box-car' averaged signals in Fig. 2. The<br />
acceptable range of Xe values depends on our assumption that all<br />
the coupled power appears as central heating. A check on this<br />
is given by the modulation on the Shafranov (F^j) <strong>and</strong> diamagnetic<br />
(^ia) energy measurements. The total energy &<br />
given by:<br />
<strong>and</strong>, for IDTE >> 1 (TE is the energy confinement time <strong>and</strong> u> is<br />
the modulation frequency) > the power is determined from<br />
FYot = wfetoi. In the present case p£Ot is found to be 75% of<br />
the coupled RF power which, when taken into account, reduces the<br />
model values of Te by 15 - 20% <strong>and</strong> improves the fit for Xg =<br />
l.to^s" 1 <strong>and</strong> W = 0.19m. However, such a low value of Xe<br />
disagrees somewhat with a transport analysis fit to the steady<br />
temperature which favours xe x 31115s- 1 . The values of W<br />
(Fig. la) are somewhat less than that (0.2m) predicted by selfconsistent<br />
global wave <strong>and</strong> Fokker- Planck calculations [10] .<br />
This code also gives a central direct heating power density<br />
(TTMP + ELD) of 30kW'nr 3 compared with 50kW-nr 3 observed. The<br />
difference could be made up by mode conversion which is<br />
estimated at about 15% of Ptot but as yet its profile cannot be<br />
predicted.<br />
3. He 3 - D FUSION YIELD MEASUREMENTS<br />
The fusion reaction He 3 + D - He 4 (3.6MeV) + p (14.7MeV)<br />
has been studied using (He 3 )D minority ICRH in limiter plasmas<br />
with the following parameters: 2.5 < Ip(MA) < 4.5,<br />
3.1 < BT(T) < 3.4, 3 x 10 19 irr 3 < n (0) < 6 x 10 19 irr 3 <strong>and</strong><br />
1% < nHe3/ne < 4%. RF power levels up to 15MW were coupled at a<br />
frequency of 32MHz <strong>and</strong> with the He 3 fundamental cyclotron<br />
resonance within 0.1m of the magnetic axis. The reaction rate<br />
was measured by detecting the weak r-ray branch from the<br />
16.6Mev level in Li 5 using Nal <strong>and</strong> BGO scintillators [9]. An<br />
example of the T~ray spectra is given in Fig. 3a. The count<br />
rate is a rapidly increasing function of the RF power as shown<br />
in Fig. 3b, where the maximum value corresponds to 2 x 10 16<br />
reactions per second, a fusion power of 60kW <strong>and</strong> a Q (=<br />
pp) value of 0.5%.
598 START et al.<br />
GAMMA<br />
YIELD<br />
COUNTS/S<br />
1000-<br />
4.4MeV<br />
D + plasma C 3 He ICRH)<br />
16.5 MeV<br />
5 10 15<br />
Gamma energy (MeV)<br />
2 10<br />
PnF(MW)<br />
20<br />
Mi mi*! n T<br />
Pfus(kW)<br />
FIG. 3. (a) Gamma rays from the decay of the 16.66 MeV state of ! U to the ground (So) <strong>and</strong> first (S,)<br />
excited states; (b) fiision power <strong>and</strong> gamma ray intensity versus RF power.
to V. (a)'<br />
• \ \<br />
\ \<br />
\ \<br />
w<br />
\'\<br />
\\\\/<br />
/<br />
/<br />
A<br />
V \<br />
1<br />
/ \<br />
/ \<br />
i<br />
\<br />
*<br />
<strong>IAEA</strong>-CN-50/E-II-3 599<br />
dF /dr<br />
1<br />
Q2<br />
Radius (m) .RcalcW- He) (s L ><br />
FIG. 4. (a) Model profiles of power density, 3 He tail temperature <strong>and</strong> fusion yield, normalized to onaxis<br />
values; (b) comparison of measured <strong>and</strong> calculated reaction rates.<br />
The results have been compared with both a Stix model [11]<br />
<strong>and</strong> the more sophisticated, combined wave absorption <strong>and</strong> Fokker-<br />
Planck calculation [10], In the Stix model the reaction rate R<br />
inside a flux surface of minor radius r is given by:<br />
R = 2 x 10 ls<br />
(A/Z 2 lnA) ov >/Ttrdr (2)<br />
in which A <strong>and</strong> Z are the atomic mass number <strong>and</strong> charge of the<br />
minority ions, nD is the deuterium density, Pd is the RF power<br />
density, < ov > is the rate coefficient averaged over the<br />
distribution functions <strong>and</strong> TV is the He 3 tail temperature. The<br />
reaction rate was calculated using the observed profiles of T<br />
<strong>and</strong> ne <strong>and</strong> a gaussian power density profile with a width of 0.2m<br />
consistent with the modulation experiments <strong>and</strong> power deposition<br />
calculations. Typical radial profiles of P^, Tt <strong>and</strong> dR/dr (the<br />
reaction rate for each flux surface) are shown in Fig. 4a. Note<br />
that the maximum contribution to the reaction rate is 0.26m off<br />
axis where the tail temperature is ^ 0.5MeV. In the centre, Tt<br />
is 5IVfeV <strong>and</strong> a large fraction of the He 3 ions have energies<br />
beyond that at which the cross-section peaks. The reduction of<br />
the slope of the fusion yield curve at high RF power (Fig. 3b)<br />
is due to this overheating of the minority ions so that an<br />
improvement may be gained by tailoring P^ using several RF<br />
frequencies, for example.<br />
The observed <strong>and</strong> predicted reaction rates are compared in<br />
Fig. 4b. In the calculations, the fraction of the coupled RF<br />
power absorbed by the He 3 minority ions was taken to be 65%<br />
which was found to best reproduce the observed fast ion energy
600 START et al.<br />
45<br />
t(S)<br />
Onset of sawtooth<br />
activity<br />
27 32<br />
(1O l3 W-m 3 )<br />
FIG. 5. (a) Central electron temperature <strong>and</strong> safety factor, q (0), during ICRH in the current rise phase.<br />
Curves Q, © <strong>and</strong> © are for RF power levels of zero, 4.3 MW <strong>and</strong> 11 MW, respectively; (b) comparison<br />
of TJO) values obtained during the current rise <strong>and</strong> flat-top phases.<br />
content <strong>and</strong> is in reasonable agreement with the modulation<br />
experiments (^ot ^ 0- 75 ^c
<strong>IAEA</strong>-CN-50/E-II-3 601<br />
cccurs progressively later In time as Te(0) <strong>and</strong> the RF power are<br />
increased. In this case, (H)D minority heating (dipole phasing)<br />
was used at 48MHz <strong>and</strong> Bj = 3.IT. At 43s the plasma current was<br />
3MA. <strong>and</strong> reached its steady value of 5MA. at 47.2s. The<br />
saturation of the current penetration is shown by the<br />
polarimetric measurement of the central safety factor q(0). The<br />
first sawtooth crash occurs when q(0) is close to unity but note<br />
that the reduction in Tg(0) is large (2 - 3keV) implying that<br />
q(0) = 1 over a substantial part of the plasma core. This is<br />
supported by Te profile measurements which show the inversion<br />
radius to be ^ 40cm compared with \ 15cm for the ohmic discharges<br />
at the first sawtooth crash. In this respect, the crash<br />
is characteristic of Monster sawteeth, <strong>and</strong> indeed a Monster sawtooth<br />
has been seen following normal sawteeth during the current<br />
rise of a 6MA discharge. Thus both current profile effects <strong>and</strong><br />
the stabilisation mechanism responsible for Monster sawteeth are<br />
apparently involved in enhancing these discharges.<br />
The improvements gained from this method of operation are<br />
a large increase (a factor ^ 2 in the best case) in Te(0) as<br />
shown in Fig. 5b, an increase in T^(0) by 10 - 20%, a similar<br />
improvement in the incremental confinement time <strong>and</strong> almost a<br />
factor of 2 gain in neutron yield from D-D reactions for RF<br />
power levels in excess of 13MW.<br />
5. X-POINT DISCHARGES WITH ICRH<br />
The double-null X-point geometry in JET provides a good<br />
match between the curvature of the antennae <strong>and</strong> the last closed<br />
flux surface <strong>and</strong> allows RF power to be coupled at plasma-limiter<br />
separations greater than the minimum of 3cm required for H-mode<br />
formation. With this configuration H-modes have been obtained<br />
in 3MA. discharges using combined NBI <strong>and</strong> central (H)D minority<br />
ICRH at power levels in the region of 8MW <strong>and</strong> 6KW, respectively.<br />
Comparisons with beam-only H-modes show that the rate of rise of<br />
the radiation is greater (typically by a factor of two) with<br />
combined heating <strong>and</strong> this has the effect of shortening the<br />
H-mode, since the H-L transition occurs when Prac=[= p tot* ^- so '<br />
the confinement time in the combined heating case is reduced by<br />
typically 30%. With RF heating alone, the Da light indicates<br />
short periods (^ 0.5s) of reduced deuterium recycling characteristic<br />
of H-mode formation. Following such periods the radiation<br />
decreases substantially <strong>and</strong> dru/dt changes sign indicating<br />
a sudden reduction in particle confinement. Both effects are<br />
seen after the H-L transition in beam heated plasmas. However,<br />
in the RF only case, the 'pedestal' edge electron temperature of<br />
0.3keV is less than the H-L transition temperature (^ 0.5keV)
602 START et al.<br />
<strong>and</strong> the energy confinement of 0.3s is symptomatic of an L-mode.<br />
So far, only a few attempts have been made to study H-modes with<br />
ICRF or coribined heating <strong>and</strong> as yet the reason for the poorer<br />
H-modes is not completely understood. If impurities are the<br />
cause, then the new beryllium antenna screens could be greatly<br />
beneficial.<br />
6. SUMMARY<br />
The spatial extent of the ICRF power deposition <strong>and</strong> the<br />
ratio of direct to indirect electron heating have been obtained<br />
from modulation experiments <strong>and</strong> agree reasonably well with<br />
global wave calculations. Values of Xe have also been deduced<br />
<strong>and</strong> are somewhat smaller than those given by transport analysis<br />
of the steady state. The acceleration of minority ions by ICRF<br />
to high energies has been utilised to produce 60kW of fusion<br />
power by the He 3 -D reaction which agrees with theoretical<br />
expectations. Cm-axis heating during the current rise phase has<br />
substantially improved the performance of high current<br />
discharges. The best use of the ICRH peaked deposition so far<br />
has been to reheat the peaked density profiles produced by<br />
pellets [1,2] which benefit from good central confinement <strong>and</strong><br />
yield one of the highest nDxETi(0) values obtained so far in<br />
JET.<br />
7. ACKNOWLE3X3EMENTS<br />
We wish to acknowledge the assistance of all our colleagues<br />
in the JET team. Particular thanks go to the tokamak<br />
operating team <strong>and</strong> to the members of the diagnostic groups contributing<br />
to these measurements.<br />
REFERENCES<br />
[1] SCHMIDT, G.L., et al., Paper <strong>IAEA</strong>-CN-50/A-IV-l, these Proceedings, Vol. 1.<br />
[2] JACQUINOT, J., et al., High power ion cyclotron heating in JET, Plasma Phys. Controll. Fusion<br />
(to be published).<br />
[3] COPPI, B., HASTIE, R.J., MIGLIOLO, S., PEGORARO, F., PORCELLI, F., Suppression of<br />
internal plasma oscillations by trapped high energy nuclei, Phys. Lett., A (to be published).<br />
[4] WHITE, R.B., RUTHERFORD, P.H., COLESTOCK, P., BUSSAC, M.N., Phys. Rev. Lett.<br />
60 (1988) 423.
<strong>IAEA</strong>-CN-50/E-II-3 603<br />
[5] CAMPBELL, D.J., et al., Paper <strong>IAEA</strong>-CN-50/A-VII-2, these Proceedings, Vol. 1.<br />
[6] BHATNAGAR, V.P., et al., in Controlled Fusion <strong>and</strong> Plasma Heating (Proc. 15th Eur. Conf.<br />
Dubrovnik, 1988), Vol. 12B, Part I, European Physical Society (1988) 358.<br />
[7] THOMAS, P.R., et al., Paper <strong>IAEA</strong>-CN-50/A-IV-4, these Proceedings, Vol. 1.<br />
[8] GAMBIER, D.J., et al,, ICRF power deposition profile <strong>and</strong> determination of xe by modulation<br />
experiments in JET, submitted to Nucl. Fusion.<br />
[9] SADLER, G., JARV1S, O.N., VAN BELLE, P., ADAMS, J.M., in Controlled Fusion <strong>and</strong><br />
Plasma Heating (Proc. 15th Eur. Conf. Dubrovnik, 1986), Vol. 12B, Part I, European Physical<br />
Society (1986) 131.<br />
[10] ERIKSSON, L.-G., et al., Nucl. Fusion 29 (1989) 87.<br />
[11] STIX, T.H., Nucl. Fusion 15 (1975) 737.
SECOND HARMONIC ICRF HEATING<br />
EXPERIMENTS IN JT-60<br />
<strong>IAEA</strong>-CN-50/E-H-4<br />
T. FUJII, H. KIMURA, M. SAIGUSA, M. AKIBA, T. ANDO,<br />
K. ANNOH, T. AOYAGI, K. ARAKAWA, M. AZUMI, T. FUKUDA,<br />
A. FUNAHASHI, K. HAMAMATSU, T. HIRAYAMA, M. HONDA,<br />
H. HORIIKE, N. HOSOGANE, T. IIJIMA, Y. IKEDA, T. IMAI,<br />
S. ISHIDA, K. ITAMI, T. ITO, Y. KAMADA, Y. KAWANO,<br />
M. KIKUCHI, T. KIMURA, H. KISHIMOTO, N. KOBAYASHI,<br />
Y. KOIDE, T. KOIKE, I. KONDO, S. KONOSHIMA, H. KUBO,<br />
S. KUNIEDA, K. KURIHARA, M. KURIYAMA, Y. KUSAMA,<br />
S. MAEBARA, K. MAENO, T. MATOBA, S. MATSUDA,<br />
M. MATSUKAWA, T. MATSUKAWA, M. MATSUOKA,<br />
Y. MATSUZAKI, N. MIYA, K. MIYACHI, M. MIZUNO,<br />
S. MORIYAMA, M. NAGAMI, A. NAGASHIMA, K. NAGASHIMA,<br />
T. NAGASHIMA, O. NAITO, H. NAKAMURA, M. NEMOTO,<br />
Y. NEYATANI, H. NINOMIYA, T. NISHITANI, K. ODAJIMA,<br />
N. OGIWARA, T. OHGA, M. OHTA, K. OMORI, S. OMORI,<br />
T. OZEKI, K. SAKAMOTO, A. SAKASAI, M. SATO, M. SEIMIYA,<br />
M. SEKI, S. SEKI, K. SHIMIZU, M. SHIMIZU, Y. SHIMOMURA,<br />
H. SHIRAI, H. SHIRAKATA, T. TAKIZUKA, T. SUGIE,<br />
S. TAKAHASHI, H. TAKATSU, H. TAKEUCHI, S. TAMURA,<br />
Y. TANAKA, K. TANI, K. TOBITA, N. TOYOSHIMA, S. TSUJI,<br />
M. TSUNEOKA, K. UEHARA, K. USHIGUSA, M. YAMAGIWA,<br />
I. YONEKAWA, H. YOSHIDA, R. YOSHINO<br />
Naka Fusion Research Establishment,<br />
Japan Atomic Energy Research Institute,<br />
Naka-machi, Naka-gun, Ibaraki-ken,<br />
Japan<br />
Abstract<br />
SECOND HARMONIC ICRF HEATING EXPERIMENTS IN JT-60.<br />
Recent experimental results on hydrogen second harmonic ICRF heating in divertor <strong>and</strong> limiter<br />
configurations on JT-60 are presented. Heating regimes of pure hydrogen 2ucH, H-minority<br />
(He(H2))2wcH <strong>and</strong> combined heating with NBI <strong>and</strong> pellet injection have been investigated. A good<br />
incremental energy confinement time T of about 75 ms is obtained in He(H2)2wcH at a power level<br />
of 3 MW <strong>and</strong> Ip = 1.5 MA, which is comparable to or better than that of pure hydrogen 2uM heating.<br />
It is found that T£ C in 2wcH increases with Ip up to 2 MA (q,, = 3.5). In combined NBI <strong>and</strong> ICRF heating,<br />
remarkable beam acceleration has been observed. The plasma stored energy is efficiently increased<br />
by ICRF with beam acceleration in lower electron densities, <strong>and</strong> T of ICRF for combined heating<br />
reaches 210 ms at ne = 2.2 x 10 19 m" 3 , which is about three times as large as the value for NBI or<br />
ICRF heating alone.<br />
605
606 FUJII et al.<br />
1. INTRODUCTION<br />
Second harmonic ICRF heating experiments have been carried out at 120 <strong>and</strong><br />
131 MHz on JT-60 in outer <strong>and</strong> lower x-point divertor <strong>and</strong> limiter configurations.<br />
The peak position of the k| spectrum launched by a 2 X 2 loop antenna [1] can be<br />
changed from 0 m" 1 to 10 m" 1 with the phasing mode from (0,0) to (TT,O), where the<br />
figure in the former parentheses is the toroidal phase difference <strong>and</strong> the figure in the<br />
latter is the poloidal difference. The ICRF power has been increased up to 3.0 MW<br />
in the (0,0) mode because of the large coupling resistance of about 5 U [2]. The<br />
power density of the antenna reached 1.6 kW-cm" 2 . Two heating regimes of pure<br />
hydrogen 2cocH <strong>and</strong> H-minority (He(H2))2wcH have been investigated up to 3 MW<br />
for Ip = 1-2 MA <strong>and</strong> n,. = (1.3-3.5) X 10 l9 m" 3 . Intense NBI <strong>and</strong> on-axis ICRF<br />
have been combined at NBI powers of 10-20 MW <strong>and</strong> ICRF powers of 0.7-2.2 MW<br />
in order to achieve efficient central heating. Initial combination of ICRF <strong>and</strong> pellet<br />
injection has been carried out.<br />
2. HEATING PROPERTIES OF SECOND HARMONIC ICRF HEATING<br />
Two heating regimes of pure hydrogen 2o)cH <strong>and</strong> H-minority 2wcH have been<br />
investigated.'Figure 1 shows a typical result for 2wcH in the (0,0) mode at Ip =<br />
1.5 MA. When an ICRF power of 2.9 MW was applied, the plasma stored energy<br />
W DIA <strong>and</strong> the electron density H,, increased. The increment of the stored energy was<br />
0.38 MJ. The ion temperature rise, ATf*, from a charge exchange neutral measurement,<br />
was about 1.1 keV, <strong>and</strong> the ion temperature, Tj AB , from the Rutherford scattering<br />
method <strong>and</strong> the electron temperature, Tj s , from the Thomson scattering<br />
method, were 3.4 <strong>and</strong> 3.8 keV, respectively. An ion tail, which was accelerated up<br />
to 100 keV, was observed during the ICRF pulse.<br />
He(H2)2
,01) |c=<br />
0.4<br />
0.2<br />
0<br />
2<br />
I<br />
0<br />
3<br />
2<br />
• 1<br />
0<br />
- 3<br />
>•<br />
I 2<br />
or i<br />
<strong>IAEA</strong>-CN-50/E-H-4 607<br />
time (s)<br />
FIG. 1. Time evolution of plasma stored energy W DIA , ne. If <strong>and</strong> P,c in pure hydrogen 2ucH heating<br />
of (0,0) mode at Ip = 1.5 MA.<br />
300<br />
250<br />
200<br />
150<br />
100<br />
50<br />
0 0<br />
i i > i<br />
- }, 1<br />
* 1<br />
_ NBI ° °<br />
clone •. • _i_ o<br />
< t i i<br />
3 4 5<br />
e<br />
(10 19 nrf 3 )<br />
PNB = I0-20MW<br />
P,c = 0.7-3.1 MW<br />
Ip = 1.5 MA<br />
(T, 0 I 10,0)<br />
IRu-RgMi 007 053 001 -<br />
NB * IC o A o<br />
OH t IC<br />
He (H2)<br />
* A •<br />
•<br />
pellel-.lC<br />
s<br />
1 f<br />
FIG. 2. Incremental energy confinement time T'£ C versus nt for different heating methods <strong>and</strong> ICRF<br />
phasing modes.<br />
-
608<br />
140<br />
" (0,0) PIC= l~ 3 MW<br />
120<br />
' ne=1.5~3.5xl0 l V<br />
100 -<br />
J 80<br />
iui 60<br />
40<br />
20 -<br />
0<br />
_<br />
FUJH et al.<br />
o<br />
" 8<br />
— O Q<br />
B 0<br />
i i •<br />
Ip (MA)<br />
FIG. 3. L dependence ofr'^ obtained at Ip = 1-2 MA in pure hydrogen 2o>cH heating of (0,0) mode.<br />
The dependence of T^ C on Ip in 2wcH of the (0,0) mode at Ip = 1-2 MA is<br />
shown in Fig. 3. rg 0 increased with Ip up to 2 MA (qa « 3.5). This result was in<br />
contrast with that of the NBI experiment on JT-60, where a weak dependence on Ip<br />
was observed [3]. However, the values of T at Ip = 1 MA were 30-40 ms, which<br />
was less than T C = 55 ms in NBI heating.<br />
An ICRF power of up to 3.0 MW in the (0,0) mode could be coupled to the<br />
plasma fuelled with three pellets (two pellets 2.7 mm in diameter, one pellet 3.8 mm,<br />
injection speed 1.3 km-s" 1 ). As a preliminary result, the stored energy reached<br />
0.71 MJ at a plasma current of 1.5 MA <strong>and</strong> a rg 10 value of 50 ms was obtained as<br />
is shown in Fig. 2.<br />
3. BEAM ACCELERATION AND EFFICIENT INCREMENT OF STORED<br />
ENERGY IN COMBINED HEATING<br />
During combined heating, beam acceleration was observed [4]. Figure 4<br />
demonstrates remarkable beam acceleration near the plasma centre at 1^ = 2.2 x<br />
10 19 m~ 3 in combining PNBI = 18 MW (injection energy 70 keV) <strong>and</strong> PIC =<br />
1.4 MW. The injected beam ions were accelerated by more than 150 keV. The slope<br />
of the ion tail above the injection energy increased from 6 to 20 keV. The broken<br />
line shown in Fig. 4 indicates the result of a Fokker-Planck calculation in the wave<br />
absorption <strong>and</strong> thermalization code which takes into account the global wave structure<br />
<strong>and</strong> the effect of quasi-linear velocity space diffusion [5]. In the result of the calculation,<br />
the ratio of the tail ion density to the total ion density near the plasma centre<br />
reached 0.4 during combined heating. The result revealed that ICRF power was<br />
mainly absorbed at r < 0.3 a <strong>and</strong> the averaged absorbed power density became<br />
o<br />
0<br />
8<br />
1
<strong>IAEA</strong>-CN-50/E-II-4 609<br />
1 1 I 1 I 1 1 1 1<br />
i •<br />
54<br />
NBI t ICRF (TT 0)<br />
_<br />
•<br />
52<br />
L<br />
PNa=l8MW .Pic -1.4MW<br />
• o Exp — Col. "<br />
uT 48<br />
NBI t ICRF ~<br />
3<br />
46 " \<br />
,^-* _<br />
44<br />
42<br />
Eo<br />
1<br />
\NB[<br />
\<br />
PIC = O.32MW/m 3 -<br />
- ! , .<br />
1 i<br />
6 8 10 12<br />
ENERGY HOkeV)<br />
i ' 1 ' 1 '<br />
1 i 1 i 1 •<br />
14 16 IS<br />
FIG. 4. Charge exchange energy spectra during combined heating <strong>and</strong> NBI alone. The broken line<br />
indicates the result of the Fokker-Planck calculation in the wave absorption <strong>and</strong> thermalization code.<br />
0.32 MW-rrT 3 . This power density for an ICRF of only 1.4 MW was about half<br />
that at r < 0.3 a for an NBI of 18 MW.<br />
It should be noted that the stored energy effectively increased with beam<br />
acceleration. In a lower density region, the T£ C value of ICRF during combined<br />
heating was greatly improved as is shown in Fig. 2. T reached 210 ms at i^, = 2.2<br />
X 10 19 m" 3 , which was about three times as large as the value for NBI or second<br />
harmonic ICRF heating alone. The enhancement of r^" c can be explained by a buildup<br />
of the fast ions accelerated by ICRF. It is found that T of ICRF in combined<br />
heating follows the simple scaling law TE" C = ^t^s + 53 ms [6], where the unit of<br />
rg c is ms, ??b the ratio of the ICRF power absorbed by the beam to the total ICRF<br />
power [7], <strong>and</strong> TS the classical Spitzer ion-electron energy relaxation time. The constant<br />
of 53 ms is consistent with T of 50-60 ms during intense NBI heating [8].<br />
Thus, the energy confinement time of the fast ions is close to the classical slowingdown<br />
time.<br />
4. CONCLUSIONS<br />
Two heating regimes of pure hydrogen 2cocH <strong>and</strong> H-minority 2o)cH were<br />
studied, T in H-minority 2cocH heating was comparable to or better than that of<br />
pure hydrogen 2a>cH heating. The T^ nc value of pure hydrogen 2wcH in the (0,0) mode<br />
increased with Ip up to 2 MA (qa « 3.5).<br />
Remarkable beam acceleration was observed during combined ICRF <strong>and</strong> NBI<br />
heating. The plasma stored energy was greatly increased by the ICRF power with<br />
beam acceleration. Efficient central heating by ICRF was verified.
610 FUJII et al.<br />
ACKNOWLEDGEMENTS<br />
The authors wish to thank the members of JAERI who have contributed to the<br />
JT-60 project throughout its progress. They further wish to express their gratitude<br />
to S. Mori, K. Tomabechi <strong>and</strong> M. Yoshikawa for continued encouragement.<br />
REFERENCES<br />
[1] NAGASHIMA, T., et al., Fusion Eng. Des. 5 (1987) 101.<br />
[2] SAIGUSA, M., et al., in <strong>Applications</strong> of Radiofrequency Power to Plasmas (Proc. 7th Topical<br />
Conf. Kissimmee, FL, 1987), AIP, New York (1987) A25.<br />
[3] AKIBA, M., et al., submitted to Plasma Phys. Control!. Fusion.<br />
[4] KIMURA, H., et al., in Controlled Fusion <strong>and</strong> Plasma Physics (Proc. 14th Eur. Conf. Madrid,<br />
1987), Vol. 11D, Part II, European Physical Society (1987) 857.<br />
[5] HAMAMATSU, K., et al., ibid., p. 861.<br />
[6] KIMURA, H., et al., submitted to Phys. Rev. Lett.<br />
[7] YAMAGIWA, M., et al., Plasma Phys. Contrail. Fusion 30 (1988) 943.<br />
[8] KIKUCHI, M., et al., Nucl. Fusion 27 (1987) 1239.
<strong>IAEA</strong>-CN-50/E-II-5<br />
FULL-WAVE MODELING OF ION CYCLOTRON<br />
HEATING IN TOKAMAKS *<br />
D.B. BATCHELOR, E.F. JAEGER, B.A. CARRERAS, V.E. LYNCH<br />
Fusion Energy Division,<br />
Oak Ridge National Laboratory,<br />
Oak Ridge, Tennessee,<br />
United States of America<br />
H. WEITZNER, K. IMRE, D.C. STEVENS<br />
Courant Institute of Mathematical <strong>Sciences</strong>,<br />
New York University,<br />
New York, N.Y.,<br />
United States of America<br />
V. FUCHS 1<br />
Centre canadien de fusion magnetique,<br />
Varennes, Quebec, Canada<br />
A. BERS 1<br />
Plasma Fusion Center,<br />
Massachusetts Institute of Technology,<br />
Cambridge, Massachusetts,<br />
United States of America<br />
Abstract<br />
FULL-WAVE MODELING OF ION CYCLOTRON HEATING IN TOKAMAKS.<br />
Three major issues in the theoretical modeling of high-power ICRH experiments are (1) the<br />
effects of wave fields on low-density surface plasma (especially their influence on impurity generation),<br />
(2) the proper treatment of k( variations <strong>and</strong> nonlocal effects caused by the finite poloidal magnetic<br />
field Bp, <strong>and</strong> (3) the development of efficient methods to compute reflection, absorption, transmission<br />
<strong>and</strong> mode conversion coefficients. To address the first of these issues, the 2D finite difference code<br />
ORION has been modified to solve the vector wave equation in Cartesian coordinates <strong>and</strong> to include<br />
the component of E parallel to B. The numerical results obtained show that direct inversion of V x<br />
V x E fails to correctly model the surface charge induced on the Faraday shield blades, thus causing<br />
an artificially large drop in loading when the shield is present. Introduction of the potentials A <strong>and</strong> <br />
Research sponsored by the Office of Fusion Energy, U.S. Department of Energy, under contract<br />
DE-AC05-84OR21400 with Martin Marietta Energy Systems, Inc., <strong>and</strong> under contract DE-<br />
FGO5-80ET-53O88 with the University of Texas.<br />
' Work supported in part by the U.S. Department of Energy under contract DE-<br />
AC02-78ET-51013, NSF Grant ECS 85-15032 <strong>and</strong> Centre canadien de fusion magnetique.<br />
(CCFM is jointly managed <strong>and</strong> funded by Hydro-Quebec, Atomic Energy of Canada Limited,<br />
<strong>and</strong> the Institut national de la recherche scientifique.)<br />
611
612 BATCHELOR et al.<br />
resolves this problem <strong>and</strong> gives an approximately constant field in the Faraday shield gap as expected.<br />
The proper treatment of Bp has been addressed by development of a new 2D full-wave code,<br />
HYPERION, which employs poloidal <strong>and</strong> toroidal mode expansion <strong>and</strong> straight field line coordinates.<br />
This code also retains E|, includes the toroidal terms arising in the wave equation, <strong>and</strong> uses realistic<br />
tokamak equilibria calculated with the RSTEQ code. Results are in excellent agreement with the ORION<br />
code in the cylindrical limit <strong>and</strong> show that significant differences occur when the aspect ratio is ~3.<br />
The presence of Bp results in a nonlocal plasma response to the wave fields <strong>and</strong> has a large effect on<br />
the relative amounts of mode conversion <strong>and</strong> dissipation in large devices. A slab analysis has been performed<br />
in which the wave perturbed current is found by boundary layer analysis of the Vlasov equation<br />
<strong>and</strong> the resulting fourth-order integro-differential equation is solved numerically. Two cases of practical<br />
interest are studied: minority fundamental resonance <strong>and</strong> second harmonic resonance. Reciprocity relations<br />
are found <strong>and</strong> it is shown that in many cases conversion to Bernstein mode is greatly reduced while<br />
absorption is increased as compared with the case of perpendicular stratification. For the treatment of<br />
mode conversion in perpendicularly stratified plasmas, reduced-order analytic descriptions of coupled<br />
mod^ equations have been developed which yield closed-form expressions for mode conversion in the<br />
presence of kinetic dissipation. Results are presented for the Compact Ignition Tokamak parameters.<br />
1. TWO-DIMENSIONAL, FULL-WAVE CALCULATIONS OF ICRF<br />
FRINGING FIELDS NEAR THE FARADAY SCREEN<br />
One of the major issues in theoretical modeling of ICRF experiments<br />
is the effect of fringing fields on impurity generations near the Faraday<br />
screen. In the edge plasma <strong>and</strong> antenna regions, densities are low enough<br />
that parallel electric fields can be significant. Thus, the usual fast-wave<br />
assumption E\\ ~ 0 is not appropriate <strong>and</strong> the complete wave equation<br />
including E\\ must be solved. Here, we consider two alternate numerical<br />
approaches to this problem. One solves Maxwell's equation directly in<br />
terms of the electric field E:<br />
-V x V x E+—Z-E= -iwfj,0Jexl (1)<br />
V.S-£ = ^ (2)<br />
en<br />
We solve the wave equation (1) by inverting the VxVx£ operator directly.<br />
Since the divergence of Eq. (1) gives Eq. (2), which is Poisson's equation,<br />
the solution to (1) should in principle include electrostatic effects. The<br />
second approach introduces the appropriate electromagnetic potentials A<br />
<strong>and</strong> with the coulomb gauge V • A — 0. Equations (1) <strong>and</strong> (2) then<br />
become<br />
A + ^ (S • V
<strong>IAEA</strong>-CN-50/E-II-5 613<br />
When Eq. (4) is used along with continuity of charge, the divergence of<br />
Eq. (3) gives V 2 (V • A) — 0. Thus, since V • A = 0 along the boundaries,<br />
the gauge condition is satisfied everywhere.<br />
Previously, it has been suggested that the first approach should be<br />
highly degenerate because the Vx operator has a large null space [1].<br />
Our numerical results in the lower hybrid range of frequencies (E\\ ^ 0)<br />
suggest that this is indeed the case. Likewise, detailed calculations of the<br />
ICRF fringing fields in the gaps between Faraday shield blades show that<br />
direct inversion of V x V X E fails to correctly model the surface charge<br />
induced on the blades. This results in artificially fast decay of the fast<br />
wave <strong>and</strong> a large drop in loading when the shield is present. Introduction<br />
of the appropriate potentials, on the other h<strong>and</strong>, resolves this problem <strong>and</strong><br />
gives an approximately constant field in the gap as expected, with only a<br />
50% drop in loading because of the shield.<br />
The calculation in Fig. 1 is based on the potentials .4 <strong>and</strong> <strong>and</strong><br />
shows the detailed structure of the ICRF wave fields in the region immediately<br />
surrounding the antenna <strong>and</strong> Faraday screen in the PLT. The<br />
Faraday screen consists of discrete conducting rods which, because of the<br />
axisymmetry assumption, extend completely around the toroidal circumference.<br />
The rods themselves <strong>and</strong> the spacing between them have been<br />
made larger than actual dimensions to allow sufficient resolution by the<br />
finite difference grid. Note the peaking of the electric fields in the gaps<br />
between the Faraday shield rods. This occurs because of surface charge<br />
induced by the antenna on the inside edges of the rods. The resulting<br />
electric field in the gaps is approximately uniform poloidally <strong>and</strong> projects<br />
a component along the magnetic field when there is rotational transform<br />
present. Thus, strong parallel electric fields develop in the regions between<br />
the rods, accelerating electrons along field lines between rods <strong>and</strong> possibly<br />
accounting for enhanced electron energies in the edge plasma when ICRF<br />
heating is applied [2]. Induced charge on the rod surface causes large peaks<br />
in |JB||| <strong>and</strong> \Ey\ when the shield is present. The overall attenuation of \Ey\<br />
because of the Faraday shield is about 0.7, corresponding to a factor of<br />
2 in actual plasma loading (oc |-Ej/| 2 )- This is consistent with experiment<br />
[2].<br />
The HYPERION code solves the first-order Maxwell equations for<br />
E <strong>and</strong> I in a coordinate system (/?,#,C) where p is a flux variable, ( is<br />
the usual toroidal angle, <strong>and</strong> the poloidal angle 0 is chosen such that the<br />
magnetic field lines are straight. To avoid numerical pollution caused by<br />
the disparity of scales in the parallel direction, a linear combination of the<br />
basic Maxwell equations is taken so that only one equation contains the<br />
large parallel conductivity K\\. A unique feature of the present code is<br />
the removal of resonant denominators by multiplication of IIj(w 2 — Q*).<br />
In this way, the poloidally varying coefficients can be expressed directly<br />
as convolutions of the Fourier expansions of the equilibrium quantities,<br />
<strong>and</strong> no additional Fourier transforms are required. The discretization of
614 BATCHELOR et al.<br />
•J5<br />
1
<strong>IAEA</strong>-CN-50/E-II-5 615<br />
the equations in p is by a two-grid method with the fields Ep, Bg, <strong>and</strong><br />
B^ defined on the half grid points <strong>and</strong> the fields Bp, Eg, <strong>and</strong> E^ on the<br />
integer grid points.<br />
Comparisons between toroidal <strong>and</strong> cylindrical geometry results have<br />
been made for the same aspect ratio, q profile, antenna dimensions in real<br />
space, <strong>and</strong> antenna current <strong>and</strong> with tokamak parameters representative<br />
of the TFTR. Because of the small aspect ratio, 3, this is an interesting<br />
case for comparison. Under these conditions, one of the main differences<br />
between toroidal <strong>and</strong> cylindrical geometry is the local value of fc^,, the local<br />
toroidal wave number. In cylindrical geometry k.° —<br />
8 \N wmc ) ' wnc B{o)<br />
with expansion parameter e = ncvth/c, where nc is the cold plasma refractive<br />
index at resonance, r = o.<br />
The relevant dimensionless parameter measuring variation of \B\ along<br />
a field line is<br />
a = Bp-VB{n 2 cvthw)l(c\VB\) 2 (5)<br />
For the CIT, 0 < \a\ < 2. We solve the Vlasov equation within the boundary<br />
layer, <strong>and</strong> calculate the current J. Poloidal field effects are negligible,<br />
<strong>and</strong> local perpendicular stratified theory applies, only if \a\
616 BATCHELOR et al.<br />
to match asymptotically the geometrical optics modes. Using ( + ,— ,||)<br />
representation, <strong>and</strong> eliminating E- within Maxwell equations, we obtain<br />
(D 2 + 1) E+ + (z? 2 + 1 + i^) ] e»+E+ = 0<br />
where £> = d/d£, e±± = e^ — njj , <strong>and</strong> e c is the cold plasma dielectric<br />
tensor at resonance. The operator e++ is obtained from the Vlasov<br />
equation for each specific problem. We study two distinct problems of<br />
practical interest: (i) minority fundamental resonance, <strong>and</strong> (ii) second<br />
harmonic resonance. In the first case, we obtain<br />
where<br />
\ /^^lexp (A) , , _ ft , Xi = (SB<br />
2 J \u\ \l u l ° an \<br />
<strong>and</strong> Go is the normalized equilibrium distribution function. There is no<br />
slow mode within the resonance layer in this case. The transmission<br />
coefficient is the same as for geometrical optics <strong>and</strong> there is no reflection<br />
for waves incident from the high-field side. In the case of low-field incidence<br />
the absorption is drastically increased by up to 50%.<br />
For the second problem we obtain a fourth-order integro-differential<br />
equation associated with the existence of both fast <strong>and</strong> slow modes within<br />
the boundary layer. We have<br />
e++E+ = -i -D I d(,'F ^-^ ^ exp [in(£ - £')] &&+(?)<br />
We prove that reciprocity relations hold for a pair of related systems,<br />
one with +BP, the other with — Bp. By solving the fourth-order integrodifferential<br />
equation numerically we find that conversion to the slow mode<br />
is greatly reduced, <strong>and</strong> correspondingly energy absorption increases. Figure<br />
2 compares the local <strong>and</strong> nonlocal absorption for a = 1, for the cases<br />
of high <strong>and</strong> low-field side incidence. For high-field incidence, absorption is<br />
substantially increased. Due to a higher rate of wave reflection for small<br />
values of parallel refractive index, the increase in the low-field side absorption<br />
is smaller. In conclusion, when the poloidal field is not tangent<br />
to B = constant surfaces, there is increased absorption of wave energy by<br />
plasma near the resonance layers, an effect also seen in related works by<br />
Smithe et aL [3].
<strong>IAEA</strong>-CN-50/E-H-5 617<br />
I i i i I I I i<br />
1 .0.5<br />
o. g 0.3<br />
,'"' LFI local ,.<br />
HFI local<br />
FIG. 2. Fractional energy flux absorption for the Compact Ignition Tokamak: high-field incidence<br />
(HFI) <strong>and</strong> low-field incidence (LFI), local (a = 0) <strong>and</strong> nonlocal (a = 1.0) cases. Second harmonic T<br />
heating in a 50-50% DTplasma; B = 10 T, R = 1.75 m, T = 10 keV, ne = 5 x 10 w m' 3 . 1 k, =<br />
0.469 n,.<br />
3. REDUCED-ORDER, ANALYTIC RESULTS IN ONE DIMENSION<br />
Reduced-order analytic descriptions of the coupling between fast<br />
Alfven waves (FAW) <strong>and</strong> ion-Bernstein waves (IBW) in ICRH are useful<br />
for gaining insight into the scaling of such heating <strong>and</strong> for simplifying<br />
two- <strong>and</strong> three-dimensional kinetic codes. Even in one dimension, the<br />
FAW-IBW coupling is usually represented approximately by a fourth- (or<br />
sixth-) order ODE derived from the Vlasov-Maxwellian equations. This<br />
high-order ODE must then be solved by numerical techniques. By using<br />
nonresonant (quasimode) pertubation theory [4], we have shown that the<br />
FAW transmission coefficient (T) can be obtained in closed form from the<br />
solution of a first-order ODE. These closed-form analytic results are in<br />
excellent agreement with those obtained from numerical solutions of the<br />
full fourth- (or sixth-) order ODE description. Also, both the transmission<br />
coefficient (T) <strong>and</strong> the reflection coefficient (R) of the incident FAW can<br />
be obtained accurately from a reduced secona-order ODE [5]. We present<br />
here the completion of the reduced analytic description by showing that<br />
the mode-conversion coefficient (C), in the presence of kinetic dissipation,<br />
can be described approximately by a coupled mode system of two firstorder<br />
ODEs (CMEs), which we solve in closed form. With the knowledge<br />
10<br />
0.4<br />
0.2<br />
0.1
618 BATCHELOR et al.<br />
of T, R, <strong>and</strong> C, the power dissipated (D) per unit of incident FAW power<br />
is obtained from global energy conservation.<br />
We start from the usual 2x2, zero-electron-mass, local dispersion<br />
tensor for ICRF [5], exp<strong>and</strong>ed to first order in (k±p{) 2 ,<br />
N^Ki + Nl{K0 - 2AKj) - 2XK0 + X 2 = 0 (6)<br />
where A = (1/3) — N?,', N = fcc^/w, CA is the majority Alfven speed,<br />
Ko = (-1/3) - TV,] + (v/4N\\y/fc)Z{a2ti,Ki = (v^7/47V||)Z(a10,«ri =<br />
7V||iZ01v//3l)2]^ = XU>/CA,RO is the tokamak major radius, <strong>and</strong> I refers to<br />
the majority <strong>and</strong> 2 to the minority ion species. The approximate IBW<br />
dispersion relation, exx = nl, is Ko + K^N\ = 0, <strong>and</strong> Eq. (6) can be<br />
factored into<br />
Nl)(K0 + K1Nl)=X 2 (7)<br />
The corresponding wave equations for the coupled FAW <strong>and</strong> the IBW are<br />
F" + 2XF = XB (8a)<br />
(KiB')'- K0B = XF (8b)<br />
where I = (d/d£). Associated with Eq. (8) is the power conservation<br />
equation<br />
\Im{F*F' - B'KiB')]' = -BB*ImKo - B'B*'lmKx (9)<br />
Global conservation laws (i.e., connection formulae) are obtained from<br />
Eq. (9) upon integration <strong>and</strong> use of asymptotic WKB solutions.<br />
Away from the coupling region, F <strong>and</strong> B can be represented by eikonal<br />
amplitudes accounting for the inhomogeneity in the magnetic field. In<br />
the coupling region, they acquire an additional, slowly varying amplitude<br />
because of coupling <strong>and</strong> dissipation. By separating these spatial evolution<br />
scales, we obtain CMEs for the slowly varying amplitudes (denoted by<br />
/ <strong>and</strong> b) caused by coupling <strong>and</strong> dissipation; further, by introducing a<br />
stationary phase expansion around the coupling point, the CMEs become<br />
/' = -»Aeexp [Dc - *«(£.- icf/2} b (10a)<br />
b' = iXcexp [-Dc + iK{£ - (cf/2\ f (10b)<br />
where the stationary phase point £c is given by N% = Ng with N% = A(l +<br />
JVjf)/(l/3 + JV|) <strong>and</strong> N% = -Re(X0/X1); X\ = X 2 /4N^Klc, K = cA(l/3 +<br />
, <strong>and</strong> Dc = f*'^ d^[lm(K0/K1)]/2NB is the damping factor.<br />
Equations (10a) <strong>and</strong> (10b) give Weber's equation, whose asymptotics are<br />
well known.
1.0<br />
0.9<br />
0.8<br />
0.7<br />
1 0.6<br />
10.5<br />
1 0.4<br />
0.3<br />
0.2<br />
0.1<br />
0<br />
0<br />
-XT 1<br />
2 4<br />
F/G. 3. Power transfer coefficients T, R, CHF,<br />
tions of k, for the Compact Ignition Tokamak.<br />
<strong>IAEA</strong>-CN-50/E-I1-5<br />
1 —-^L^ ^~l~~~~ ~*<br />
\ /<br />
6 8 10 12<br />
K (rn 1 )<br />
/ CIT Minority Healing<br />
D(H), 7j . S% "<br />
\ T<br />
—-i >
620 BATCHELOR et al.<br />
[3] SMITHE, D.( et al., Phys. Rev. Lett. 60 (1988) 801.<br />
[4] FRANCIS, G., et al., in AIP Conf. Proc. 159 (BERNABEI, S., MOTLEY, R., Eds), American<br />
Inst. of Physics, New York (1987) 370-373;<br />
BERS, A., etal., in Controlled Fusion <strong>and</strong> Plasma Physips (Proc. 14th Eur. Conf. Madrid,<br />
1987), Vol. 11D, Part III, European Physical Society (1987) 995A-C.<br />
[5] LASHMORE-DAVIES, C.N., et al., Phys. Fluids 31 (1988) 1614.
LOWER HYBRID EXPERIMENTS IN JT-60<br />
K. USHIGUSA, T. IMAI, Y. IKEDA, M. AKIBA, T. ANDO,<br />
<strong>IAEA</strong>-CN-50/E-III-l<br />
K. ANNOH, T. AOYAGI, K. ARAKAWA, M. AZUMI,<br />
T. FUJII, T. FUKUDA, A. FUNAHASHI, K. HAMAMATSU,<br />
T. HIRAYAMA, M. HONDA, H. HORIIKE, N. HOSOGANE,<br />
T. IIJIMA, S. ISHIDA, K. ITAMI, T. ITO, Y. KAMADA,<br />
Y. KAWANO, K. KAWASAKI, M. KIKUCHI, H. KIMURA,<br />
T. KIMURA, H. KISHIMOTO, Y. KOIDE, T. KOIKE,<br />
I. KONDO, S. KONOSHIMA, H. KUBO, S. KUNIEDA,<br />
K. KURIHARA, M. KURIYAMA, Y. KUSAMA, S. MAEHARA,<br />
K. MAENO, T. MATOBA, S. MATSUDA, M. MATSUKAWA,<br />
T. MATSUKAWA, M. MATSUOKA, Y. MATSUZAKI, N. MIYA,<br />
K. MIYACHI, M. MIZUNO, M. NAGAMI, A. NAGASHIMA,<br />
K. NAGASHIMA, T. NAGASHIMA, O. NAITO, H. NAKAMURA,<br />
M. NEMOTO, Y. NEYATANI, H. NINOMIYA, T. NISHITANI,<br />
K. ODAJIMA, N. OGIWARA, T. OHGA, M. OHTA, K. OMORI,<br />
S. OMORI, T. OZEKI, M. SAIGUSA, K. SAKAMOTO,<br />
A.SAKASAI, M. SATO, M. SEIMIYA, M. SEKI, S. SEKI,<br />
K. SHIMIZU, M. SHIMIZU, Y. SHIMOMURA, H. SHIRAI,<br />
H. SHIRAKATA, T. SUGIE, S. TAKAHASHI, H. TAKATSU,<br />
H. TAKEUCHI, S. TAMURA, Y. TANAKA, K. TANI, K. TOBITA,<br />
N. TOYOSHIMA, S. TSUJI, M. TSUNEOKA, K. UEHARA,<br />
I. YONEKAWA, H. YOSHIDA, R. YOSHINO<br />
Naka Fusion Research Establishment,<br />
Japan Atomic Energy Research Institute,<br />
Naka-machi, Naka-gun, Ibaraki-ken,<br />
Japan<br />
Abstract<br />
LOWER HYBRID EXPERIMENTS IN JT-60.<br />
Lower hybrid current drive experiments have been performed on the JT-60 tokamak in the<br />
parameter range of n, = (0.5-1.6) x 10 "m" 3 -, Ip = 0.5-1.5 MA, BT = 3.3-4.5 T, PLH =<br />
1.0-2.5 MW, f = 1.74 <strong>and</strong> 2.0 GHz, lower side X-point divertor <strong>and</strong> limiter configurations, with <strong>and</strong><br />
without NB heating, wide <strong>and</strong> narrow waveguide launchers. Current drive efficiencies of -qCD s<br />
ncRpIRF/PLH = 2.65 x 10" m^-A-W"' <strong>and</strong> 2.9 x 10 19 m^-A-W" 1 are achieved without <strong>and</strong> with<br />
NB in the lower side X-point divertor discharges. The efficiency T)CD increases with the volume averaged<br />
electron temperature, , <strong>and</strong> with decreasing Zeff. It is experimentally confirmed that riCD is<br />
proportional to 6 /(5 + Zeff). Lower hybrid heating of plasmas with pellet fuelled peaked ne profile<br />
was performed at a frequency of 1.74 GHz with net injected powers of up to PRF < 2.5 MW. The<br />
plasma energy content was increased by LH waves with an incremental energy confinement time comparable<br />
to NB at ne(0) > 1.3 x 10 20 m~ 3 (f/fLH(O) < 1) without occurrence of parametric instabilities.<br />
621
622 USHIGUSA et al.<br />
1. INTRODUCTION<br />
Lower hybrid current drive (LHCD) is one of the most promising methods of<br />
achieving steady state operation of tokamaks. Very high LH power is, however,<br />
required for full current drive in a high current <strong>and</strong> high density plasma such as in<br />
a tokamak reactor because the current drive efficiency is still low. A current drive<br />
efficiency (I7CD = neRpIRF/PHL) of more than 5.0 X 10 19 m" 2 -A-W"' is desirable<br />
during the steady state operation of next generation tokamak. In the JT-60 tokamak,<br />
relatively high current drive efficiencies of ijCD =. 1.7 X 10 19 m" 2 -A-W"' were<br />
achieved in 1986, <strong>and</strong> the efficiency was improved to 2.8 X 10 19 m~ 2 -A-W~ l in a<br />
combination of LHCD <strong>and</strong> NB heating [1, 2]. To obtain higher TJCD <strong>and</strong> to study the<br />
parameter dependences of ijCD, LHCD experiments are carried out in detail. The<br />
apparent dependences of T/CD on tne volume averaged electron temperature <strong>and</strong> Zeff<br />
are found in these studies.<br />
Lower hybrid heating experiments are also studied in high density plasmas<br />
(ne(0) > 1.3 x 10 20 nr 3 , f/fLH(O) < 1.0) with a strongly peaked density profile at<br />
a frequency of 1.74 GHz with net RF injection powers of up to 2.5 MW. A new LH<br />
heating scheme in the density regime of f/fLH(O) < 1.0 without parametric instabilities<br />
is demonstrated in these experiments.<br />
2. LHCD EXPERIMENTS<br />
Wave spectra used in LHCD experiments are shown in Fig. 1. A narrow<br />
waveguide grill (CD launcher; waveguide width of 1.6 cm, spacing of 0.6 cm)<br />
excites waves of Nn = 1.0-2.6 at a frequency of f = 2.0 GHz <strong>and</strong> of Ny = 1.0-3.0<br />
i 2 -<br />
1 -<br />
!<br />
i<br />
]<br />
I<br />
Heating Launchec<br />
i CD Launcher<br />
{ 26Hz90° "<br />
1 / 1.74 GHz<br />
' 90° "<br />
X '^V<br />
FIG. 1. Wave power spectra used in LHCD experiments.<br />
-
- 2t<br />
ji<br />
IplMA) OIV LIM<br />
0.7 - A<br />
1.0<br />
1.5<br />
o<br />
•h<br />
•<br />
-<br />
•_ 0.5<br />
>- 0<br />
xio"<br />
1.0<br />
0.4<br />
0.2<br />
<strong>IAEA</strong>-CN-50/E-HM 623<br />
= 3.8r, DivertorE7332<br />
I.74GHZ 2.0 GHi<br />
•i—I—I—•—I—I—J-<br />
1.0<br />
0<br />
3 4 5 6 7 80.4<br />
t Is)<br />
0.8 >-<br />
+<br />
0.6 So.<br />
FIG. 2. Typical example of LHCD in lower side X-point divertor.<br />
• 1 1 • •<br />
(a)<br />
.<br />
• • • :<br />
A<br />
A ~<br />
m .0.5MA LIM ;<br />
O' 1 MA DIV Low Nn '<br />
(NN =.1.0-1.7) •<br />
i 1 i i i i 1 i i i i '<br />
ne U10'V 3 )<br />
-<br />
ne (xlo'V 3 )<br />
FIG. 3. (a) Density dependence of current drive efficiency; (b) density dependence of current drive efficiency,<br />
Zeg, <strong>and</strong> volume averaged electron temperature.
624 USHIGUSA et al.<br />
at f = 1.74 GHz with a phase difference of A = 90°. A wide waveguide grill (heating<br />
launcher; waveguide width of 2.9 cm <strong>and</strong> spacing of 1.0 cm) excites low NH<br />
waves (N|| = 1.0-1.7) at A = 90° <strong>and</strong> f = 1.74 GHz.<br />
A typical example for LHCD experiments in the lower side X-point divertor [3]<br />
is shown in Fig. 2, where Ip = 1 MA, BT = 3.8 T, the major radius Rp = 3.15 m<br />
<strong>and</strong> hydrogen gas is used. The frequencies of the first <strong>and</strong> the second RF pulse in<br />
Fig. 2 are 1.74 GHz <strong>and</strong> 2.0 GHz, respectively; they are launched from the same<br />
antenna (narrow waveguide grill with A = 90°). Therefore, a comparison of rjCD<br />
in these two frequencies is possible in almost identical conditions. In the first LH<br />
pulse, almost the total plasma current is maintained by ~ 1.5 MW of LH power at<br />
He ~ 1.25 x 10 19 rrr 3 . The time evolution of 2(0p u - ^p x ) + 4 suggests that the<br />
plasma internal inductance decreases during the first LH pulse. The current drive<br />
efficiency with a correction of £ in this case is 2.1 X 10 l9 m~ 2 -A-W~', while TJCD<br />
~ 2.3 x 10 19 nr 2 - A- W" 1 in the second pulse at 2 GHz. Within the parameter range<br />
of He < 1.5 x 10 19 nr 3 , BT > 3.3 T <strong>and</strong> Ip = 1 MA, there was no significant<br />
difference in T;CD for these two frequencies at A = 90°.<br />
The density dependence of TJCD in limiter <strong>and</strong> divertor discharges is shown in<br />
Fig. 3(a), where open <strong>and</strong> solid symbols represent the divertor <strong>and</strong> limiter shots,<br />
respectively. Combined LHCD <strong>and</strong> NB discharges with an NB power of = 90° at 1.74 GHz, N| = 1.0-1.7). The current drive efficiencies for divertor<br />
discharges are by a factor of 1.4-1.7 higher than those for limiter discharges. The<br />
efficiency ijCD increases with the electron density in this density regime. Moreover,<br />
a higher plasma current tends to have a higher drive efficiency. The wide waveguide<br />
grill at A = 90° with 1.74 GHz, which excites waves of low Ni with a relatively<br />
sharp spectrum, has a higher efficiency than the narrow waveguide launcher in the<br />
low density regime. Figure 3(b) shows the density dependence of rjCD <strong>and</strong> Zeff as<br />
measured by visible bremsstrahlung <strong>and</strong> the volume averaged electron temperature<br />
as deduced from the temperature profile measured by Thomson scattering. In<br />
this density regime, Zeff decreases rapidly with increasing electron density.<br />
With the help of the data set as shown in Fig. 3(a), the <strong>and</strong> Zeff dependences<br />
of ijCD are studied. The current drive efficiency as a function of Zeff is plotted<br />
in Fig. 4(a). The dependence of r;CD on Zeff agrees roughly with the theoretical<br />
prediction (ocl/[5 + Zeff}) [4]. The decrease in Zeff may partly contribute to an<br />
increase in TJCD in the higher density regime. For the same value of Zeff, T?CD values<br />
in limiter shots are smaller than those in divertor shots. This discrepancy may be due<br />
to the difference in the electron temperature as is suggested by Fig. 3(b). Figure 4(b)<br />
shows 7]CD as a function of . The current drive efficiencies for various cases are<br />
roughly proportional to . The temperature in divertor cases is higher than<br />
in limiters. A higher current <strong>and</strong> the combination of LHCD <strong>and</strong> NB have higher<br />
<strong>and</strong>, consequently, have higher ijCD. The JT-60 data are an extension of other<br />
machines' data [5, 6]. Figure 4(c) shows T;CD as a function of 6/(5 + Zeff). It<br />
is found that i)CD scales as 6/(5 + Zeff).
'E<br />
- 3<br />
"2 2<br />
- 2<br />
le?<br />
Ip(MA)<br />
0.7<br />
1.0<br />
1.5<br />
DIV<br />
—<br />
o<br />
ir<br />
LIM<br />
o: I MA,DIV with NB<br />
e: IMA,DIV 1.74 GHz<br />
VERSATOR-0<br />
<strong>IAEA</strong>-CN-50/E-IIM 625<br />
1 1 1 1 1 1 1<br />
o^DIV IMA<br />
*UM 0.7MA<br />
f = 2GHz<br />
•<br />
- o<br />
PETULA<br />
JFT-2M ^_o_t<br />
JFT-2<br />
—O<br />
JIPPT-J<br />
WEGA<br />
PLT<br />
PIT<br />
iLCATOR-C<br />
(keV)<br />
i i i i i i<br />
FIG. 4. (a) Current drive efficiency as a function of Zeg- (b) current drive efficiency versus volume<br />
averaged electron temperature; (c) current drive efficiency versus 6(Tt)/(5 + Zeg).<br />
3. LH HEATING IN A PELLET INJECTED PLASMA<br />
LH heating experiments with pellet injections were carried out in the lower side<br />
X-point divertor configuration with Ip = 1 MA, BT = 4.5 T <strong>and</strong> a hydrogen<br />
plasma. The wave frequency was set at 1.74 GHz so that f ~ fLH at n,. « 10 20 m" 3 ,<br />
BT = 4.5 T. Three pellets were injected at a speed of about 1.5 km-s" 1 at typically<br />
50 ms intervals into a low density plasma. At ~ 80 ms after the third pellet injection,<br />
RF powers with pulse lengths of —0.15 s were injected during the density decay<br />
lc)<br />
(b)<br />
1.5
626 USHIGUSA et al.<br />
BT<br />
(T)<br />
(ms)<br />
ao<br />
-9. ° 0<br />
d 60- o<br />
o<br />
oo<br />
+<br />
i 4o "<br />
=| 20<br />
•3<br />
0<br />
la.u.)<br />
IHX I L.<br />
0.1 r<br />
-<br />
0.01<br />
: ' '<br />
1 1 1 Ull|<br />
o<br />
—<br />
1<br />
V<br />
1 1<br />
•<br />
• •<br />
0<br />
°<br />
1<br />
offer<br />
gas<br />
aftei<br />
gas<br />
1 1 1<br />
pellets<br />
puff<br />
pellets<br />
puff<br />
1 1 1<br />
4 6 8<br />
ne (10 19 m" 3 )<br />
(c)<br />
•<br />
-<br />
- 5 (keV)<br />
rUIL<br />
FIG. 5. (a) Electron density <strong>and</strong> temperature profiles of pellet injected plasma just before LH injection;<br />
(b) healing diagram of 1. 74 GHz LH waves for hydrogen plasma. Broken <strong>and</strong> dot-dashed lines show<br />
the accessibility condition <strong>and</strong> the density profile shown in Fig. 4(a), respectively; (c) density dependence<br />
of incremental energy confinement time AW^/fPL,, + APOH), hard X-ray emission normalized<br />
by LH power !HX/PLH <strong>and</strong> ion tail temperature f[ AIL measured by charge exchange analyser.<br />
phase. A typical density profile <strong>and</strong> the electron temperature profile just before LH<br />
injection are shown in Fig. 5(a). The electron density has a strongly peaked profile;<br />
ne * 1.3 X 10 20 m" 3 at r/a ~ 0.3. The heating diagram is shown in Fig. 5(b),<br />
where the fitted density profile of Fig. 5(a) is plotted as a dot-dashed line. The lower<br />
hybrid resonance layer is located at r/a ~ 0.4, <strong>and</strong> waves with NH > 1.4 satisfy the<br />
accessibility condition. Since launched waves have a mean value of Ny > 1.9,<br />
almost all injected power should be accessible.<br />
Figure 5(c) shows the density dependence of the incremental energy confinement<br />
time, AWLH/(PLH + AP0H), the hard X-ray emission with an energy larger<br />
than 200 keV normalized by the LH power, IHX/PLH» <strong>and</strong> the ion tail temperature,<br />
T? ML , measured with a perpendicular charge exchange neutral analyser; the solid<br />
0<br />
10
<strong>IAEA</strong>-CN-SO/E-m-l 627<br />
circles are data taken during the density decay phase after pellet injection, open circles<br />
refer to the gas puffing case. AWLH/(PLH + AP0H) <strong>and</strong> IHX'PLH decrease rapidly<br />
with increasing h^ in the low density regime (n^ < 2.5 X 10 )9 m" 3 ). In the density<br />
regime of ne > 4.0 x 10 19 nr 3 , hard X-ray emission may be negligible <strong>and</strong><br />
W IV(PLH + A P OH) <strong>and</strong> T; TAIL increase with iv These results suggest that LH waves<br />
couple with ions in the density regime of r^ > 4.0 x 10 19 nr 3 , <strong>and</strong> the electron<br />
heating is dominant for i^ < 2.5 X 10 19 m" 3 . The incremental energy confinement<br />
time for n 8.0 x 10 19 m~ 3 is 45-52 ms, which is almost the same as that for low<br />
power NB heating in lower side X-point divertor discharges [7]. An electrostatic<br />
probe <strong>and</strong> a loop antenna were used to measure the parametric decay waves. Parametric<br />
instabilities were not observed, even in the regime of f/fLH(O) < 1.0. A relatively<br />
low density at the plasma surface may suppress parametric instabilities in the<br />
edge plasmas <strong>and</strong> provide the efficient ion heating in the high density regime.<br />
4. SUMMARY<br />
<strong>and</strong><br />
Current drive efficiencies of<br />
TJCD s HeRpIRF/PLH = 2.65 x 10 19 m- 2 -A-W-'<br />
VcD = 2.9 x 10 I9 rn- 2 -A-W-'<br />
were achieved without <strong>and</strong> with NB in lower side X-point divertor discharges. The<br />
observed current drive efficiencies for various plasma <strong>and</strong> wave parameters increased<br />
with the volume averaged electron temperature, , <strong>and</strong> with decreasing Zeff. It<br />
was experimentally confirmed that ijCD is proportional to 6/(5 + Zeff). This is<br />
a promising result for steady state operation of next generation tokamaks.<br />
Without parametric instabilities, LH waves led to an increase in the plasma<br />
energy content in the density regime of f/fm(0) < 1, W i tn the incremental energy<br />
confinement time comparable to NB heating.<br />
ACKNOWLEDGEMENTS<br />
The authors would like to thank the members of JAERI who have contributed<br />
to the JT-60 project throughout its progress, <strong>and</strong> also to Drs S. Mori, K. Tomabechi<br />
<strong>and</strong> M. Yoshikawa for continued encouragement <strong>and</strong> support.<br />
REFERENCES<br />
[1] JT-60 TEAM, in Plasma Physics <strong>and</strong> Controlled <strong>Nuclear</strong> Fusion Research 1986 (Proc. 1 lth Int.<br />
Conf. Kyoto, 1986), Vol. 1, <strong>IAEA</strong>, Vienna (1987) 563.
628 USHIGUSA et al.<br />
[2] JT-60 TEAM, Plasma Phys. Controll. Fusion 29 (1987) 1377.<br />
[3] JT-60 TEAM, Paper <strong>IAEA</strong>-CN-50/A-I-4, these Proceedings, Vol. 1.<br />
[4] FISCH, N.J., BOOZER, A.H., Phys. Rev. Lett. 45 (1980) 720.<br />
[5] PORKOLAB, M., IEEE Trans. Plasma Sci. PS-12 (1984) 107. •<br />
[6] ERST, D.A., personal communication, 1988.<br />
[7] TSUJI, S., et al., Paper <strong>IAEA</strong>-CN-50/A-V-1, these Proceedings, Vol. 1.
STEADY STATE CURRENT DRIVE<br />
BY LOWER HYBRID WAVE<br />
IN TRIAM-1M TOKAMAK<br />
S. ITOH, N. HIRAKI, Y. NAKAMURA, K. NAKAMURA,<br />
A. NAGAO, S. MORIYAMA, S. KAWASAKI, E. JOTAKI<br />
Advanced Fusion Research Center,<br />
Research Institute for Applied Mechanics,<br />
Kyushu University,<br />
Kasuga, Fukuoka,<br />
Japan<br />
Abstract<br />
<strong>IAEA</strong>-CN-50/E-III-2<br />
STEADY STATE CURRENT DRIVE BY LOWER HYBRID WAVE IN TRIAM-1M TOKAMAK.<br />
Long tokamak operation of more than three minutes is demonstrated in the superconducting high<br />
field tokamak TR1AM-1M. A steady state plasma with a plasma current of up to 35 kA, a line average<br />
density of up to 6 x 10 12 cm" 3 , an ion temperature of 0.5-0.7 keV <strong>and</strong> an electron temperature of<br />
1.0-1.2 keV was maintained by 2.45 GHz RF power (PRF < 50 kW) alone. Hard X-ray emission profiles<br />
indicate that the high energy electrons that carry the steady plasma current are rather concentrated<br />
in the inner half-radius region of the plasma column. The time variation of the chromium Ka-line<br />
obtained from the soft X-ray spectra suggests that there is little accumulation of metal impurities from<br />
the SUS limiter.<br />
1. INTRODUCTION<br />
Current drive by lower hybrid waves has been regarded as one of the c<strong>and</strong>idates<br />
for steady state tokamak operation; its advantages have been demonstrated in many<br />
tokamak experiments. The TRIAM-1M tokamak [I] is particularly suitable for such<br />
current drive experiments because a steady toroidal magnetic field can be produced<br />
by superconducting magnets. We report here the results of lower hybrid (LH) current<br />
drive experiments on TRIAM-1M <strong>and</strong> report very long duration discharges (more<br />
than three minutes). The duration of the discharges is much longer than the times<br />
obtained in previous current drive experiments. This achievement of a long tokamak<br />
operation encourages the development of a steady state tokamak reactor.<br />
2. EXPERIMENTS ON STEADY STATE OPERATION<br />
The LH current drive experiments on steady state operation were carried out<br />
under the following conditions: the major <strong>and</strong> minor radii of the plasma were R =<br />
0.83 m <strong>and</strong> a = 0.11 m, respectively; the toroidal magnetic field was B, = 5 T. An<br />
629
630 ITOH et al.<br />
, Breakdown<br />
20 40 60 80<br />
t(ms)<br />
a S25<br />
o<br />
1<br />
0.5<br />
-<br />
•\~ 1<br />
0 15<br />
FIG. 1. Oscillograms of long duration discharges with <strong>and</strong> without gas feed control. Full <strong>and</strong> dashed<br />
lines indicate cases with <strong>and</strong> without gas feed control, respectively: (a) plasma current, loop voltage<br />
<strong>and</strong> OH coil current waveforms during ramp-up stage; (b) overall waveforms of plasma current, line<br />
average density <strong>and</strong> Shafranov parameter; (c) time variation of Ha line intensities. An RF power of<br />
23 kW was injected into the target OH plasma. The parameter A (= &p + t-,/2 — 1) was measured by<br />
magnetic probes.<br />
RF power generated by a 2.45 GHz klystron with an output power of 50 kW was<br />
injected into the target plasma through a grill antenna with four waveguides. The<br />
cross-section of each waveguide at the grill face was 15 mm x 71 mm, the distance<br />
of the adjacent waveguides was 19 mm <strong>and</strong> the distance between the grill face <strong>and</strong><br />
the plasma edge was taken to be 15 mm <strong>and</strong> kept constant by feedback control of the<br />
plasma position. The RF power was turned on at the initiation of the breakdown, <strong>and</strong><br />
the phase shift, A, between adjacent grill waveguides was set to be 90°, corresponding<br />
to a parallel refractive index of N, = 1.6.<br />
The full lines in Fig. 1 show typical oscillograms of a discharge with a duration<br />
of 60 s. The initial plasma was produced by an Ohmic heating (OH) transformer. The<br />
plasma current, Ip, rises up to 40 kA within 100 ms by the RF power provided after<br />
the breakdown, <strong>and</strong> the OH coil current, IOH» <strong>and</strong> the loop votage, VL, decrease to<br />
zero (Fig. l(a)). If no RF power is applied, the plasma current never rises, but even<br />
stops flowing within 10 ms. After the ramp-up, the plasma current was maintained<br />
at about 30 kA for 60 s without OH input power (Fig. l(b)). The amount of gas feed<br />
was controlled so that the Ha line intensity monitored by visible light spectrometer<br />
could be kept constant (Fig. l(c)). As a result, the line average electron density r^<br />
i<br />
30<br />
t (s<br />
1<br />
45<br />
(b)<br />
60<br />
-<br />
-
45<br />
2 30<br />
a.<br />
" 15<br />
0<br />
7 e s<br />
9 2.5 :<br />
ic o<br />
~ 10<br />
"f o<br />
-10<br />
<strong>IAEA</strong>-CN-50/E-III-2<br />
80 120<br />
t(s)<br />
= 0B3m<br />
160 200<br />
FIG. 2. Oscillograms of longest duration discharge. The injected RF power was less than 20 kW.<br />
was kept at about 2.4 X 10 12 cm" 3 . If the working gas is fed constantly without control,<br />
the Ha line intensity increases gradually with time by the recycling process as<br />
shown by the dashed line. Although the resulting density increases up to about 4 x<br />
10 n cm" 3 , the plasma current decreases gradually with increasing density <strong>and</strong><br />
finally even fades out. By this gas feed control, we obtained reproducible, long duration<br />
discharges <strong>and</strong> performed stable operations of more than three minutes. The<br />
duration was limited by the time permissible for continuous operation of the power<br />
supply for the vertical field coil.<br />
Figure 2 shows the discharge waveforms with a maximum duration of 192 s.<br />
The plasma current <strong>and</strong> density are kept constant during the whole duration. The<br />
horizontal plasma displacement, AH, is well controlled within 3 mm.<br />
Since the capability of the TRIAM-1M data acquisition system is not sufficient<br />
to process all data of the more than three minutes of the discharge, we mainly studied<br />
the discharge characteristics of a period of 60 s. We shall discuss these results. The<br />
ion <strong>and</strong> electron temperatures were measured by charge exchanged neutral <strong>and</strong> soft<br />
X-ray energy spectra, respectively.<br />
Figure 3 shows typical results for the 60 s discharge. The time variation in<br />
Fig. 3(a) indicates that the electron temperature of Te .= 1.0-1.2 keV <strong>and</strong> the ion<br />
temperature of T, = 0.5-0.7 keV are maintained almost constant during the whole<br />
duration. The ion temperature profile is close to the parabolic one, as shown in<br />
Fig. 3(b); it is kept almost unchanged during the whole duration.<br />
By assuming that the electron density <strong>and</strong> temperature as well as the ion temperature<br />
have steady state profiles <strong>and</strong> that the RF power corresponding to the accessible<br />
part of the N| spectra of the injected RF waves is absorbed by the electrons [2], we<br />
have calculated the energy confinement time of the bulk plasma to be TE = 3 ms.<br />
631
632 ITOH et al.<br />
1.0 20 30 40 50 60<br />
t (s)<br />
900<br />
40 80 120 160<br />
CHORD HEIGHT (mm)<br />
FIG. 3. Bulk plasma temperature during steady state LHCD operation: (a) time variation of ion <strong>and</strong><br />
electron temperatures at plasma centre; (b) ion temperature profile at t = 40 s.<br />
10*<br />
10 3<br />
.o 2<br />
; t=20s<br />
\ T=«5 keV<br />
10<br />
\ i<br />
• i '," ***,<br />
1<br />
c><br />
200 400<br />
E (keV)<br />
150<br />
|12O<br />
1 90<br />
a.<br />
> IP-<br />
^30<br />
TJ \<br />
0 -100 -7.5 -50 -25 0.0 2.5 50 75 10.0<br />
CHORD POSITION (cm)<br />
FIG. 4. Hard X-ray emission during the steady state LHCD operation: (a) photon energy spectrum at<br />
plasma centre; (b) emission profiles for three photon energies. Here, the centre of the chord position<br />
corresponds to a major radius of 0.84 m.<br />
This value is several times longer than the neo-Alcator confinement time obtained for<br />
a low density OH discharge (BT = 5 T, Ip < 40 kA, ri, < 1 X 10 13 cm" 3 ) in<br />
TRIAM-1M. Such an improvement of the energy confinement has been observed for<br />
the lower density region (n,
1/1<br />
z<br />
3<br />
163-<br />
<strong>IAEA</strong>-CN-50/E-III-2 633<br />
(a)<br />
rbU|k=1 (keV)<br />
'<br />
D*-"<br />
Cr K line<br />
•. *<br />
,<br />
^1 =13(keV) -<br />
-U<br />
1 -<br />
10"'<br />
1 1<br />
1 1<br />
-I- 1 1 1<br />
t=30-35s<br />
t i i<br />
10 20<br />
EtkeV)<br />
30<br />
jn200<br />
= 100<br />
0<br />
Cr !(„ line<br />
(b)<br />
10 20 30 40 SO 60<br />
t (s)<br />
FIG. 5. Behaviour of chromium impurity during steady state LHCD operation: (a) soft X-ray spectrum<br />
at t = 30-35 s. The spectrum consists of three parts of low energy emission with slope of 1 keV, tine<br />
radiation of Cr impurity <strong>and</strong> high energy tail of 13 keV; (b) time variation of the Cr Ka-line (2.29 A)<br />
<strong>and</strong> the Cr I visible line (4254.3 A).<br />
inner half (r/a < 0.5) of the plasma column. This suggests that the plasma current<br />
driven by the LH wave has a peaked profile <strong>and</strong> is consistent with the result that the<br />
plasma internal inductance estimated from the Shafranov A is rather large (^ ~ 2.4<br />
for a poloidal beta, /3p, of 0.2 as is shown in Fig. l(b)).<br />
The impurity behaviour during the long duration discharge is an interesting<br />
problem from the viewpoint of realizing a steady state tokamak operation. The metal<br />
impurity contamination due to the SUS limiter can be discussed qualitatively by<br />
means of soft X-ray <strong>and</strong> visible spectroscopic measurements. Figure 5 shows the<br />
behaviour of the chromium impurity. The soft X-ray spectrum includes the line radiation<br />
of the Cr impurity as is shown in Fig. 5(a). By measuring the strength of this<br />
Cr Ka-line we have obtained the time variation of the Cr Ka-line strength as shown<br />
in Fig. 5(b). The Cr Ka-line has a hump during the earlier stage of the discharge as<br />
has also the CrI visible line; this demonstrates a transient increment of the impurity<br />
influx. The CrI line increases gradually during the latter half of the discharge. This<br />
suggests that the chromium influx increases with rising limiter surface temperature.<br />
On the other h<strong>and</strong>, the strength of the Cr K^-line is kept constant rather than<br />
increasing monotonically. This shows that the amount of Cr impurity at the plasma<br />
centre seems to be kept constant for the whole duration. As was already shown, the<br />
hard X-ray emission profile (Fig. 4) <strong>and</strong> the plasma internal inductance (full line in<br />
Fig. 1), which are related to the current density profile, are maintained almost constant<br />
during the long duration discharge. Consequently, it can be inferred that<br />
although the impurity influx from the SUS limiter increases slightly during the long<br />
tokamak operation, there is only little accumulation of metal impurities with some<br />
adverse effect on the steady state current drive.
634 ITOH et al.<br />
30<br />
|20<br />
a<br />
""<br />
10<br />
n<br />
H=0.2\<br />
life)<br />
• • [10<br />
A I 20<br />
a 1 30<br />
-1=0.<br />
i<br />
•<br />
I I<br />
(a)<br />
i Bt=5T<br />
40=90* .<br />
PRF=27kW<br />
1 2 3 4 5 6 7<br />
ne(10 12 cm" 3 )<br />
- 4<br />
FIG. 6. Parametric dependence of plasma current <strong>and</strong> line average density: (a) plasma current versus<br />
line average density; (b) plasma current <strong>and</strong> line average density versus injected RF power.<br />
3. HIGHER DENSITY OPERATION AND CURRENT DRIVE EFFICIENCY<br />
The above mentioned steady state operations were mainly carried out in the low<br />
electron density region of H,. = (1.5-2.5) X 10 12 cm" 3 ; the current drive<br />
efficiencies, -q = 1^(10 l9 m" 3 ) R(m) Ip(kA)/PRF(kW), had the relatively low values<br />
of 0.15-0.25. Hence, we attempted to sustain the plasma current at a higher density<br />
level <strong>and</strong> to improve the current drive efficiency. The results are shown in Fig. 6.<br />
Figure 6(a) shows the dependence of the plasma current on the line average density<br />
for higher density operations. In the low density region of He < 3.5 x 10 12 cm" 3 ,<br />
there is little dependence of the plasma current on the density, <strong>and</strong> the current drive<br />
efficiency rises up to 0.3 with increasing density. The plasma current, in the region<br />
of 3.5 X 10 12 cm" 3 < ne ^ 4.5 X 10 12 cm" 3 , falls rapidly with increasing density;<br />
the resulting efficiency drops to 0.2. This seems to be related to the result that the<br />
current density changes rapidly towards a broader profile with increasing electron<br />
density as is to be expected from the Shafranov A (see the dashed line in Fig. 1). In<br />
the high density regime of n,, > 4.5 X 10 12 cm" 3 , the plasma current shows an n,.<br />
dependence, <strong>and</strong> the efficiency rises up to ij = 0.3 <strong>and</strong> is then kept nearly constant.<br />
Eventually, although the efficiency was not improved remarkably, the current was<br />
stably driven at higher densities of up to a. = 6 X 10 12 cm" 3 . It is, however, very<br />
difficult to maintain the plasma current constant for several tens of seconds at such<br />
a high density level. Figure 6(b) shows the strong dependence of the electron density<br />
on the injected RF power. The density rises almost linearly up to 3 x 10 12 cm" 3 ,<br />
together with the plasma current, with increasing RF power. Therefore, we may<br />
expect to achieve a steady state current drive at higher density levels with a more<br />
powerful RF system.<br />
To find the optimum current drive conditions, we have also studied the dependence<br />
of the current drive efficiency on the phase shift, A, <strong>and</strong> the toroidal field<br />
Bt. The results are shown in Fig. 7. Figure 7(a) shows the dependence of the
50* 70" 90' 110" 130' 150' 170*<br />
A*<br />
<strong>IAEA</strong>-CN-50/E-m-2 635<br />
FIG. 7. Current drive efficiency dependence on (a) phase shift A <strong>and</strong> (b) toroidal field Br<br />
current drive efficiency on the phase shift A at B, = 5 T. We could maintain a<br />
steady plasma current in the region of 70° < A < 130°, <strong>and</strong> obtained maximum<br />
efficiency of 0.3 at A = 110°. Figure 7(b) shows the dependence of the efficiency<br />
on Bt at A = 110°. It is shown clearly that the efficiency increases with increasing<br />
toroidal field <strong>and</strong> is improved up to r; = 0.35 at Bt = 6 T. These dependences are<br />
consistent with the general tendency expected from the accessible part of the NB<br />
spectra of the injected RF waves.<br />
4. CONCLUSIONS<br />
The experiments have demonstrated that a plasma current up to 35 kA is maintained<br />
constant for a very long duration of more than three minutes (192 s) with RF<br />
power alone. In these steady state current drive tokamak operations, we have<br />
obtained bulk plasmas with line average electron densities of up to 3 X 10 l2 cm" 3 ,<br />
ion temperatures of 0.5 to 0.7 keV <strong>and</strong> electron temperatures of 1.0 to 1.2 keV. It<br />
was found from hard X-ray measurements that the high energy electrons carrying the<br />
steady plasma current mainly exist in the inner half-radius region of the plasma<br />
column. The results on chromium impurity measured by the soft X-ray spectrum suggest<br />
that there is only little accumulation of metal impurities from the SUS limiter.<br />
So far, the density region for operating in the steady state has been iv,, < 3 X<br />
10 12 cm" 3 , <strong>and</strong> the current drive efficiency has been in the region of r^ < 0.35.<br />
This operational regime extends towards higher density <strong>and</strong> efficiency with increasing<br />
injected RF power <strong>and</strong> toroidal field. Thus, if a powerful RF system is installed<br />
in TRIAM-1M, we may expect to achieve a steady state current drive with higher<br />
density <strong>and</strong> higher efficiency by utilizing the advantage of the high field tokamak.<br />
This success in achieving long tokamak operation encourages the development<br />
of a steady state tokamak reactor.
636 ITOH et al.<br />
REFERENCES<br />
[1] ITOH, S., et al., in Plasma Physics <strong>and</strong> Controlled <strong>Nuclear</strong> Fusion Research 1986 (Proc. 11th<br />
Int. Conf. Kyoto, 1986), Vol. 3, <strong>IAEA</strong>, Vienna (1987) 321.<br />
[2] TONON, G., MOULIN, D., in Plasma Physics <strong>and</strong> Controlled <strong>Nuclear</strong> Fusion Research 1984<br />
(Proc. 10th Int. Conf. London, 1984), Vol. 1, <strong>IAEA</strong>, Vienna (1985) 557.<br />
[3] SOLDNER, F., et al., in Controlled Fusion <strong>and</strong> Plasma Physics (Proc. 12th Eur. Conf. Budapest,<br />
1985), Vol. 9F, Part n, European Physical Society (1985) 244.
<strong>IAEA</strong>-CN-50/E-III-3<br />
LOWER HYBRID HEATING IN HIGH DENSITY<br />
DISCHARGES IN FRASCATI TOKAMAK<br />
F. ALLADIO, E. BARBATO, G. BARDOTTI, R. BARTIROMO,<br />
F. BOMBARDA, G. BRACCO, G. BUCETI, P. BURATTI,<br />
E. CAIAFFA, A. CARDINALI, R. CESARIO, F. CRISANTI,<br />
R. DE ANGELIS, F. DE MARCO, M. DE PRETIS, D. FRIGIONE,<br />
L. GABELLIERI, R. GIANNELLA 1 , M. GROLLI, S. MANCUSO,<br />
M. MARINUCCI, G. MAZZITELLI, F. ORSITTO, L. PANACCIONE,<br />
V. PERICOLI-RIDOLFINI, L. PIERONI, S. PODDA, G.B. RIGHETTI,<br />
F. ROMANELLI, D. SANTI, F. SANTINI, S.E. SEGRE 2 , G. TONINI,<br />
A.A. TUCCILLO, O. TUDISCO, V. ZANZA<br />
Associazione Euratom-ENEA sulla Fusione,<br />
Centra Ricerche Energia Frascati,<br />
Frascati, Rome,<br />
Italy<br />
Abstract<br />
LOWER HYBRID HEATING IN HIGH DENSITY DISCHARGES IN FRASCATI TOKAMAK.<br />
The paper deals with the results of the experiment of plasma heating by 8 GHz LH waves carried<br />
out on the Frascati Tokamak. The main purpose of the experiment is the investigation of the possibility<br />
of heating a high density plasma with LH waves. The coupling properties of the 8 GHz LH waves to<br />
the plasma are very good. A power density as high as 10 kW-cm" 2 is routinely injected into the<br />
plasma with a reflection coefficient of ~ 15%. In the explored range of densities, no evidence of a density<br />
limit has been observed. As far as the heating results are concerned, an RF power of 200 kW has<br />
been injected into two target plasmas of different densities. At low density (ne = 3.5 x 10 13 cm" 3 ),<br />
the observed phenomenology is very similar to the one observed in a previous experiment with<br />
2.45 GHz. At higher density (ne = 10 M cm" 3 , well above the 2.45 GHz density limit), the RF power<br />
is very efficiently transferred to the plasma, even if the plasma core is accessible to only 15% of the<br />
launched power. On the other h<strong>and</strong>, the analysis of electron cyclotron emission spectra shows that faster<br />
electrons, corresponding to less accessible values of nM, are suppressed more strongly than the slower<br />
ones as the density is increased. The results on accessibility <strong>and</strong> on plasma heating indicate that the inaccessible<br />
part of the spectrum also contributes effectively to plasma heating.<br />
1. INTRODUCTION<br />
Electromagnetic waves in the lower hybrid (LH) range of frequencies have<br />
proven to be very effective in tokamak research for current generation <strong>and</strong> plasma<br />
heating [1,2] through L<strong>and</strong>au damping on the electron population, with consequent<br />
1 Present address: JET Joint Undertaking, Abingdon, Oxfordshire, United Kingdom.<br />
2 Permanent address: Dipartimento di Fisica, Universita di Roma II, Rome, Italy.<br />
637
638 ALLADIO et al.<br />
generation of high energy electron tails. This mechanism is only effective if the<br />
plasma density is lower than a critical value depending on frequency. Above this<br />
value, the power is mainly absorbed by the ionspopulation or by excitation of parametric<br />
decay instabilities at the plasma edge [3£-<br />
In a previous experiment on the Frascati Tokamak (FT), a frequency of<br />
2.45 GHz was used with a very high electron heating efficiency at densities below<br />
5 x 10 13 cm" 3 [4].<br />
As the density limit for wave-electron interaction is known to increase with frequency<br />
[5], an 8 GHz system has been installed on the FT in order to investigate the<br />
possibility of heating a high density plasma with LH waves.<br />
The apparatus consists of four klystrons delivering up to 125 kW, each feeding<br />
a grill composed by 4 x 4 waveguides with an inner dimension of 5 x 35 mm each.<br />
The waveguide phasings used were mainly OOir7T <strong>and</strong> OTTOTT. The relative spectra are<br />
shown in Fig. 1.<br />
Owing to the loss in the transmission line, the results reported in this paper were<br />
obtained with an RF power coupled to the plasma of less than 220 kW.<br />
The experimental results concerning the coupling properties <strong>and</strong> the density<br />
limit have already been reported [6] <strong>and</strong> can be summarized as follows:<br />
(i) The coupling properties of the 8 GHz LH waves to the plasma are very<br />
good. A power density as high as 10 kW-cm" 2 is routinely injected into<br />
the plasma with a reflection coefficient of ~ 15%.<br />
(ii) No evidence of a density limit has been observed in the range of explored<br />
densities (n,. < 3.5 X 10 14 cm" 3 ),<br />
(iii) By comparison with the 2.45 GHz experiments with the same target<br />
plasma the density threshold for the parametric decay instability appears<br />
to increase with frequency,<br />
(iv) No fast ion tails have been detected in all the investigated experimental<br />
conditions.<br />
In this paper, we report on the experimental results concerning plasma heating<br />
<strong>and</strong> accessibility.<br />
2. PLASMA HEATING<br />
An RF power of ~ 200 kW has been coupled to the plasma at two different densities,<br />
n^ = 3.5 X 10 13 cm" 3 <strong>and</strong> Re = 10 14 cm" 3 . In both cases, the toroidal field<br />
was 8 T, <strong>and</strong> the launched spectrum was the fast one, having 80% of its power at<br />
ns < 2.<br />
In these conditions, —25% of the power is accessible to plasma centre in the<br />
low density case <strong>and</strong> less than 15% in the high density case.<br />
In Fig. 2, we report the electron temperature profile, as measured by sevenpoint<br />
Thomson scattering diagnostics, before <strong>and</strong> during the application of the RF
1.0<br />
0.8 -<br />
_ OOnrr<br />
<strong>IAEA</strong>-CN-50/E-HI-3<br />
0.6<br />
Q<br />
S 0.4<br />
O 0.2<br />
-<br />
0<br />
-6 -4 -2 4 6<br />
n.<br />
- 6 - 4 - 2 0 2 4 6<br />
F/G. /. «| spectrum calculated for the 8 GHz grill for phasing at OOirir <strong>and</strong> OirOir.<br />
power to the low density plasma. The plasma current was 340 kA, <strong>and</strong> the Ohmic<br />
power input before the application of RF was 510 kW. The total energy content of<br />
7.9 kJ gives a confinement time of —15 ms.<br />
In this low density discharge, the main features of the wave-plasma interaction<br />
are similar to those observed in the 2.45 GHz experiment at the same density; they<br />
can be summarized as follows:<br />
(i) A sharp increase in the central electron temperature is observed while outside<br />
half-radius the temperature seems to decrease, even though the variation<br />
lies within the experimental uncertainties.<br />
100<br />
D<br />
LLJ<br />
639
640 ALLADIO et al.<br />
4<br />
T (keV)<br />
3<br />
2 -<br />
1 -<br />
•<br />
a<br />
I<br />
•<br />
D<br />
n<br />
1<br />
B<br />
D<br />
•<br />
1<br />
1<br />
a<br />
•<br />
I<br />
•<br />
OH<br />
RF<br />
-4 0 8 12 16 20<br />
r(cm)<br />
FIG. 2. Electron temperature profile before <strong>and</strong> during RF phase. ne = 3.5 X 10 13 cm 3 .<br />
(ii) The loop voltage decreases from 1.7 to 1.3 V, as a consequence of the<br />
application of RF power. This, together with a small increase in the<br />
plasma current, causes a reduction in the Ohmic power input of about<br />
80 kW. So, during the RF phase, the total power input exceeds the input<br />
during the Ohmic phase by only 120 kW.<br />
(iii) In spite of the experimental uncertainties (mainly on the electron thermal<br />
content), the plasma energy increase seems to be consistent with the<br />
increase in the total power input if the energy confinement time does not<br />
change. This suggests that the RF power is transferred to the plasma bulk,<br />
a result which is in agreement with the main conclusion of the 2.45 GHz<br />
experiment performed with higher RF power.<br />
More interesting for the purposes of the present experiment is the high density<br />
case.<br />
In Fig. 3, we report the electron temperature profiles before <strong>and</strong> during the<br />
application of RF power to a plasma with n,. = 10 l4 cm" 3 .<br />
In this case, the electron temperature increases over the whole profile.<br />
The plasma current was 365 kA <strong>and</strong> the Ohmic power input, in the Ohmic<br />
phase, was 460 kW. The effective ion charge, obtained from the plasma conductance,<br />
is close to unity (Zeff = 1.3). The total energy content of 16.3 kJ gives a confinement<br />
time of 35 ms.<br />
During the RF phase, the Ohmic input remains practically constant because a<br />
slight decrease in the loop voltage is compensated for by an increase in the plasma<br />
current; thus, the total power injected into the plasma is 650 kW while the total thermal<br />
energy is about 20 kJ. From these figures, taking into account that in this case<br />
the experimental uncertainties are lower than in the low density case, we may conclude<br />
that most of RF power is transferred to the plasma.<br />
Indeed, the energy confinement time is now 30 ms, on the assumption that the<br />
entire RF power is absorbed by the plasma.<br />
•
-4<br />
<strong>IAEA</strong>-CN-50/E-HI-3 641<br />
FIG. 3. Same as Fig. 2 for ne = 10 H cm~ 3 .<br />
Some information on the power deposition profile can be inferred from the<br />
sawtooth activity. In fact, the time derivative of the peak electron temperature,<br />
T'e, immediately after the sawtooth collapse, is proportional to the difference<br />
between the central power density input, Pj, <strong>and</strong> the stationary power loss, PL.<br />
= Assuming that PL is proportional to Pj we can write: P^RF/P T'(RF)/T'<br />
Since<br />
(0H).<br />
T'(RF) = 66 eV-ms~' <strong>and</strong> T'(0H) = 40 eV-ms"<br />
obtain<br />
1 , we<br />
Pi(RF/P>(OH) = 1-7- Since the peak Ohmic power density, Pn, obtained from the<br />
neoclassical conductivity, is ~5 W-cm" 3 , we obtain a value of 3.5 W-cm" 3 for the<br />
central RF power density. This figure suggests that the RF power deposition region<br />
is well inside the half-radius, even if only 18% of the launched power is accessible<br />
to the plasma core. This evaluation could be affected by a change in Pn, caused by<br />
the RF. But as we have already noted, the total Ohmic power does not change during<br />
the RF phase, <strong>and</strong> the effective ion charge, Zeff, shows only a small increase (from<br />
1.3 to 1.45).<br />
3. THE ROLE OF ACCESSIBILITY<br />
As is well known [7], only power components with ni larger than a critical<br />
value, nnc, can propagate through the plasma. Since nnc increases with the density,<br />
it is evident that with increasing density the plasma core becomes inaccessible to<br />
waves with higher phase velocity. This implies that the energy of the fast electrons<br />
generated by the waves should decrease with the plasma density.<br />
This has been studied by looking at the electron cyclotron emission in a spectral<br />
region, between 1.3 «ce <strong>and</strong> 1.6 coce, where thermal emission <strong>and</strong> reabsorption are<br />
absent.
642 ALLADIO et al.<br />
3<br />
ID<br />
10 2<br />
10'<br />
10°<br />
10 1<br />
". 0.5<br />
tu<br />
• a a o a<br />
•V.<br />
3 FAST<br />
•SLOW<br />
2 4 6 8 10 12 14 16<br />
ne/10"(cm- 3 )<br />
FIG. 4. (a) Intensity ofECE at a> = 1.6 oice, normalized to RF power as a function of density for two<br />
different spectra; (b) Ratio ofECE intensities at a — 1.4 uce <strong>and</strong> a> = 1.6 uce as a function of density.<br />
Radiation is only emitted in this range by fast electrons through the down shifted<br />
second harmonic emission. On the assumption that the perpendicular velocity is much<br />
lower than the parallel one, a precise n0 value corresponds to each detected frequency.<br />
In particular, nB = 1.4 corresponds to co = 1.4 wce <strong>and</strong> ny = 1.67 to<br />
w = 1.6 oice.<br />
ECE measurements are available for BT = 8 T <strong>and</strong> n,. < 1.4 X 10 14 cm" 3 .<br />
In this density range, the power component with nj = 1.67 can reach the plasma<br />
centre while the component with n] = 1.4 is converted to fast wave before reaching<br />
the plasma core.<br />
In Fig. 4(a), we show the ECE intensity at w = 1.6 wce normalized to RF<br />
power both for fast <strong>and</strong> slow spectra. As is expected, the fast spectrum yields a
<strong>IAEA</strong>-CN-50/E-III-3 643<br />
stronger emission than the slow one. This is because there is more power at<br />
nn = 1.67 in the fast than in the slow spectrum.<br />
In Fig. 4(b), the ratio of ECE intensity at 1.4 wce to the value at 1.6 a>C(. is<br />
reported as a function of density. The negative slope of this curve shows that, with<br />
increasing density, the component with lower nn decreases faster than the component<br />
with higher nj. This is consistent with the fact that, with increasing density, the<br />
lower nn becomes inaccessible to the plasma centre.<br />
The above results on accessibility <strong>and</strong> on plasma heating seem to indicate that<br />
also the inaccessible part of the spectrum contributes effectively to plasma bulk<br />
heating.<br />
REFERENCES<br />
[1] DE MARCO, F., in Application of RF Waves to Tokamak Plasmas (Course <strong>and</strong> Workshop<br />
Varenna, 1985), Vol. 1 (1985) 316.<br />
[2] PORKOLAB, M., ibid., p. 288.<br />
[3] CESARIO, R., PERICOLI-RIDOLFINI, V., Nucl. Fusion 27 (1987) 435.<br />
[4] ALLADIO, F., et al., Plasma Phys. Controll. Fusion 28 (1986) 179.<br />
[5] ALLADIO, F., et al., Nucl. Fusion 24 (1984) 725.<br />
[6] ALLADIO, F., et al., in Controlled Fusion <strong>and</strong> Plasma Heating (Proc. 15th Eur.<br />
Conf. Dubrovnik, 1988), Vol. 12B, Part III, European Physical Society (1988) 878.<br />
[7] SANTINI, F., in Application of RF Waves to Tokamak Plasmas (Course <strong>and</strong> Workshop<br />
Varenna, 1985), Vol. 1 (1985) 251.
<strong>IAEA</strong>-CN-50/E-ID-4<br />
LOWER HYBRID WAVE ABSORPTION AND<br />
ION HEATING STUDIES IN THE FT-2 TOKAMAK<br />
V.N. BUDNIKOV, L.A. ESIPOV, M.A. IRZAK, K.M. NOVIK,<br />
A.Yu. STEPANOV, V.O. ALEKSANDROV 1<br />
A.F. Ioffe Physico-Technical Institute,<br />
USSR Academy of <strong>Sciences</strong>,<br />
Leningrad, Union of Soviet Socialist Republics<br />
Abstract<br />
LOWER HYBRID WAVE ABSORPTION AND ION HEATING STUDIES IN THE FT-2<br />
TOKAMAK.<br />
It is shown that fast ion generation during lower hybrid heating experiments takes place in the<br />
region of the parametric decay instability near a density of n* = (0.3-0.5)nLH, where nLH is the lower<br />
hybrid density. Strongly slowed-down waves at a frequency of 0.7f0 (f0 is the frequency of the<br />
generator) have been detected in the vicinity of n* by the improved scattering technique. The frequency<br />
spectrum of these waves consists of either one or several lines with a width of a few MHz. With increasing<br />
plasma density the decay region shifts from the centre to the plasma edge, following the local density<br />
n*. This process explains both the central bulk ion heating at % = n* < nLH <strong>and</strong> the fast ion generation<br />
at the plasma periphery at higher central density no > n*.<br />
At present, it is generally accepted that LH ion heating in a tokamak is a result<br />
of the stochastic motion of ions in the field of a strongly slowed-down LH wave in<br />
the vicinity of the linear transformation point (nLH). This mechanism leads to fast<br />
ion generation <strong>and</strong>, owing to the collisions, to bulk ion heating [1]. The effective ion<br />
heating in the Wega, Petula <strong>and</strong> JFT-2 tokamaks has been explained by this mechanism.<br />
On the other h<strong>and</strong>, the excitation of parametric decay instabilities near the<br />
plasma edge leads to the generation of high energy ions which are quickly lost at the<br />
wall. Sometimes this process completely prevents the penetration of the waves into<br />
the plasma <strong>and</strong> the bulk ion heating. The absence of ion heating in FT, ASDEX <strong>and</strong><br />
PLT has been explained by this process. As the ion heating in the LH frequency range<br />
is brought about by fast ('tail') ion generation in the field of a slowed-down LH wave,<br />
a study of the localization <strong>and</strong> details of this process is of great interest. Such studies<br />
were carried out in the FT-2 tokamak as a continuation of previous experiments [2],<br />
<strong>and</strong> the results are presented in this paper.<br />
LH heating in the FT-2 tokamak (R = 55 cm, a = 8 cm, B = 1.2-2.7 T,<br />
Ip = 20-35 kA, n = (1-4) x 10 13 cm" 3 , T^ < 500 eV, Ti0 < 180 eV, Zeff = 2)<br />
was carried out by using waves at a frequency of f0 = 920 MHz excited by a two<br />
waveguide grill at the low field side of the torus with an N spectrum range of 2-4.<br />
M.I. Kalinin Polytechnical Institute, Leningrad, USSR.<br />
645
646 BUDNIKOV et al.<br />
100<br />
50<br />
34 36 38<br />
t (ms)<br />
975 fiV<br />
950eV<br />
FIG. 1. Time behaviour of fast neutral flux.<br />
The grill is supposed to excite in the plasma an electron plasma wave which, according<br />
to theory, is converted to a hot plasma wave in the LH resonance at the magnetic<br />
field B = 2.0-2.5 T <strong>and</strong> Zeff = 2 in the region with a local density of<br />
nLH = 4 X 10 13 cm" 3 , where the phase resonance condition vL » vph (or<br />
N± = c(2EiJL/mj)" 1/2 ; Ei± is the energy of a resonance ion) is satisfied <strong>and</strong> stochastic<br />
ion heating takes place.<br />
In the experiments two quite different types of time dependence of the charge<br />
exchange spectra were found — one with a steep rise of the flux at the beginning of<br />
the RF pulse (a few hundred microseconds) <strong>and</strong> the other with a smooth increase of<br />
the flux during several milliseconds (Fig. 1). The first type was observed at higher<br />
energies of the particles; apparently, they interacted with the wave directly. The<br />
smooth increase was observed at lower energies of the particles; evidently, they did<br />
not interact with the wave but acquired their energy in collisions with the high energy<br />
ions. The distinct transition from one type to the other took place when the analyser<br />
energy varied by 2.5% Only (Fig. 1). Thus, the minimum energy of the ions, E^,,,<br />
interacting with the wave, defines the maximum slowirig-down of the wave in the<br />
experiment <strong>and</strong> represents a certain value of interest. An essential parameter determining<br />
£„,;„ is the ion temperature, as the dependence of E^n on Ti0 taken in quite<br />
different discharges is directly proportional; its slope yields a value of<br />
Si = (Emin/Tio)"" 2 = vph/vTi « 2.75, which is close to the theoretical value of<br />
d[ = 2 V2 required for the effective stochastic heating of the ions by the LH<br />
wave [1].<br />
It should, however, be noted that in our experiments the bulk ion heating <strong>and</strong><br />
the suprathermal ion generation took place at such low magnetic fields <strong>and</strong> densities<br />
that there was no region with local density nLH inside the plasma. In such conditions<br />
the value of 5; was the same as expected (see left h<strong>and</strong> points in Fig. 2, obtained at<br />
B = 1.3 T <strong>and</strong> n = 1.8 X 10 13 cm" 3 ). The threshold density n*, when the fast<br />
40
1000 -<br />
500<br />
1001—<br />
o<br />
— 2<br />
35<br />
<strong>IAEA</strong>-CN-50/E-m-4 647<br />
1<br />
100<br />
; |eV)<br />
FIG. 2. Dependence of Emin on 7),<br />
RF = 120 kW<br />
I<br />
i Imsl<br />
/<br />
40<br />
<<br />
1<br />
200<br />
FIG. 3. Time behaviour of fast neutral fluxes for different plasma densities.<br />
ion generation began by a jump with the beginning of the RF pulse was much lower<br />
than nLH, i.e. n* ~ (O.3-O.5)nLH. For densities n < n*, the charge exchanged flux<br />
increased gradually since during the RF pulse the plasma density increased substantially<br />
(Fig. 3).<br />
At a density nf the generation of fast ions of a given energy stopped completely.<br />
The dependences of the threshold densities n* <strong>and</strong> nfon the energy E are<br />
shown in Fig. 4. To generate ions with a higher energy at a given RF power level,
648 BUDN1K0V et al.<br />
2<br />
E (keV)<br />
F/G. 4. Dependence of threshold densities n* <strong>and</strong> n*; on E.<br />
100 --<br />
50 --<br />
- /<br />
1500 eV<br />
/<br />
•<br />
X<br />
\<br />
7<br />
V*<br />
ne (10 13 cm- 3 )<br />
PRF = 30 kW<br />
/^2500eV<br />
>^~-3750aV<br />
F/G. 5. Dependence of fast neutral fluxes on plasma density.<br />
one must raise the density (Fig. 5). Such a sequence of appearance of ions of different<br />
energies is in contrast to the results obtained in Wega [3]. The density n* decreased<br />
with increasing RF power; for example, n* = 1.5 x 10 13 cm" 3 at PRP = 50 kW<br />
<strong>and</strong> n* = 1.2 x 10 13 cm" 3 at PRF = 100 kW (B = 2 T, Ip = 22 kA). The density<br />
n* also depended on the plasma current <strong>and</strong> rose slightly when the latter increased.<br />
For no > n*, fast ion generation took place in the central parts of the plasma<br />
(Fig. 6(b)).<br />
I
10<br />
10*<br />
10<br />
10<br />
<strong>IAEA</strong>-CN-50/E-HI-4 649<br />
l-° 0.5 -<br />
> i<br />
\<br />
^3750 eV<br />
0 1 2 3<br />
E (keV)<br />
2500 eV<br />
FIG. 6. Charge exchange particle energy spectrum.<br />
According to the phase resonance condition, the small index of refraction N x<br />
(or k±) of the wave corresponds to the higher energy of the ions. The dependence<br />
of the charge exchange spectra on PRF <strong>and</strong> n,. reflects the evolution of the wavenumbers<br />
of the waves interacting with the ions. This dependence is typical of the<br />
parametric instabilities, as the lowest thresholds appeared at larger k <strong>and</strong> the<br />
thresholds increased when k diminished. In the LH frequency range, the dependence<br />
of the threshold on the density is analogous [4]. Thus, we may conclude that wave<br />
absorption <strong>and</strong> fast ion generation are associated with a parametric instability.<br />
To study the region of the strongly slowed-down wave propagation <strong>and</strong>,<br />
conceivably, of the region of fast ion generation, the improved scattering technique<br />
was used [5]. Waves at a frequency of fs = 59 GHz were used for the probing.<br />
In Fig. 7, we present the spectrum of the increased scattered signal obtained at<br />
Bo = 1.85 T, no = 2.5 X 10 13 cm" 3 , Ip = 18 kA, PRF = 80 kW. The upper<br />
hybrid resonance point for the probing wave was situated at R = 60.2 cm<br />
(r = 5.2 cm).<br />
A characteristic of the spectrum is the discretization of the observed frequencies:<br />
along with a line at the generator frequency f0, a line at a shifted frequency<br />
was recorded in the range of 590-680 MHz. The line near f0 was broadened symmetrically<br />
by a few (2-4) MHz. The lines at the shifted frequency had a breadth of<br />
a few MHz, too.<br />
There was an essential difference in the spatial allocation of the scattered signals<br />
(Fig. 8) at f0 <strong>and</strong> at the shifted frequency: the first was recorded along the whole<br />
radius, <strong>and</strong> the latter was located in a very narrow region of less than one centimetre<br />
width along the radius. The local density in this area n, was approximately equal to<br />
the threshold density n*, at which 1-2 keV ion generation began (Fig. 4). When the
650 BUDNIKOV et a).<br />
» 4<br />
t<br />
660<br />
f (MHz)<br />
10 MHz<br />
920<br />
F/G. 7. Frequency spectrum of scattered wave.<br />
_ 2<br />
to<br />
4<br />
(cm)<br />
100<br />
60 ><br />
§<br />
FIG. 8. Spatial distribution of scattering power of shifted frequency.<br />
20
<strong>IAEA</strong>-CN-50/E-III-4 651<br />
density of the plasma increased, the localization of the increased scattering signal<br />
shifted to the plasma periphery, but the local density corresponding to the maximum<br />
of the signal remained virtually constant. When the heating power increased, the<br />
maximum of the signal shifted to the periphery, too, <strong>and</strong> corresponded to the lower<br />
local density. This was correlated with the fact that the threshold density n*<br />
diminished for increasing RF power.<br />
The pattern of the observed spectrum is typical of the parametric decay instability,<br />
but its discretization is uncommon. The decay spectra with a large frequency shift<br />
previously observed in tokamaks had been continuous from f0 down to the frequency<br />
of f * 0.7f0. Their formation had been associated with induced scattering<br />
(decay into a quasi-mode [7]). The narrow localization of the decay region, its shift<br />
towards lower local densities when the power is raised <strong>and</strong> the discrete structure of<br />
the spectrum seem to indicate that the development of the instability occurs at a power<br />
level just above the threshold.<br />
The daughter wave with a higher frequency of f, « 0.7f0 is apparently an LH<br />
wave; the other wave, f2 ~ 0.3f0, seems to be the ion Bernstein wave. For lack of<br />
equipment, the spectrum near 0.3f0 was not recorded. In the decay region, where<br />
the local density n* « (0.3-0.5)nLH, the wave at f * 0.7f0 is near its linear transformation<br />
point, i.e. it is strongly slowed down <strong>and</strong> can interact effectively with the<br />
ions. The ion Bernstein wave is damped effectively at the high ion cyclotron<br />
harmonics.<br />
If the ions are heated by the wave at a frequency f near its linear transformation<br />
point, the LH resonance condition should be satisfied for that wave in the plasma<br />
volume. Comparison of the experimental threshold of the fast ion generation with the<br />
920 MHz<br />
j I<br />
1 1<br />
2 3 4 ,5 6 7<br />
ne(10 13 cm- 3 )<br />
FIG. 9. Threshold densities at different magnetic fields <strong>and</strong> position of linear conversion surface.
652 BUDNIKOV et al.<br />
•a I -a<br />
10'<br />
120eV<br />
.320eV<br />
0 1 2<br />
E (keV)<br />
FIG. JO. Charge exchange particle energy spectrum for optimum ion heating.<br />
calculated curve for the LH resonance for f = 600 MHz, N! = 3, Zeff = 2 is<br />
presented in Fig. 9. We see that the ion generation region corresponds qualitatively<br />
to the resonance curve for 600 MHz <strong>and</strong> not for 920 MHz.<br />
Hence, it is clear that the optimum LH heating conditions consist in the equality<br />
of the central density to the threshold density r^ « n*. Besides this, the following<br />
circumstances should be take into account: (i) this density decreases when we raise<br />
the RF power; (ii) during the RF pulse the density of the plasma increases more<br />
strongly the higher the power, <strong>and</strong> this results in shifting the region with n* to the<br />
periphery. Both these facts reduce the heating efficiency when the RF power is<br />
raised. The choice of the optimum density was achieved by the maximum enhancement<br />
of the change exchange flux for the energy E = 1 keV, which is important for<br />
the bulk ion heating, <strong>and</strong> by the minimum flux for E = 3.75 keV at the beginning<br />
of the RF pulse. At B = 2.6 T <strong>and</strong> Ip = 35 kA, a density of r^ = 1.4 X 10 13 cm" 3<br />
appeared to be optimum: at PRF = 120 kW an ion heating from 120 to 320 eV was<br />
achieved (Fig. 10). By carefully choosing the optimum conditions, we obtained a<br />
directly proportional dependence of ATj on PRF in the range of 30-120 kW.<br />
Thus, our experiments allow us to suggest that LH ion heating in a tokamak<br />
occurs in the following manner: transport of the energy inside the tokamak occurs<br />
at a generator frequency f0 up to a density of n* « (0.3-0;5)nLH, where, as a result<br />
of the parametric decay, two strongly slowed-down waves at frequencies ~0.7f0<br />
<strong>and</strong> 0.3f0 are generated <strong>and</strong> interact effectively with the ions (Fig. 11). According<br />
to this model, RF energy is easily transported in the central parts of the tokamak,<br />
as the wave f0 easily reaches the region of n* « nLH; however, the energy cannot<br />
penetrate into the centre with density nLH, as was demonstrated by the ray tracing
<strong>IAEA</strong>-CN-50/E-IU-4 653<br />
I I I I I I<br />
FIG. 11. Perpendicular refractive index of propagated waves at frequencies f0 <strong>and</strong> f,.<br />
calculations talcing into account the real tokamak plasma geometry. At a given central<br />
density no, one can achieve the decay conditions no ~ n* = (0.3-0.5)nLH in the<br />
centre of the tokamak by choosing the proper generator frequency — raising it in<br />
comparison with the value predicted by linear theory. It turned out that both the decay<br />
<strong>and</strong> the fast ion generation were 'tied' to a certain local density; hence, the increase<br />
of the central density led to a shift of the region where these processes took place<br />
to the periphery <strong>and</strong> the heating efficiency decreased. Both the central bulk ion<br />
heating in the optimum conditions at no = 0.5nLH <strong>and</strong> the generation of the fast <strong>and</strong><br />
easily lost peripheral ions in a dense plasma, no « n, can be explained by this<br />
single mechanism of parametric decay. In our. opinion, the successful heating in<br />
Petula B [6] <strong>and</strong> JFT-2 [7] was associated, as in our experiments, with the region<br />
n* < nLH rather than with the linear transformation region nLH. Our calculations<br />
showed that, in the experiments on those devices, the density nLH was approximately<br />
twice as large as the maximum density ^ in the tokamak.<br />
In the same way, we can explain the vanishing of current drive (CD) when the<br />
density increases. It is well known that the CD results in a loop voltage drop:<br />
AUi/U; = IRF/IP. The CD efficiency decreases inversely proportionally to the<br />
density. The deviation of the dependence AU(n) from inverse proportionality should<br />
be indicative of the CD suppression. As shown in Fig. 12, it takes place at<br />
no = 1.3 x 10 13 cm- 3 .<br />
10 13 cm" 3 The loop voltage drop vanishes completely at QQ = 2 X , , when the<br />
decay region n* is located roughly at the half-radius <strong>and</strong> so the central part of the<br />
tokamak is shielded from the LH wave.
654 BUDNIKOV etal.<br />
0.5<br />
CM*<br />
ne(x10 13 cm" 3 )<br />
A 1500eV<br />
O 3750 eV<br />
FIG. 12. Dependence of current drive effect on plasma density.<br />
ACKNOWLEDGEMENTS<br />
I (a.u.)<br />
The authors would like to thank V.V. Dyachenko <strong>and</strong> O.N. Shcherbinin for<br />
their help in preparing the RF complex <strong>and</strong> the experiments.<br />
REFERENCES<br />
[1] GOLANT, V.E., FEDOROV, V.I., High-Frequency Plasma Heating Methods in Toroidal<br />
Thermonuclear Devices, Moscow, Energoatomizdat (1986) 69, 116 (in Russian).<br />
[2] BUDNIKOV, V.N., et al., in Controlled Fusion <strong>and</strong> Plasma Heating (Proc. 15th Eur. Conf.<br />
Dubrovnik, 1988), Vol. 12B, Part HI, European Physical Society (1988) 900, 904.<br />
[3] GORMEZANO, C, et al., in Heating in Toroidal Plasmas (Proc. 3rd Grenoble-Varenna Int.<br />
Symp. Grenoble, 1982), Vol. 2 (1982) 439.<br />
[4] PORKOLAB, M., Phys. Fluids 17 (1974) 1432 <strong>and</strong> 20 (1977) 2058.<br />
[5] ALEKSANDROV, V.O., et al., Problems of <strong>Nuclear</strong> Science <strong>and</strong> Technology, Termonuclear<br />
Fusion, Vol. 1 (1986) 30 (in Russian).<br />
[6] VAN HOUTTE, D., et al., in Heating in Toroidal Plasmas (Proc. 4th Int. Symp. Rome, 1984),<br />
Vol. 1 (1984) 554.<br />
[7] SUZUKI, N., et al., in Plasma Physics <strong>and</strong> Controlled <strong>Nuclear</strong> Fusion Research 1980 (Proc. 8th<br />
Int. Conf. Brussels, 1980), Vol. 2, <strong>IAEA</strong>, Vienna (1981) 525.<br />
100<br />
50
CURRENT DRIVE AND CONFINEMENT OF<br />
ANGULAR MOMENTUM IN TFTR<br />
<strong>IAEA</strong>-CN-50/E-III-5<br />
S.D. SCOTT, M. BITTER, R.J. FONCK, R.J. GOLDSTON,<br />
R.B. HOWELL 1 , H. HSUAN, K.P. JAEHNIG,<br />
G. PAUTASSO 2 , G. SCHILLING, B.C. STRATTON,<br />
M.C. ZARNSTORFF, C.W. BARNES 1 , M.G. BELL,<br />
H.-S. BOSCH 3 , C.E. BUSH 4 , A. CAVALLO,<br />
H.F. DYLLA, A.B. EHRHARDT, E.D. FREDRICKSON,<br />
G. GAMMEL, B. GREK, L.R. GRISHAM, G.W. HAMMETT,<br />
R.J. HAWRYLUK, H.W. HENDEL, K.W. HILL, A.C. JANOS,<br />
D.L. JASSBY, F.C. JOBES, D.W. JOHNSON, SJ. KILPATRICK,<br />
B. LeBLANC, D.K. MANSFIELD, R.T. McCANN,<br />
D.C. McCUNE, K.M. McGUIRE, D.H. McNEILL,<br />
S.S. MEDLEY, D. MUELLER, J.A. MURPHY, D.K. OWENS,<br />
H.K. PARK, A.T. RAMSEY, A.L. ROQUEMORE, J. SCHIVELL,<br />
J.E. STEVENS, G.D. TAIT, G. TAYLOR, J.R. TIMBERLAKE,<br />
H.H. TOWNER, M. ULRICKSON, R.M. WIELAND,<br />
M.D. WILLIAMS, K.-L. WONG, S.J. ZWEBEN, <strong>and</strong> the<br />
TFTR GROUP<br />
Plasma Physics Laboratory,<br />
Princeton University,<br />
Princeton, New Jersey,<br />
United States of America<br />
Abstract<br />
CURRENT DRIVE AND CONFINEMENT OF ANGULAR MOMENTUM IN TFTR.<br />
Co-tangential injection of 11 MW of neutral beam power in TFTR has driven the surface voltage<br />
negative for the full duration of two-second beam heating pulses in plasmas with Ip = 0.9 MA <strong>and</strong><br />
1.0 MA. The time history of surface voltage is consistent with modeling calculations which use both<br />
the beam-driven current <strong>and</strong> the bootstrap current. The co-tangential injection also drives strong plasma<br />
rotation, which can affect beam deposition <strong>and</strong> fusion reactivity. Transport simulations based on measured<br />
profiles of v4(R) <strong>and</strong> T,(R) indicate that momentum diffusivity is comparable to or larger than the<br />
ion thermal diffusivity. No significant changes in anomalous ion thermal diffusivity are seen when the<br />
beam power is balanced to reduce the input torque <strong>and</strong> rotation speed.<br />
1 Los Alamos National Laboratory, Los Alamos, NM, USA.<br />
2 Georgia Institute of Technology, Atlanta, GA, USA.<br />
3 Max-Planck-Insdtut fur Plasmaphysik, Garching, Federal Republic of Germany.<br />
4 Oak Ridge National Laboratory, Oak Ridge, TN, USA.<br />
655
656 SCOTT et al.<br />
1. Introduction<br />
A non-ohmic current drive mechanism is necessary for steady-state operation<br />
of a tokamak-based reactor. Two current drive techniques have been<br />
investigated experimentally on TFTR: the neoclassical bootstrap current<br />
<strong>and</strong> neutral-beam driven current. It has been found necessary to include<br />
the bootstrap current in order to explain the magnitude of surface voltage<br />
reversal during high /3p supershots with nearly balanced co- <strong>and</strong> countertangential<br />
beam injection [1].<br />
Neutral-beam current drive scenarios generally inject angular momentum<br />
intf) the plasma <strong>and</strong> can induce significant toroidal rotation. TFTR supershot<br />
plasmas show a strong degradation of performance with unbalanced<br />
injection, due in part to the simple downshift of the beam energy in the<br />
rotating plasma frame. This downshift contributes to a. reduction in beamdriven<br />
current, as well as to deleterious effects on fusion reactivity, beam<br />
deposition <strong>and</strong> energy confinement [2-4]. Thus it is of practical, as well<br />
as theoretical, importance to underst<strong>and</strong> the mechanisms of momentum<br />
transport in toka.mak plasmas.<br />
2. Neutral-beam Current Drive<br />
Neutral-beam heated plasmas in TFTR show evidence of strong non-ohmic<br />
currents [1]. During near-balanced co- <strong>and</strong> counter-tangential neutral injection<br />
the surface voltage Vsur is driven negative for high j3p plasmas. The<br />
time evolution of these plasmas was analyzed, <strong>and</strong> it was found to be necessary<br />
to include the predicted neoclassical bootstrap current in order to<br />
explain the observed V'sur evolution [1]. With the extension of the supershot<br />
regime to higher //> <strong>and</strong> Pmj [5], voltage reversal has been observed in<br />
IP = 1.4 <strong>and</strong> 1.6 MA plasmas having (3P > 1.1. Initial analysis continues to<br />
give good agreement between the measured <strong>and</strong> calculated VsllT when the<br />
bootstrap current is included.<br />
Co-tangential neutral-beam injection of 11 MW alone has been found to<br />
reverse Vsur for up to 2 seconds (the present pulse length limit of the neutral<br />
beams) for IP = 0.9 <strong>and</strong> ] .0 MA, <strong>and</strong> to reduce Vsur to ~ 0 for 1P - 1.2 MA.<br />
These plasmas have typical parameters of Te(0) = 6 keV, Ti(0) = 22 keV,<br />
ne(0) = 3.2 x 10 19 m- 3 , V{0) = 8 x 10 s m/s, <strong>and</strong> Zeff ~ 4.<br />
The plasmas have been modeled by the time-dependent ] i-D transport analysis<br />
code TRANSP [6], which calculates the expected V'JU7. (among other
1.0<br />
-0.5<br />
o -<br />
-<br />
4.0<br />
<strong>IAEA</strong>-CN-50/E-III-5 657<br />
i<br />
ip =<br />
i<br />
\ l<br />
1.0 MA Co- Only<br />
11 MW v$ =8x10 5 m/s<br />
^ OH Only II ~<br />
, OH + Beam 'l<br />
H 1<br />
OH + Beaml<br />
•+ Bootstrap<br />
4.5 5.0 I<br />
TIME (s)<br />
5.5 I 6.0 I<br />
FIG. 1. Time variation of Vmrfor the 1.0 MA discharge as determined from magnetic measurements<br />
<strong>and</strong> as calculated by TRANSP using several models (OH; OH + beam-driven current; OH + beamdriven<br />
current + bootstrap current).<br />
quantities) for different current drive hypotheses, given the experimental<br />
measurements of the kinetic profiles <strong>and</strong> the measured Zejj , as described<br />
in Ref. [lj. Figure 1 shows the results of the analysis of an Ip — 1.0 MA<br />
plasma.. The experimentally observed Vsur evolution is well matched when<br />
both the bootstrap <strong>and</strong> beam-driven currents are included in the analysis.<br />
It is interesting that, even for these plasmas with (ip ~ 1, for which<br />
the calculated bootstrap current is approximately 200 kA, inclusion of the<br />
bootstrap current is necessary to match the observed Vsur. In spite of the<br />
appearance that Vsur has reached equilibrium by the end of injection, the<br />
calculated total driven currents are 100-150 kA less than Ip. Since Vsur is<br />
negative this implies that the plasma has not reached ohmic equilibrium<br />
during the two seconds of injection. Good agreement is obtained at each<br />
of the three Ip values only if the bootstrap <strong>and</strong> beam-driven currents are<br />
included as theoretically predicted.<br />
It is very important to include the effects of toroidal rotation [2] in the<br />
analysis of these discharges. The rotation down-shifts the beam ions in the<br />
plasma frame, causing them to carry less net current <strong>and</strong> to slow down<br />
faster. If the rotation is neglected in modeling the plasma shown in Fig. 1,<br />
the calculated non-ohmic current rises to 1300 kA <strong>and</strong> the calculated Vsur<br />
drops to -0.24 volts, well below the measured value.<br />
3. Angular Momentum Transport Studies<br />
The central rotation velocity driven by unbalanced neutral beam injection as<br />
measured by a horizontally-viewing x-ray crystal spectrometer (XCS) scales<br />
i
658 SCOTT et al.<br />
FIG. 2. Central rotation speeds in TFTR measured by XCS as a junction of incident beam torque, normalized<br />
to line-averaged electron density.<br />
approximately linearly with increasing beam torque per electron [3,7]. The<br />
central velocity driven by a fixed value of Yb/rie is insensitive to plasma<br />
current, over the range lp - 0.6-2.2 MA (Fig. 2). Generally, lower rotation<br />
speeds (down by 15-20%) are driven by counter-injection than co-injection,<br />
independent of plasma current, for the same incident torque per particle.<br />
Similarly, lower ion temperatures [3] <strong>and</strong> lower global energy confinement<br />
times are also obtained with counter-injection (see Table I). The calculated<br />
first orbit losses for counter-injection are ~9% in the present beam<br />
configuration. Measurements of the time-dependent electron density profile<br />
peakedness (PTi '— ne(0)/) obtained by Abel-inverting 10-channel<br />
vertical interferometer data indicate no significant difference in the electron<br />
density profile shape between co- <strong>and</strong> counter-injection (Pn ~ 1.8-2.0).<br />
However in the data set discussed below, the density rise during counterinjection<br />
exceeded that during co-injection by about 20%.<br />
To document the scaling of velocity <strong>and</strong> the effects of rotation on plasma<br />
performance, a series of beam power scans (Pj, = 4.4 —» 15 MW) with coor<br />
counter- only injection was performed at both low <strong>and</strong> high plasma<br />
current (1.1 MA <strong>and</strong> 1.7/1.8 MA). These experiments were conducted at<br />
B-j- = 4.75 T, R — 2.45 m, a — 0.79 m with the plasma resting on a reasonably<br />
well conditioned inner bumper limiter. The ne of 1.1 MA ohmic<br />
target plasmas were in the range 0.76-0.82 xlO 19 m~ 3 , compared to the<br />
best (i.e. lowest) value in 1988 of ~ 0.74 x 10 19 m" 3 . Radial profiles of<br />
v${R) <strong>and</strong> Ti(R) were measured using charge-exchange recombination spectroscopy<br />
(CHERS) with a radially-directed diagnostic neutral beam to provide<br />
signal doping. Typical profile shapes of v^(R) <strong>and</strong> Ti(R) are illustrated
<strong>IAEA</strong>-CN-50/E-III-5 659<br />
TABLE I. SUMMARY OF MOMENTUM TRANSPORT ANALYSIS<br />
Ip<br />
(MA)<br />
1.1<br />
1.1<br />
1.8<br />
1.7<br />
1.1<br />
Direction<br />
CO<br />
ctr<br />
CO<br />
ctr<br />
bal<br />
Pb<br />
(MW)<br />
4.4<br />
7.3<br />
11.6<br />
7.3<br />
12.0<br />
15.0<br />
4.6<br />
9.2<br />
13.6<br />
5.1<br />
10.0<br />
15.1<br />
14.1<br />
He<br />
(10 19 m- 3 )<br />
1.4<br />
1.6<br />
2.0<br />
2.2<br />
2.4<br />
2.5<br />
2.0<br />
2.5<br />
2.8<br />
2.2<br />
3.1<br />
3.4<br />
2.3<br />
v
660 SCOTT et al.<br />
30<br />
25<br />
20 - / 1<br />
10<br />
[hi<br />
I Jo<br />
: * a<br />
5 '- °4.8 M\<br />
—i r<br />
A \<br />
15<br />
O -^t<br />
: / o<br />
n ' . I ,1<br />
2.5 3.0<br />
R(rti)<br />
n<br />
o<br />
(a) ;<br />
11.6 MW •<br />
-<br />
7.3 MW :<br />
^ J<br />
4t<br />
:<br />
2.5 3.0<br />
R(m)<br />
FIG. 3. Profiles of (a) ion temperature <strong>and</strong> (b) toroidal rotation speed measured by CHERSfor three<br />
discharges in a beam power scan at Ip = 1.1 MA. The solid line represents the ion temperature <strong>and</strong><br />
rotation speed mapped onto shifted flux surfaces for the 11.6 MW discharge. The vertical arrows<br />
represent the location of the magnetic axis for the 11.6 MW discharge.<br />
the plasma edge due to charge-exchange. |This perspective is supported by<br />
the edge-heating experiments [7] which showed an inward radial diffusion of<br />
angular momentum when torque was applied to the plasma edge only. The<br />
rotation profile was not hollow in the inner region of the plasma during the<br />
equilibrium phase of the discharge, implying that local damping of rotation<br />
(e.g., due to toroidal field ripple) is a much smaller effect than radial transport.]<br />
The steady-state momentum balance is evaluated by the 1-D radial<br />
transport code SNAP, using v,j,(R), ne(R), TC(R), <strong>and</strong> T{(R) mapped onto<br />
a minor radius grid using a shifted-circle equilibrium. The radial variation<br />
of X[ r ) IS determined from the momentum balance equation [2] which includes<br />
the deposition of beam torque calculated by a moments solution of<br />
the Fokker-Planck equation [8]. Details of the calculation are described in<br />
Ref. [9].<br />
Table 1 summarizes the global momentum confinement results of the beam<br />
power scans as calculated from the measured profiles of v^{R) <strong>and</strong> ne(R).<br />
The thermal momentum confinement times are rather short, ranging from<br />
29 to 56 msec, or 30-40% of the global energy confinement time. This result<br />
is consistent with velocity profile measurements on D-III, which find<br />
T 4> I T E ~ 0.5 in limiter discharges [10]. It should be stressed that many of<br />
these discharges are strongly beam-dominated, in the sense that the slowingdown<br />
beam ion population typically represents 50-65% of the stored momentum,<br />
more than 50% of the plasma stored energy, <strong>and</strong> up to 20% of the<br />
plasma mass. The global T$ for counter-injection is somewhat less than that
<strong>IAEA</strong>-CN-SO/E-in-S 661<br />
0.4<br />
RADIUS (m)<br />
FIG. 4. Momentum <strong>and</strong> ion thermal diffusivity derived from measured Tf(R) <strong>and</strong> v^(R) profiles for the<br />
1.1 MA beam power scan. The error bar at each point represents the st<strong>and</strong>ard deviation of the mean<br />
at three or four different power levels. Inside the hatched region, convection represents the dominant<br />
ion heat transport mechanism assuming Yhea, = ^7) X 1^,,,^,.<br />
for co-injection. Broader v^R) profiles are obtained at 1.7 <strong>and</strong> 1.8 MA,<br />
which, coupled with slightly broader density profiles, yield higher global<br />
T
662 SCOTT et al.<br />
The TFTR "supershot" regime [13,14], characterized by high neutron emission,<br />
high ion temperatures, <strong>and</strong> a broad electron temperature profile, is<br />
generally optimized by the use of near-balanced injection. It was recognized<br />
early [2] that classical effects associated with large toroidal rotation<br />
velocities could impair the performance of purely co-injected discharges:<br />
the relative energy between the incident beam neutrals <strong>and</strong> the plasma<br />
is reduced in the rotating plasma frame, leading to poorer fusion reactivity,<br />
poorer beam penetration, <strong>and</strong> broader beam power absorption profiles;<br />
beam power invested in pushing the plasma near the center is returned as<br />
heat to the thermal ions only as viscous dissipation at larger minor radii.<br />
Whether these effects are sufficient to account for the difference between coinjection<br />
<strong>and</strong> balanced supershot injection, or alternatively whether there is<br />
an underlying difference in the energy transport, is a question of considerable<br />
interest. To address this issue, the beam power scan was supplemented<br />
by a number of balanced discharges at the same current with P\, = 14 MW<br />
(Table 1). Profile measurements of v^,{R) <strong>and</strong> Ti(R) were obtained for coinjected<br />
discharges of slightly lower power, 11.6 MW. As expected, neutron<br />
emission improved by a. factor of nearly two with balanced injection, but in<br />
many respects the balanced discharges were only marginally within the supershot<br />
regime: the density peakedness ne(0)/ rose to 2.3 (compared<br />
to 3.0 on the best supershots), <strong>and</strong> the global energy confinement time derived<br />
from diamagnetic measurements was 130 ms (compared to > 160 ms<br />
in the best supershots). Figure 5 shows the calculated ion <strong>and</strong> electron<br />
thermal diffusivities for the balanced <strong>and</strong> co-rotating plasmas. There is<br />
no significant difference between the two cases, suggesting that the rotation<br />
speed of 1.5 x 10 5 m/s at r = a/2, corresponding to mach 0.25 at this<br />
radius (mach number = v^j\JTi/m = 0.6 at the plasma, center) has little<br />
effect on heat transport.<br />
4. Plasma Rotation <strong>and</strong> Impurity Transport<br />
Impurity transport in discharges with 11-14 MW of co-, counter-, or balanced<br />
beam injection was studied by impurity transport code analysis of<br />
line emissions of germanium injected using the laser-blowoff technique. The<br />
time evolution of extreme ultraviolet lines emitted by the core ionization<br />
state Ge +29 is shown in Fig. 6. The time to peak emission <strong>and</strong> subsequent<br />
decay time were shortest for counter-injection (Trjse ==-36 msec,<br />
r(jecay ~ 50 msec), somewhat longer for co-injection (50 msec; 70 msec)<br />
<strong>and</strong> considerably longer for balanced-injection (72 msec; 115 msec), indicating<br />
that impurity confinement is longest during balanced injection. This
10'<br />
Convection<br />
Dominates<br />
<strong>IAEA</strong>-CN-50/E-IH-5 663<br />
i i i i i » i<br />
O Balanced Injection<br />
• Co-Injection<br />
l i i i i i i I<br />
0.2 0.4 0.6<br />
RADIUS (m)<br />
0 Balanced Injection<br />
• Co-Injection<br />
1 I I L_<br />
0.2 0.4<br />
RADIUS (m)<br />
0.6 0.8<br />
FIG. 5. (a) Ion thermal diffusivity during co-injection <strong>and</strong> balanced injection with Ip = 1.1 MA. Error<br />
bars represent the st<strong>and</strong>ard deviation of four discharges in a beam power scan for the co-injection case,<br />
<strong>and</strong> the st<strong>and</strong>ard deviation of two simitar 14 MW discharges for the balanced injection case, (b) Electron<br />
thermal diffUsivity during co-injection <strong>and</strong> balanced injection.<br />
result is consistent with the observed behavior of metal density measured by<br />
soft x-ray PHA, which (when normalized to the metal density in the ohmic<br />
target plasma) falls with increasing power during co-injection but rises with<br />
power during balanced injection. The impurity diffusion coefficient in each<br />
case was deduced by modeling the time evolution of emission intensity with<br />
the MIST [15] impurity transport code. As shown in Fig. 6, the data are<br />
fit by a spatially constant D = 1.1 m 2 /s for balanced injection, 2.0 m 2 /s for<br />
co-injection, <strong>and</strong> 2.75 m 2 /s for counter-injection. Although convection is<br />
not necessary to properly reproduce the time history of the emission intensity,<br />
the data do not preclude small values of the convective velocity. The<br />
value of D in the balanced injection case is similar to that found with ohmic<br />
heating alone [16], indicating little difference in impurity transport.
664 SCOTT et al.<br />
Z3<br />
5. 2<br />
? 1<br />
Ge XXX 123 A<br />
Balanced Injection<br />
D= 1.1 m 2 /s<br />
Ge XXX 123 A<br />
Counter-Injection<br />
4.3 4.4 4.5 4.6<br />
FIG. 6. Time evolution ofGe XXX line radiation following laser blowoffinto beam heated discharges<br />
with balanced, co-, <strong>and</strong> counter-injection. Simulations of the emission intensity by the MIST code are<br />
shown for two cases: a constant diffusivity, <strong>and</strong> a step-function diffusivity which is larger in the plasma<br />
edge.<br />
The ISX-B [17,18] <strong>and</strong> PLT [19] tokamaks differ on the question of whether<br />
the observed change in central impurity density during co- versus counterinjection<br />
reflects modifications to impurity transport in the plasma, interior,<br />
as opposed to changes in edge transport only. Therefore it is of interest<br />
to consider whether the difference between impurity behavior in balanced
<strong>IAEA</strong>-CN-50/E-III-5 665<br />
versus unbalanced injection in these experiments can result from changes<br />
in the edge transport alone. We find that acceptable fits to the data can<br />
be obtained with a core diffusion coefficient equal to the balanced-injection<br />
value (D — ].] m 2 /s) if the value of D is increased to 3.0 m 2 /s <strong>and</strong> 5.0 m 2 /s<br />
for co- <strong>and</strong> counter-injection, respectively, in the region r/a > 0.5. However,<br />
it is not possible to model the decreased impurity confinement time in the coa.nd<br />
counter-injection discharges if D is presumed to remain flat at ].] m 2 /s<br />
out to r/a = 0.75, regardless of the magnitude of D assumed in the region<br />
r/a > 0.75. Thus these experiments indicate little difference in impurity<br />
transport due to heating, but perhaps a significant increase in the particle<br />
diffusivity due to rotation [20].<br />
5. Conclusion<br />
Co-tangential injection of 1J MW into low density TFTR plasmas has driven<br />
~~ 0.9 MA of plasma current for the full 2-second duration of the TFTR<br />
beam sources, maintaining a negative surface voltage for 7p(total) = 0.9<br />
<strong>and</strong> 1.0 MA. Modeling calculations which include both beam-driven current,<br />
<strong>and</strong> the bootstrap current yield excellent agreement with the measured<br />
KurO-ime). The relative contributions of the bootstrap <strong>and</strong> beam-driven<br />
currents to the total plasma current can be varied by injecting either balanced<br />
or only co-tangential beams. Thus the observation of agreement<br />
with model calculations in both cases provides some confidence that both<br />
current drive mechanisms are properly described theoretically.<br />
Simultaneous measurements of the ion temperature <strong>and</strong> velocity profile have<br />
yielded new insights into the mechanisms governing tokamak plasma, confinement.<br />
The radial transport of toroidal angular momentum has been<br />
found to be closely correlated with radial transport of ion energy. For both<br />
co- <strong>and</strong> counter-injection, <strong>and</strong> spanning the range of available beam power,<br />
we find that x*~ 1-2 x Xi throughout the confinement zone. This observation<br />
suggests that a common mechanism may drive anomalous radial<br />
transport of both ion energy <strong>and</strong> angular momentum. When the neutral<br />
beam torque <strong>and</strong> plasma rotation speed are reduced by injecting balanced<br />
beams, little change is observed in the magnitude of Xi or Xe > implying<br />
that energy transport is unaffected by rotation in the mach< 1 regime. By<br />
contrast, toroidal plasma rotation in either the co- or counter- direction<br />
appears to increase the diffusion coefficient of heavy impurities.<br />
The lack of enhancement in anomalous transport that can be correlated with<br />
plasma rotation in TFTR provides some basis for the expectation that an ignition<br />
tokamak experiment could utilize high energy neutral beam injection
666 SCOTT et al.<br />
to drive most or all of the current without serious consequences for confinement.<br />
Assuming that the global momentum confinement time continues to<br />
scale with global energy confinement time, which appears reasonable given<br />
the demonstrated correlation between x anf l Xi on TFTR <strong>and</strong> correlations<br />
between T^ <strong>and</strong> TE observed in JET [21] <strong>and</strong> D-III [10] during H-mode operation,<br />
then a central velocity of only ~3x 10 5 m/s would be driven in an<br />
JTER-class tokamak (/?. ~ 4-5 m, n « 2, ne % 1.0 x 10 2O m" 3 , T4>= ] .5 sec)<br />
utilizing ~ 60 MW of 1.0 MeV tangential beams for heating <strong>and</strong> current<br />
drive. This represents only 29% of the thermal velocity for '1\ — 30 keV <strong>and</strong><br />
only 3% of the beam velocity, so neither enhanced thermal transport nor<br />
broadening of the beam deposition profile would be expected on the basis<br />
of present experiments.<br />
Acknowledgements<br />
It is a. pleasure to acknowledge the many engineers, computer programmers,<br />
technicians, <strong>and</strong> other staff members who have supported the TFTR<br />
program. This work was supported by the US DOE, contract number DE-<br />
AC02-76-CIIO-3073.<br />
REFERENCES<br />
[1] ZARNSTORFF, M.C., et al., Phys. Rev. Lett. 60 (1988) 1306.<br />
[2] GOLDSTON, R.J., "Topics in confinement analysis of tokamaks with auxiliary heating", Basic<br />
Physical Processes of Toroidal Fusion Plasmas (Proc. Course <strong>and</strong> Workshop Varenna, 1985),<br />
Vol. 1, Commission of the European Communities, Luxembourg (1985) 165-186.<br />
[3] BITTER, M., et al., Plasma Phys. Control. Fusion 29 (1987) 1234.<br />
[4] ZARNSTORFF, M.C., et al., Paper <strong>IAEA</strong>-CN-50/A-III-3, these Proceedings, Vol. 1.<br />
[5] BELL, M.G., et al., Paper <strong>IAEA</strong>-CN-50/A-I-2, ibid.<br />
[6] HAWRYLUK, R.J., "An empirical approach to tokamak transport", Physics of Plasmas Close<br />
to Thermonuclear Conditions (Proc. Course Varenna, 1979), Vol. 1, Commission of the European<br />
Communities, Brussels (1979) 19^6.<br />
[7] SCOTT, S.D., et al., "Measurements of toroidal rotation on TFTR", Controlled Fusion <strong>and</strong><br />
Plasma Physics (Proc. 14th Eur. Conf. Madrid, 1987), Vol. 11D, Part I, European Physical<br />
Society (1987) 65-68.<br />
[8] CALLEN, J., et al., "Neutral beam injection into tokamaks", Plasma Physics <strong>and</strong> Controlled<br />
<strong>Nuclear</strong> Fusion Research 1974 (Proc. 5th Int. Conf. Tokyo, 1974), Vol. 1, <strong>IAEA</strong>, Vienna (1975)<br />
645-658.<br />
[9] SCOTT, S.D., et al., "Analysis of rotation speed radial profiles on TFTR", Controlled Fusion<br />
<strong>and</strong> Plasma Heating (Proc. 15th Eur. Conf. Dubrovnik, 1988), Vol. 12B, Part I, European Physical<br />
Society (1988) 103-106.<br />
[10] BURRELL, K.H., GROEBNER, R.J., St. JOHN, H., SERAYDARIAN, R.P., Nucl. Fusion<br />
28 (1988) 3-15.
<strong>IAEA</strong>-CN-50/E-III-5 667<br />
[11] ZARNSTORFF, M.C., etal., "Convective heat transport in TFTR supershots", Controlled<br />
Fusion <strong>and</strong> Plasma Heating (Proc. 15th Eur. Conf. Dubrovnik, 1988), Vol. 12B, Part I, European<br />
Physical Society (1988) 95-98.<br />
[12] MATTOR, N., DIAMOND, P., Phys. Fluids 31 (1988) 1180.<br />
[13] STRACHAN, J., et al., Phys. Rev. Lett. 58 (1987) 1004.<br />
[14] HAWRYLUK, R.J., et al., "TFTR plasma regimes", Plasma Physics <strong>and</strong> Controlled <strong>Nuclear</strong><br />
Fusion Research 1986 (Proc. 11th Int. Conf. Kyoto, 1986), Vol. 1, <strong>IAEA</strong>, Vienna (1987)51-64.<br />
[15] HULSE, R., Nucl. Technol./Fusion 3 (1983) 259.<br />
[16] STRATTON, B., to be published in Nucl. Fusion.<br />
[17] ISLER, R.C., et al., Nucl. Fusion 23 (1983) 1017-1037.<br />
[18] ISLER, R.C., MORGAN, P.D., PEACOCK, N.J., Nucl. Fusion 25 (1985) 386-391.<br />
[19] SUCKEWER, S., et al., Nucl. Fusion 24 (1984) 815-826.<br />
[20] WONG, K., CHENG, C, Phys. Rev. Lett. 59 (1988) 2643.<br />
[21] HAWKES, N.C., et al., "Profiles of toroidal plasma rotation", Controlled Fusion <strong>and</strong> Plasma<br />
Heating (Proc. 15th Eur. Conf. Dubrovnik, 1988), Vol. 12B, Part HI, European Physical Society<br />
(1988) 1061-1064.
DIII-D NEUTRAL BEAM<br />
CURRENT DRIVE EXPERIMENTS<br />
AT HIGH BETA POLOIDAL*<br />
<strong>IAEA</strong>-CN-S0/E-IU-6<br />
T.C. SIMONEN, M. MATSUOKA 1 , D.K. BHADRA, M.S. CHANCE 2 ,<br />
K.H. BURRELL, R.W. CALLIS, M.S. CHU, A.P. COLLERAINE,<br />
J. FERRON, J.M. GREENE, R.J. GROEBNER, R.W. HARVEY,<br />
D.N. HILL 3 , R.-M. HONG, R.A. JAMES 3 , A.G. KELLMAN, J. KIM,<br />
S. KINOSHITA 4 , L.L. LAO, J.M. LOHR, R.L. MILLER, T.H. OSBORNE,<br />
P.I. PETERSEN, P.A. POLITZER, G.D. PORTER 3 , H. St. JOHN,<br />
M.J. SCHAFFER, B.W. STALLARD 3 , R.D. STAMBAUGH,<br />
E.J. STRAIT, T.S. TAYLOR<br />
General Atomics,<br />
San Diego, California,<br />
United States of America<br />
Abstract<br />
DIII-D NEUTRAL BEAM CURRENT DRIVE EXPERIMENTS AT HIGH BETA POLOIDAL.<br />
Neutral beam current drive experiments in the DIII-D divertor tokamak are described. Plasma<br />
currents up to 0.34 MA have been sustained by neutral beams alone with H-mode quality energy confinement.<br />
Poloidal beta values reach i3p = 3.5 without disruption or coherent magnetic activity, suggesting<br />
that these plasmas may be entering the second stability regime. At such high /3p the trapped<br />
particle averaged toroidal drift is reversed over half of the plasma. In these experiments helicity, but<br />
not flux, conservation is observed.<br />
1. INTRODUCTION<br />
The DIII-D program has been investigating high beta plasma confinement<br />
with neutral beam heating using ohmic current drive [1,2]. Our<br />
longer range goal is to sustain <strong>and</strong> investigate high beta plasmas with<br />
noninductive current drive. To this end we have initiated neutral beam<br />
current drive experiments reported here <strong>and</strong> are preparing high power rf<br />
systems [3] to develop efficient current drive for the ITER steady-state<br />
mission <strong>and</strong> to access more favorable high beta second stability regimes.<br />
* This is a report of work sponsored by the US Department of Energy under Contracts<br />
DE-AC03-84ER51044, W7405-ENG-48 <strong>and</strong> DE-AC02-76-CHO-3073.<br />
1 Japan Atomic Energy Research Institute, Japan.<br />
2 Plasma Physics Laboratory, Princeton University, Princeton, NJ, USA.<br />
3 Lawrence Livermore National Laboratory, Livermore, CA, USA.<br />
4 Hitachi Ltd, Japan.<br />
669
670 SIMONEN et al.<br />
Neutral beam current drive [4] has been demonstrated in the Culham<br />
Levitron [5] <strong>and</strong> several tokamaks; DITE [6], TFTR [7], JET [8], <strong>and</strong><br />
DIII-D [9]. The DIII-D tokamak [10] was operated with a single null divertor<br />
configuration having a 1.7 m major radius, 0.6 m minor radius, 1.75<br />
vertical elongation, <strong>and</strong> 2.1 T toroidal magnetic field. Most experiments<br />
were carried out with a helium plasma having a line-averaged density<br />
ne = 2 x 10 19 m~ 3 <strong>and</strong> Z
<strong>IAEA</strong>-CN-50/E-III-6 671<br />
2. NEUTRAL BEAM CURRENT DRIVE RESULTS<br />
Plasma parameters are shown in Fig. 1 as a function of time. Initially<br />
a 0.22 MA ohmic discharge was established without sawteeth, indicating<br />
an on-axis safety factor qo > 1. Beginning at 1.1 sec the ohmic heating<br />
primary coil current was held constant, so without beam injection the<br />
plasma current decayed, as shown by the dashed line of Fig. la. With<br />
10 MW of absorbed neutral beam injection (Fig. lb), the plasma current<br />
increased to 0.34 MA. During the period when the current was sustained,<br />
the loop voltage (Fig. lc) <strong>and</strong> surface voltage were zero, excepting periodic<br />
voltage spikes associated with edge localized relaxation phenomena.<br />
Neutral beam injection increased the total plasma energy as shown in<br />
Fig. le. The similarity between magnetic <strong>and</strong> diamagnetic measurements<br />
indicates comparable parallel <strong>and</strong> perpendicular pressure as expected by<br />
the beam injection geometry. We estimate half of the plasma energy is<br />
attributed to energetic beam ions. The poloidal beta, shown in Fig. If,<br />
reached 3.5.<br />
The 24 ms energy confinement time (uncorrected for the 30% calculated<br />
beam ion orbit losses) of this noninductive low-current high-power<br />
discharge (72 ms/MA) is as good as the DIII-D H-mode scaling obtained<br />
with 8.4 MW hydrogen beam injection into a deuterium ohmic currentdriven<br />
plasma, <strong>and</strong> 2.4 times longer than Kaye-Goldston L—mode sealing<br />
[12].<br />
i:<br />
3.<br />
(a)<br />
O = VERTICAL<br />
• = TANGENTIAL<br />
10 12 14 16 IS 2.0 22 2.4<br />
R(m)<br />
/<br />
Ib)<br />
10 12 14 18 It 2.0 2J2 2.4<br />
FIG. 2. Radial profile measurements at 1.4 s for the shot of Fig. 1: (a) ion temperature <strong>and</strong> (b) rotation<br />
speed.<br />
Charge exchange recombination spectroscopy measurements of helium<br />
ion temperature <strong>and</strong> rotation speed are shown in Fig. 2. The central<br />
helium ion temperature was 2 keV <strong>and</strong> the central rotation speed was<br />
92 km/s, 2% of the injected beam ion speed. The Shafranov radial outward<br />
shift of the temperature profile agrees with magnetic measurements.<br />
This temperature profile is narrower than commonly observed in Dili—D.
672 SIMONEN et al.<br />
1.6 2.0<br />
FIG. 3. The dependence of driven plasma current on central electron temperature. The solid line is the<br />
total driven current predicted by ONETWO. The dashed line is without the bootstrap contribution.<br />
We estimate the L/R time constant to be 2 sec. Since the plasma<br />
current is essentially constant for 1.5 sec, we conclude that the current is<br />
largely sustained by the neutral beams. Transport code [13,14] studies of<br />
these discharges predict 0.3 to 0.4 MA of beam-driven current. In addition<br />
to the above experiments with constant ohmic heating coil current<br />
we have also carried out experiments with: (1) feedback control for constant<br />
plasma current, (2) feedback control for zero loop voltage, (3) ohmic<br />
heating coil opened at zero current, <strong>and</strong> (4) counter-injected neutral beam<br />
current. These experiments are also consistent with transport code modeling.<br />
The beam-driven current is proportional to the electron temperature<br />
Te, as seen in Fig. 3. The variation in the low electron temperature data<br />
resulted from the plasma X—point contacting unconditioned portions of<br />
the wall. The ohmic power supplies were disconnected <strong>and</strong> the loop voltage<br />
was less than 50 mV. The closed circles were taken during the period<br />
of constant plasma current <strong>and</strong> the open circles during the slow decay of<br />
the current. Also shown in Fig. 3 are ONETWO transport code modeling<br />
of the beam-driven <strong>and</strong> bootstrap currents. The calculated [13,14] <strong>and</strong><br />
measured total currents agree. In spite of the high poloidal beta, the calculated<br />
bootstrap contribution is small for the low electron temperatures<br />
(i/« > 1) <strong>and</strong> the broad radial density profiles of these discharges.<br />
3. HIGH BETA POLOIDAL CHARACTERISTICS<br />
While the toroidal beta is only 0.5%, the poloidal betas [15] are<br />
remarkably high. Several discharges with MHD 0P > 3.4 <strong>and</strong> diamagnetic<br />
/3p > 3.0 have been produced without disruptions or coherent n ^ 0<br />
modes. The f3p — 3.5 discharge shown in Figs. 1 <strong>and</strong> 2 has an inverse<br />
aspect ratio e = 0.31, so that e(3p = 1.1. While these values of (3P <strong>and</strong> e/3p<br />
are among the highest achieved in a tokamak, they are not remarkable<br />
in themselves. What is remarkable is the absence of the large amplitude
3.0<br />
0.0<br />
0.2<br />
0.0<br />
0.2<br />
0.0<br />
30.0<br />
SXR (r/i = 0)<br />
SXB(r/i"0.8)<br />
Ha EMISSION (DIVERTOR)<br />
, IMIOPLANE)<br />
<strong>IAEA</strong>-CN-50/E-IU-6 673<br />
-30.0<br />
1700 1720 1740 1760 1780 1800<br />
TIME (m)<br />
FIG. 4. Time dependence of (a) central soft X-ray emission, (b) edge soft X-ray emission, (c) divertor<br />
Ha emission, (d) poloidal field fluctuations at the outer wall midplane (in gauss).<br />
•<br />
600<br />
400<br />
200<br />
0<br />
Jb)<br />
_<br />
t<br />
$<br />
(l)<br />
(d)<br />
I<br />
t<br />
$<br />
; J<br />
y<br />
•n i<br />
1.1 2.3<br />
FIG. 5. A comparison between ohmic (1.03 s — dashed line) <strong>and</strong> beam driven (1.4 s — solid line) EFIT<br />
magnetic analysis of (a) flux surfaces, (b) midplane plasma current density, <strong>and</strong> (c) safety factor q.<br />
1.1<br />
« t
674 SIMONEN et al.<br />
MHD modes, observed in ISX-B [16] <strong>and</strong> Doublet III [17] at high 0P. As<br />
shown in Fig. 4, no sawteeth are present in the central soft X-ray emission.<br />
Edge localized modes (ELMs) similar to those observed at lower j3p are<br />
seen on the Ha emission in the divertor region, <strong>and</strong> on the soft X—ray<br />
signals near the edge of the discharge. Despite the large (3p, the moderately<br />
large ratio of toroidal beta to I/aB, <strong>and</strong> the large fast ion population, the<br />
only coherent MHD activity observed on the magnetic probes is associated<br />
with the ELMs. Except during the ELM events, the amplitude of poloidal<br />
magnetic field oscillations measured at the wall is at most 0.1% of the total<br />
poloidal field.<br />
Figure 5 shows EFIT magnetic analysis [18] of measurements from<br />
41 flux loops distributed around the outside <strong>and</strong> 25 magnetic probes distributed<br />
around the inside wall of the DIII-D vacuum vessel. Shownare<br />
the flux surface equilibrium, toroidal current density <strong>and</strong> q profiles at two<br />
times: (a) before beam injection <strong>and</strong> (b) in steady-state when /9p = 3.5.<br />
This analysis is based on a third-degree polynomial for j versus magnetic<br />
flux. The radial current profile exhibits (see Fig. 5b) a 0.2 m outward<br />
Shafranov shift <strong>and</strong> an extreme outward current peaking which, together<br />
with ej3p > 1, are indicators of possible second region stability.<br />
The issue of whether these plasmas entered the second stable regime<br />
revolves around the exact value of the axial safety factor qo. MHD equilibrium<br />
analysis of external magnetic measurements for these elongated<br />
plasmas can determine accurately the plasma shape, edge q (or q at the<br />
95% flux surface, qgs), the poloidal beta /?p, the plasma internal inductance<br />
ti [18], i<strong>and</strong> the magnetic axis shift. Information on q0 is only weakly<br />
1000<br />
-5.0 -2.5 0<br />
PRESSURE GRADIENT P^<br />
1 ST REGIME<br />
RADIUS<br />
NORMALIZED *<br />
PLASMA CENTER<br />
FIG. 6. A stability diagram for shot 57456 with q0 = 3 calculated with the CAMINO code. Here \<br />
is the radial flux coordinate, <strong>and</strong> p^, <strong>and</strong> q^ are the pressure <strong>and</strong> safety factor gradients relative to $<br />
The bold curve indicates that the plasma is at the entrance to the second stability region.
<strong>IAEA</strong>-CN-50/E-HKS 675<br />
obtained <strong>and</strong> is sensitive to the functional forms assumed in fitting the<br />
current profile. Our best estimates are that the axial qa during NBI current<br />
drive is 3. The absence of soft X-ray sawteeth supports go > 1 in<br />
the ohmically-heated plasma <strong>and</strong> the drop in t* seen in Fig. lg shows current<br />
profile broadening during neutral beam injection that would further<br />
increase<br />
A perturbative technique [19] which generalizes the well-known s — a<br />
ballooning stability diagram to arbitrary tokamak geometry, <strong>and</strong> is applied<br />
independently to every equilibrium flux surface, indicates that the plasma<br />
is entering the second stability region if qo > 2.5. This is depicted in<br />
the diagram of Fig. 6 which shows the space curve (bold line) of the<br />
equilibrium profile determined from magnetic measurements in relation<br />
to the ballooning stability boundaries of the equilibrium.<br />
In lower temperature (1 keV) <strong>and</strong> lower current (0.2 MA) experiments,<br />
beta poloidals up to 4.5 have been produced (e/3p = 1.4). In these<br />
recent experiments, we experienced difficulties with plasma shape control<br />
which will be overcome in future experiments.<br />
4. DRIFT REVERSAL<br />
Plasma stability to trapped particle modes in the collisionless regime,<br />
u* < 1, is strongly influenced by the single particle bounce-averaged,<br />
Average Trapped Particle Toroidal Drift is Reversed at pp = 3.5<br />
Expected to aid collisionless trapped particle mode stability<br />
high<br />
low<br />
0.2 0.4 0.6<br />
Radius ^<br />
(Normalized * )<br />
0.8 1.0<br />
FIG. 7. Trapped particle averaged toroidal drift (a>dTti versus normalized poloidal flux, $. $> = 0 is<br />
the magnetic axis <strong>and</strong>^i = 1 is the plasma edge. The $p = 3.5 shot is that of Fig. 1. The low @p case<br />
is a st<strong>and</strong>ard DIH-D discharge.
676 SIMONEN et al.<br />
toroidal drift of the trapped particles [20,21]. Reversing the single particle<br />
drift will enhance stability of the collisionless trapped particle mode where<br />
it determines stability [22,23]. It is of interest to examine the present<br />
DIII-D equilibria for drift reversal even though v* ~ 1.<br />
The toroidal drift is determined by curvature, VB, <strong>and</strong> shear; particles<br />
trapped on the outside of a flux surface are in the "bad curvature<br />
region" <strong>and</strong> their drifts are in the destabilizing direction. These drifts<br />
can be reversed, however, at high f3p by the diamagnetic effect which can<br />
reduce or reverse VB. Of course, trie plasma may be unstable to MHD<br />
modes at the required f3p values. In Fig. 7, we show a plot of the averaged<br />
trapped particle toroidal drift, {wdTfc>)j versus normalized poloidal<br />
flux for two equilibrium fits to DIII-D discharges. Here u>a is the toroidal<br />
drift frequency <strong>and</strong> Tb is the bounce time. Both equilibria are stable to<br />
ballooning modes. The brackets indicate that wart, is averaged over the<br />
trapped particle population assuming an isotropic distribution. For the<br />
low /?p case no drift reversal occurs. For the high /?p case, (iOdT\>) is negative<br />
over half of the plasma. This indicates that sufficient /3p has been<br />
obtained to enhance trapped particle mode stability over a large region of<br />
the plasma. Lower collisionality would be required before we could expect<br />
to see significant changes in confinement.<br />
5. MAGNETIC HELICITY CONSERVATION<br />
These neutral beam current drive experiments provide evidence that<br />
magnetic helicity is more invariant than internal poloidal flux. Magnetic<br />
helicity [24-26] is thought to be the best conserved of the ideal MHD invariants<br />
in the presence of dissipation when magnetic energy dominates<br />
over fluid kinetic energy [27], which is the tokamak case. This has motivated<br />
speculation that if helicity conserving tearing modes redistribute<br />
the bootstrap currrent, then a completely bootstrapped tokamak may be<br />
possible [24]. Similarily, helicity injection [28,29] has been proposed as an<br />
efficient current drive scheme.<br />
The 11 MW heating power step <strong>and</strong> simultaneous release of current<br />
regulation at 1.1 sec affords a unique opportunity to observe transient<br />
plasma behavior in the absence of inductive input. The new steady-state is<br />
reached in about 0.1 s. Since the plasma L/R time is about 2 s, one might<br />
expect the ideal MHD flux invariants to be reasonably well conserved<br />
across the transient. The more commonly discussed invariants are safety<br />
factor profile g(V0i poloidal flux ^ linked by the plasma boundary <strong>and</strong><br />
V>o linked by the magnetic axis; the internal poloidal flux tj}\at = ipo ~ V'b<br />
<strong>and</strong> toroidal flux Xint! <strong>and</strong> magnetic helicity K. These internal plasma<br />
variables are calculated by the MHD equilibrium code EFITD [18] from<br />
measured magnetic data.<br />
The plasma current increase of 55%, from 220 kA to 340 kA, is<br />
accompanied by a dramatic increase in /3p, from 1.0 to 3.4, <strong>and</strong> a large<br />
decrease in £i, from 2.3 to 0.9. In Fig. 8(b) the increased poloidal field at<br />
the outer midplane reflects the increased /3p+£i/2. As seen in Fig. 8(c), the
0.5-<br />
o.o -1<br />
0.2-<br />
0.0-<br />
1.0-<br />
0.6-<br />
4.0-<br />
0.0-<br />
1.0-<br />
n n -<br />
I(MA)<br />
BPOL (T)<br />
FLUX (Wb)<br />
<strong>IAEA</strong>-CN-50/E-III-6 677<br />
*^<br />
INDUCTANCE (^H)<br />
/<br />
""'\<br />
..1 •<br />
HELICITY (Wb 3 )<br />
57456<br />
N8I<br />
i.<br />
' • • • ' " • • • ' , i . , 1.11<br />
• • • ! • !<br />
OUTER<br />
INNER "<br />
***•—<br />
\<br />
\<br />
..<br />
(a)<br />
(fa)<br />
• • ^Tnt ' C '<br />
•"" L»<br />
W<br />
_' W<br />
500 1000 1500 2000 2500 3000<br />
TIME (ms)<br />
FIG. 8. Transient magnetic behavior: (a) plasma current; (b) midplane poloidal magnetic field;<br />
(c) poloidal fluxes; (d) plasma internal inductance; <strong>and</strong> (e) magnetic helicity K.<br />
external poloidal flux V'b changed by less than 5% of -0int = L^I. Therefore,<br />
the current rise was not driven by changing ipb, but it can be interpreted<br />
as resulting from an extraordinary drop in internal plasma inductance.<br />
In general, there is some uncertainty in the EFITD calculation of V'int-<br />
However, the parallel behavior in Fig. 8(d) between L^ <strong>and</strong> the more<br />
certain poloidal magnetic energy inductance, Lw, indicates that in this<br />
case the calculation is reliable. Because there is a 30% decrease of •V'intj<br />
we conclude that poloidal flux is not strongly conserved. Safety factor q<br />
also varied, not only in the cool plasma near the edge, but also in the hot<br />
plasma on axis. Toroidal flux is held nearly constant in this experiment,<br />
so its conservation is not tested.<br />
An interesting feature of this experiment is that helicity is conserved.<br />
Following [26], helicity of the MHD equilibrium fits is calculated by K =<br />
— /. b x($)d$i where x(^) <strong>and</strong> V> are respectively the toroidal <strong>and</strong> poloidal<br />
fluxes linked by the internal plasma magnetic surface labeled by ifi. The<br />
calculated helicity is insensitive to the poorly known internal current distribution,<br />
because most of the flux linkage contributing to the helicity
678 SIMONEN et al.<br />
occurs near the plasma edge. As seen in Fig. 8(e), helicity is nearly invariant<br />
across the transient. The wiggles during the transient are due<br />
in part to averaging during the dynamic phase <strong>and</strong> in part to neglected<br />
dynamic terms in the helicity conservation equation [24j. We believe this<br />
is the first documented observation of magnetic hehcity invariance in a<br />
tokamak.<br />
The authors would like to thank our DIII-D colleagues for assistance<br />
in carrying out <strong>and</strong> interpreting these experiments. In addition, we wish<br />
to acknowledge valuable discussions with T.H. Jensen, J. Kesner, M.E.<br />
Mauel, M. Shimada, <strong>and</strong> A.M.M. Todd.<br />
REFERENCES<br />
[1] STRAIT, E.J., etal., This conference; <strong>IAEA</strong>-CN-50/A-2-1.<br />
[2] BURRELL, K.H., etal., This conference; <strong>IAEA</strong>-CN-50/A-3-4.<br />
[3] PRATER, R., etal., This conference; <strong>IAEA</strong>-CN-50/E-1-2.<br />
[4] OHKAWA, T., Nud. Fusion 10 (1970) 185.<br />
[5] START, D.F.H., et al., Phys. Rev. Lett. 23 (1978) 1497.<br />
[6] CLARK, W.H.M., et al., Phys. Rev. Lett. 45 (1980) 1101.<br />
[7] ZARNSTORFF, M., it et al., Phys. Rev. Lett. 60 (1988) 1306.<br />
[8] CHALLIS, C, et al., Proc. 14th European Conf. on Controlled<br />
Fusion <strong>and</strong> Plasma Heating, Madrid, Spain, September 1987.<br />
[9] SIMONEN, T.C., etal., Phys. Rev. Lett., 61, (1988) 1720.<br />
[10] LUXON, J.L., <strong>and</strong> DAVIS, L.G., Fusion Technol. 8, (1985) 441.<br />
[11] KIM, J., et al., Proc. 12th Symp. on Fusion Engineering, (IEEE,<br />
New York, 1987), Vol. 1, p. 290.<br />
[12] KAYE, S.M., <strong>and</strong> GOLDSTON, R.J., Nucl. Fusion 25 (1985) 65.<br />
[13] PFEIFFER, W., etal., "ONETWO — A computer Code for Modeling<br />
Plasma Transport in Tokamaks," General Atomic Report GA-<br />
A16178 (1980).<br />
[14] TANI, K., et al., ACCOME Code, JAERI Report JAERI-M 88-042,<br />
March 1988, <strong>and</strong> to be published.<br />
[15] Poloidal Beta is denned as /3p = 2(io < p > /Bp where fio = An X<br />
10~ 7 H/m, < p > is the total plasma pressure integrated over the<br />
plasma volume <strong>and</strong> Bp = ^o/p/(poloidal circumference).<br />
[16] DUNLAP, J.L., et al, Phys. Rev. Lett. 48 (1982) 538.
<strong>IAEA</strong>-CN-50/E-HI-6 679<br />
[17] STRAIT, E.J., et al., Proc. 11th Conf. on Controlled Fusion <strong>and</strong><br />
Plasma Physics, (EPS Aachen) (1983) p. 59.<br />
[18] LAO, L., et al., Nucl. Fusion 25 (1985) 1611.<br />
[19] CHANCE, M.S., in Theory of Fusion Plasma (Proceedings, Varena,<br />
Italy, September 1987).<br />
[20] TANG, W.M., Phys. Fluids 17, (1974) 1249.<br />
[21] ADAM, J.C., TANG, W.M., <strong>and</strong> RUTHERFORD, P.H., Phys. Fluids<br />
19, (1976) 561.<br />
[22] KADOMTSEV, B.B., <strong>and</strong> POGUTSE, O.P., Nucl. Fusion 11, (1971)<br />
67.<br />
[23] MILLER, R.L., CHU, M.S., DOMINQUEZ, R.R., <strong>and</strong> OHKAWA,<br />
T., General Atomics Report GA-A19341 (1988) submitted to Comments<br />
on Plasma Physics <strong>and</strong> Controlled Fusion.<br />
[24] BOOZER, A.H., Phys. Fluids 29 (1986) 4123.<br />
[25] JENSEN, T.H. <strong>and</strong> CHU, M.S., Phys. Fluids 27 (1984) 2881.<br />
[26] JARBOE, T.R. <strong>and</strong> MARKLIN, G.J., in Proc. Seventh Compact<br />
Torus Symposium (Santa Fe, New Mexico, May 21-29, 1985).<br />
[27] MONTGOMERY, D., <strong>and</strong> PHILLIPS, L., submitted to Physica D<br />
(1988).<br />
[28] HARTMAN, C.W., ei
NEW CURRENT DRIVE AND<br />
CONFINEMENT TECHNIQUES FOR<br />
IMPROVED TOKAMAK OPERATION<br />
T. OHKAWA, V.S. CHAN, M.S. CHU,<br />
R.R. DOMINGUEZ, R.L. MILLER<br />
General Atomics,<br />
San Diego, California,<br />
United States of America<br />
Abstract<br />
<strong>IAEA</strong>-CN-50/E-m-7<br />
NEW CURRENT DRIVE AND CONFINEMENT TECHNIQUES FOR IMPROVED TOKAMAK<br />
OPERATION.<br />
Tokamak operation can be improved by efficient steady state RF current drive <strong>and</strong> by enhanced<br />
confinement. Here circularly polarized, low frequency waves are shown to drive current by means of<br />
helicity injection. The efficiency is estimated to be good <strong>and</strong> is independent of density, making it attractive<br />
for fusion reactors. Tokamak confinement is addressed by improving stability to trapped particle<br />
modes in the regime v* < 1 by plasma shaping. Small aspect ratio improves stability <strong>and</strong> the optimal<br />
cross-section found is 'comet-shaped' with the tip of the tail pointed toward the major axis.<br />
1. INTRODUCTION<br />
Tokamak reactors can be made more economical by improved confinement<br />
<strong>and</strong> steady state current drive. Improved confinement can reduce<br />
the size of the tokamak <strong>and</strong> the power required for ignition while<br />
non-inductive current drive allows for continuous operation. The two<br />
concepts are closely related, e.g., improved confinement results from<br />
increasing density while current drive efficiency generally drops with<br />
increasing density. Additionally, a device with improved confinement<br />
may require improved current drive efficiency as well before the overall<br />
power requirements are actually reduced.<br />
Here we address both issues by showing how low frequency circularly<br />
polarized waves may offer enhanced current drive efficiency, particularly<br />
at high densities, <strong>and</strong> by showing how confinement — specifically,<br />
stability to trapped particle modes — can be improved by plasma<br />
shaping.<br />
681
682 OHKAWA et al.<br />
2. CURRENT DRIVE IN HIGH DENSITY PLASMAS<br />
WITH CIRCULARLY POLARIZED WAVES<br />
Steady state current drive [1] can be achieved by supplying linear<br />
momentum to electrons via waves launched into the plasma. The power<br />
requirements for various waves are rather high. Plasma current can also<br />
be maintained [2] by injecting plasma helicity. However, the transport<br />
of helicity to the plasma center is not well understood. Electromagnetic<br />
waves with circular polarization also possess helicity [3]. If the wave<br />
helicity can be absorbed by the plasma to balance the helicity lost to<br />
ohmic dissipation, steady state current drive with ohmic-like efficiency is<br />
anticipated. RF current drive with helicity injection has been considered<br />
previously [4], but here the helicity transfer from wave to plasma is made<br />
explicit.<br />
Consider a circularly polarized photon with energy %(v <strong>and</strong> helicity<br />
Hok^Tiw where k is the wavenumber. The absorbed power Pab is related<br />
to the injection rate of helicity H by<br />
ab ~Mo dt<br />
The decay rate of the tokamak plasma helicity is given approximately<br />
by<br />
~^2VojtoBt<br />
where r\ is the plasma resistivity, j is the current density, B is the<br />
magnetic field, <strong>and</strong> the subscripts o <strong>and</strong> t denote the on-axis values <strong>and</strong><br />
the toroidal components.<br />
If the helicity of the absorbed photons is completely converted to<br />
plasma helicity, the power required to maintain jto is thus<br />
[1)<br />
(2)<br />
Pab = 2feWtoJ?t (3)<br />
The power can be compared to the ohmic power POH-<br />
We obtain<br />
where q is the safety factor <strong>and</strong> R is the major radius. The wavenumber<br />
(4)
<strong>IAEA</strong>-CN-50/E-III-7 683<br />
is typically a few times R~ 1 , hence the power requirement is several<br />
times ohmic.<br />
The transfer of helicity from wave to plasma is next demonstrated.<br />
We consider a circularly polarized Alfven wave as an example. The<br />
equation of motion <strong>and</strong> Ohm's law are given by<br />
<strong>and</strong><br />
E + vxB = r}3 (6)<br />
There is a static magnetic field Bo in the z-direction. The dispersion<br />
relation for a collisionally damped wave is given by<br />
[<br />
] -1/2<br />
l-« — 4 =ko + i7 (7)<br />
Mo v\ J<br />
where VA is the Alfven velocity, <strong>and</strong> |7| ^ |fco| is assumed.<br />
Current drive can be deduced by first examining the second order<br />
v X B which yields, using the equation of motion,<br />
„ B „ B *fkovAAe<br />
VXBy ~ VyB* = (8)<br />
where A is the vector potential. Assuming 77 = constant <strong>and</strong> noting<br />
that V • J = 0, Ohm's law yields<br />
^ ^ ^ l (9)<br />
In steady state, V x E = 0, which means E — — V, <strong>and</strong> thus<br />
where JEZ|O is a constant. Ohm's law now becomes EXjO — rjjz <strong>and</strong> EZtO<br />
can be determined from the periodicity of , {6) = ()>{2TTR), which<br />
yields
684 OHKAWA et al.<br />
In terms of the helicity, H = A • B, this becomes<br />
2irR Q *2irR<br />
/<br />
7r(HvA)dz= 2VjxB0dz (12)<br />
oz Jo<br />
where ]-y |
<strong>IAEA</strong>-CN-S0/E-III-7 685<br />
plasma beta limit [7-9], relatively little has been done with regard to<br />
plasma shaping for improved confinement [10-12].<br />
The effects of the trapped particle modes can be reduced by improving<br />
the single particle drift orbits through plasma shaping. This<br />
geometric approach can achieve drift reversal (u>*u>d < 0) even at (3 = 0,<br />
in contrast to a diamagnetic approach. The latter requires significant /?<br />
where electromagnetic effects become important <strong>and</strong> other instabilities<br />
may arise. There is evidence that trapped particle modes were seen in<br />
the spherator <strong>and</strong> that they were stabilized by changing the magnetic<br />
geometry so that the trapped particles were in a good curvature region<br />
[13].<br />
The effect of reversing the single particle drift, u\i, is strongest<br />
for the collisionless trapped particle mode where it determines stability<br />
[14],<br />
Here J is the second adiabatic invariant,<br />
de (15)<br />
p is the plasma pressure, ip the poloidal flux, di a line element along<br />
the field line, <strong>and</strong> vH is the velocity parallel to the magnetic field. The<br />
bounce-averaged particle drift in the toroidal direction can be obtained<br />
from<br />
A(f> me dJ<br />
d = = "5-7 (16)<br />
Tb erb oif)<br />
where A(f> is the net change in toroidal angle (j> over one bounce period<br />
<strong>and</strong> Tb is the bounce period. By differentiation of Eq. (2), dJ/dip is<br />
found to have three components corresponding to the VI? drift, the curvature<br />
drift <strong>and</strong> a shear term. The VI? drift contributes more strongly<br />
than the curvature drift for the trapped particles because vjf < v^. Particles<br />
trapped on the outboard side of the torus have a VI? drift in the<br />
unstable direction, at least up to moderate (3 values. Kadomtsev <strong>and</strong><br />
Pogutse [14] have shown that positive shear (tokamak-like) is destabilizing<br />
for the collisionless trapped particle mode, while negative shear<br />
is stabilizing.<br />
The collisionless trapped particle regime would be difficult to<br />
achieve in tokamak operation, more likely is the trapped electron mode
686 OHKAWA et al.<br />
regime. For ut < 1, the single particle drifts still influence stability.<br />
This effect was considered by Adam, Tang, <strong>and</strong> Rutherford [15]. Their<br />
results show that the growth rate is reduced significantly by setting wa<br />
equal to zero — by 25% at v% = 0.5 <strong>and</strong> by a factor of 3 at i/* = 0.1.<br />
Exp<strong>and</strong>ing the trapped particle velocity integrals for UJ& < w, fe,eff) the<br />
lowest order drift term is proportional to (u>d) where ( ) denotes a velocity<br />
space average over trapped particles. Thus our goal for shape<br />
optimization is the reduction or reversal of (dJ/drf>) trapped over all flux<br />
surfaces.<br />
To determine an optimal shape we began with a fixed boundary<br />
equilibrium code [16] <strong>and</strong> parameterized the outer boundary by a<br />
fourth order polynomial in x <strong>and</strong> y with six shape coefficients, C\, to<br />
be determined. The equilibrium code requires a specification of q(t]))<br />
<strong>and</strong> p'(ip) to compute an equilibrium. We began with p' = 0 <strong>and</strong><br />
qty) = Saxis + {qiim ~ gaxis)^"* where ^3 = 1.05, q\im = 4.1, a, = 2.5,<br />
<strong>and</strong> if) is a normalized t(>, ranging from 0 at the axis to 1 at the boundary.<br />
With simple circular <strong>and</strong> inverse dee shapes we quickly established<br />
numerically that decreasing R/a decreased (dJ/dip) as desired. Therefore<br />
we chose an extreme example of R/a = 1.25 with which to perform<br />
the shape optimization. Larger values of R/a are now under study.<br />
Varying the shape parameters we obtained the optimal shape<br />
shown in Fig. 1. Depending upon the initial shape, the code tends<br />
to reduce the height to width ratio. For the case in Fig. 1, we held<br />
the height to width ratio fixed at 1 : 2. With this shape <strong>and</strong> /3 = 0<br />
we achieved drift reversal on the outer 50% of the flux surfaces using<br />
poloidal flux as a flux surface label. This shape is very similar to that<br />
suggested by Ohkawa [6] to ensure that most trapped particles are in a<br />
'good' curvature region.<br />
-10<br />
FIG. 1. Flux surface (solid lines) <strong>and</strong> mod B (dashed lines) contours for comet equilibrium. Outer<br />
boundary is given by C = x 2 + 4y 2 + 0.375x 3 - 4.85xy 2 +0.0x 4 + 3.35x 2 y 2 - 0.5y 4 .<br />
30
<strong>IAEA</strong>-CN-50/E-III-7 687<br />
The equilibrium just described has a large edge current density,<br />
particularly on the inboard side. This arises because we have set qum — 4<br />
while the shape has evolved to one having an x-point just outside the<br />
plasma. To eliminate the edge current density we used the free boundary<br />
equilibrium code GAEQ [17] <strong>and</strong> specify //' instead of q. Details are<br />
given in Ref. [lfij.<br />
Shown in Fig. 2 is the ballooning mode stability boundary <strong>and</strong> the<br />
contours of constant (dJ/dip) reversal as /3p <strong>and</strong> the current half-width<br />
are varied. Drift reversal occurs on the outer-most flux surfaces <strong>and</strong><br />
thus drift reversal on 10% of the flux surfaces could provide a significant<br />
insulating layer. The marginal ballooning mode stable line almost coincides<br />
with the contour of j3 = 3.1%. These equilibria have qax\s = 1-005<br />
while the Mercier stability criterion for these configurations generally<br />
dem<strong>and</strong> only q^a S 0.75. Therefore, these do not represent optimal<br />
ballooning mode stable plasma configurations. Note that the drift reversal<br />
contours are skewed with respect to the ballooning mode stability<br />
boundary. This indicates that substantial improvement may be possible<br />
by using different profiles to improve either drift reversal or stable /?<br />
0.60<br />
\<br />
\<br />
.<br />
\<br />
30%<br />
\<br />
\\20%\<br />
0.55 •<br />
s. \ \ \ vA\ \\ \<br />
0.50<br />
0.45<br />
o \\w<br />
Ballooning<br />
Mode<br />
Unstable<br />
k<br />
0.1 0.2 0.3<br />
Pp<br />
0.4 0.5<br />
FIG. 2. Ballooning mode stability boundary <strong>and</strong> contours of percentage of flux surfaces with drift<br />
reversal. V,A is the fraction of plasma volume containing half of the toroidal current.
688 OHKAWA et al.<br />
while holding the other nearly constant. One may also choose to change<br />
the shape as /? is increased to improve the ballooning stability. Efforts<br />
to improve ballooning mode stability are presently under way.<br />
It is of interest to compare the above results to those of a more<br />
conventional dee-shaped equilibrium with Rfa = 3 <strong>and</strong> height to width<br />
ratio =1.5. In this case we were able to achieve drift reversal only<br />
at significant values of (3 — above the ballooning mode limit unless<br />
be 3 / 2 is reduced in the comet due to the large value of e.<br />
Larger values of R/a as well as means of improving the stable (3 ballooning<br />
limit are presently being explored. Although low n stability to<br />
ideal MHD modes has not yet been studied, it is assumed that these<br />
modes can be wall stabilized in the same way as for vertically elongated<br />
tokamaks.<br />
Because the comet can achieve drift reversal at /3 = 0 it could<br />
provide an important experimental test to determine if trapped particle<br />
modes contribute to tokamak transport.<br />
REFERENCES<br />
[1] For example, see the review article by FISCH, N.J., Rev. Mod.<br />
Phys. 59 (1987) 175.<br />
[2] BEVIR, M.K., GRAY, J.W., in Proc. Reversed Field Pinch Theory<br />
Workshop (LEWIS, H.R., GERWIN, R.A., Eds.), Los Alamos<br />
National Laboratory Rep. LA-8944-C (1981) 176.<br />
[3] CHU, C., OHKAWA, T., Phys. Rev. Lett. 48 (1982) 837.<br />
[4] BHADRA, D.K., CHU, C., J. Plasma Phys. 33 (1985) 257.<br />
[5] CHAN, V.S., OHKAWA, T., General Atomics Rep. A19406 (1988),<br />
submitted to Phys. Rev. Lett.<br />
[6] OHKAWA, T., General Atomics Rep. GA-A19184 (1988), submitted<br />
to Kakuyugo Kenkyu.<br />
[7] STAMBAUGH, R.D., MOORE, R.W., BERNARD, L.C., KELL-<br />
MAN, A.G., STRAIT, E.J., et al, in Plasma Physics <strong>and</strong> Controlled<br />
<strong>Nuclear</strong> Fusion Research (Proc. 10th Int. Conf. London,<br />
1984), <strong>IAEA</strong>, Vienna (1985), Vol. 1, p. 21.
<strong>IAEA</strong>-CN-50/E-III-7 689<br />
[8] McGUIRE, K., BEIRSDORFER, P., BELL, M., BOL, K., BOYD,<br />
D., et al., ibid., Vol. 1, 117.<br />
[9] TROYON, F., GRUBER, R., SAURENMANN, H., SEMENZATO,<br />
S., SULCI, S., Plasma Phys. <strong>and</strong> Contr: Fusion 26 (1984) 209.<br />
[10] GLASSER, A.H., FRIEMAN, E.A., YOSHIKAWA, S., Phys. Fluids<br />
17 (1974) 181.<br />
[11] DOBROTT, D.R., GREENE, J.M., Plasma Phys. 17 (1975) 929.<br />
[12] TANG, W.M., Phys. Fluids 17 (1974) 1249.<br />
[13] OKABAYASHI M., FREEMAN, R., Phys. Fluids 15 (1972) 359.<br />
[14] KADOMTSEV, B.B., POGUTSE, O.P., Nucl. Fusion 11 (1971)<br />
67.<br />
[15] ADAM, J.D., TANG, W.M., RUTHERFORD, P.H., Phys. Fluids<br />
19, (1976) 561.<br />
[16] MILLER, R.L., VAN DAM, J.W., Nucl. Fusion 27 (1987) 2101.<br />
[17] HELTON, F.J., WANG, T.S., Nucl. Fusion 18 (1978) 1523.<br />
[18] MILLER, R.L., CHU, M.S., DOMINGUEZ, R.R., OHKAWA, T.,<br />
General Atomics Rep. GA-A19341 (1988), to be published in Comments<br />
on Plasma Physics <strong>and</strong> Controlled Fusion.
ICRF HEATING ON THE TFTR TOKAMAK<br />
FOR Prf UP TO 2.5 MW<br />
<strong>IAEA</strong>-CN-50/E-IV-l<br />
J.R. WILSON, M.G. BELL, A. CAVALLO, P.L. COLESTOCK,<br />
W. DORLAND, W. GARDNER 1 , G.J. GREENE,<br />
G.W. HAMMETT, R.J. HAWRYLUK, H.W. HENDEL,<br />
D. HOFFMAN 1 , J.C. HOSEA, K.P. JAEHNIG,<br />
F.C. JOBES, R. KAITA, C. KIERAS-PHILLIPS,<br />
A.I. LYSOJVAN 2 , D.K. MANSFIELD, S.S. MEDLEY,<br />
D. MUELLER, D.K. OWENS, D. SMITHE, J.E. STEVENS, D. SWAIN 1 ,<br />
G.D. TAIT, G. TAYLOR, M. ULRICKSON, K.-L. WONG,<br />
S.J. ZWEBEN, <strong>and</strong> the TFTR GROUP<br />
Plasma Physics Laboratory,<br />
Princeton University,<br />
Princeton, New Jersey,<br />
United States of America<br />
Abstract<br />
ICRF HEATING ON THE TFTR TOKAMAK FOR Prf UP TO 2.5 MW.<br />
ICRF heating experiments have been conducted on the TFTR tokamak for powers up to 2.5 MW.<br />
Both the H <strong>and</strong> the 3 He minority heating regimes have been explored in a "He majority plasma with<br />
ICRF alone. The differences between in-phase <strong>and</strong> out-of-phase antenna excitation have been investigated.<br />
While in-phase excitation provides antenna radiation resistance a factor of two higher, out-ofphase<br />
excitation leads to better plasma performance in terms of increased absorbed power in the plasma<br />
core <strong>and</strong> a decrease in metallic impurity radiation. For out-of-phase excitation 80-90% of the power<br />
is absorbed, while for in-phase excitation only 40-50% absorption is observed. Experiments in low density<br />
plasmas in conjunction with deuterium neutral beam injection have been concentrated on attempts<br />
to raise neutron emission by central electron heating. An increase in central electron temperature from<br />
6 to 7.5 keV has been obtained with Prf = 2 MW, about one third that of the neutral beam level.<br />
Enhancements in neutron emission have been most pronounced ( — 30%) for co-injection only cases.<br />
This enhancement appears to be a result of increased beam-target neutrons due to central electron heating.<br />
Enhancements of neutron production for balanced injection cases have been smaller as these cases<br />
are dominated by beam-beam neutrons. Neutral beam power levels used to date at this large major<br />
radius (R = 2.6 m) have prevented these discharges from being in the "supershot" regime.<br />
1. Introduction<br />
Initial ICRF heating experiments have been conducted on the TFTR<br />
tokamak. Two rf generators operating at 47 MHz are connected to two antenna<br />
boxes in adjacent midplane portsJ 1 -^ Each antenna consists of two toroidally<br />
displaced straps that can be phased either in- or out-of-phase with respect to one<br />
another.<br />
1 Oak Ridge National Laboratory, Oak Ridge, TN, USA.<br />
2 Institute of Physics <strong>and</strong> Technology, Khar'kov, USSR.<br />
691
692<br />
100<br />
a 10-<br />
0.1<br />
WILSON et al.<br />
• out-of-phase<br />
• In-phase<br />
10 20 30 40<br />
plasma-antenna separation (cm)<br />
FIG. I. Plasma loading impedance as a function of center conductor antenna separation for the PPPL<br />
Three types of experiments have been conducted: low power antenna<br />
loading as a function of antenna plasma spacing, high power rf heating of a 4 He<br />
plasma via both the H <strong>and</strong> 3 He minority fundamental cyclotron resonance, <strong>and</strong><br />
high power heating of a low density deuterium plasma in conjunction with<br />
deuterium neutral beam injection. Power levels up to 2.5 MW have been<br />
launched from the PPPL designed antenna <strong>and</strong> 0.5 MW from the ORNL<br />
designed antenna. The remainder of this paper is devoted to results obtained<br />
with the PPPL designed antenna.<br />
2. Loading Measurements<br />
Design values of a 6 MW power level for the PPPL antenna <strong>and</strong> a 4MW<br />
power level for the ORNL antenna with a maximum antenna voltage of 50 kV<br />
required a minimum antenna radiation resistance of 5 Q per antenna strap.<br />
Theoretical calculations predict that these values could be achieved. The<br />
antennas were constructed to be radially movable in order to maximize rf<br />
loading, subject to constraints from plasma heat loads. Figure 1 displays loading<br />
curves for the PPPL designed antenna obtained by changing the plasma-antenna<br />
separation by varying the plasma major radius. These curves were obtained in a<br />
50
<strong>IAEA</strong>-CN-50/E-IV-l 693<br />
4 He plasma at B*= 3.3 T <strong>and</strong> nel = 4xlO 19 m" 2 . Li-phase excitation is seen to<br />
have an antenna loading resistance a factor of ~2 larger than out-of-phase as is<br />
expected both theoretically <strong>and</strong> from past experience. For the large (R=2.62 m,<br />
separation = 8 cm) plasmas envisioned for ICRF operations, both phasings are<br />
seen to exceed the 5 Q design level for full power operation. These<br />
measurements, however, were made at milliwatt power levels. Measurements<br />
during high power heating experiments show a slight increase in loading with<br />
power, which may be due to an increase in the edge plasma density either<br />
produced by the rf, or due to outward motion of the plasma edge with increased<br />
plasma stored energy.<br />
3.5<br />
& 3.8<br />
3<br />
HI<br />
2.5<br />
8.4 3.13<br />
: (a)<br />
„. I<br />
1<br />
3.0 3.5 4.(9<br />
Time (s)<br />
FIG. 2. Comparison of in-phase <strong>and</strong> out-of-phase excitation. P$= 1.2 MW, broken lines: in-phase,<br />
solid lines: out-of-phase. (a) Plasma stored energy, (b) loop voltage.<br />
4.5<br />
-
694 WILSON et al.<br />
3. Plasma Heating Experiments with ICRF<br />
Initial heating experiments were conducted in the H minority heating<br />
regime at Bt=3.3 T in 4 He majority plasmas, due to restrictions on deuterium<br />
operation to avoid deconditioning the limiters for other experiments. Subsequent<br />
experiments were carried out in the •'He minority regime at Bt=4.9 T.<br />
Significant differences were observed in the results for different antenna<br />
phasings. The time evolution of the plasma transverse energy for the two<br />
phasings is shown in Fig. 2a. Analysis of the shape of the time evolutions<br />
indicates that the ratio of power absorbed in the core plasma to power launched<br />
is ~80-90% for out-of-phase excitation <strong>and</strong> -40-50% for in-phase excitation.<br />
During high power in-phase excitation IR <strong>and</strong> visible television cameras show a<br />
glow on the Faraday shield which is not present in the out-of-phase case.<br />
Investigations are continuing to determine the source of this glow <strong>and</strong> its<br />
possible contribution to the reduced efficiency in-phase.<br />
The time evolution of the loop voltage is shown in Fig. 2b for 1.2 MW<br />
of rf power. A larger drop in loop voltage is observed for out-of-phase<br />
excitation.<br />
Total radiated power from the plasma is usually observed to be the same<br />
for the two phasings. The percentage of radiated power falls from -50% in the<br />
ohmic plasma to -30% in the rf heated plasma. Radiation from metals is<br />
generally found to be insignificant. In the case, however, of operation at exactly<br />
Bt= 3.4 T with in-phase antenna excitation a significant increase in both total<br />
plasma radiation <strong>and</strong> the component due to metals is observed. The metal<br />
radiation includes a larger than usual amount of titanium, which is a component<br />
of the coating (TiCyHTiN) of the antenna Faraday screen. Under no conditions<br />
has either a metal increase or a glow on the antenna been observed for<br />
out-of-phase excitation.<br />
A maximum electron temperature of 3.7 keV was obtained for an rf<br />
power level of 2 MW, yielding an electron heating rate of -2 eV/kW/10 19 nr 3 .<br />
Measurements of the slope of the sawtooth oscillations show a maximum central<br />
power deposition to electrons of 260 kW/m 3 . This value was obtained for a<br />
cyclotron resonance location -0.1 m inboard of the plasma center.<br />
Sensitivity to resonance zone location was investigated by performing a<br />
toroidal field scan (Fig. 3). The total transverse plasma energy <strong>and</strong> the electron<br />
temperature (Fig 3a) show a relatively small dependence on resonance location,<br />
as long as it is inside the q=;l surface. The central power deposition rate (Fig.<br />
3b), however, continues to rise as the toroidal field is lowered, due to the large<br />
banana widths of the energetic hydrogen. Measurements of medium (100 keV)<br />
<strong>and</strong> high (0.5-1 MeV) energy proton fluxes peak when the resonance location<br />
coincides with the detectors.<br />
In 3 He minority plasma heating experiments the strongest electron<br />
heating was found, as expected, at the lowest concentration levels (-1%). Even<br />
at this level the electron heating rate, derived from the sawtooth slope, was<br />
-60% of that observed for H minority heating. The total stored energy for the<br />
two cases, however, was the same.
300<br />
<strong>IAEA</strong>-CN-50/E-IV-l 695<br />
-10 o 10 20<br />
Resonance layer position (cm)<br />
-20 -10 0 10 20 30<br />
R(0)plasma - R(resonance) (cm)<br />
FIG. 3. Cyclotron resonance zone location scan, (a) Dependence of plasma stored energy <strong>and</strong> electron<br />
temperature increase on toroidal field, (b) central power deposition rate to electrons as determined from<br />
slope of sawtooth oscillations.<br />
m<br />
.x
696 WILSON et al.<br />
I<br />
3 i<br />
-<br />
•<br />
/<br />
Time (s)<br />
FIG. 4. Neutron emission rate for 7.5 MW of neutral beam injection from 3.5 to 4.5 s (bottom curve)<br />
<strong>and</strong> with the addition of 2 MW ICRF from 4.0 to 4.5 s flop curve).<br />
4. ICRF plus Neutral Beam Heating<br />
ICRF heating has been combined with deuterium neutral beam heating<br />
in a deuterium target plasma at Bt= 3.3 T. 2.0 MW of rf power (out-of-phase<br />
excitation) has been combined with up to 7.5 MW of neutral beams. For the<br />
case of co- only neutral beams (Fig. 4), an increase in neutron emission of -25%<br />
is observed . The central electron temperature is seen to rise by 1.5 keV. For a<br />
case of 5 MW balanced injection the increase in neutron emission is only<br />
-10-15% even though the central electron temperature increase is similar. In<br />
both cases there is a density rise of -20%. SNAP analyses of these discharges<br />
indicate that the production of neutrons via beam-target reactions should rise<br />
(because of both an increase in Te <strong>and</strong> nA) <strong>and</strong> the beam-beam contribution<br />
should fall (due to the increased density). In the co- only case SNAP predicts a<br />
net increase in neutron emission, while in the balanced case SNAP predicts no<br />
increase, in good agreement with the experiment. Adding rf to cases where<br />
counter beams predominate is found to increase the sawtooth oscillation period.<br />
Incremental amounts of rf or beam power have identical effects on the radiated<br />
power from the plasma. Plasma energy confinement for incremental amounts of<br />
ICRF or neutral beam power is found to be similar. The power levels of these<br />
experiments do not extend into the so-called "supershot 1 " regime where,<br />
because of higher plasma density, beam-target neutrons predominate <strong>and</strong><br />
incremental electron heating is predicted to have a stronger effect. Stabilization<br />
of MHD modes in high 6 supershots by central rf electron heating is yet to be<br />
investigated.<br />
\
5. Conclusions<br />
<strong>IAEA</strong>-CN-50/E-IV-l 697<br />
ICRF heating at power levels up to 2.5 MW has been applied to the<br />
1F1R tokamak. Out-of-phase antenna excitation is observed to be superior to<br />
in-phase excitation with respect to plasma heating efficiency as also observed on<br />
JET^<strong>and</strong> JT-60l 4 l. This mode of operation exhibits no problems due to plasma<br />
antenna interaction or impurity radiation. The glow at the antenna for in-phase<br />
excitation suggests that a strongly localized effect, which may be attributable to<br />
the longer wavelength spectrum, may be responsible for the deleterious effects.<br />
Heating in conjunction with neutral beams shows an enhancement of neutron<br />
emission that is strongest for the co- only injection case, due to the enhancement<br />
of beam-target neutrons from central electron heating.<br />
Acknowledgements<br />
This work was supported by US DOE Contract Nos.<br />
DE-AC02-76CHO3073 for PPPL <strong>and</strong> DE-AC05-84OR21400 for ORNL.<br />
REFERENCES<br />
[1] WILSON, J.R., et al., "TFTR ICRF antenna design", <strong>Applications</strong> of Radio-Frequency Power<br />
to Plasmas (Proc. 7th Topical Conf. Kissimmee, FL, 1987), American Institute of Physics, New<br />
York (1987) 294-297.<br />
[2] HOFFMAN, D.J.,et al., "The design of high-power antennas for TFTR <strong>and</strong> Tore Supra", ibid.,<br />
pp. 302-305.<br />
[3] JACQUINOT, J., JET TEAM, "Radiofrequency heating on JET", Plasma Physics <strong>and</strong> Controlled<br />
<strong>Nuclear</strong> Fusion Research 1986 (Proc. 11th Int. Conf. Kyoto, 1986), Vol. 1, <strong>IAEA</strong>,<br />
Vienna (1987) 449-460.<br />
[4] KIMURA, H., et al., "Heating <strong>and</strong> beam acceleration during second harmonic ICRF experiment<br />
in JT-60", Controlled Fusion <strong>and</strong> Plasma Physics (Proc. 14th Eur. Conf. Madrid, 1987), Vol.<br />
11D, Pan III, European Physical Society (1987) 857-860.
INVESTIGATION OF ICRH ON<br />
THE TUMAN-3 TOKAMAK<br />
L.G. ASKINASI, V.I. AFANAS'EV, V.E. GOLANT,<br />
S.G. GONCHAROV, M.P. GRYAZNEVICH,<br />
V.V. DYACHENKO, A.B. IZVOZCHIKOV,<br />
A.A. KOROTKOV, S.V. KRIKUNOV, S.V. LEBEDEV,<br />
B.M. LIPIN, I.P. PAVLOV, G.T. RAZDOBARIN,<br />
V.V. ROZHDESTVENSKIJ, N.V. SAKHAROV,<br />
M.A. KHALILOV, F.V. CHERNYSHEV,<br />
K.G. SHAKHOVETS, O.N. SHCHERBININ,<br />
S.P. YAROSHEVICH, Yu.A. KOSTTSOV 1 ,<br />
R.N. LITUNOVSKIJ' O.A. MINYAEV 1<br />
A.F. Ioffe Physico-Technical Institute,<br />
USSR Academy of <strong>Sciences</strong>,<br />
Leningrad, Union of Soviet Socialist Republics<br />
Abstract<br />
<strong>IAEA</strong>-CN-50/E-IV-2<br />
INVESTIGATION OF ICRH ON THE TUMAN-3 TOKAMAK.<br />
Experiments on ICRH are carried out on the TUMAN-3 tokamak in the mode conversion regime<br />
at Bo = 0.5-0.6 T, Ip = 80-120 kA, S = (1-2) x 10 19 m" 3 , T^ = 350-450 eV, Ti0 = 90-130 eV.<br />
High deuteron heating efficiency is found in a wide range of hydrogen concentration (10-60%). Electron<br />
heating does not occur regularly. It is concluded that Bernstein wave absorption plays an important role<br />
in the presence of the light impurity ions N +6 <strong>and</strong> O +7 .<br />
Experiments on ICRF plasma heating were carried out on the TUMAN-3 tokamak<br />
in a wide range of hydrogen concentrations in a deuterium plasma when fast<br />
magnetosonic (FMS) waves were excited from the low field side of the torus [1]. The<br />
transition from the minority heating to the mode conversion regime occurred, in our<br />
conditions, at a hydrogen ratio of about 10% <strong>and</strong> was accompanied by an increase<br />
in the wave absorption efficiency, which could be seen from the vanishing cavity<br />
resonances. Ion heating did not, however, cease when the hydrogen ratio rose up to<br />
50%. Electron heating was recorded in some cases only.<br />
Here, we shall present the results of investigations made in the mode conversion<br />
regime.<br />
The TUMAN-3 device is a tokamak with small aspect ratio (R = 0.55 m, a =<br />
0.24 m, R/a = 2.3). Experiments were conducted at Bo = 0.52 T, Ip = 120 kA, n<br />
= 2 x 10" nr 3 , T^ = 350^50 eV, Ti0 = 100-130 eV. The operating frequency<br />
D.V. Efremov Research Institute of Electrophysical Apparatus, Leningrad, USSR.<br />
699
700 ASKINASI et al.<br />
0<br />
120<br />
, 60<br />
RF<br />
10 20 30<br />
t Ims)<br />
FIG. I. Time dependence of plasma density (a) <strong>and</strong> radiated power (b). PRF = 140 kW.<br />
was 8 MHz to meet the proton cyclotron condition near the chamber axis. An RF<br />
antenna was placed in the opening of a vertical port in the equatorial plane of the<br />
chamber. The coupling resistance was rather low (~0.1 Q), because of the low magnetic<br />
field strength <strong>and</strong> the antenna location. To reduce the Ohmic losses, the antenna<br />
was made of copper; it ensured a power input efficiency of up to 50%. The kj spectrum<br />
of emitted waves was rather broad (0 < N[ < 80). The important feature of<br />
the experiments was the large variation of the magnetic field strength over the crosssection<br />
of the chamber (-30%, +75%), due to the small aspect ratio. For this<br />
reason, the conditions of proton cyclotron resonance <strong>and</strong> mode conversion were met<br />
simultaneously in the plasma volume up to a hydrogen ratio of 60 to 70%.<br />
In the experiments,'the electron temperature was measured by Thomson scattering,<br />
the ion temperature by a charge exchange analyser <strong>and</strong> the plasma density by<br />
a 2 mm interferometer. The increase in the plasma energy content was recorded by<br />
a diamagnetic technique <strong>and</strong> the radiation losses were found by a bolometer.<br />
Figure 1 shows the increase of plasma density (a) <strong>and</strong> Prad (b) during the RF<br />
pulse (PRF « 140 kW). We see that the radiation losses increased sharply but their<br />
level was not higher than 30% of the total input power. The maximum RF power<br />
input was about 200 kW; it was limited by discharge disruption.<br />
By monitoring the gas puffing system, it was possible to simulate a sharp density<br />
rise similar to that shown in Fig. 1. The results of this simulation are presented<br />
in Fig. 2 (curves 2). We see that the increase in radiation losses <strong>and</strong> diamagnetic signal<br />
is much lower than in the RF case (curves 3).<br />
Most of the experiments were carried out at a hydrogen ratio of r\ = n^r^ =<br />
20%. Figure 3 shows the time dependence of the plasma energy store (solid lines)<br />
(a)<br />
(b)<br />
40
~x<br />
o X<br />
•9to<br />
12 1<br />
11<br />
10<br />
180<br />
s<br />
- 120<br />
a.<br />
60<br />
<strong>IAEA</strong>-CN-50/E-IV-2<br />
(a)<br />
\ I<br />
' —<br />
i<br />
RF<br />
^ ^<br />
23 25 27 29<br />
t (ms)<br />
1<br />
\<br />
— \_<br />
3<br />
1<br />
\<br />
1,<br />
2<br />
\<br />
31 33<br />
F/G. 2. Time dependence of diamagnetic flux (a) <strong>and</strong> radiated power (b) in Ohmic heating regime (1),<br />
in Ohmic heating regime with simulated density rise (2) <strong>and</strong> with RF heating pulse (3).<br />
250 -<br />
200 -<br />
150 -<br />
100 -<br />
25 26 27 . 28 29<br />
- 200<br />
FIG. 3. Time dependence of plasma stored energy (solid lines) <strong>and</strong> ATD (dots) during RF pulse. 1<br />
140 kW, 2 - 80 kW.<br />
701
702 ASKINASI et al.<br />
240 -<br />
\<br />
-3 \<br />
J *• 180<br />
—5<br />
-A .A.<br />
120 4—.<br />
60-<br />
!<br />
/<br />
\<br />
\<br />
/<br />
^-- 3<br />
1 1<br />
25 26 27 28 29<br />
t (ms)<br />
- 160<br />
- 120<br />
- 80<br />
- 40<br />
FIG. 4. Time dependence of energy lifetime (]), plasma stored energy (2) <strong>and</strong> its derivative (3).<br />
<strong>and</strong> the deuterium temperature (dots) for PRF = 140 kW (1) <strong>and</strong> 80 kW (2). The ion<br />
temperature was obtained from the charge exchange spectra in the energy range of<br />
0.6 to 3 keV. The rate of the plasma energy increase at the onset of the RF pulse<br />
gives values of power (120 <strong>and</strong> 75 kW) close to the RF input power.<br />
The behaviour of energy lifetime (TE) during the RF heating phase is shown in<br />
Fig. 4 (curve 1). Curve 2 shows the time dependence of the diamagnetic signal <strong>and</strong><br />
curve 3 its derivative. The energy lifetime was determined as<br />
W0H + AW<br />
POH + PRF - dW/dt<br />
where WOH is the energy content in plasma before the RF pulse <strong>and</strong> P0H the Ohmic<br />
heating power during the RF pulse. Evidently, the value of rE = 1.5 ms changes<br />
only slightly in the RF heating phase, in spite of the considerable rise in density.<br />
A characteristic feature of the experiments at -q = 20% is the absence of electron<br />
heating. The electron temperature profiles in the Ohmic heating regime <strong>and</strong> in discharges<br />
with RF heating are virtually identical.<br />
It is interesting to compare these results with the results of experiments at -q «<br />
30%. The change in deuteron temperature, calculated from charge exchange spectra<br />
in the range of 0.6 to 2.0 keV, is shown in Fig. 5 for r; = 20% (solid lines) <strong>and</strong> i)<br />
= 30% (broken lines) at different RF power levels. Laser measurements of the electron<br />
temperature (Fig. 6) showed that the temperature profile under RF heating
400 -<br />
300 -<br />
200 -<br />
I 100 -<br />
35<br />
/<br />
1 ,<br />
/<br />
RF<br />
i<br />
150kW<br />
—-X<br />
•"<<br />
\<br />
<strong>IAEA</strong>-CN-50/E-IV-2<br />
• i i<br />
140kW<br />
_A A<br />
60 kW ^^-^^^<br />
. , 1 , 1 i i i<br />
40 45<br />
t (msl<br />
FIG. 5. Time dependence of deuteron temperature during RF heating at -q = 20% (solid lines) <strong>and</strong><br />
•q = 30% (broken lines).<br />
400<br />
- 200<br />
OHN v<br />
10<br />
r (cm)<br />
B0 = 5.2kG<br />
PRF= 100 kW<br />
FIG. 6. Te profiles by laser diagnostics at i\ = 20%.<br />
, }<br />
20<br />
703
704 ASKINASI et al.<br />
TABLE I. LOCATION OF RESONANCE ABSORPTION REGIONS<br />
m<br />
Z<br />
Bres(T)<br />
rres(m)<br />
N +6<br />
14<br />
6<br />
0.608<br />
0.08<br />
O +7<br />
16<br />
7<br />
0.594<br />
0.067<br />
N +5<br />
14<br />
5<br />
0.729<br />
0.157<br />
o+a<br />
16<br />
6<br />
0.692<br />
0.136<br />
N-"<br />
14<br />
4<br />
0.911<br />
0.235<br />
O +5<br />
16<br />
5<br />
0.83<br />
0.205<br />
became flat in the central region of the plasma column (up to r « 10 cm). The location<br />
of the maximal increase in electron temperature was close to the mode conversion<br />
zone.<br />
It should be noted that in earlier experiments on the TUMAN-3 tokamak [2]<br />
electron heating was recorded (ATe = 250 eV, PRF = 150 kW) at 77 « 10%, when<br />
the conversion mode zone was located near to the plasma axis (Bo = 0.6 T, n = 1.8<br />
x 10 19 m" 3 ). Ion <strong>and</strong> electron heating in the wave conversion regime should be<br />
assumed to be due to propagation <strong>and</strong> absorption of Bernstein waves.<br />
It is well known that the FMS wave excited from the low field side of the torus<br />
is coupled to the Bernstein wave which penetrates into the high field region. In a<br />
hydrogen-deuterium plasma, the Bernstein wave is absorbed by the electrons. The<br />
location of the conversion zone depends on the ratio of hydrogen to deuterium in the<br />
plasma <strong>and</strong> shifts towards higher magnetic fields with increasing amount of hydrogen.<br />
In some conditions, the presence of heavier ions with m/Z 5: 2 could play an<br />
important role in Bernstein wave absorption. This effect was predicted in Refs [3, 4]<br />
<strong>and</strong> checked in some special experiments, where a small addition of vanadium [5] or<br />
neon [6] was studied. For these ions, the second cyclotron harmonic zone was close<br />
to the mode conversion zone, but coming from the high magnetic field side. The<br />
injection of a small amount of heavy ions led to an increase in the ion heating efficiency.<br />
In plasmas of moderate electron temperatures (
5 -<br />
<strong>IAEA</strong>-CN-50/E-IV-2<br />
r (cm)<br />
FIG. 7. Dispersion curves for Bo = 0.52 T, n = 3 x 10 19 m' 3 , N, 50.<br />
RF power before the second cyclotron absorption zone of the N +6 ions would be<br />
attained. At rj = 20%, the N +6 ions absorb the RF power preferentially just after<br />
conversion. At ij = 30%, the conversion zone shifts to B = 0.63 T, <strong>and</strong> the N +6<br />
ions are unimportant in wave absorption. We again expect electron heating in some<br />
non-axial regions of the plasma column. The rest of the RF power can be absorbed<br />
by N +5 <strong>and</strong> O +s ions in the peripheral region.<br />
The situation becomes more complicated when the dependence of the absorption<br />
efficiency by electrons on the parallel refractive index N| is included. Generally, the<br />
efficiency becomes higher with increasing NB. Hence, different parts of the excited<br />
wave spectrum may be absorbed by different plasma components.<br />
In conclusion, we may state that in tokamaks with moderate electron temperatures,<br />
where the light impurity ions are not fully ionized, the injected RF power may<br />
be absorbed not only by the hydrogen minority but also by the impurity ions. It could<br />
lead to effective ion heating in a broad range of hydrogen concentrations as was the<br />
case in our experiments.<br />
705
706 ASKINASI et al.<br />
REFERENCES<br />
[1] ASKINASI, L.G., et al., in Controlled Fusion <strong>and</strong> Plasma Physics (Proc. 12th Eur. Conf.<br />
Budapest, 1985), Vol. 9F, Part I, European Physical Society (1985) 363.<br />
[2] ASKINASI, L.G., et al., Pis'ma Zh. Tekh. Fiz. 11 (1985) 315.<br />
[3] LONGINOV, A. V., STEPANOV, K.N., in Heating in Toroidal Plasmas (Proc. 4th Int. Symp.<br />
Rome, 1984), Vol. 1 (1984) 489.<br />
[4] LONGINOV, A.V., PAVLOV, S.S., STEPANOV, K.N., in Controlled Fusion <strong>and</strong> Plasma<br />
Physics (Proc. 12th Eur. Conf. Budapest, 1985), Vol. 9F, Part II, European Physical Society<br />
(1985) 132.<br />
[5] TFR GROUP, Nucl. Fusion 26 (1986) 873.<br />
[6] ALIKAEV, V.V., BEREZOVSKIJ, E.L., et al., in Controlled Fusion <strong>and</strong> Plasma Physics (Proc.<br />
12th Eur. Conf. Budapest, 1985), Vol. 9F, Part II, European Physical Society (1985) 156.
<strong>IAEA</strong>-CN-50/E-IV-3<br />
CONVERSION AND CYCLOTRON ABSORPTION<br />
OF FAST MAGNETOSONIC WAVES IN A<br />
NON-UNIFORM MAGNETIC FIELD<br />
S.V. KASILOV, A.V. LONGINOV, S.S. PAVLOV,<br />
A.I. PYATAK, K.N. STEPANOV<br />
Institute of Physics <strong>and</strong> Technology,<br />
Ukrainian Academy of <strong>Sciences</strong>,<br />
Khar'kov,<br />
Union of Soviet Socialist Republics<br />
Abstract<br />
CONVERSION AND CYCLOTRON ABSORPTION OF FAST MAGNETOSONIC WAVES IN A<br />
NON-UNIFORM MAGNETIC FIELD.<br />
The influence of heating the ion minority of a rather high concentration on the conversion <strong>and</strong><br />
absorption of the fast magnetosonic wave (FMSW) propagating on the high field side (HFS) is investigated<br />
in the vicinity of the two-ion hybrid resonance. It is shown that in a t-plasma with a d-minority<br />
at Td s> T, the fast wave (FW) can be converted 'forwards' into a slow wave (SW), <strong>and</strong> the region of<br />
strong cyclotron absorption by the d-minority ions can be attained. In a d-plasma with a t-minority, the<br />
FW can be converted at Tt >> Td 'backwards' into an SW. This SW propagates backwards to the HFS<br />
<strong>and</strong> reaches the region of strong cyclotron absorption by tritons, where it is converted into another, still<br />
shorter SW. The RH field distribution of the FMSW <strong>and</strong> the energy deposition profile in this region<br />
are demonstrated for a stellarator, as an example. The effects considered can be used to achieve the<br />
two-component nuclear fusion regime <strong>and</strong> to drive the steady state current. — The FMSW absorption<br />
is calculated for the local resonance regions (oi => no>ci) in stellarators, with due regard for the nonlocal<br />
coupling of the left h<strong>and</strong> polarized components of the current density <strong>and</strong> the electric field of the<br />
wave. Non-local effects are shown to be essential for waves with small kh although even in this case<br />
the mean absorbed power is equal to the value calculated in the local approximation.<br />
1. INTRODUCTION<br />
The magnetic field inhomogeneity <strong>and</strong> the quasi-linear deformation of the<br />
resonant particle distribution function often qualitatively change the conversion <strong>and</strong><br />
cyclotron absorption of fast magnetosonic waves (FMSW, FW) in magnetic traps.<br />
In the process of cyclotron absorption of short wavelength slow waves (SW),<br />
a cut-off effect takes place. It consists in the cut-off of the high energy tail of the<br />
transverse velocity distribution function of the resonant ion minority [1-3]. This<br />
effect enables the SW propagating from the low magnetic field side (LFS) to reach<br />
the cyclotron resonance region when the minority ion concentration is high. The cutoff<br />
<strong>and</strong> accessibility effects form the basis of the ICRF heating <strong>and</strong> steady state<br />
707
708 KASILOV et al.<br />
current drive methods using SW [1-4]. These methods are characterized by the following<br />
features [1-4]:<br />
— Decrease in the kinetic pressure of the resonant particles;<br />
— Decrease in particle <strong>and</strong> energy banana losses;<br />
— Increase in the fraction of RF power heating the bulk ions;<br />
— Increase in the power gain factor Q in the two-component regime;<br />
— Increase in the ion cyclotron current drive efficiency, etc.<br />
In practice, direct SW launching by special antennas located at the plasma<br />
periphery may be used [5, 6]. However, the smallness of the SW wavelength, especially<br />
at the periphery, causes difficulties in the construction of efficient antennas<br />
capable of generating high RF power fluxes in the plasma <strong>and</strong> may give rise to nonlinear<br />
dissipative effects occurring at the plasma edge. At the same time, the delivery<br />
of high RF power fluxes to the plasma with FW is easier.<br />
Section 2 demonstrates that the large amplitude FW propagating on the high<br />
magnetic field side (HFS) may be converted into an SW reaching the zone of strong<br />
cyclotron absorption by minority ions of a high concentration, w « w^. This is due<br />
to a strong quasi-linear deformation of the minority ion distribution function, leading<br />
to a qualitative change in SW conversion <strong>and</strong> propagation in the u = We resonance<br />
region. Unlike previous papers [2, 3], in this paper we consider the effect of the<br />
quasi-linear deformation of the resonant particle distribution function on both SW <strong>and</strong><br />
FW. We analyse two heating scenarios, which are most important from the viewpoint<br />
of the construction of a two-component fusion reactor: (i) the use of the w = o^<br />
resonance for the deuterium minority in a tritium plasma (ldt scenario); <strong>and</strong> (ii) the<br />
w = coct resonance for the tritium minority in a deuterium plasma<br />
(ltd scenario).<br />
A peculiarity of the ion cyclotron resonance in toroidal traps with rotational<br />
transform is the non-local coupling between the RF current of the resonant particles<br />
<strong>and</strong> the RF field. This coupling is due to thermal motion of ions along the magnetic<br />
field lines. The problem of FMSW cyclotron absorption in a tokamak plasma with<br />
due regard for this peculiarity has been investigated in Refs [7-9] <strong>and</strong> is extended<br />
here (Section 3) to the stellarator case.<br />
2. HIGH POWER FW CONVERSION FEATURES IN A PLASMA AND<br />
THEIR USE FOR PLASMA HEATING AND TWO-COMPONENT<br />
REGIME CREATION<br />
2.1. Model<br />
On analysing the behaviour of the transverse refractive index, N± = k±c/co,<br />
in the ion minority heating regime close to the w = u>'c resonance with the general<br />
dispersion equation as a basis, it is generally necessary to use the ion minority contri-
<strong>IAEA</strong>-CN-50/E-IV-3 709<br />
bution, e(j, to the dielectric tensor components with the real (non-Maxwellian) distribution<br />
function of the resonant particles, the latter being given by the solution of the<br />
kinetic equation (see, e.g., Ref. [3]). However, as is shown by calculations, the function<br />
eij(kx) is relatively weakly affected by the details of the resonant particle distribution<br />
function (e.g., the tail cut-off [1]), <strong>and</strong> we approximate it by a Maxwellian<br />
distribution with an appropriate temperature T'.<br />
In the region considered, cyclotron absorption by the majority ions is negligibly<br />
low while finite Larmor radius effects are essential, k±p{ ~ 1 (ps = vTi/a>ci><br />
vTi = V2Ti/mi). For the minority ions, cyclotron absorption as well as finite<br />
Larmor radius effects are essential (k±p' ~ 1 with p' = v{lw'c <strong>and</strong> v{ = V2T7m';<br />
~ 1).<br />
2.2. ldt scenario<br />
Figure 1 shows k±ps (i = t) versus z' for an FW propagating in a<br />
t + d (20%) plasma for different Td = T'. In the tokamak case, the z' dependence<br />
corresponds to the R dependence. At Td = Tt, the FW is converted into the SW (S,)<br />
propagating towards the HFS ('backward' conversion). In the conversion region (the<br />
two-ion hybrid resonance region), |z'| > 1, <strong>and</strong> the cyclotron damping is small. If,<br />
however, Td > Tt, the FW-SW conversion changes essentially, i.e. the SW (S2)<br />
propagates from the conversion point towards the resonance w = w^ ('forward'<br />
conversion) <strong>and</strong> may reach the absorption region with |z'| ~ 1. Note that in systems<br />
of relatively large dimensions, where the FW tunnelling through the opacity region<br />
-12 -8<br />
FIG. 1. k±p, versus z' = {2l3) m (o» - ui^/kxVj, for the ldt scenario: (d + t)-plasma, n, = 4.4<br />
x JO 14 cm' 3 , njn, - 0.2, T, = 5 keV, Bo = 5 T, N, = k,c/w = 3 for different deuteron temperatures.<br />
Td/T, = 1 (a); Td/T, = 10 (b); T/T, = 30 (c). The values ofP = EJEy are also given.
710 KASILOV et al.<br />
to the two-ion hybrid resonance region is small, the FW excited from the HFS will<br />
completely be converted into the SW (S2). The Ey field component of the SW (S2)<br />
mode is not too small for Td > T, (the z axis is directed along the magnetic field).<br />
Figure 1 gives the P = Ex/Ey values in different regions of the plasma column. The<br />
cut-off effect also remains for elliptically polarized SW (S2), the quasi-linear diffusion<br />
coefficient being<br />
DRF OC [(1 + 1/p) J,(x)/x - J0(x)/p] 2<br />
where x = k±\'±/o}^.. DRP vanishes at v^/vx, values that are somewhat higher<br />
than in the linear polarization case (P = oo) (see Fig. 2). The parameter<br />
X = kj_Pi (wci/wc) is high enough for high /3 = 8x(EnT)/Bo values, <strong>and</strong> it<br />
approaches X = XoP,. The Q factor has a maximum at X = XoP, [3]. In the case<br />
considered, X = 0.66 at /3 = 5%, whereas X,,,,, = 0.7 [3].<br />
. S-, |P = °°)<br />
0 5 10 1S 20<br />
FIG. 2. Dgf versus v'Jvj,for the ldt scenario <strong>and</strong> the plasma parameters given in Fig. 1 for different<br />
P values (h = 0.66).<br />
2.3. ltd scenario<br />
Figure 3 shows k±pi (i = d) versus z' for the FW in the d + t (20%) plasma<br />
at co « o)c, for different Tt values. At T, = Td, the FW is converted into the SW in<br />
the two-ion hybrid resonance region, which is remote from the co = wct resonance.<br />
However, if Tt > Td, then k±pi for the SW decreases <strong>and</strong> the cyclotron resonance<br />
region with \z'\ 2; 1 (strong damping) may appear accessible for the SW. Therefore,
<strong>IAEA</strong>-CN-S0/E-IV-3 711<br />
FIG. 3. kxPd versus z' = foj - J(3/2) IJ2 /k,vTd for the ltd scenario: (d + t)-plasma, nd = 6.6<br />
xl0 l4 cm' 3 x 10 , nJnd = 0.2, Td = 5 keV, Bo ' - " * ' ' —<br />
T/Td = 7 (a); T/Td = 10 (b); T/Td = 30 (c).<br />
14 cm' 3 , njnd = 0.2, Td = 5 keV, Bo = 5 T, N, = 3 for different triton temperatures.<br />
115 150 185 115 150 185<br />
£ 45.0 • • 204 - •<br />
iu 1 02--<br />
115 185 115 150<br />
R (cm)<br />
FIG. 4. Total energy flux P <strong>and</strong> FW electric field components Ez <strong>and</strong> Er versus major radius R for<br />
hollow cylinder model of toroidal (d + t)-plasma, njn, = 0.2, n,(Ro) = 4.4 x 10 M cm' 3 , Bo = 5 T,<br />
T, = Te = 5key, w = 1.45uJRoJ, 'toroidal' number m = 12, nei(R) <strong>and</strong> Tei(R) are parabolic,<br />
BJR) = Bofl +a(R~R0) 2 /a 2 ]. Solid line shows calculations for Tdi_/Te = l<strong>and</strong>Tdl/T, = 1,dashed<br />
line refers to TdJT, = 10 <strong>and</strong> Tdl/T, = 2.<br />
185
712 KASILOV et al.<br />
with the FW excitation from the HFS, there may occur an effective FW-SW 'backward'<br />
conversion in the z' > 0 region <strong>and</strong> a subsequent SW absorption by tritons.<br />
A partial FW absorption in this case is also due to the 'forward' conversion in the<br />
z' < 0 region. It is obvious that an essential asymmetry of the resonant particle<br />
distributibn function (important for the current drive [4]) can be obtained here.<br />
2.4. Feasibility of ldt scenario in a stellarator<br />
The analysis performed has been based on the local dispersion equation, i.e. on<br />
the geometrical optics approach. Here, we give the results of the numerical solution<br />
of the wave equation for the FW for the 1-D inhomogeneity in an Z = 2 stellarator<br />
with a large helical-to-longitudinal magnetic field amplitude ratio, eh, using a<br />
numerical code similar to that of Ref. [1].<br />
As is seen from Fig. 4, at T'± = TL = Tj, the FW is converted into the SW<br />
which propagates 'backwards' (to the periphery). However, at Tx = 10 T; <strong>and</strong><br />
T{ = 2 Ti( the 'forward' conversion is realized, <strong>and</strong> the SW reaches the cyclotron<br />
resonance region (w = co^), where it is completely absorbed. This result illustrates<br />
the feasibility of the heating regime with a high minority ion concentration <strong>and</strong> the<br />
cut-off of the proton distribution function tail, i.e. the so-called high power plasma<br />
heating regime.<br />
FIG. 5. Localization of cyclotron resonance points in the stellarator. Here, f(r, 6, f)<br />
= cos (6 + tLmhi) + fo/e,) cos I [6 + (lL—l)mht]. 6 <strong>and</strong> J"are the poloidal <strong>and</strong> toroidal angles, 2TIL<br />
is the angle of transform Over the magnetic field period L, w^O) is the ud value on the magnetic axis,<br />
Ao> = a) - nad(0). The solutions f = £(S) of the equation A/e,mi>cl(0) = f(r,8,£) correspond to the<br />
resonances u = no>ri (rrcs), The calculations were performed for I = 3, mh = 11/3, Au>/efnud(0)<br />
= 0.2, thlt, = 1.2, l = 0.27.
<strong>IAEA</strong>-CN-50/E-IV-3 713<br />
3. NON-LOCAL THEORY OF FMSW ABSORPTION IN A STELLARATOR<br />
3.1. RF current density at u = nwci<br />
Moving along magnetic field lines in an £-turn stellarator with mh helical winding<br />
pitches over the torus, the ion sequentially traverses 2nV points, where<br />
03 = nwci(r) (see Fig. 5). It is just in the vicinities of these points that the particles<br />
obtain the energy from the RF field. During the transit time between two such points,<br />
the Coulomb collisions change the phase between the particle <strong>and</strong> the wave. To<br />
calculate the RF current, this effect will be taken into account by a linearized collision<br />
term L; in the kinetic equation for the perturbation of the distribution function fj,<br />
L; = Dd 2 fj/dv!, where the diffusion coefficient is given by<br />
D = Jf^A|d3 U^-exp|-(-^ + u)| (1)<br />
In the analysis of the main resonance co ~ coci, we shall neglect the finite Larmor<br />
radius effects <strong>and</strong> on exp<strong>and</strong>ing fj in the Fourier series<br />
where is the phase angle in the velocity space, we obtain the following equation<br />
for the f_[ = g amplitude responsible for cyclotron absorption:<br />
D |f- - v, -£- + i [co - coci(s)]g = - | % E+(s) (2)<br />
dvf 3s 2m V<br />
Here, E + = E, + iE2 is the left h<strong>and</strong> polarized component of the FW electric field<br />
E = Ejli + Ej^ (li, 12 <strong>and</strong> I3 = B/B are orthonormalized), s is the distance along<br />
the magnetic field lines, f^ = n© (27TVTJ)" 3/2 exp (—v 2 / 2v^). On solving Eq. (2),<br />
D can be assumed to be weakly dependent on vt, in contrast to g(vn). Then, applying<br />
the method of characteristics twice, we find g(vt) <strong>and</strong> the non-local current of<br />
circulating ions:<br />
d 3 v vife f dt E + [R (r, s + v,t)]<br />
x exp i dt' [«d (R (?, s + v,t')) - o>] + V (?, s, v, t) (3)<br />
C Jo
714 KASILOV et al.<br />
Similarly, taking into account the smallness of the Larmor radius as compared to<br />
the characteristic length of E variation across Bo, we find that, at resonances<br />
03 « nwci (n > 2),<br />
x {vi< n -"E + [R(F,s + v,t)]} exp Si dt' [na>ci(R(r,s + v,t')) - co]<br />
+ r,(F,s,v,t) (4)<br />
Here, R(F, s') is the co-ordinate of the guiding centre of the particle moving along<br />
the magnetic field line, R = F at s' = s. The function of correlation weakening,<br />
TJ(T, s, v, t), takes into account the effect of collisions on the wave-particle phase<br />
change:<br />
r,(r,s,v,t) = D(v) dt'j dt" ^ ucL [R(F,s + v«(t + t" - t'))] J (5)<br />
The total current density is j" = jL~ + je, j + = JL + + je + + jrts where<br />
j;± = i "P j - eE± (Wce < 0) (6)<br />
4ir (co =F wcije)<br />
At co « coci, for bulk ions jL + is given by expression (3). Expressions (3), (4) <strong>and</strong><br />
(6), together with the Maxwellian equations <strong>and</strong> E[ = E3 = 0, form a set of<br />
integrodifferential equations for E + <strong>and</strong> E".<br />
3.2. FMSW energy absorption<br />
For the bulk ion resonance co « coci, E + « E", <strong>and</strong> the influence of thermal<br />
motion on E" = E^ can be neglected. Assuming E + = EQ + + E^f, we obtain equations<br />
for EQ <strong>and</strong> E-f:<br />
(rot rot Eo)± = (
x exp | ds"<br />
' u '<br />
x<br />
-oosgn u<br />
d fiV2vTiEo + [R(F,s'<br />
ds' l a - o.ci[R(F,s')]<br />
<strong>IAEA</strong>-CN-50/E-IV-3 715<br />
vTi<br />
due""<br />
Equation (7) can be solved in the WKB approximation. An exact solution of<br />
the integral equation (8) can be obtained [9] by using a large parameter,<br />
ft = ehn«ciL/vTi > 1. Having found this solution, we obtain the expression for<br />
the RF power density absorbed in the vicinity of a single resonance point<br />
s' = sres (wci [R (?, sres)] = co), integrated along the field line.<br />
P = j \ ds' ji [R (r, s')] E + [R (F, s')]<br />
in the form<br />
P =<br />
dz exp (-z 2 )<br />
|z||w(z)| 2<br />
X ds' exp ] — ds"<br />
Eo + [R (F, s')]<br />
ds'
716 KASILOV et al.<br />
If the resonant minority density is low (Ij^l ^ |j"|, i.e. i^, < n,.r), the presence<br />
of resonant particles weakly affects E~, <strong>and</strong> the FW conversion into the SW is<br />
negligible. If k« is large, kg > lc^ = (Idou/dsly-^) 1 ' 2 , then the local approach is<br />
valid, i.e.<br />
Jres<br />
V2|k,|vTa<br />
where W(z) is the plasma dispersion function <strong>and</strong> n,.r ~ (k|VTa/co)noj. If k| •& kocr,<br />
then the coupling between jrts <strong>and</strong> E + is essentially non-local, <strong>and</strong> in this case we<br />
have<br />
<strong>and</strong><br />
+ I - rq/4)<br />
± ^'~ ,.2<br />
JresL=uCi , o3/4 W pa<br />
dwca(R,sres)<br />
dsr(<br />
3.3. FMSW cyclotron absorption in a stellarator<br />
-1/2<br />
vTa Eo + (12)<br />
The formulas obtained for jr"J;s <strong>and</strong> P are valid for an arbitrary trap. The<br />
magnetic field of the stellarator in the one helical harmonic approach is [10]<br />
Br = fBfi; (tar) sin £9<br />
Be = -^- I, (far) cos tQ<br />
ar<br />
Bf = Bt - Po^t (far) cos 2Q (13)<br />
where r, 6, fare the quasi-toroidal co-ordinates, Bt = B0(l + et cos 6), et = r/Ro,<br />
a = 2ir/L, bn = (8J/c) a 2 ank^(naa), 0 -6 - mhf, L = 27rR/mh, J is the current<br />
in the helical coil (Bo > |Br|, \B9\, \B{ — Bt|). The co-ordinates of the ion<br />
guiding centres are<br />
r (r, s') « r + -^- If'(ter) {cos I [d + (iL - 1) a (z + s' - s)]<br />
aB0
<strong>IAEA</strong>-CN-50/E-IV-3 717<br />
x If {sin i [0 + (tL - 1) a (z + s' - s)]<br />
z(F, s') « z + s' - s, z = Rof (14)<br />
iL is the angle of rotational transform over the magnetic field period L.<br />
The resonance points are given by<br />
co = uci [1 + (rres/Ro) cos 0res + eh(rres) cos *0res] (15)<br />
where eh(r) = -£b,If(far)/B0.<br />
The power density absorbed by minority a ions, averaged over the magnetic<br />
surface with mean radius r0, is given by<br />
,a<br />
|E + (rresp, 6reSp, 0QI<br />
M ^ ~ J-«_ Jeh 2 ^L-(Aco-6tcocacos0o) 2<br />
where Aco = co - uci, rresp = r0 + Qotla$i0)\'t{cdx0) cos £©resp, 0O labels the field<br />
lines on the magnetic surface with given r0, <strong>and</strong> p is the number of the solution of<br />
Eq. (15). Similar expressions can be derived for the case of the bulk ion cyclotron<br />
resonance, co = ncoci.<br />
If the spatially slowly changing amplitude <strong>and</strong> wavenumber are assumed to be<br />
constant on the magnetic surface, Eq. (16) reduces to<br />
where<br />
y =<br />
oi ~ (Aco - etcocicos 60) 2<br />
E + (r0) is the E + (r) value on the magnetic surface with given value of r0.<br />
Similar expressions were derived for the fundamental <strong>and</strong> higher harmonic<br />
resonances of the bulk plasma:<br />
"ci - M(ro)c 2 /co 2 ] kl(ro)|E-(ro)| 2 .,<br />
y
718 KASILOVetal.<br />
If eh < e,, Eq. (19) takes the form<br />
- Aco 2<br />
kl(ro)lE-(ro)| 2<br />
This expression corresponds exactly to that for the FW damping coefficient derived<br />
in Ref. [9] for the tokamak case. In the opposite limit, e, < €h, Eqs (16) to (20)<br />
determine FW damping in a straight stellarator.<br />
Note that, in the case considered for ki :£ kicr, the global absorbed power<br />
values are equal to those derived with the help of local expressions that are averaged<br />
over the magnetic surface <strong>and</strong> where «ci is replaced by the local wci(F) value<br />
although the local behaviour of E + <strong>and</strong> j£, found at r ^r^ may essentially differ<br />
from the expressions derived in the local approximation.<br />
It follows from Eqs (16) to (21) that, irrespective of the great number of<br />
resonance points in a stellarator (~2mh£), the absorption there is not stronger than<br />
in the tokamak (in contrast to Ref. [11]). This is because in the stellarator the absorption<br />
in a single resonance zone is by a factor of l/(mh£) smaller than in the tokamak,<br />
as a result of the more rapid magnetic field variation along a magnetic field line.<br />
The formulas obtained are valid if the particle-wave phase change during the<br />
transit time between adjacent resonances, t ~ L/vTi, is high, rj ~ (1/6) i^e 2 , w 2 t 3<br />
> 1. For example, for the Uragan-2M-type stellarator (f = 2, Bo = 2 T, mh = 2,<br />
Ro = 1.7 m, eh = 0.05, T = 1 keV, w = 2Wcd, n - 5 x 10 13 cm" 3 ) we have<br />
•q ~ 100 > 1. However, under reactor conditions' at higher temperatures, the<br />
7) value may be much lower. For example, for I = 2, Bo = 5 T, RQ = 8 m,<br />
eh = 0.1, T = lOkeV, n = 10 14 cm" 3 , we obtain T; ~ 100/mj! <strong>and</strong>, already at<br />
mh = 6 (L = 10 m), we have rj ~ 1, while at mh = 12, we obtain rj ~ 0.1 < 1.<br />
If n < 1, then the correlation between wave <strong>and</strong> particle on passing adjacent<br />
resonances becomes rather essential. In this case, a substantially enhanced (by a<br />
factor of l/$rj) absorption is possible, provided that |Aco| = |co — najci| S V^w. The<br />
general 'non-local' formulas (3) to (6), in principle, permit also this case to be<br />
studied.<br />
4. CONCLUSIONS<br />
1. In the cyclotron absorption regime at a majority ion frequency w = a^, the<br />
FW-SW conversion pattern may essentially change, with the result that the SW may<br />
reach the cyclotron resonance region. This effect may be used to realize high power<br />
heating, current drive <strong>and</strong> two-component fusion, with the use of antennas directly<br />
launching the FW from the HFS.
<strong>IAEA</strong>-CN-5O/E-IV-3 719<br />
2. A non-local theory of weak ion cyclotron damping of FWs in stellarators is<br />
presented. The non-local effects are important for long wavelength FW, kj s k,cr,<br />
although the global FW absorption is equal to that obtained in the local approach.<br />
REFERENCES<br />
[1] LONGINOV, A.V., PAVLOV, S.S., STEPANOV, K.N., in Controlled Fusion <strong>and</strong> Plasma<br />
Physics (Proc. 12th Eur. Conf. Budapest, 1985), Vol. 9F, Part II, European Physical Society<br />
(1985) 132.<br />
[2] LONGINOV, A.V., PAVLOV, S.S., STEPANOV, K.N., in Controlled Fusion <strong>and</strong> Plasma<br />
Heating (Proc. 13th Eur. Conf. Schliersee, 1986), Vol. IOC, Part n, European Physical Society<br />
(1986) 185.<br />
[3] LONGINOV, A.V., PAVLOV, S.S., STEPANOV, K.N., Vopr. At. Nauki Tekh., Ser.<br />
Termoyad. Sintez 2 (1987) 315.<br />
[4] LONGINOV, A.V., PAVLOV, S.S., STEPANOV, K.N., in Controlled Fusion <strong>and</strong> Plasma<br />
Heating (Proc. 13th Eur. Conf. Schliersee, 1986), Vol. IOC, Part II, European Physical Society<br />
(1986) 473.<br />
[5] ONO, M., STIX, T.H., WONG, K.L., HORTON, R., in Heating in Toroidal Plasmas (Proc.<br />
2nd Joint Varenna-Grenoble Int. Symp. Como, 1980), Vol. 1 (1980) 593.<br />
[6] LONGINOV, A.V., LUK1NOV, V.A., in Controlled Fusion <strong>and</strong> Plasma Heating (Proc. 15th<br />
Eur. Conf. Dubrovnik, 1988), Vol. 12B, Part II, European Physical Society (1988) 742.<br />
[7] KALADZE, T.D., PYATAK, A.I., STEPANOV, K.N., Fiz. Plazmy 7 (1981) 986.<br />
[8] KALADZE, T.D., PYATAK, A.I., STEPANOV, K.N., Ukr. Fiz. Zh. 28 (1983) 995.<br />
[9] KASILOV, S.V., PYATAK, A.I., STEPANOV, K.N., in Plasma Physics (Proc. Contributed<br />
Papers Int. Conf. Kiev, April 1987), Vol. 3 (1987) 160.<br />
[10] VOLKOV, E.D., SUPRUNENKO, V.A., SHISHKIN, A.A., Stellarator, Kiev, Naukova<br />
Dumka (1983) 80.<br />
[11] KOVRIZHNYKH, L.M., MOROZ, P.E., Zh. Ehksp. Teor. Fiz. 60 (1984) 946.
<strong>IAEA</strong>-CN-50/E-IV-4<br />
FULL WAVE SOLUTIONS<br />
OF THE LOWER HYBRID WAVE PROPAGATION<br />
IN TORE SUPRA<br />
D. MOREAU, J.M. RAX, A. SAMAIN<br />
CEA, Centre d'e"tudes nucteaires de Cadarache,<br />
Association Euratom-CEA sur la fusion contr616e,<br />
Saint-Paul-lez-Durance, France<br />
Abstract<br />
FULL WAVE SOLUTIONS OF THE LOWER HYBRID WAVE PROPAGATION IN TORE SUPRA.<br />
Two new theoretical approaches to a full wave solution of lower hybrid wave propagation are<br />
presented. The first method uses both the eikonal <strong>and</strong> the variational technique: the variational principle<br />
associated with Maxwell's equations is projected on a set of eikonal trial functions in order to reduce<br />
the number of unknowns. The second method is perturbative in nature: starting from the set of coupled<br />
cylindrical eigenmodes, the large number of coupled amplitudes is treated statistically to provide a<br />
quasi-linear evolution of the wave energy.<br />
1. INTRODUCTION<br />
Together with the preparation of the Tore Supra lower hybrid experimental<br />
programme which will emphasize current drive <strong>and</strong> profile control, a great effort has<br />
been devoted to the development of new theoretical models which could complement<br />
the widely used model which is based on geometrical optics. A better underst<strong>and</strong>ing<br />
of the profile of power deposition is needed for an assessment of the profile control<br />
potentiality of LH waves in large tokamaks <strong>and</strong> for a trustworthy extrapolation from<br />
the present experiments (TS, JET) to future machines (NET, ITER).<br />
The difficulty in attempting a full wave description of the LH wave propagation<br />
lies in the very large number of degrees of freedom of the wave field in the toroidal<br />
plasma cavity (10 4 ), due to the small wavelength. If the electric field is analysed on<br />
the usual basis e/r) exp(im0)exp(in0)exp(-ia>t), where 2 is the radial mode number<br />
<strong>and</strong> n <strong>and</strong> m are the toroidal <strong>and</strong> poloidal mode numbers, in typical Tore Supra conditions<br />
we have 2 > 100 <strong>and</strong> m is launched around m « 0, but easily reaches m ><br />
100. This makes a calculation of the local wave vector difficult: kB(r) = (n +<br />
m/q(r))/R (q is the safety factor <strong>and</strong> R the major radius); this vector determines the<br />
radial <strong>and</strong> spectral power deposition, via L<strong>and</strong>au damping. To find this local wave<br />
vector <strong>and</strong> the corresponding field amplitude, we write the equation to be solved:<br />
V x V X E(r) - -V K(r)-E(r) = ^fa(r) (within the torus)<br />
......<br />
n x E(r) = 0 (on the torus)<br />
C (1)<br />
721
722 MOREAU et al.<br />
=t _»<br />
Here, K is the cold dielectric tensor, <strong>and</strong> Ja the equivalent antenna current (the<br />
dissipation will be introduced later). First, we shall consider the variational principle<br />
associated with Maxwell's equations <strong>and</strong> use an appropriate set of trial functions in<br />
order to reduce the number of unknowns. We thus obtain an algebraic system whose<br />
dimension is small enough to be processed.<br />
Our second model is perturbative in nature <strong>and</strong> considers the projection of the<br />
wave field on a cylindrical eigenmode basis. The large number of coupled modes is<br />
then treated from a statistical point of view by using the r<strong>and</strong>om phase approximation.<br />
This leads to a diffusion regime for the wave propagation, a quasi-linear equation giving<br />
the density of the electromagnetic energy in the various modes as a function of<br />
the injected power. This regime occurs above a threshold value for the tokamak<br />
inverse aspect ratio <strong>and</strong> when the single pass absorption is weak enough. The two<br />
approaches complement each other for strong (variational) <strong>and</strong> weak (quasi-linear)<br />
absorption.<br />
2. VARIATIONAL PRINCIPLE AND EIKONAL TRIAL FUNCTIONS<br />
The solutions of Eq. (1) are also the solutions of the following variational<br />
principle:<br />
SL[E*(r)] = Q<br />
5E*(F5<br />
L = dF[(V X E(r))-(V X E* (r)) - -^- E*(r)-K(r)-E(f5<br />
c 2<br />
In addition to the cold part of K, we assume dissipation inside the volume to ensure<br />
the uniqueness of the solution. The size s of the radial mesh needed for the application<br />
of a conventional finite element scheme must satisfy s < a/( « 1/100, where a is the<br />
minor radius of the torus. In addition to these radial cells, we have to consider m<br />
> 100 poloidal harmonics. An interesting method of overcoming this difficulty <strong>and</strong><br />
reducing the number of unknowns is to use radial cells such that s > all, but to<br />
introduce in each cell (i) trial functions which are eikonal solutions of the local dispersion<br />
equation: D(k,r)- E(r) = 0. Thus our unknowns will be four slowly varying<br />
amplitudes corresponding to the inward (+), outward (-), fast <strong>and</strong> slow modes (a)<br />
in each cell. The representation of the electric field, for given n <strong>and</strong> m, on this oversized<br />
mesh is:
with<br />
<strong>IAEA</strong>-CN-50/E-IV-4 723<br />
H;(r) = 0(r - r;) d(ri+l-r), 5(1^, ^~ tl )-Eai = 0<br />
zx<br />
0 is the Heaviside function <strong>and</strong> D the dispersion tensor (in fact, for the numerical<br />
implementation we have chosen a slightly different representation which takes into<br />
account the circular geometry of the problem). This class of trial functions greatly<br />
reduces the dimension of the matrix to be processed but introduces a new problem<br />
because these functions are not continuous. We must, therefore, complement the<br />
variational principle by a continuity constraint on the boundary of each cell. Since<br />
the only differential operator involved in this principle is the rotation of E, we<br />
introduce the so-called principal boundary conditions [1]: rTL X Ej(r*) = - ni+1 X<br />
Ei+1(r*), n being the outward normal to the radial cell. On this basis of eikonal trial<br />
functions, L becomes a quadratic <strong>and</strong> linear form in a:<br />
L = a*-A-a - a*-j*<br />
where A is block diagonal along i. The principal boundary conditions can be written<br />
in matrix form:<br />
B-a = Oor a*-'B* = 0<br />
where B is coupling i <strong>and</strong> i+1. To solve the variational principle 5L/8a* = 0 with<br />
the constraint B- a = 0, we introduce the Lagrange multipliers X <strong>and</strong> look for the<br />
extremum of a combined form:<br />
S(a*-A-a - a*-J + a*-'B*-X) = 0<br />
The final equation to be solved is thus a linear algebraic problem with a matrix of<br />
tridiagonal structure whose dimension is sufficiently small to allow direct inversion:<br />
BO; \\J Vo<br />
Figure 1 displays some preliminary results in cylindrical geometry, obtained by this<br />
numerical scheme. This figure shows the radial component of the electric field near<br />
the magnetic axis. Even if the continuity of this component is not imposed, the extremum<br />
principle finds a nearly continuous solution, in agreement with the previous discussion<br />
on boundary conditions.
724<br />
MOREAU et al.<br />
FIG. 1. Modulus of the radial component of the electric field near the magnetic axis (m = 1,<br />
n = 550).<br />
3. COUPLED MODE EQUATION AND RANDOM PHASE<br />
APPROXIMATION<br />
Another approach to this small wavelength, full wave problem is to assume that<br />
the number of unknowns is so large that it can be treated statistically [2]. The first<br />
step towards such a statistical processing is to project Eq. (1) on a basis of cylindrical<br />
functions:<br />
f,m,n<br />
For given n, the toroidal effects induce coupling between the<br />
<strong>and</strong> Eq. (1) becomes<br />
r,m'<br />
mode amplitudes,<br />
arm'(t) (3)<br />
where w(f,m) is the dispersion relation (Fig. 2), <strong>and</strong> the matrix elements V^V are<br />
proportional to e |m " m| (e = a/R) <strong>and</strong> rapidly decreasing with \l—t'\. This<br />
coupling is effective only if it is resonant, i.e. if it couples modes (£,m), (
3000<br />
m<br />
2000<br />
1000<br />
0<br />
1AEA-CN-50/E-IV-4 725<br />
^ ^ \ ^ 1=3.7 GHz<br />
200 400 600<br />
FIG. 2. Cylindrical dispersion relation of the LH branch (ne = 10' 4 cm ).<br />
around the resonant line (4), such that o>(l,m) < | Vj^V \. If several resonant layers<br />
overlap, a global transfer of energy takes place in the whole (2,m) plane. This overlapping<br />
criterion gives a certain threshold above which Eq. (3) leads to a master<br />
equation of quasi-linear type:<br />
dt<br />
m'<br />
Ptf'm' - ftn)U(f ,m')<br />
where U(£,m)
726 MOREAU et al.<br />
REFERENCES<br />
[1] MARCHUK, G.I., Methods of Numerical Mathematics, Springer-Verlag, Berlin (West) (1978).<br />
[2] MOREAU, D., RAX, J.M., SAMAIN, A., in Controlled Fusion <strong>and</strong> Plasma Heating (Proc. 15th<br />
Eur. Conf. Dubrovnik, 1988), Vol. 12B, Part ID, European Physical Society (1988) 995.
<strong>IAEA</strong>-CN-50/E-IV-5<br />
EXPERIMENTS ON EFFECTIVENESS OF MODE<br />
CONTROLLED ICRF FOR BOTH AXISYMMETRIC<br />
MIRRORS AND TOKAMAKS<br />
Y. YASAKA, H. TAKENO, S. INOUE, R. ITATANI<br />
Department of Electronics,<br />
Kyoto University,<br />
Kyoto,<br />
Japan<br />
Abstract<br />
EXPERIMENTS ON EFFECTIVENESS OF MODE CONTROLLED ICRF FOR BOTH AXISYM-<br />
METRIC MIRRORS AND TOKAMAKS.<br />
The paper describes two experimental topics: the effectiveness of mode controlled ICRF in mirrors<br />
<strong>and</strong> in tokamaks. High density (> 10 13 cm" 3 ) plasmas have been produced <strong>and</strong> MHD stabilized by<br />
a mode controlled helicon/fast wave <strong>and</strong> heated by a shear AlfV6n wave which is mode converted from<br />
the helicon/fast wave at the hybrid resonance in the HIEI mirror. Poloidal phasing of ICRF antennas<br />
in the WT-2 <strong>and</strong> WT-3 tokamaks has resulted in an improvement of the loading resistance <strong>and</strong> heating<br />
performance over conventional antennas.<br />
1. INTRODUCTION<br />
Waves in the ion cyclotron range of frequencies (ICRF) have a variety of<br />
branches that interact with ions <strong>and</strong>/or electrons in different ways. It is, therefore,<br />
possible to choose a desired interaction in heating or control of plasmas by selecting<br />
a specific wave branch. More importantly, since the wavelength of the ICRF waves<br />
is comparable to the plasma size, the k spectrum of the wave can be controlled by<br />
tailoring the antenna vacuum spectrum, leading to optimization of the interaction. We<br />
have demonstrated the effectiveness of controlling the azimuthal k spectrum of the<br />
wave for slow wave heating [1,2] <strong>and</strong> RF stabilization of the flute modes [3,4].<br />
In the next section of this paper, it is shown that high density<br />
[(0.5-2) x 10 13 cm" 3 ] plasmas are effectively produced <strong>and</strong> heated by a mode controlled<br />
helicon/fast wave (H/FW) <strong>and</strong> its mode conversion into a shear Alfve'n wave<br />
(SAW). The concept of the HIEI t<strong>and</strong>em mirror <strong>and</strong> its first operation are presented<br />
in Section 3. In Section 4, we demonstrate that the poloidal phasing of ICRF antennas<br />
has improved the coupling <strong>and</strong> heating efficiencies over those of conventional<br />
antennas in tokamaks.<br />
727
728 YASAKA et al.<br />
2. EFFICIENT PLASMA PRODUCTION AND HEATING<br />
2.1. Plasma production by H/FW<br />
The experiment was performed in the simple mirror HIEI, which is an axisymmetric<br />
single cell mirror. The details of the machine are described in Ref. [4]. The<br />
H/FW is excited by an azimuthal array of four antenna elements of 33 cm axial<br />
length, located at the midplane. The radius of the limiter is 3.8 cm. The plasma is<br />
produced by helium gas puffing from a gas box, followed by the application of m<br />
= -1 (right rotating) RF with w/2x = 8.0 MHz. The radial profile of the density<br />
was nearly Gaussian. The RF magnetic field away from the antenna was measured<br />
by a movable magnetic probe <strong>and</strong> compared with the result of the ICRF code [5];<br />
reasonable agreement was found, showing the propagation of H/FW. We have<br />
achieved a peak plasma density of 1.9 x 10 13 cm" 3 for u/Q; = 46 <strong>and</strong> a mirror<br />
ratio of R = 11, <strong>and</strong> 1.1 x 10 13 cm" 3 for w/Oj = 22.4 <strong>and</strong> R = 4.8, where Q-t is<br />
the majority ion cyclotron frequency at the antenna location. In both cases, the<br />
plasma was very stable. When the antenna excitation was changed from the m = — 1<br />
right rotating to the m = +1 left rotating mode in separate experiments, the plasma<br />
density decreased significantly <strong>and</strong> the fluctuation level increased. These results show<br />
clearly that the propagating H/FW contributes to MHD stability.<br />
2.2. Heating via mode conversion<br />
We then introduce minority hydrogen into the RF produced helium plasma with<br />
R = 4.8 <strong>and</strong> co/ty = 11.2. Figure 1 shows the left (B+) <strong>and</strong> the right (B_) circularly<br />
polarized component of the wave magnetic field as a function of the radius. In the<br />
0 1 2<br />
r [cml<br />
FIG. 1. Radial distribution ofB+ <strong>and</strong> B_ at a location near the ion-ion hybrid resonance for helium<br />
plasma with (a) no minority <strong>and</strong> (b) 13% minority hydrogen.
<strong>IAEA</strong>-CN-50/E-IV-5 729<br />
0 ""'"10 20 30<br />
HYDROGEN CONCENTRATION P/J<br />
FIG. 2. (a) Ratio of B+ to 5_ (solid line) <strong>and</strong> calculated mode conversion rate (dotted line); (b)<br />
incremental perpendicular ion temperature times density as a function of the hydrogen concentration.<br />
absence of hydrogen (a), where no mode conversion occurs, the wave field is entirely<br />
of H/FW, which is observed to be purely right circularly polarized at r = 0. For r<br />
> 1.0 cm, however, the B+ component is finite, because of the boundary effect.<br />
When the hydrogen is added, the value of B+ increases near the axis as is shown in<br />
Fig. l(b). No increase of B+ was observed for a two-ion species plasma without<br />
ion-ion hybrid layer in the mirror. Hence, the observed increase in B+ is associated<br />
with the mode converted SAW [6]. This mode conversion is quite different from that<br />
in tokamaks, in the sense that the mode converted wave is electromagnetic rather than<br />
electrostatic. The value of B+/B_ is plotted in Fig. 2(a) versus the hydrogen concentration.<br />
This variation is consistent with mode conversion theory [7]. The perpendicular<br />
ion temperature of helium plasma was Tix ~ 25 eV at r = 0-1 cm. The<br />
increment of Tix times the density, nATu, is plotted in Fig. 2(b) versus the hydrogen<br />
concentration. The value of nATi± varies as B+, indicating clearly that the ion<br />
heating is due to the cyclotron damping of the mode converted SAW.<br />
3. EXPERIMENTS FOR AN ADVANCED TANDEM MIRROR<br />
CONFIGURATION<br />
3.1. Concept of advanced t<strong>and</strong>em mirror<br />
On the basis of the experimental results described in the previous section, we<br />
introduce a novel t<strong>and</strong>em mirror configuration in which high density two-ion-species
730 YASAKA et al.<br />
'£ 1<br />
0.5<br />
0 4<br />
Pnel = 200 kW<br />
LJ/ft; - 55<br />
0 n 2TT<br />
A((> [radians]<br />
FIG. 3. (a) Peak plasma density at midplane of central cell versus phase difference of RF currents in<br />
two antennas, A0, for net input RF power of 200 kW <strong>and</strong> uA^ = 55; (b) nTiL versus net input RF<br />
power for A = ir/2 (open circles) <strong>and</strong> A
<strong>IAEA</strong>-CN-50/E-IV-5 731<br />
A, for a net input RF power of 200 kW <strong>and</strong> o>/R; « 55. A peak density of —1.3<br />
x 10 13 cm" 3 was achieved for A ~ ir/2, which corresponds to right rotating excitation.<br />
The (3 value is about 8 %. The right rotating excitation produces a plasma with<br />
twice the density of that produced by the left rotating excitation (A ~ 3ir/2). We<br />
then add minority hydrogen (< 5%) to the helium plasma. The value of nTix is plotted<br />
in Fig. 3(b) versus the net input RF power for A ~ it 12 (open circles) <strong>and</strong> Acj> ~<br />
3TT/2 (closed circles), with the hybrid resonance layer inside the central cell. A value<br />
of Tix as high as 156 eV was obtained for n * 5.6 x 10 12 cm" 3 when A
732 YASAKA et al.<br />
WT-3<br />
1 2<br />
Q,f C 10'A 2 ]<br />
F/G. 4. (a) Loading resistance versus relative antenna phase in WT-3; (b) increment of TiL versus<br />
a 2 +l for slow wave heating in WT-2.<br />
ACKNOWLEDGEMENTS<br />
The authors acknowledge co-operation with the WT-2 <strong>and</strong> W-3 groups. The<br />
work was supported by a grant-in-aid for scientific <strong>and</strong> fusion research from the<br />
Ministry of Education of Japan.<br />
REFERENCES<br />
[1] YASAKA, Y., ITATANI, R., Phys. Rev. Lett. 44 (1980) 1763.<br />
[2] YASAKA, Y., ITATANI, R., Nucl. Fusion 20 (1980) 1391.<br />
[3] YASAKA, Y., ITATANI, R., Phys. Rev. Lett. 56 (1986) 2811.<br />
[4] ITATANI, R., TAKENO, H., YASAKA, Y., in Plasma Physics <strong>and</strong> Controlled <strong>Nuclear</strong> Fusion<br />
Research 1986 (Proc. 11th Int. Conf. Kyoto, 1986), Vol. 2, <strong>IAEA</strong>, Vienna (1987) 273.<br />
[5] FUKUYAMA, A. (Okayama Univ., Japan), personal communication.<br />
[6] WHITE, R.B., et al., Phys. Fluids 25 (1982) 384.<br />
[7] DAVIES, L., et al., Phys. Fluids 28 (1985) 1791.<br />
[8] TANAKA, S., et al., in Plasma Physics <strong>and</strong> Controlled <strong>Nuclear</strong> Fusion Research 1986 (Proc.<br />
11th Int. Conf. Kyoto, 1986), Vol. 1, <strong>IAEA</strong>, Vienna (1987) 553.<br />
WT-2
IMPROVEMENT OF RF CURRENT DRIVE<br />
DENSITY LIMIT IN THE JFT-2M TOKAMAK<br />
<strong>IAEA</strong>-CN-50/E-IV-6<br />
T. YAMAMOTO, H. AIKAWA, K. HOSHINO, S. KASAI,<br />
T. KAWAKAMI, H. KAWASHIMA, T. KONDOH 1 , H. MAEDA,<br />
T. MATSUDA, H. MATSUMOTO, Y. MIURA, M. MORI, K. ODAJIMA,<br />
H. OGAWA, T. OGAWA, K. OHASA, H. OHTSUKA, S. SENGOKU,<br />
T. SHOJI, N. SUZUKI, H. TAMAI, Y. UESUGI, T. YAMAUCHI,<br />
I. NAKAZAWA 2 , K. HASEGAWA, A. HONDA, I. ISHIBORI,<br />
Y. KASHIWA, M. KAZAWA, K. KIKUCHI, H. OKANO, E. SATO,<br />
T. SHIBATA, T. SHIINA, K. SUZUKI, T. TANI, T. TOKUTAKE,<br />
S. UNO<br />
Department of Thermonuclear Fusion Research,<br />
Naka Fusion Research Establishment,<br />
Japan Atomic Energy Research Institute,<br />
Tokai-mura, Naka-machi, Ibaraki-ken, Japan<br />
Abstract<br />
IMPROVEMENT OF RF CURRENT DRIVE DENSITY LIMIT IN THE JFT-2M TOKAMAK.<br />
Experiments combining lower hybrid current drive (LHCD) with the injection of a solid pellet<br />
have been carried out to study the potential of this approach for optimizing LHCD. The injected pellet<br />
is observed to penetrate deeply into the plasma, producing a peaked electron density profile. An<br />
improvement of the density limit of LHCD is obtained although this effect seems to be short lived. In<br />
addition, good particle confinement <strong>and</strong> suppression of MHD activity are also observed during relatively<br />
high density LHCD. New results of 200 MHz fast wave experiments for electron densities well above<br />
the LH resonance density, using a phased four-loop antenna array, are also reported. It is observed that<br />
in discharges with electron cyclotron heating (ECH) of 180 kW the injection of 300 kW of fast wave<br />
power produces an appreciable drop in the loop voltage <strong>and</strong> a noticeable enhancement of electron cyclotron<br />
emission (ECE) from non-thermal electrons near the plasma centre. The drop in loop voltage <strong>and</strong><br />
the enhancement of ECE are also observed to depend on the phase difference between adjacent loop<br />
antennas, a result consistent with theory. These results suggest fast wave current drive.<br />
1. INTRODUCTION<br />
Pellet injection has been considered to be a method of central fusion device<br />
fuelling. It is, therefore, important to investigate the injection of pellets into RF current<br />
driven plasmas, because of the importance of this mechanism for future steady<br />
state tokamak operation.<br />
1 On leave from University of Tsukuba, Ibaraki-ken, Japan.<br />
2 On leave from Mitsubishi Electric Corp., Tokyo, Japan.<br />
733
734<br />
invi<br />
p o p p<br />
•^ CJ -^<br />
o<br />
IO<br />
o ^~<br />
YAMAMOTO et al.<br />
o ro<br />
o o oco<br />
o<br />
ID<br />
o<br />
333 rrrvi<br />
8<br />
6*"<br />
t o<br />
g<br />
E<br />
3 =3<br />
g Q.<br />
18<br />
•2 •§ o.<br />
s c<br />
o<br />
I 13]<br />
pel<br />
•g<br />
's<br />
8?<br />
/ discht<br />
injectio<br />
8<br />
typi<br />
1<br />
s;<br />
I<br />
cti<br />
'nje<br />
id p<br />
1<br />
a<br />
o«<br />
g<br />
•S.S R? 1<br />
§. :<br />
- T"3<br />
a -S ""<br />
•S.S "§<br />
^ -S3 Q<br />
S § §<br />
3ft<br />
^<br />
g
<strong>IAEA</strong>-CN-S0/E-IV-6 735<br />
A fast wave (FW) in the frequency range of fci =» fm(0) (fLH(O) i s the<br />
maximum LH resonance frequency in the plasma) can penetrate into the plasma<br />
centre, even if the plasma is hot <strong>and</strong> dense. Since current drive by fast waves<br />
(FWCD) is based on the same mechanism as LHCD, which has been demonstrated<br />
with efficiencies close to the range expected for reactor grade plasmas [1], FWCD<br />
is expected to enable the construction of a steady state tokamak reactor with centrally<br />
peaked current profile.<br />
2. EXPERIMENTAL SET-UP<br />
The JFT-2M tokamak has a D-shaped vacuum vessel with a major radius of<br />
Ro = 1.31 m <strong>and</strong> a 0.415 m X 0.595 m minor cross-section [2]. The employed<br />
LH system (PLH « 200 kW, 750 MHz) launched the LH waves by means of an<br />
array of four waveguides, yielding a Brambilla RF spectrum concentrated between<br />
parallel refractive indices of Nz = 1 <strong>and</strong> 5. By using a gas propellant pellet injector<br />
[3], a D2 pellet with a velocity of about 0.8 km-s" 1 was injected radially in the<br />
plasma midplane. In the ECH system, the FR power is generated by two Varian<br />
gyrotrons, each capable of producing 200 kW at 60 GHz for up to 0.1 s. The extraordinary<br />
waves at the second harmonic frequency are radiated quasi-perpendicularly<br />
to the toroidal magnetic field from the low magnetic field side in the plasma<br />
midplane. The FW system consists of four 200 MHz RF sources, each capable of<br />
supplying 180 kW for up to 0.5 s to each poloidal loop antenna. A single Faraday<br />
screen shields the antenna array. The spacing between adjacent loop antennas is 8 cm<br />
in the toroidal direction, <strong>and</strong> the radiative length of the loop antenna is 18 cm. The<br />
impedance of each line is matched by using A/8 double stub tuners, <strong>and</strong> the phase<br />
difference between the antennas, A#FW, is adjusted independently.<br />
3. EXPERIMENTAL RESULTS<br />
3.1. Lower hybrid current drive with pellet injection<br />
The present experiment was performed in the limiter discharge plasma<br />
(BT0 = 1.07 T, Ip « 200 kA, plasma elongation of 1.3, <strong>and</strong> a = 0.32 m).<br />
Figure 1 (a) shows the time evolution of the relevant plasma parameters for a typical<br />
discharge with pellet injection. For the discharge, the plasma current was kept<br />
constant during the LH pulse. The working gas was deuterium. The line averaged<br />
electron density n^ just before pellet injection is 3 X 10 18 rrr 3 , so that most of the<br />
plasma current is driven by the LH waves. Immediately after pellet injection, the<br />
density rises up 1.3 X 10 19 m" 3 <strong>and</strong> remains there for about 60 ms with no noticeably<br />
enhanced line radiation of Da. A loop voltage of 0.8 V is seen to be maintained<br />
while the density remains at n,, « 1.3 X 10 19 irr 3 . The ECE with frequencies of<br />
56 <strong>and</strong> 90 GHz (corresponding to the second harmonic at r = 0.09 m <strong>and</strong> the third<br />
harmonic at r = 0.0 m) decreases slightly just after injection of the pellet <strong>and</strong> then<br />
remains constant. Most of the measured ECE intensity is contributed by non-thermal
736 YAMAMOTO et al.<br />
(A)<br />
OJ —<br />
o<br />
(A)<br />
O »O O<br />
(fi) vla M<br />
v (irv) J d<br />
om o<br />
h<br />
A»H.) (333)<br />
0 V I " d 3P/ " d NP Md 3<br />
o o o o<br />
— ^. x<br />
o<br />
&3 II<br />
is" 1<br />
1<br />
-S c<br />
5\<br />
00<br />
II<br />
is'<br />
Is ^ S<br />
•s!;«<br />
fe 8 s<br />
•« tj [y<br />
in<br />
lit<br />
i
<strong>IAEA</strong>-CN-50/E-IV-6 737<br />
electrons. The value of A = /3p + £/2 - 1 increases gradually even though there is<br />
no change in the stored plasma energy, WDIA. The poloidal magnetic fluctuations<br />
picked up by a magnetic probe, , are observed to be suppressed by pellet<br />
injection. The excitation of parametric decay instabilities, as indicated by the magnitude<br />
of the decay waves PiNS, has been observed to be small as compared with that<br />
produced by gas puffing.<br />
Figure l(b) shows the electron density <strong>and</strong> temperature profiles along the<br />
vertical chord measured by Thomson scattering diagnostics. The circles in the figure<br />
represent the data obtained 40 ms after pellet injection; the dashed line reflects the<br />
data observed just before injection. We see that pellet injection produces a peaked<br />
density profile while the peripheral density is comparable to, or less than, the density<br />
just before pellet injection. The peaked density profile observed seems to be consistent<br />
with a monitor signal of the pellet ablation. This signal indicates deep penetration<br />
of the pellet into the plasma.<br />
The density dependence of the loop voltage <strong>and</strong> ECE (IECE) for plasmas with<br />
gas puffing <strong>and</strong> pellet injection is plotted in Fig. l(c). The dot-dashed line in the<br />
figure shows the loop voltage without the LH pulse but with gas puffing. For decreasing<br />
electron densities, it is found that the decrease in the loop voltage for pellet injection<br />
begins to appear at a density which is twice as high as that for gas puffing. ECE<br />
indicates a substantial population of energetic electrons in the pellet injected plasma,<br />
even at higher densities. These results show that the density limit of the LH current<br />
drive for pellet injected plasmas is improved by a factor of two, as compared with<br />
that for plasmas with gas puffing.<br />
3.2. Current drive by fast waves<br />
In this section, the experimental results using 200 MHz fast waves are<br />
described. Figure 2(a) shows the time behaviour of the relevant plasma parameters<br />
during two typical shots for BTo = 1.07 T <strong>and</strong> Ip = 100 kA. The working gas was<br />
hydrogen. The radiated ECH <strong>and</strong> FW powers were 180 kW <strong>and</strong> 300 kW, respectively.<br />
The solid lines represent the results of FW combined with ECH; the dashed<br />
lines are the results obtained without the FW pulse. The value of A$FW was set<br />
at 160°, <strong>and</strong> the spectrum of the fast waves radiated is thus calculated to have a peak<br />
around N2 « 6.5. It should be noted that the present plasma parameters yield<br />
rLH/a = 0.93 for the radial position of the LH resonance layer at 200 MHz.<br />
The combination of ECH <strong>and</strong> FW pulses is seen to produce an appreciable<br />
additional drop in the loop voltage (AVyVi ~ 0.25), <strong>and</strong>.an increase of 0.5 kJ in<br />
the stored plasma energy. The increase in the stored energy leads to an absorption<br />
efficiency of 20%, if it is assumed that no change in the energy confinement time<br />
during the RF pulses takes place. The radiation temperature of the ECE with<br />
frequencies of 82, 86 <strong>and</strong> 90 GHz is also enhanced with the application of the<br />
FW pulse during ECH. Note that 82, 86 <strong>and</strong> 90 GHz correspond to the third<br />
harmonics at r = 0.12, 0.06 <strong>and</strong> 0.0 m, respectively. These results indicate that the<br />
FW interaction with the electrons occurs near the plasma centre. The measurement<br />
of the soft X-ray spectrum, shown in Fig. 2(b), shows a central electron temperature
738 YAMAMOTO et al.<br />
of Tsx =1.5 keV during ECH <strong>and</strong> a noticeable increase in the temperature of the<br />
tail component for combined ECH <strong>and</strong> FW pulses.<br />
Figure 2(c) shows the changes in the loop voltage <strong>and</strong> ECE versus the phase<br />
difference between the loop antennas. It is found that fast waves radiated with<br />
A0FW < 90° do not interact substantially with the plasma electrons. We note<br />
that the calculated spectrum with A
<strong>IAEA</strong>-CN-50/E-IV-7<br />
NON-INDUCTIVE STARTUP AND<br />
CURRENT RAMP-UP SCENARIO OPTIMIZATION<br />
FOR A TOKAMAK REACTOR<br />
G.V.PEREVERZEV<br />
I.V. Kurchatov Institute of Atomic Energy,<br />
Moscow,<br />
Union of Soviet Socialist Republics<br />
Abstract<br />
NON-INDUCTIVE STARTUP AND CURRENT RAMP-UP SCENARIO OPTIMIZATION FOR A<br />
TOKAMAK REACTOR.<br />
The stages of gas ionization <strong>and</strong> current ramp-up in a non-inductive tokamak are considered. The<br />
main feature of this consideration of the ionization stage is the use of the recently developed theory of<br />
plasma equilibrium in a toroidal system without rotational transform. The transport model based on this<br />
theory is used for selecting the optimal conditions for power input into a tokamak. The dependences<br />
of plasma density <strong>and</strong> temperature on the input power for auxiliary heating are found. Current ramp-up<br />
with lower hybrid waves <strong>and</strong> neutral beam injection is considered. It is shown that the current ramp-up<br />
rate, as a function of input power <strong>and</strong> plasma density, has a maximum. This allows either the current<br />
rise time or the energy consumption to be minimized at this stage. However, even in this optimized case<br />
the stage of current ramp-up in a tokamak of the reactor type turns out to be rather long.<br />
1. INTRODUCTION<br />
Gas ionization <strong>and</strong> current ramp-up are necessary elements in the discharge<br />
scenario. However, while there exists a great body of experience with the traditional<br />
inductive technique for discharge production, there are few experiments on the noninductive<br />
technique [1-5]. In inductive discharges the stages of gas ionization <strong>and</strong><br />
current ramp-up coincide in time <strong>and</strong>, as a rule, by the end of gas ionization there<br />
are closed magnetic surfaces in the tokamak chamber. The situation is different in<br />
the non-inductive tokamak. Gas ionization (hot plasma production) <strong>and</strong> current rampup<br />
can be performed by different methods <strong>and</strong> not necessarily at the same time. In<br />
this case, at the ionization stage closed magnetic surfaces can be absent from the<br />
plasma <strong>and</strong> the mechanisms of particle <strong>and</strong> energy confinement can be different, in<br />
principle, from the well studied case of inductive discharges.<br />
In this paper the stages of gas ionization <strong>and</strong> current ramp-up in the noninductive<br />
tokamak are considered. Our approach differs from that of all previous<br />
papers mainly in the use of the recently developed theory of plasma equilibrium in<br />
a toroidal magnetic system without rotational transform [6, 7]. As- shown in<br />
Refs [6, 7], toroidal drift, which has been considered as the main loss channel, being<br />
non-ambipolar, results in the emergence of a vertical electric field <strong>and</strong> in a toroidal<br />
739
740 PEREVERZEV<br />
current drive producing a force, for plasma equilibrium only. In the equilibrium configuration<br />
that is produced a plasma flow determining the particle <strong>and</strong> energy lifetime<br />
in the system emerges. The transport model developed on the basis of this theory of<br />
equilibrium is used in this paper for explaining some experimental results <strong>and</strong> also<br />
for selecting optimal conditions for the power input into a tokamak.<br />
In Section 3 current ramp-up in a tokamak is considered. It is shown that the<br />
current ramp-up rate, as a function of input power <strong>and</strong> plasma density, has a maximum.<br />
This maximum is a universal parameter of the tokamak, since it depends only<br />
on its dimensions <strong>and</strong> on the energy confinement time. The efficiency of the conversion<br />
of external source energy into the energy of a poloidal magnetic field has a similar<br />
dependence. Optimized scenarios of current ramp-up are suggested. These<br />
scenarios allow either current rise time or external source energy consumption to be<br />
minimized at this stage. Even in this case the non-inductive current rise stage in a<br />
tokamak of the reactor type appears to be rather long, about a few tens of minutes.<br />
2. IONIZATION STAGE<br />
Let us assume a strong toroidal magnetic field Bv in the tokamak chamber <strong>and</strong><br />
a much weaker transverse field Bx with a vertical component Bvert. If the neutral<br />
gas density at the beginning of the ionization stage has a value N, the ionization<br />
process will be represented by a zero dimensional set of equations for the energy <strong>and</strong><br />
particle balance:<br />
— = -— + n(N - n) (1)<br />
dt r<br />
2 dt " 2 T V<br />
} ^ | + Pei (3)<br />
2 dt 2 T<br />
Here n is the density <strong>and</strong> Te <strong>and</strong> T, are the temperatures of the electrons <strong>and</strong> the<br />
ions. The source of particles in Eq. (1) is written on the assumption that there is complete<br />
recycling, i.e. conservation of the amount of particles in the plasma volume.<br />
Qinp is the total input power, V is the plasma volume, Pei is the heat exchange<br />
between electrons <strong>and</strong> ions, <strong>and</strong> T is the confinement time of particles <strong>and</strong> energy.<br />
The last quantity expresses the main peculiarity of the given model <strong>and</strong> is chosen<br />
from the following considerations.
300<br />
200 -<br />
100 -<br />
<strong>IAEA</strong>-CN-50/E-IV-7 741<br />
/<br />
Z 2 MW<br />
^~\ Qinp=10MW<br />
\5MW<br />
\n = 3X10 12 cm- 3<br />
Qinp " 5 MW<br />
^ \ n = 6X10 12 cm' 3<br />
- - - - - _<br />
1<br />
1<br />
50 100<br />
FIG. 1. Electron temperature Te as a function of vertical field Bven for the case with R = 5 m,<br />
a = J.5 m.<br />
As shown in Ref. [7], when the plasma pressure is not too high <strong>and</strong> satisfies<br />
the inequality<br />
2 vert<br />
a<br />
a transverse diffusive flow with the diffusion coefficient 2)± = p| cei (B,,/Bven) 2<br />
emerges along with a longitudinal plasma spread along the magnetic field lines with<br />
the speed of sound, cs. Here pe is the Larmor radius of electrons <strong>and</strong> vei is the frequency<br />
of electron-ion collisions. With an increase in the input power Qinp condition<br />
(4) can be violated. Then the plasma losses from the system turn out to be<br />
disastrously large <strong>and</strong> are determined by a transverse escape with a speed of about<br />
Va/R cs [8]. In this case, the plasma pressure is actually, given by inequality (4)<br />
(4)
742 PEREVERZEV<br />
300 - - 150<br />
ne (10 12 cm" 3 )<br />
- 100<br />
FIG. 2. Maximal values of Te <strong>and</strong> correspondent magnetic fields Bven as functions of plasma density<br />
ne for different values of input power Qinp.<br />
<strong>and</strong> not by the set (l)-(3). However, one can include the constraint (4) in the set (1)-<br />
(3), determining the confinement time r in the form<br />
T a B,, + min / Cs S>±<br />
WaR' a 2 (l - (3±<br />
The results of simulation for the set (l)-(3), (5) are given in Figs 1 <strong>and</strong> 2. The<br />
electron temperature dependence on the vertical component in the transverse magnetic<br />
field within the plasma is shown in Fig. 1. Here the rising parts of the curves<br />
(5)
<strong>IAEA</strong>-CN-50/E-IV-7 743<br />
are related to the pressure limit (4) <strong>and</strong> are practically independent of the input<br />
power. Te(Bverl), for fixed Qinp, decreases at high Bvert. In this range of parameters<br />
the losses are determined by a longitudinal plasma spread along the magnetic fieldlines.<br />
Thus at given values of power <strong>and</strong> density there is an optimal vertical magnetic<br />
field, Bvert = B*ert, at which the temperature reaches its maximum T* = Te(B*en).<br />
The theory of Refs [6, 7] is applicable only when Te > Tf. If Te ~ Ti; the<br />
toroidal ion drift velocity will become comparable with the velocity of the toroidal<br />
electron drift. In this case the plasma equilibrium can be provided by the flow of a<br />
vertical current. This mechanism has been described in Ref. [8]. When the type of<br />
equilibrium is changed, the type of transport changes, too. The second term in<br />
Eq. (5) becomes invalid. In the calculated example in Fig. 1 the range of parameters<br />
where the applicability of Eq. (5) is violated is qualitatively shown with a dotted line,<br />
which extrapolates the behaviour of Te(Bvert) in this range.<br />
Let us turn back to the maximal T* at given input power Qinp <strong>and</strong> density n. As<br />
mentioned above, this temperature is obtained at some field B*m which is also a<br />
function of Qinp <strong>and</strong> n. These two functions, Te*(n,Qinp) <strong>and</strong> B*erl(n,Qinp), are shown<br />
in Fig. 2. Figure 2 allows one to determine the electron temperature achievable at<br />
a given density <strong>and</strong> power at a given facility as well as the vertical magnetic field<br />
necessary for obtaining this maximal temperature. Thus from Fig. 2 one can see that<br />
a moderate input power of 10 MW allows a temperature of about a few hundred electronvolts<br />
to be obtained. However, it must be noted that the temperature weakly<br />
depends on the input power <strong>and</strong> the plasma density T* = VQjnp/n. Therefore it is<br />
difficult to raise the temperature in comparison with the range of data given in Fig. 2.<br />
3. CURRENT RAMP-UP<br />
Now let us consider the current ramp-up stage. For its description one can use<br />
the set of equations:<br />
Q,np = | ^ - I U = - - IU<br />
dLI + U = Uind U = R (I - I)<br />
dt<br />
Here I is the plasma current, U is the plasma loop voltage, Uind is the voltage<br />
produced by the inductor, I is the current driven by the external source, L is the<br />
plasma inductance, R is the plasma resistance <strong>and</strong> r/ = I/Qinp is the steady state<br />
current drive efficiency. The first equation in the set represents the energy balance<br />
for the electron component. The equation for the ion temperature is omitted here,<br />
since it is expedient to sustain the plasma density at a low level at the stage of current<br />
(6)
744 PEREVERZEV<br />
0.2-<br />
-0.2-<br />
0.1X10 19 m- 3<br />
0.3X10 19 rrf 3<br />
ne = 1X10¹⁹m-3 19 m"<br />
FIG. 3. Loop voltage U <strong>and</strong> energy conversion efficiency JJ versus input power for different electron<br />
densities, for the case of LHCD, T-ll scaling, a = 1.5 m, R = 5.0 m, B = 5.0 T, L = 11.2 H,<br />
lp = 15.0 MA, Zejf = 3.0. With a high input power the loop voltage is negative, which means a current<br />
increase. CD efficiency is negative for a low input power, i.e. energy flows from external space into<br />
the plasma volume.,<br />
-| 0.1 v<br />
ne = 1 X 10 19 m" 3 , Eb = 160 ke V<br />
•ne= 1X10 19 rrT 3 , Eb = 80keV<br />
• ne= 2X10 19 rrT 3 . Eb = 160keV<br />
Q (MW)<br />
FIG. 4. As for Fig. 3 for the case of NBICD, Kaye-Goldston scaling, a = 1.5 m, R = 5.0 m,<br />
B = 5.0T,L = 11.2 H, ]p = 15.0 MA, Zeg = 3.0, Zb = ;. Here the scales for U<strong>and</strong>r, are different.
<strong>IAEA</strong>-CN-50/E-IV-7 745<br />
TABLE I. CHARACTERISTICS OF THE MOST RAPID CURRENT RAMP-UP<br />
SCENARIO<br />
Scaling<br />
Kaye-Goldston T-ll ITI" 11<br />
(Neo-Alcator)<br />
U (V) 0.04 0.07 0.25<br />
n(10 13 cm" 3 ) 0.1 0.3 0.6<br />
Q°n P p'(MW) 10 20 40<br />
t (min) 40 25 8<br />
rise. The role of ions in the energy balance is not great <strong>and</strong> the ion temperature by<br />
itself is not used in the equations. The next equation of the set (6) is one for an external<br />
tokamak circuit. When Uind = 0 this equation represents the current ramp-up by<br />
the non-inductive method; when dl/dt = 0 it represents the inductor recharging. The<br />
last equation is Ohm's law for the plasma column. Note that this set was used in<br />
Ref. [9] for simulation of experiments on Alcator-C [10] <strong>and</strong> in spite of its simplicity<br />
reasonably represented the main experimental dependences.<br />
The results of solving the set (6), on the assumption that the current is produced<br />
by LH waves, are given in Figs 3 <strong>and</strong> 4. The most characteristic parameters of the<br />
current rise process are the loop voltage U <strong>and</strong> the efficiency of converting the RF<br />
source energy into poloidal field energy r/el = IU/Qinp. These two quantities are<br />
given in Fig. 3, as a function of the deposited power at different densities <strong>and</strong> at fixed<br />
plasma current 1=15 MA. One can see that there is an optimal input power at which<br />
the rate of current ramp-up <strong>and</strong> the efficiency of RF energy conversion into poloidal<br />
magnetic field energy reach a maximum. The existence of such a maximum is related<br />
to the fact that with an increase in the input power Qinp the plasma temperature rises.<br />
This results in a drop in the plasma resistance <strong>and</strong>, beginning at a certain value of<br />
Qinp = Qi°nj>> the loop voltage |U| also starts to drop. From Fig. 3 one can also see<br />
that the quantity |U| has a maximum as a function of the plasma density also. The<br />
maximum value of the function of two variables, i.e. of max|U(Qinp,n)|, characterizes<br />
the maximum rate of tokamak inductor recharging. In a tokamak this rate can<br />
be increased with an increase in the current drive efficiency or in the plasma column<br />
resistance. An obvious technique for increasing the plasma resistance is to increase<br />
the effective charge Zeff. Another way is to decrease the electron temperature Te by<br />
reduction of the electron energy confinement time T^. The minimal times for the<br />
current ramp-up by LH waves in ITER from zero to 15 MA, at different assumed<br />
energy confinement times, are given in Table I.
746 PEREVERZEV<br />
The dependences of loop voltage U, electron temperature Te <strong>and</strong> current drive<br />
efficiency 7;e! on the input power are given in Fig. 4 for current drive by NBI.<br />
Although the NBI current drive has a rather high efficiency, it is only achieved at<br />
high plasma temperature. The plasma resistance turns out to be extremely low <strong>and</strong><br />
the current rise time to be very long. In contrast to the case of current drive by LH<br />
waves, the plasma confinement time degradation does not result in a faster current<br />
rise, because the current drive efficiency drop takes place simultaneously with the<br />
temperature drop. The net effect weakly manifests itself in the loop voltage. A variation<br />
of the neutral beam energy also leads to an insignificant change in the current<br />
rise rate, owing to the necessity of the simultaneous change in plasma density<br />
(Fig. 4). Comparison of NBI <strong>and</strong> LH methods of current drive shows that LHCD<br />
makes possible a current rise about twice as fast as <strong>and</strong> with less input power than<br />
the NBI method.<br />
REFERENCES<br />
[1] JOBES, F., et al., Phys. Rev. Lett. 55 (1985) 1295.<br />
[2] TANAKA, S., et al., "Electron cyclotron <strong>and</strong> lower hybrid current drive experiments in the<br />
WT-2 <strong>and</strong> WT-3 tokamaks", Plasma Physics <strong>and</strong> Controlled <strong>Nuclear</strong> Fusion Research 1986<br />
(Proc. 11th Int. Conf. Kyoto, 1986), Vol. 1, <strong>IAEA</strong>, Vienna (1987) 553-562.<br />
[3] JOBES, F.C., et al., Phys. Rev. Lett. 52 (1984) 1005.<br />
[4] ALIKAEV, V.V., et al., "Effect of p <strong>and</strong> j profiles on energy confinement in ECH experiments<br />
on T-10", Plasma Physics <strong>and</strong> Controlled <strong>Nuclear</strong> Fusion Research 1986 (Proc. Uth Int. Conf.<br />
Kyoto, 1986), Vol. 1, <strong>IAEA</strong>, Vienna (1987) 111-123.<br />
[5] TOI, K., et al., Phys. Rev. Lett. 52 (1982) 2144.<br />
[6] PARAIL, V.V., PEREVERZEV, G.V., VOJTSEKHOVICH, I.A., "Ionization <strong>and</strong> current<br />
drive dynamics with ECR <strong>and</strong> lower hybrid waves in a tokamak", Plasma Physics <strong>and</strong> Controlled<br />
<strong>Nuclear</strong> Fusion Research 1984 (Proc. 10th Int. Conf. London, 1984), Vol. 1, <strong>IAEA</strong>, Vienna<br />
(1985) 605-614.<br />
[7] PEREVERZEV, G.V., ZAKHAROV, L.E., Fiz. Plazmy 14 (1988) 214.<br />
[8] KADOMTSEV, B.B., Collective Phenomena in a Plasma, Nauka, Moscow (1976) (in Russian).<br />
[9] VOYTSEKHOVICH, I.A., PARAIL, V.V., PEREVERZEV, G.V., Pis'ma J. Ehksp. Teor. Fiz.<br />
46(1987)20.<br />
[10] TAKASE, Y., KNOWLTON, S., PORKOLAB, M,, Phys. Fluids 30 (1986) 1169.
ACCESS TO SECOND STABILITY<br />
VIA PROFILE CONTROL<br />
WITH RF CURRENT DRIVE<br />
<strong>IAEA</strong>-CN-50/E-IV-8<br />
M. PORKOLAB, P.T. BONOLI, K.I. CHEN, S. CODA, M. GAUDREAU,<br />
M. GERVER, J. KESNER, R. KIRKWOOD, B. LANE, S. LUCKHARDT,<br />
R.S. POST, J. RAMOS, J. SQUIRE<br />
Plasma Fusion Center,<br />
Massachusetts Institute of Technology,<br />
Cambridge, Massachusetts,<br />
United States of America<br />
Abstract<br />
ACCESS TO SECOND STABILITY VIA PROFILE CONTROL WITH RF CURRENT DRIVE.<br />
The authors had predicted that raising q on axis, q0 = q(0), to values of 1.7 or above in Dshaped<br />
tokamaks would provide a path into the high beta (second stability) operating regime which is<br />
stable to all MHD modes at all beta, except kink modes (which can be wall stabilized). It is shown in<br />
the paper that entrance into the high beta operating regime along a stable path favours low aspect ratio.<br />
In obtaining a stable path, shaping <strong>and</strong> profile control requirements are inversely related. More triangularity<br />
permits less elevation of q0. The theoretical feasibility of using lower hybrid RF current drive<br />
to provide the required q(r) profile for the second stability regime is shown. A modest tokamak facility,<br />
called Versator-Upgrade, is described in which the second stability regime could be achieved by using<br />
lower hybrid current drive (LHCD). In addition, experimental results are presented from the Versator II<br />
tokamak which demonstrate that high values of e/3p (=1) can be achieved by using LHCD techniques.<br />
In the latter experiments, the high values of /3p originate from the presence of high energy current carrying<br />
electrons.<br />
1. MHD STUDY OF ACCESS TO THE SECOND STABILITY REGIME<br />
The calculations were performed by using the PPPL fixed boundary equilibrium<br />
<strong>and</strong> stability package (PEST). We define q"", the critical q0 for transition into<br />
second stability, as the minimum q0 that permits a sequence of stable equilibria up<br />
to high beta. Typical parameters for a device that exhibits a stable transition into the<br />
high beta regime are A = 3, q0 ^ 1.7, qa = 8, K = 1.4, 5 S 0.5, with A being<br />
the aspect ratio, q0 the on-axis safety factor, qa the plasma edge safety factor, K the<br />
plasma ellipticity, <strong>and</strong> 6 the triangularity. We have examined in more detail the aspect<br />
ratio dependence of the transition to second stability. At higher aspect ratio both the<br />
effectiveness of raising q0 <strong>and</strong> the geometric local shear depression [1,2] are<br />
reduced, q^" rises at high aspect ratio, placing more stringent requirements on current<br />
profile control <strong>and</strong> reducing the global shear. This dependence is shown in<br />
Fig. 1. For example, at A = 9, qa = 8, 5 = 0.3, we find qo r " = 5.3, whereas for<br />
747
748 PORKOLAB et al.<br />
ASPECT RATIO<br />
FIG. 1. Requirements on q0 as a Junction of aspect ratio for a stable transition to second stability with<br />
qa = 8 <strong>and</strong> K = 1.4. Boundaries are shown for 5 = 0.3 <strong>and</strong> 0.5, respectively.<br />
A = 3, qa = 8, 5 =. 0.3, we find qo rit = 2. Thus entrance into second stability for<br />
higher aspect ratio tori requires stronger shaping <strong>and</strong> profile control <strong>and</strong> results in<br />
reduced global shear. Triangular shaping is always favourable as seen by the reduction<br />
of the required q0 value indicated in Fig. 1. A triangularity of 0.5 is achievable<br />
with a simple coil set <strong>and</strong> forms the base case for the Versator-Upgrade experiment.<br />
Modest ellipticity also reduces q"' 1 up to about K ~ 1.8.<br />
2. VERSATOR-UPGRADE AND CURRENT PROFILE CONTROL<br />
WITH LHRF CURRENT DRIVE<br />
To test the predictions of the foregoing MHD theory, we plan to build a modest<br />
tokamak facility at MIT, with the following parameters: RQ = 0.90 m,<br />
a = 0.30 m, 1
6<br />
5<br />
4<br />
w 3<br />
2<br />
1<br />
0<br />
<strong>IAEA</strong>-CN-50/E-IV-8 749<br />
—i—i 1—i 1 1 1i<br />
1 1 1 1 1—-i 1<br />
-<br />
-<br />
=—1—<br />
f OH<br />
i ' i i 1 i<br />
10 20<br />
r (cm)<br />
FIG. 2. Radial profiles of the safety factor. Curves labelled A <strong>and</strong> B refer, respectively, to Case A <strong>and</strong><br />
Case B in text. Curve labelled OH refers to the Ohmic plasma. Curves A <strong>and</strong> B are obtained at 0.5 s<br />
after the RF is turned on.<br />
(r = 0), the safety factor can be raised to q(r) s 2 over the entire plasma crosssection.<br />
The LHCD simulation code has been described previously [3]. The<br />
parameters used in these simulation studies were nl0 = 2x 10 19 m" 3 ,<br />
iieo/He = 1.5, B^(0) = 1.25 T, hydrogen gas, Zeff = 2.5, a = 0.3 m, Ro = 0.9 m,<br />
<strong>and</strong> Ip = 120 kA. The Ohmic heating (OH) transformer circuit was kept on during<br />
the RF pulse. In addition to the 2.45 GHz LHRF power, a central source of electron<br />
cyclotron resonance heating (ECRH) was used to raise Te0. The 35 GHz ECRH<br />
source was assumed to have a Gaussian profile with half-width XEC = 6 cm. The<br />
minimum parallel (along B) index of refraction (nlacc) required for LH wave accessibility<br />
is nlacc = 2.62 with cope/uce = 1.15. At n^ = 2 x 10 19 nr 3 , the slowingdown<br />
time of fast electrons is TS :£ 3.7 ms, which is considerably shorter than their<br />
characteristic radial diffusion time, TD ~ TE ^ 10 ms. Thus fast electrons generated<br />
off-axis by the LHRF would not be expected to diffuse spatially inward to the<br />
centre <strong>and</strong> hence profile control is feasible. The results of two model calculations<br />
(referred to hereafter as Case A <strong>and</strong> Case B) are shown in Fig. 2. The results for<br />
Case A were obtained by using PEC =150 kW, PLH = 170 kW, <strong>and</strong> the Brambilla<br />
RF power spectra shown in Fig. 3 for a relative waveguide phase of A
750 PORKOLAB et al.<br />
1.0<br />
_, 0.8<br />
1 0.6<br />
°. 0.4<br />
a.<br />
0.2<br />
0<br />
,TT/3<br />
TT/2<br />
2TT-/3<br />
7 8 9 10<br />
FIG. 3. RFpower spectra for an eight waveguide array at 2.45 GHz for relative waveguide phasings<br />
of ir/3, IT/2, 2ir/3. Waveguide dimensions were 0. 7 cm guide width <strong>and</strong> 0.1 cm wall thickness.<br />
peak RF current generation at a radial location (rG = 14 cm) farther from the<br />
plasma centre relative to Case A (rG = 8 cm). The total RF current in Case A is<br />
74 kA, <strong>and</strong> in Case B it is 90 kA. The total plasma current (Ohmic <strong>and</strong> RF driven)<br />
remained constant at Ip == 120 kA. The current drive figure of merit for these<br />
cases is VcD = ne (10 20 nr 3 ) IRF (kA) Ro (m)/PLH (kW) * 0.05 A-W" 1 -m" 2 . As<br />
is shown in Fig. 2, the central value of q0 is 1.7 for Case A <strong>and</strong> 2.35 for Case B.<br />
Also, q(r) ^ 2 for 0 S r s a in Case B, which is the desired type of q(r) profile<br />
necessary to produce the equilibria discussed in the previous section. The electron<br />
distribution functions in these cases extended from a lower energy of 5 to 7 keV to<br />
an upper limit of 40 to 50 keV. It is seen that the desired q-profile can be achieved<br />
by either changing the characteristic nn of the injected RF power or by changing the<br />
LH wave accessibility. Code modelling with a D-shaped equilibrium is in progress<br />
now, indicating results essentially similar to the above.<br />
3. VERSATOR II RESULTS<br />
In this section, we report results in which high poloidal beta equilibria were<br />
obtained in the Versator II tokamak (RQ = 0.4 m, a = 0.13 m, <strong>and</strong><br />
e = a/Ro = 0.32) from an energetic electron population with anisotropic plasma<br />
pressure (P« > Px). In these experiments, RF current drive at both f0 = 800 MHz<br />
<strong>and</strong> 2.45 GHz was initiated during the current decay phase which followed the<br />
opening of the Ohmic heating transformer circuit. At the same time, a high /3p<br />
energetic electron population was created <strong>and</strong> maintained by the RF. Equilibrium<br />
measurements of/?* (= /3 + 4/2) showed that 0* could be increased from an initial<br />
value of 1.6 to a value of 5.1. To obtain /?p from 0*, the value of J*/2 is needed.
<strong>IAEA</strong>-CN-50/E-IV-8 751<br />
10 15 20<br />
RF CURRENT (kA)<br />
FIG. 4. RF driven equilibrium values of $p <strong>and</strong> theoretical curves versus RF current, IRF, <strong>and</strong> X-ray<br />
emission profile (inset). Triangles, solid curve: B^ = 0.9 T, f0 = 800 MHz, 1/2 = 1; circles, dashed<br />
curve: B4 = 0.7 T, f0 = 800 MHz, 1/2 = ]; diamonds, doited curve: B
752 PORKOLAB et al.<br />
X<br />
D<br />
E<br />
o<br />
Q_<br />
1.8<br />
1.4<br />
1.0<br />
0.6 0.<br />
•;-.••>>•• V •V •• A<br />
A A 3<br />
• • 4<br />
• T 5 -I<br />
• • 10<br />
2.0 4.0 6.0<br />
FIG. 5. Stability diagram for the Versator II experiment; (P'' IP'cri,)max > 1 for instability.<br />
nearly circular cross-section (K = 0.9-1.0), we find a stable path to second stability<br />
of qn > 8 (Fig. 5). For q0 = 4.4, the high n modes restabilize above e/3p ~ 1. If<br />
indeed q0 = 4.4 in Versator II, as inferred from the X-ray profiles, then the theoretical<br />
modelling suggests that Versator is near or beyond the critical e/3p needed for<br />
the second stability region. The effect of anisotropy was considered by using the<br />
PEST based Salberta code [4]. For Pn/Px ~ 7 <strong>and</strong> similarly peaked profiles, the<br />
stability boundaries appear to be insensitive to the anisotropy.<br />
ACKNOWLEDGEMENTS<br />
The work was supported by US Department of Energy Contract No.<br />
DE-AC02-78ET51013.<br />
REFERENCES<br />
[1] GERVER, M.J., KESNER, J., RAMOS, J.J., Phys. Fluids 31 (1988) 2674.<br />
[2] COPPI, B., CREW, B., RAMOS, J., Comments Plasma Phys. Controll. Fus. 6 (1981) 109.<br />
[3] BONOLI, P.T., PORKOLAB, M., TAKASE, Y., KNOWLTON, S.F., Nucl. Fusion 28 (1988)<br />
991.<br />
[4] SALBERTA, E., et al., Phys. Fluids 30 (1987) 2796.
<strong>IAEA</strong>-CN-50/E-IV-9<br />
ELECTRON CYCLOTRON WAVE HEATING STUDIES<br />
ON THE CT-6B TOKAMAK<br />
Yaoquan LUO, Hongying JIANG, Long WANG, Size YANG,<br />
Xiazhi QI, Zanliang LI, Wenshu WANG, Wenlai LI,<br />
Hua ZHAO, Fuzhuan TAN, Jihui TANG, Zexiang ZHANG<br />
Institute of Physics,<br />
Academy of <strong>Sciences</strong>,<br />
Beijing, China<br />
Abstract<br />
ELECTRON CYCLOTRON WAVE HEATING STUDIES ON THE CT-6B TOKAMAK.<br />
An electron cyclotron wave heating experiment at marked downshift of the resonance frequency<br />
has been performed ona small device, the CT-6B tokamak. The authors found that there are obvious<br />
heating effects within a very wide range of the central toroidal field values, even up to «ce/w = 2. It<br />
is suggested that anomalous absorption of microwave power due to non-linear wave conversion is a<br />
possible heating mechanism. Resonance absorption at the downshifted frequency due to a Doppler shift<br />
may play a certain role. The experimental results indicate that it is possible to heat existing large tokamaks<br />
which have a higher toroidal field of several teslas with a currently available gyrotron. In numerical<br />
computation, the authors use ray tracing to study the energy deposition of waves in the CT-6B<br />
tokamak plasma.<br />
1. INTRODUCTION<br />
In recent years, more <strong>and</strong> more attention has been paid to electron cyclotron<br />
wave heating at downshifted resonance frequency [1-4]. This is a new concept of<br />
electron cyclotron heating. Strong absorption of microwave power takes place if the<br />
condition wce/o> > 1 is fulfilled instead of satisfying the resonance condition<br />
wce/co « 1, i.e. there is no resonance surface in the vacuum chamber of the tokamak.<br />
This ECRH phenomenon is significant from the experimental point of view. It<br />
enables the existing large tokamaks to be heated up by currently available low frequency<br />
gyrotrons.<br />
The heating at downshifted frequency probably results from two kinds of<br />
absorption mechanism. The first mechanism is resonance absorption. Taking into<br />
account relativistic effects <strong>and</strong> the Doppler shift, when the electron density is high<br />
enough <strong>and</strong> the electron temperature is higher than 1 keV, we find that the number<br />
of electrons at the tail of the Maxwellian distribution which satisfy the resonance<br />
condition,<br />
is large enough for the microwave power to be absorbed by the energetic electrons.<br />
753
754 LUO et al.<br />
- o<br />
£<br />
3 §.<br />
II<br />
Ml<br />
" g<br />
"" £ "a<br />
S S<br />
^•§<br />
da
<strong>IAEA</strong>-CN-50/EIV-9 755<br />
The second mechanism is non-linear anomalous absorption. When the electric<br />
field of the wave is high enough, non-linear effects may occur. If there is a high density<br />
region at the centre of the tokamak in which o> < o)^, wave refraction will take<br />
place at the plasma centre, parametric plasma instabilities may be excited, the electromagnetic<br />
wave may decay into Langmuir <strong>and</strong> ion sonic waves <strong>and</strong> then be<br />
absorbed effectively be electrons <strong>and</strong> ions [1].<br />
2. EXPERIMENTAL ARRANGEMENT<br />
The experiment was carried out on the CT-6B tokamak, which is a<br />
small research device with an iron core transformer <strong>and</strong> without conducting<br />
shell. The main parameters are as follows: major radius R = 45 cm; plasma minor<br />
radius a = 12.5 cm; toroidal magnetic field B, = 5.8-13 kG; plasma current<br />
Ip = 20-30 kA; Ohmic heating power P0H = 70-100 kW; averaged electron<br />
temperature Te = 150-200 eV; line averaged electron density r^ = (1-2) X<br />
10 13 cm" 3 ; energy confinement time TE = 0.7-1 ms; <strong>and</strong> particle confinement time<br />
7P = 3-4 ms.<br />
A GY-25 gyrotron tube, which was produced by the Institute of Electronics,<br />
Chinese Academy of <strong>Sciences</strong>, is used as an RF source. The tube has a frequency<br />
of 20.1 GHz, the output power is larger than 80 kW, <strong>and</strong> the pulse length is 1-20 ms,<br />
to be adjusted continuously. The electric field of the gyrotron microwave is a circular<br />
H01 mode. The angle of the horn antenna is about 2.3°. The microwave is perpendicularly<br />
injected from the top of the CT-6B tokamak; it is injected from the high<br />
field side.<br />
In addition to the ordinary electromagnetic measurements, the plasma density<br />
is measured by an HCN far infrared laser interferometer; the electron cyclotron emissions<br />
at 18.2 GHz <strong>and</strong> 70 GHz are detected by two receivers, one for each emission;<br />
the soft X-rays from different chords of the plasma column are measured by a<br />
Au(Si) surface barrier detector array, the visible <strong>and</strong> ultraviolet radiations are<br />
detected by optical fibre <strong>and</strong> monochrometer systems, <strong>and</strong> the vacuum ultraviolet<br />
radiation is detected by a one-metre VUV spectrometer.<br />
3. EXPERIMENTAL RESULTS<br />
Our microwave source can generate two power pulses; the first pulse with a<br />
length of 3 ms is used for preionization. High power microwave preionization is very<br />
effective <strong>and</strong> can improve the performance of a tokamak discharge. The second<br />
pulse, with a length of 4 ms, is used to heat the plasma. The lengths <strong>and</strong> the interval<br />
of the two pulses can be adjusted continuously. The power injected is about 60 kW.<br />
For a plasma current of Ip = 18 kA, an electron temperature of about 190 eV,<br />
<strong>and</strong> coce/w » 1.3, we use a modulated heating pulse. Figure 1 is a set of typical
756 LUO et al.<br />
20<br />
10<br />
ATe (<br />
1<br />
m11<br />
1 1<br />
I 1-5<br />
FIG. 2. ATe/Te changes with uce/u.<br />
experimental oscillograms. The loop voltage, the plasma displacement, the radiation<br />
intensity of the soft X-rays, <strong>and</strong> the line radiation intensities of C 4647, Htt 6563,<br />
<strong>and</strong> O III 3760 are obviously all modulated by the modulated heating pulse. This<br />
indicates that the heating is efficient. From the drop of the loop voltage <strong>and</strong> the<br />
increase in the radiation intensity of the soft X-rays, we estimate that the increase in<br />
electron temperature is about 10-20%.<br />
In this case, we change the central toroidal field from 8 kG to 12 kG, but there<br />
is no obvious dhange in the heating effect (Fig. 2). This result suggests that the heating<br />
effect obviously does not depend on the magnetic field, i.e. non-linear absorption<br />
is perhaps the main heating mechanism.<br />
We have also developed a ray tracing code to study ECRH on the CT-6B<br />
tokamak. By injection from the weak field side, the absorption of the ordinary wave<br />
is computed. The energy deposition of a single wave path is about 4-13%.<br />
4. DISCUSSION<br />
Since the electron density of the CT-6B tokamak plasma is about (1-2) X<br />
10 13 cm" 3 <strong>and</strong> the microwave frequency is 20.1 GHz, the critical density for<br />
20.1 GHz is about 4 x 10 13 cm" 3 . Therefore, there is a cut-off region at the plasma<br />
centre. However, the soft X-ray signal of the central channel (SX-6# X-ray radiation<br />
detector) still shows a remarkable increase during the heating pulse, i.e. the central<br />
plasma region, where co < w^,, is heated effectively, too, <strong>and</strong> the heating effect<br />
obviously does not depend on the toroidal magnetic field. All this suggests that<br />
anomalous absorption due to parametric plasma instabilities is probably the main<br />
heating mechanism, in our case. The electromagnetic wave decays into Langmuir <strong>and</strong><br />
ion sonic waves, <strong>and</strong> the wave energy is effectively absorbed by the electrons <strong>and</strong><br />
ions.<br />
uJ
<strong>IAEA</strong>-CN-50/E-IV-9 757<br />
In our case, the wave vector K is not exactly perpendicular to the field B; the<br />
angle of the horn antenna is about 2.3°, so that KB ^ 0. CT-6B is a very small<br />
tokamak, the electron temperature is quite low, <strong>and</strong> the absorption coefficient of the<br />
single path is only about 5-10%. After multiple wave reflection Ky becomes,<br />
perhaps, large enough for a substantial number of electrons which are at the energetic<br />
tail of the Maxwellian distribution to be able to satisfy the resonance condition<br />
•yco = K|V| + ncoce. Therefore, the Doppler effect is one of the possible heating<br />
mechanisms.<br />
Since the electron temperature is quite low, we do not think that the relativistic<br />
effect could be a heating mechanism, in our case.<br />
5. CONCLUSIONS<br />
Electron cyclotron wave heating at downshifted resonance frequency is a new,<br />
attractive <strong>and</strong> promising ECRH method. Our experimental results show that electron<br />
cyclotron wave heating at downshifted resonance frequency is effective <strong>and</strong> suggest<br />
that it is possible to heat a fusion reactor tokamak by using a currently available gyrotron.<br />
This will significantly simplify the main technological difficulties of ECRH in<br />
a tokamak reactor.<br />
ACKNOWLEDGEMENT<br />
The authors would like to express their gratitude to the Association for Plasma<br />
Studies.<br />
REFERENCES<br />
[1] BATANOV, G.M., RABINOVICH, M.S., RUBENCHIK, A.M., Nucl. Fusion 24 (1984) 151.<br />
[2] PORKOLAB, M., COHEN, B.I., Nucl. Fusion 28 (1988) 239.<br />
[3] MAZZUCATO, E..FIDONE, I., GIRUZZI, G., KRIVENSKI, V., Nucl. Fusion 26 (1986) 3.<br />
[4] MAZZUCATO, E., EFTHIMION, P., FIDONE, I., Nucl. Fusion 25 (1985) 1681.
<strong>IAEA</strong>-CN-50/E-IV-10<br />
MICROWAVE HEATING AND CURRENT DRIVE<br />
IN TOKAMAKS<br />
B.I. COHEN, R.H. COHEN, G.D. KERBEL, B.G. LOGAN,<br />
Y. MATSUDA, M.G. McCOY, W.M. NEVINS, T.D. ROGNLIEN,<br />
G.R. SMITH<br />
Lawrence Livermore National Laboratory,<br />
University of California,<br />
Livermore, California<br />
R.W. HARVEY<br />
General Atomics,<br />
San Diego, California<br />
A.H. KRITZ<br />
Hunter College,<br />
City University of New York,<br />
New York, N.Y.<br />
P.T. BONOLI, M. PORKOLAB<br />
Massachusetts Institute of Technology,<br />
Cambridge, Massachusetts<br />
United States of America<br />
Abstract<br />
MICROWAVE HEATING AND CURRENT DRIVE IN TOKAMAKS.<br />
The use of powerful microwave sources provides unique opportunities for novel <strong>and</strong> efficient<br />
heating <strong>and</strong> current drive schemes in the electron cyclotron <strong>and</strong> lower hybrid ranges of frequencies. Free<br />
electron lasers <strong>and</strong> relativistic klystrons are new sources that have a number of technical advantages over<br />
conventional, lower intensity sources; their use can lead to improved current drive efficiencies <strong>and</strong><br />
better penetration into a reactor grade plasma in specific cases. The paper reports on modelling of<br />
absorption <strong>and</strong> current drive in intense pulse <strong>and</strong> quasi-linear regimes <strong>and</strong> on analysis of parametric<br />
instabilities <strong>and</strong> self-focusing.<br />
1. INTRODUCTION<br />
This theoretical study addresses the physics of intense microwaves in both the<br />
electron cyclotron <strong>and</strong> lower hybrid frequency ranges to heat <strong>and</strong> drive current in<br />
tokamak plasmas. Several concepts exploiting new high power microwave sources<br />
are described <strong>and</strong> analysed here. We first consider the application of free electron<br />
lasers (FELs) as envisioned in the Microwave Tokamak Experiment [1] at Livermore<br />
to electron cyclotron heating (ECH) <strong>and</strong> current drive (Section 2). In Section 3, ray<br />
tracing <strong>and</strong> Fokker-Planck studies of quasi-linear ECH are presented. The new<br />
759
760 COHEN et al.<br />
concept of using pulsed, high power lower hybrid waves to better penetrate a hot<br />
plasma is discussed in Section 4, <strong>and</strong> the importance of parametric instabilities is<br />
identified.<br />
2. INTENSE ECH WITH FREE ELECTRON LASERS<br />
The use of short pulse, high power free electron lasers as microwave sources<br />
affords a number of technological advantages, e.g., frequency tunability, quasioptical<br />
beam transport, windowless transmission, reduced possibility of dielectric<br />
breakdown, <strong>and</strong> opportunities for novel electron cyclotron heating <strong>and</strong> current drive<br />
schemes. MTX will provide the first tests of the application of a high power FEL<br />
to ECH in a tokamak [1].<br />
Because of the high power (P = 3-8 GW) delivered in short pulses (< 50 ns)<br />
in MTX, the wave electric field will be quite high (Eo ~ 500 kV-cm" 1 ). Consider<br />
electrons that satisfy the relativistic resonance condition<br />
co - mo/y - kpv, = 0 (1)<br />
where to is the wave frequency, t is the harmonic number, Qo is the electron cyclotron<br />
frequency using the rest mass, y = (1 — vf/c 2 — v 2 ±/c 2 )~" 2 , kt <strong>and</strong> vB are<br />
the components of the wavenumber <strong>and</strong> velocity parallel to the tokamak magnetic<br />
field B. These electrons can be trapped by coherent ordinary modes at the electron<br />
cyclotron frequency or extraordinary modes at the second or higher harmonic if the<br />
electron trapping frequency w, is high enough so that CO,T, > 1, where T, is the<br />
transit time of the electron across the microwave beam along the field line [2], <strong>and</strong><br />
if the transit time is much shorter than a collision time. Most of the electrons passing<br />
through the beam are expected to be trapped in MTX. When ic^ < 1, the resonant<br />
electrons interact quasi-linearly with the wave, <strong>and</strong> linear optical depths are expected.<br />
Analysis <strong>and</strong> numerical studies confirm that trapping reduces the opacity, <strong>and</strong> the<br />
reduction is more severe with increasing wave amplitude in the case that<br />
V]|k|| = 0 <strong>and</strong> V||B =0 [2]. However, toroidal effects <strong>and</strong> angular divergence of<br />
the microwave beam introduce parallel gradients in kj <strong>and</strong> B, which significantly<br />
improve the wave absorption [2]. By achieving a significant spread in Ni = knc/co,<br />
the parallel index of refraction, more electrons can be brought into resonance <strong>and</strong><br />
accelerated to higher energy ('rising buckets'; see below). The non-linear optical<br />
depth rNL can thus be improved <strong>and</strong> can even exceed the linear optical depth<br />
(Fig. 1). Both analytical <strong>and</strong> numerical calculations with a particle orbit code<br />
including parallel gradients have led to the determination of an opacity for the<br />
Compact Ignition Tokamak CIT (TNL > 5) <strong>and</strong> for the single pulse (3 GW,<br />
30-50 ns) experiments in MTX during 1989 (TNL ~ 1).<br />
Intense ECH can also drive a toroidal current if waves with a particular sign<br />
of kg are injected. Three new current drive schemes that exploit FEL technology are
n MCPAT<br />
_ Analysis<br />
<strong>IAEA</strong>-CN-50/E-IV-10 761<br />
0.0 0.1 0.2 0.3 0.4 0.5<br />
FIG. 1. Ratio of non-linear to linear optical depth as a function of AJV| = Ak,c/oi.<br />
described here. Beat wave current drive involves beating two intense microwave<br />
beams to resonantly excite a longitudinal wave, e.g. a Langmuir wave propagating<br />
along the magnetic field that L<strong>and</strong>au damps on the electrons. This scheme requires<br />
that the difference frequency of the two microwave beams match the electron plasma<br />
frequency where the current is to be excited <strong>and</strong> that the product of the two microwave<br />
beam powers exceed a threshold condition [3]. The Langmuir wave drives<br />
current with lower hybrid-like efficiencies, but the beat wave coupling reduces the<br />
overall efficiency because of wave action conservation <strong>and</strong> the Manley-Rowe<br />
relations. Beat wave current drive could be used to very carefully control the current<br />
profile. A second scheme, rising bucket current drive, takes advantage of a spread<br />
in N, seen by resonant electrons streaming along the field line to adiabatically<br />
accelerate trapped electrons from an initial resonance curve to a final resonance curve<br />
along heating characteristics, 7meC 2 = ^Br + const, where Br = rrieCw/e <strong>and</strong> ix is<br />
the relativistic magnetic moment. This scheme is optimized when the maximum N|<br />
approaches unity. The third current drive scheme is stochastic current drive due to<br />
overlap of cyclotron harmonic resonances [4]. This non-linear phenomenon occurs<br />
when the non-linear isl<strong>and</strong> or trapping width exceeds the separation between neighbouring<br />
isl<strong>and</strong>s. Numerical studies of the particle orbits indicate that the best<br />
operating conditions are obtained for extraordinary modes with w/fi0 = 1.8-1.9,<br />
<strong>and</strong> Eo/Bo > 0.1 is required to induce stochasticity <strong>and</strong> achieve good current drive<br />
efficiencies. Stochastic current drive requires the highest field strengths of the three<br />
schemes <strong>and</strong> is the most susceptible to competition from parametric instabilities [5]<br />
as a consequence. Table I lists the calculated current drive efficiencies, nIR/P for the<br />
various schemes applied to MTX, CIT <strong>and</strong> ITER plasmas. The efficiencies do not<br />
include the enhancement resulting from the collisional momentum transfer from the<br />
resonant electrons to the background electrons.
762 COHEN et al.<br />
TABLE I. REPRESENTATIVE CURRENT DRIVE EFFICIENCIES nIR/P<br />
Quasi-linear<br />
Beat waves<br />
Rising buckets<br />
Stochastic<br />
nIR/P (10 20 A-n<br />
MTX<br />
0.03-0.04<br />
0.03-0.05<br />
0.05-0.1<br />
0.1-0.2<br />
r 2 -w-')<br />
CIT<br />
0.1-0.15<br />
0.2<br />
0.2-0.4<br />
0.15-0.3<br />
ITER<br />
0.2-0.3<br />
0.2-0.4<br />
0.3-0.6<br />
0.2-0.4<br />
There are a variety of stimulated scattering <strong>and</strong> parametric decay instabilities<br />
that potentially could be deleterious to the application of FELs to ECH heating <strong>and</strong><br />
current drive [5]. The first experiments in MTX using ordinary modes will be most<br />
susceptible to stimulated Brillouin backscattering by electrostatic ion cyclotron<br />
modes [5] <strong>and</strong> non-linear self-focusing [6]. However, with &>/2TT = 140 GHz, a<br />
30 ns FEL pulse, <strong>and</strong> a deuterium plasma, Brillouin backscatter will be pulse length<br />
limited in the first experiments in MTX. In addition, the breakup of a coherent, large<br />
amplitude ordinary mode into forward scattered sideb<strong>and</strong>s destabilized by trapped<br />
electrons is insignificant for MTX parameters [7].<br />
The non-linear self-focusing of an intense microwave beam with a Gaussian<br />
profile has been studied in Ref. [6] <strong>and</strong> could be appreciable in MTX. We have<br />
extended that analysis to include a saturable exponential ponderomotive non-linearity<br />
that precludes focusing down to a singularity, the angular divergence of the incident<br />
microwave beam, <strong>and</strong> density <strong>and</strong> temperature gradients. Using a simplified,<br />
cylindrically symmetric paraxial theory [8], we find that the distance to focus with<br />
little angular divergence <strong>and</strong> a uniform slab profile for the plasma is in substantial<br />
agreement with the results of Ref. [6], but that the inclusion of angular divergence<br />
<strong>and</strong> gradients pushes the focus beyond the magnetic axis in MTX, where cyclotron<br />
resonance <strong>and</strong> strong absorption occur. The application of FELs to heating <strong>and</strong><br />
current drive in CIT <strong>and</strong> ITER need not suffer appreciable stimulated Brillouin<br />
scattering or self-focusing because the microwave beams can have lower power<br />
densities <strong>and</strong> larger angular divergence.<br />
Finally, there is the possible microinstability of the strongly perturbed electron<br />
velocity distributions. Particle orbit studies of intense, pulsed ECH indicate that<br />
significant population inversions can be produced, which can result in microinstability.<br />
Work in progress with a two-dimensional particle simulation code<br />
suggests that the strongly perturbed electron distribution diffuses in the presence of<br />
self-consistent electromagnetic <strong>and</strong> electrostatic fields.
<strong>IAEA</strong>-CN-50/E-IV-10 763<br />
3. QUASI-LINEAR ELECTRON CYCLOTRON CURRENT DRIVE<br />
Here, we assess the prospects for current drive with gyrotron or continuous<br />
wave FEL sources by means of quasi-linear diffusion theory. Optimization studies<br />
of current drive efficiency in a hot tokamak have been performed with the TORCH<br />
ray tracing code derived from TORAY [9]. We consider current drive near the<br />
magnetic axis of a tokamak with major <strong>and</strong> minor radii of R = 4.0 m <strong>and</strong><br />
a = 1.4 m, a non-circular equilibrium, <strong>and</strong> a toroidal j3 * 6%. The optimum launch<br />
scenario exploits the fact that absorption on the low field side of cyclotron resonance<br />
can limit the wave-particle interaction to electrons with a single sign of parallel<br />
velocity <strong>and</strong> with pitch angles far from the trapped particle region. The wave<br />
frequency is substantially upshifted (1.3 < u/Q0 < 1.5) from the central cyclotron<br />
frequency ti0, <strong>and</strong> large values of NB :£ 0.7 are used to selectively heat electrons<br />
with the highest possible energy. Use of the fundamental cyclotron interaction leads<br />
to much higher efficiency than the second harmonic because the second harmonic<br />
competes much less with the fundamental in absorbing the wave power than does the<br />
third harmonic with the second [10]. Even for the fundamental, we find that<br />
harmonic competition begins to limit current drive efficiency for a central electron<br />
temperature Te > 25 keV. Another limiting effect is finite opacity: rays are not<br />
absorbed by the highest energy resonant electrons encountered but by electrons with<br />
energies E ranging over Te < E < 3 Te. The results of optimizing rj = nlR/P<br />
(units of 10 20 Aj-m" 2 -W" 1 by variation of w <strong>and</strong> toroidal launch angle are r) = 0.16,<br />
0.22 <strong>and</strong> 0.24 at fe = 15, 25, <strong>and</strong> 35 keV, respectively, <strong>and</strong> central density<br />
n = 1.6 x 10 20 m" 3 . These values of rj are based on the current drive efficiency<br />
theory of Ref. [11] <strong>and</strong> do not include the effects discussed in the next three sections.<br />
Momentum conservation in collisions between resonant electrons <strong>and</strong> bulk electrons<br />
is an effect of order Te/E <strong>and</strong> was noted for both lower hybrid <strong>and</strong> electron<br />
cyclotron waves by Karney <strong>and</strong> Fisch [12]. Since the optimum 01 <strong>and</strong> N]: lead to<br />
absorption by electrons in a range near Te/E = 2, we estimate, very roughly, an<br />
enhancement of 50% compared to the theory of Ref. [11] if momentum conservation<br />
is included.<br />
High microwave power can distort the electron distribution <strong>and</strong> significantly<br />
alter the current drive efficiency [11, 13]. On the high field side of cyclotron<br />
resonance (inside launch), efficiency degrades sharply with increasing power because<br />
of the competition between the Fisch-Boozer (anisotropic resistivity) <strong>and</strong> Ohkawa<br />
(anisotropic trapping, isotropic detrapping) effects <strong>and</strong> because of the existence of<br />
resonant electrons with both signs of parallel velocity. On the low field side (outside<br />
launch), the power dependence of the efficiency is determined by the relative<br />
importance of two competing processes. The formation of an extended quasi-linear<br />
plateau of high energy electrons tends to improve efficiency, while decreased opacity<br />
allows the RF power to 'burn through' towards the resonance layer where it is<br />
deposited on lower energy (more collisional) electrons.
764 COHEN et al.<br />
20<br />
ECH power P (MW)<br />
FIG. 2. Efficiency of quasi-linear electron cyclotron current drive as a function of the injected power<br />
for three values of Nt.<br />
We have used a relativistic version of the computer code CQL [14] on a radial<br />
array of flux surfaces to solve the bounce averaged Fokker-Planck quasi-linear<br />
equation for the electron distribution. The incoming RF power is damped at each<br />
radius consistent with the quasi-linear distortion of the distribution function, resolved<br />
locally in poloidal angle. For an inside launch with NB ~ 0.34, frequency equal to<br />
100 GHz, central temperature Te = 20 keV, density n,. = 1.0 X 10 20 mf 3 ,<br />
R = 1.8 m, a = 0.5 m, <strong>and</strong> BT = 5 T, we find that the global electron cyclotron<br />
current drive efficiency degrades to zero at RF power equal to 17 MW. For outside<br />
launch into the same plasma at various launch angles <strong>and</strong> at frequency 160 GHz, we<br />
obtain the results shown in Fig. 2. For these cases, there is some degradation of<br />
efficiency with increasing power at smaller N|, but we obtain an enhanced efficiency<br />
with increasing power at larger NN (near the optimum N| « 0.7 value<br />
discussed at the beginning of this section). The momentum conservation enhancement,<br />
not included in Fig. 2, is of the order of 25% for these results.<br />
4. INTENSE LOWER HYBRID HEATING AND CURRENT DRIVE<br />
It has been generally assumed that lower hybrid waves are unsuitable for use<br />
in the core of a reactor plasma because an accessibility requirement restricts the phase<br />
velocity to be low enough that electron L<strong>and</strong>au damping is severe. However, the<br />
absorbed power saturates as a function of applied power as the distribution function<br />
forms a plateau. The advent of intense, pulsed microwave sources in the 10 GHz<br />
range, such as the relativistic klystron [15], allows enhanced lower hybrid wave<br />
penetration in a reactor with high peak but moderate average power.<br />
40
<strong>IAEA</strong>-CN-50/E-IV-10 765<br />
In the limit where the plateau relaxes between successive (as seen by a given<br />
group of electrons) pulses, the peak power Pp required to penetrate a fixed distance<br />
is independent of the repetition rate <strong>and</strong> is that expended in forming the plateau from<br />
Maxwellian electrons streaming through the beam. For a narrow plateau of width Au<br />
in parallel velocity u, the penetration distance xp in a homogeneous plasma slab<br />
scales as Au" 3 . In the opposite limit, the average power required is independent of<br />
the repetition rate <strong>and</strong> is the same as for continuously applied power (i.e. that<br />
necessary to balance collisions); xp scales as (Au)" 1 . In general, for fixed average<br />
(peak) power <strong>and</strong> pulse length, xp is increased by decreasing (increasing) the<br />
repetition rate, with the preceding limits as asymptotes. The plateau width Au is<br />
determined by the spread in the N| spectrum <strong>and</strong> single pass acceleration (including<br />
non-linear orbit effects). Evaluating for representative ITER parameters (n20 = 0.6,<br />
Te = 25 keV <strong>and</strong> magnetic field B = 5.1 T), with N] at the accessibility limit <strong>and</strong><br />
Au set by single pass acceleration, we find Au/u = 0.13 <strong>and</strong> xp « 1.6 m for<br />
infrequent 10 GHz, Pp = 10 GW pulses compared to about 18 cm for linear<br />
L<strong>and</strong>au damping; the scaling with Pp is weak. In the frequent pulse limit, the same<br />
penetration is achieved with an average power of 210 MW.<br />
An important issue for intense lower hybrid waves is parametric instabilities.<br />
For the strong wave fields under consideration, NXE±/BO 1-2 GW-m" 2 . To keep Pp down to this level <strong>and</strong><br />
simultaneously penetrate into the core of the plasma, the spectrum must be kept<br />
narrow, ANy/Nj < 10%. The latter requirement is being explored with a ray<br />
tracing code.<br />
ACKNOWLEDGEMENTS<br />
This work was performed under the auspices of the US Department of Energy<br />
under Contract Numbers W-7405-ENG-48 at the Lawrence Livermore National<br />
Laboratory, DE-AC03-84ER53158 at General Atomics, DE-AC02-78ET51013 at<br />
Massachusetts Institute of Technology, <strong>and</strong> DE-FG02-84ER53187 at Hunter<br />
College, City University of New York,<br />
REFERENCES<br />
[1] THOMASSEN, K.I., Ed., Free-Electron-Laser Experiments in Alcator-C, US Government<br />
Printing Office, Washington, DC (1986).<br />
[2] NEVINS, W.M., ROGNLIEN, T.D., COHEN, B.I., Phys. Rev. Lett. 59 (1987) 60.
766 COHEN et al.<br />
[3] COHEN, B.I., et al., Nucl. Fusion 28 (1988) 1519.<br />
[4] MENYUK, C.R., DROBOT, A.T., PAPADOPOULOS, K., KARIMABADI, H., Phys. Rev.<br />
Lett. 58(1987)2071.<br />
[5] PORKOLAB, M., COHEN, B.I., Nucl. Fusion 28 (1988) 239.<br />
[6] CARDINALI, A., LONTANO, M., SERGEEV, A.M., in Controlled Fusion <strong>and</strong> Plasma<br />
Heating (Proc. 15th Eur. Conf. Dubrovnik, 1988), Vol. 12B, Part III (1988) 976.<br />
[7] COHEN, B.I., COHEN, R.H., Phys. Fluids 31 (1988) 3444.<br />
[8] MAX, C.E., Phys. Fluids 19 (1976) 74.<br />
[9] KRITZ, A.H., HSUAN, H., GOLDFINGER, R.C., BATCHELOR, D.B., in Heating in<br />
Toroidal Plasmas (Proc. 3rd Joint Varenna-Grenoble Int. Symp. Grenoble, 1982), Vol. 2, CEC,<br />
Brussels (1982) 707.<br />
[10] SMITH, G.R., COHEN, R.H., MAU, T.K., Phys. Fluids 30 (1987) 3633.<br />
[11] COHEN, R.H., Phys. Fluids 30 (1987) 2442 <strong>and</strong> erratum Phys. Fluids 31 (1988) 421.<br />
[12] KARNEY, C.F.F., FISCH, N.J., Phys. Fluids 28 (1985) 116.<br />
[13] HARVEY, R.W., McCOY, M.G., KERBEL, G.D., Phys. Rev. Lett. 62 (1989) 426.<br />
[14] KERBEL, G.D., McCOY, M.G., Phys. Fluids 28 (1985) 3629.<br />
[15] SESSLER, A.M., Phys. Today 41 (1988) 26.<br />
[16] PORKOLAB, M., Phys. Fluids 20 (1977) 2058.
<strong>IAEA</strong>-CN-50/E-IV-ll<br />
SECOND ELECTRON CYCLOTRON HARMONIC<br />
ABSORPTION AT DOWNSHIFTED FREQUENCIES<br />
S. PESIC<br />
Institute for Research in Physics,<br />
Boris Kidric Institute,<br />
Belgrade, Yugoslavia<br />
Abstract<br />
SECOND ELECTRON CYCLOTRON HARMONIC ABSORPTION AT DOWNSHIFTED<br />
FREQUENCIES.<br />
The absorption of electromagnetic waves with frequencies significantly lower than the<br />
second harmonic of the central electron cyclotron frequency is investigated. A weakly<br />
relativistic Maxwellian plasma with a non-drifting or current carrying superthermal tail is considered.<br />
It is shown that the presence of the tail improves substantially the wave absorption<br />
efficiency at downshifted frequencies. In the range of bulk electron temperatures T =<br />
1-4 keV, extraordinary waves with large frequency downshift can produce good power deposition<br />
profiles. Higher electron temperatures allow larger frequency downshifts as well as an<br />
effective optimization of the power deposition.<br />
1. INTRODUCTION<br />
Electron cyclotron (EC) absorption at downshifted frequencies offers the possibility<br />
of using the existing high power microwave sources for plasma heating in high<br />
magnetic field toroidal discharges [1-3]. It is of particular interest to investigate<br />
whether the wave absorption at frequencies significantly lower than the second harmonic<br />
of the central EC frequency is sufficiently effective to reduce the frequency<br />
requirements <strong>and</strong> consequently to simplify the technical problems concerning the<br />
development of high frequency <strong>and</strong> high power microwave sources. In this paper we<br />
investigate the propagation <strong>and</strong> absorption of both the extraordinary (X) <strong>and</strong> ordinary<br />
(O) modes at downshifted second electron cyclotron harmonic (SECH) frequencies<br />
in a weakly inhomogeneous plasma. Since the EC wave absorption rnay increase the<br />
population of superthermal electrons <strong>and</strong> form a high energy tail in the distribution<br />
of electron velocities parallel to the magnetic field, weakly relativistic distributions<br />
with a non-drifting or current carrying superthermal tail are considered.<br />
2. DISPERSION EQUATION<br />
We consider electromagnetic waves propagating in a weakly inhomogeneous<br />
hot plasma confined by a magnetic field B of constant direction. The equilibrium<br />
767
768<br />
electron velocity distribution is modelled by a two component distribution that comprises<br />
a non-drifting or current carrying small superthermal population added to an<br />
isotropic Maxwellian bulk. The superthermal deviation of the distribution from the<br />
Maxwellian bulk is determined completely by the fraction of electrons in the tail (17)<br />
<strong>and</strong> their thermal (vs) <strong>and</strong> drift (u) velocities. We assume that both the bulk (vt) <strong>and</strong><br />
tail thermal velocities are sufficiently low, i.e. fits = 2(c/vls) 2 > 1, to permit<br />
analysis of the wave-plasma interaction around the SECH in the framework of the<br />
weakly relativistic approximation. Starting from the general expression for the<br />
dielectric tensor <strong>and</strong> carrying out the corresponding momentum space integration<br />
within this approximation, we can express the tensor components in terms of the<br />
dielectric function Fq(n) [4]. In a non-drifting isotropic Maxwellian plasma this<br />
function reduces to the relativistic (Shkarofsky) plasma dispersion function [5]. The<br />
dielectric tensor components e,j are then exp<strong>and</strong>ed in powers of the electron Larmor<br />
radius retaining all terms up to the order /i,; 2 . Since we are considering the SECH<br />
wave-plasma interaction at downshifted frequencies, the complete contribution of the<br />
fundamental EC harmonic is included in e^.<br />
The dispersion equation governing electromagnetic waves in a plasma confined<br />
by a magnetic field whose direction is perpendicular to that of the density <strong>and</strong> temperature<br />
gradients is given elsewhere [4]. Here this equation is treated as an expression<br />
for the functional dependence of the complex perpendicular component of the wave<br />
refractive index N± upon the following parameters: Y = coc/co, X/Y 2 =<br />
(cdp/o)c) 2 , c/v,, c/vs, u/vs <strong>and</strong> Nj. The parallel component of the wave refractive<br />
index is assumed to be real <strong>and</strong> determined by the direction of the wave vector of<br />
the incident electromagnetic waves at the plasma-vacuum interface, Ny = cos 6,. In<br />
order to examine the wave propagation in the equatorial plane of toroidal discharges,<br />
the magnetic field variation is represented by B(x) = B(0)eV(l + (x/A)), where<br />
x = rcos 0/a, = 0 or 0 = ir, a is the plasma radius <strong>and</strong> A is the aspect ratio. The<br />
plasma equilibrium is represented by a parabolic electron density profile <strong>and</strong> a<br />
(1 - x 2 ) 3 ' 2 profile for the bulk <strong>and</strong> tail electron temperatures, <strong>and</strong> the drift velocity.<br />
3. EXTRAORDINARY MODE<br />
Before discussing the absorption properties of the X-mode at downshifted frequencies,<br />
we recall that the X-mode propagates in the plasma under the condition that<br />
the electron density is smaller than the right h<strong>and</strong> cut-off density, i.e.<br />
ajp(x)/co 2 < (1 - Nf)(l - «c(x)/w). So the largest allowable density decreases<br />
with increasing ratio of the central EC frequency <strong>and</strong> the wave frequency, COC(0)/OJ.<br />
From this, one can conclude that this scheme is ineffective in heating high density<br />
plasmas. However, as we shall see later, in the presence of the superthermal tail the<br />
wave-plasma interaction in the low frequency wing of the thermal profile is sufficiently<br />
strong to damp the X-mode completely, even when the cut-off is present in<br />
the low field side of the plasma column.
<strong>IAEA</strong>-CN-50/E-IV-ll 769<br />
FIG. ]. Real <strong>and</strong> imaginary parts of NlX versus x for o)c(0)/o> = 0.625, ui 2 p{0)lu>l(0) = 0.6,<br />
c/v,(0) = 16, c/vs(0) = 8, u = 0, dj = 70° <strong>and</strong> several values of-q.<br />
First we shall analyse the wave propagation <strong>and</strong> spatial damping in the case<br />
where the SECH resonance takes place in the outer half (low field side) of the plasma<br />
column. At such moderate frequency downshifts, the X-mode is still efficiently<br />
damped in spite of the reduced electron density <strong>and</strong> temperature values. This observation<br />
can be verified in Fig. 1, where we show the variation of the real <strong>and</strong> imaginary<br />
parts of the perpendicular wave refractive index of the X-mode with the dimensionless<br />
space co-ordinate x for wc(0)/w = 0.625, a) 2 (0)/«c 2 (0) = 0.6, c/v,(O) = 16,<br />
corresponding to a peak electron temperature T(0) = 1 keV, c/vs(0) = 8, u = 0,<br />
0, = 70° <strong>and</strong> several values of the fraction of electrons in the non-drifting superthermal<br />
tail, T). Note that the SECH resonance, w = 2«c, takes place at x = 0.75.<br />
In the absence of the superthermal tail the wave damping is strong. For 17 = 0, complete<br />
first pass absorption of the X-mode is achieved at koa = 2 x 10 3 (ko is the<br />
vacuum wavenumber). We see that the presence of the tail enhances the wave absorption<br />
at downshifted frequencies. As the fraction of electrons in the tail increases, the<br />
absorption profile enlarges <strong>and</strong> the non-thermal contribution to the absorption grows.<br />
This effect is very pronounced at higher electron temperatures. In Fig. 2 we show<br />
Re NlX <strong>and</strong> Im N±x versus x for c/vt(0) = 8 <strong>and</strong> c/vs(O) = 4. The other<br />
parameters are the same as in Fig. 1. The results presented indicate that at moderate<br />
bulk electron temperature (T = 1-4 keV) good power deposition profiles<br />
(P(a/2) > 0.5) can be obtained in small <strong>and</strong> medium size plasmas (koa ;£ 10 3 ). In
770 PESlC<br />
-02<br />
FIG. 2. Real <strong>and</strong> imaginary parts of N±x versus x for = 0.625, Up(0)/uf(0) = 0.6,<br />
c/v,(0) = 8, c/vJO) = 4, u = 0, 8j = 70° <strong>and</strong> several values of t\.<br />
the region of maximum power deposition the parallel component of the electron<br />
velocity lies in the low velocity part of the electron distribution function.<br />
In general, as the ratio of the central SECH frequency <strong>and</strong> the wave frequency<br />
increases, the relative contribution of the tail to the wave absorption grows. At large<br />
frequency shifts it prevails over the thermal (bulk) contribution. To illustrate the<br />
wave absorption in the case when the SECH resonance lies outside the plasma, we<br />
show in Fig. 3 Re Nxx <strong>and</strong> Im N±x versus x for WC(0)/OJ = 0.714,<br />
o>p 2 (0)/wc 2 (0) = 0.3, c/vt(0) = 8, c/vs(0) =4, u = 0, 0; = 60°, i\ = 0.05 <strong>and</strong><br />
TJ = 0.01. Here the spatial wave damping is negligible for rj = 0. The wave absorption<br />
depends mainly on the number of energetic electrons. As TJ grows the maximum<br />
value of Im N1X increases along with a broadening of the absorption profile. So, at<br />
koa = const the growth of 17 leads to an increase of the wave absorption <strong>and</strong> to a<br />
displacement of the region of maximum power deposition towards the plasma edge,<br />
i.e. towards smaller parallel electron velocities. It should be pointed out that in these<br />
conditions complete first pass absorption can be achieved only in large size plasmas<br />
(koa = O(10 4 )).<br />
For increasing the peak electron density at fixed values of Nj (<strong>and</strong> c/vs), the<br />
right h<strong>and</strong> cut-off moves towards the low field side of the plasma column <strong>and</strong><br />
ImNlX grows along with the decrease of the width of the absorption profile. In<br />
Fig. 4 we show the solution trajectory of the X-mode launched from the low field<br />
side for w 2 (0)/w|(0) = 0.6. The other parameters are the same as in Fig. 3. Note
-0.2<br />
<strong>IAEA</strong>-CN-50/E-IV-ll 771<br />
FIG. 3. Real <strong>and</strong> imaginary parts of N±x versus x for uc(0)/ta = 0.714, l(0)/ul(0) = 0.3,<br />
c/v,(0) = 8, c/v,(O) = 4, u = 0,6i = 60°, i\ = 0.05 <strong>and</strong> 0.01.<br />
NlX<br />
FIG. 4. Real <strong>and</strong> imaginary parts of N±x versus x for usc(0)/a = 0.714, o> 2 p(0)/u 2 c(0) = 0.6,<br />
c/v,(0) = 8, c/vJO) = 4, u = 0, 0, = 60°,ri = 0.05 <strong>and</strong> 0.01.
772 PESlC<br />
FIG. 5. Real <strong>and</strong> imaginary parts of NL0 versus x for uc(O)/u = 0.625, w 2 p{0)ta 2 c{0) = 0.6,<br />
c/v,(O) = 8, c/vs(O) = 4, u = 0, 0,- = 60° <strong>and</strong> several values of-q.<br />
that propagating in the direction of increasing magnetic field the X-mode reaches the<br />
right h<strong>and</strong> cut-off at x = 0.34. Here complete first pass absorption can be obtained<br />
at koa = 2 x 10 4 . It should be noted that in high density plasmas the absorption<br />
efficiency improves significantly with the increase of both the tail <strong>and</strong> bulk electron<br />
temperatures.<br />
The effect of the streaming electron motion on the absorption at downshifted<br />
frequencies depends strongly on u/vs <strong>and</strong> the sign of N|. For No > 0 <strong>and</strong> u < vs(0)<br />
it is relatively weak. However, for Nf < 0 the presence of a current carrying tail<br />
causes an increase of Im N±x along with a broadening of the absorption profile. It<br />
turns out that in these wave launching conditions the streaming electron motion<br />
enhances substantially the wave absorption at downshifted frequencies. For instance,<br />
for the parameters of Fig. 4 <strong>and</strong> at N[ = -0.5 <strong>and</strong> u/vs(0) = 1, the X-mode is<br />
absorbed completely in one pass through a plasma with koa = 3.5 x 10 3 . In this<br />
case the power deposition profile has a broad maximum which takes place at<br />
x = 0.7, i.e. at v,/c = 0.23.<br />
4. ORDINARY MODE<br />
In general, the spatial damping of the O-mode around the SECH is much weaker<br />
than the X-mode damping [4]. This conclusion can be further verified in Fig. 5,<br />
where we show the variation of the real <strong>and</strong> the imaginary part of the perpendicular<br />
wave refractive index of the O-mode with x for Bt = 60°. The other parameters are<br />
the same as in Fig. 2. We see that the presence of superthermal electrons slightly<br />
enlarges the thermal absorption profile. The normalized optical thickness of the Omode<br />
has a stronger temperature dependence than that of the X-mode [4]. This sug-
<strong>IAEA</strong>-CN-50/E-IV-ll 773<br />
gests that in very high temperature, large plasmas, complete first pass absorption at<br />
large frequency downshifts can be achieved.<br />
5. CONCLUSIONS<br />
We have investigated the propagation <strong>and</strong> absorption of electromagnetic waves<br />
in a weakly relativistic Maxwellian plasma in the presence of a non-drifting or current<br />
carrying superthermal tail, with the main objective of clarifying whether the frequency<br />
requirements of the SECH plasma heating can be reduced. The results<br />
obtained indicate that in the range of bulk electron temperatures T = 1-4 keV, ><br />
X-waves whose frequency is significantly lower than the central SECH frequency,<br />
w < 2coc(0)/(l + A" 1 ), produce good power deposition profiles in large plasmas.<br />
In small <strong>and</strong> medium size plasmas (koa < 10 3 ), moderate frequency downshifts of<br />
the X- or O-mode are more effective in heating the central plasma region. Both the<br />
non-drifting <strong>and</strong> current carrying (at Nf < 0) superthermal tails substantially<br />
improve the wave absorption efficiency at downshifted frequencies. Higher electron<br />
temperatures allow the use of waves with larger frequency downshifts in medium size<br />
plasmas as well as an effective optimization of the power deposition.<br />
REFERENCES<br />
[1] MAZZUCATO, E., FIDONE, I., GIRUZZI, G., KRIVENSKI, V., Electron cyclotron heating<br />
at down-shifted frequencies in existing tokamak devices, Nucl. Fusion 26 (1986) 3-9.<br />
[2] FIDONE, I., GIRUZZI, G., MAZZUCATO, E., Electron cyclotron heating of a tokamak reactor<br />
at downshifted frequencies, Phys. Fluids 28 5 (1985) 1224.<br />
[3] BORNATICI, M., RUFFINA, U., "Electron cyclotron absorption at downshifted frequencies in<br />
presence of a superthermal tail", Controlled Fusion <strong>and</strong> Plasma Physics (Proc. 14th Eur. Conf.<br />
Madrid, 1987), Vol. HD, Part II, European Physical Society (1987) 890.<br />
[4] PESIC, S., Wave-plasma interaction near the second electron cyclotron harmonic, Phys. Fluids<br />
31 1 (1988) 115.<br />
[5] SHKAROFSKY, I.P., Dielectric tensor in Vlasov plasmas near cyclotron harmonics, Phys.<br />
Fluids 9 3 (1966) 561.
CHAIRMEN OF SESSIONS<br />
Session A-I J. TACHON France<br />
Session A-II D.M. MEADE United States of America<br />
Session A-III B. COPPI United States of America<br />
Session A-IV K.M. McGUIRE United States of America<br />
Session A-V B.B. KADOMTSEV Union of Soviet Socialist Republics<br />
Session A-VI N. INOUE Japan<br />
Session E-I M. YOSHIKAWA Japan<br />
Session E-II Yuanxi WAN China<br />
Session E-III F. WAGNER Federal Republic of Germany<br />
SECRETARIAT OF THE CONFERENCE<br />
M. LEISER Scientific Secretary<br />
V. DEMCHENKO Scientific Secretary<br />
E. PILLER Conference Organizer<br />
J. WEIL Editor<br />
M. SPAK Editor<br />
775
HOW TO ORDER <strong>IAEA</strong> PUBLICATIONS<br />
An exclusive sales agent for <strong>IAEA</strong> publications, to whom all orders<br />
<strong>and</strong> inquiries should be addressed, has been appointed<br />
in the following country:<br />
UNITED STATES OF AMERICA UNIPUB, 4611-F Assembly Drive, Lanham, MD 20706-4391<br />
In the following countries <strong>IAEA</strong> publications may be purchased from the<br />
sales agents or booksellers listed or through<br />
major local booksellers. Payment can be made in local<br />
currency or with UNESCO coupons.<br />
ARGENTINA<br />
AUSTRALIA<br />
BELGIUM<br />
CHILE<br />
CHINA<br />
CZECHOSLOVAKIA<br />
FRANCE<br />
HUNGARY<br />
INDIA<br />
ISRAEL<br />
ITALY<br />
JAPAN<br />
PAKISTAN<br />
POLAND<br />
ROMANIA<br />
SOUTH AFRICA<br />
SPAIN<br />
SWEDEN<br />
UNITED KINGDOM<br />
USSR<br />
YUGOSLAVIA<br />
Comision Nacional de Energi'a Atomica, Avenida del Libertador 8250,<br />
RA-1429 Buenos Aires<br />
Hunter Publications, 58 A Gipps Street, Collingwood, Victoria 3066<br />
Service Courrier UNESCO, 202, Avenue du Roi,B-1060 Brussels<br />
Comisi6n Chilena de Energi'a <strong>Nuclear</strong>, Venta de Publicaciones,<br />
Amunategui 95, Casilla 188-D, Santiago<br />
<strong>IAEA</strong> Publications in Chinese:<br />
China <strong>Nuclear</strong> Energy Industry Corporation,Translation Section,<br />
P.O.Box 2103, Beijing<br />
<strong>IAEA</strong> Publications other than in Chinese:<br />
China National Publications Import & Export Corporation,<br />
Deutsche Abteilung, P.O. Box 88, Beijing<br />
S.N.T.L., Mikul<strong>and</strong>ska 4, CS-11686 Prague 1<br />
Alfa, Publishers, Hurbanovo namestie 3, CS-815 89 Bratislava<br />
Office International de Documentation et Librairie,48, rue Gay-Lussac,<br />
F-75240 Paris Cedex 05<br />
Kultura, Hungarian Foreign Trading Company,<br />
P.O. Box 149, H-1389 Budapest 62<br />
Oxford Book <strong>and</strong> Stationery Co., 17, Park Street, Calcutta-700 016<br />
Oxford Book <strong>and</strong> Stationery Co.,Scindia House, New Delhi-110001<br />
Heiliger & Co. Ltd.<br />
23 Keren Hayesod Street, Jerusalem 94188<br />
Libreria Scientifica, Dott. Lucio de Biasio "aeiou",<br />
Via Meravigli 16, 1-20123 Milan<br />
Maruzen Company, Ltd, P.O. Box 5050,100-31 Tokyo International<br />
Mirza Book Agency, 65, Shahrah Quaid-e-Azam, P.O. Box 729, Lahore 3<br />
Ars Polona-Ruch, Centrala H<strong>and</strong>lu Zagranicznego,<br />
Krakowskie Przedmiescie 7, PL-00-068 Warsaw<br />
llexim, P O. Box 136-137, Bucharest<br />
Van Schaik Bookstore (Pty) Ltd, P.O. Box 724, Pretoria 0001<br />
Diaz de Santos, Lagasca 95, E-28006 Madrid<br />
Diaz de Santos, Balmes 417, E-08022 Barcelona<br />
AB Fritzes Kungl. Hovbokh<strong>and</strong>el, Fredsgatan 2, P.O. Box 16356,<br />
S-10327 Stockholm<br />
Her Majesty's Stationery Office, Publications Centre, Agency Section,<br />
51 Nine Elms Lane, London SW8 5DR<br />
Mezhdunarodnaya Kniga,Smolenskaya-Sennaya 32-34, Moscow G-200<br />
Jugoslovenska Knjiga.Terazije 27,P.O. Box 36,YU-11001 Belgrade<br />
Orders from countries where sales agents have not yet been appointed <strong>and</strong><br />
requests for information should be addressed directly to:<br />
Division of Publications<br />
International Atomic Energy Agency<br />
Wagramerstrasse 5, P.O. Box 100, A-1400 Vienna, Austria
INTERNATIONAL<br />
ATOMIC ENERGY AGENCY<br />
VIENNA, 1989<br />
SUBJECT GROUP: III<br />
Physics/<br />
Plasma Physics, Fusion