Business development - Helvetia Gruppe
Business development - Helvetia Gruppe
Business development - Helvetia Gruppe

You also want an ePaper? Increase the reach of your titles
YUMPU automatically turns print PDFs into web optimized ePapers that Google loves.
17.5.2 Interest rate risk<br />
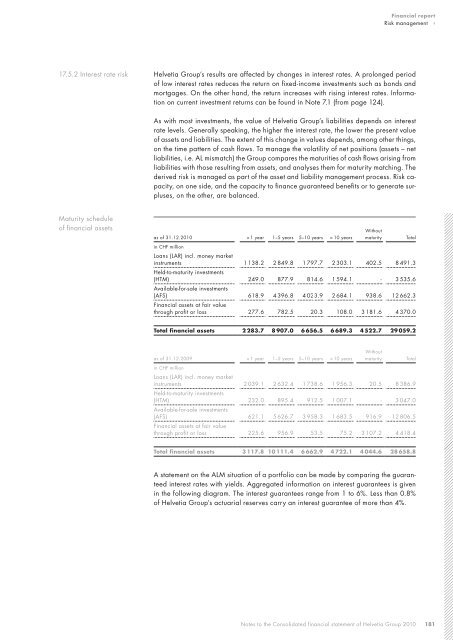
Maturity schedule<br />
of financial assets<br />
Financial report<br />
Risk management ‹<br />
<strong>Helvetia</strong> Group’s results are affected by changes in interest rates. A prolonged period<br />
of low interest rates reduces the return on fixed-income investments such as bonds and<br />
mortgages. On the other hand, the return increases with rising interest rates. Information<br />
on current investment returns can be found in Note 7.1 (from page 124).<br />
As with most investments, the value of <strong>Helvetia</strong> Group’s liabilities depends on interest<br />
rate levels. Generally speaking, the higher the interest rate, the lower the present value<br />
of assets and liabilities. The extent of this change in values depends, among other things,<br />
on the time pattern of cash flows. To manage the volatility of net positions (assets – net<br />
liabilities, i.e. AL mismatch) the Group compares the maturities of cash flows arising from<br />
liabilities with those resulting from assets, and analyses them for maturity matching. The<br />
derived risk is managed as part of the asset and liability management process. Risk capacity,<br />
on one side, and the capacity to finance guaranteed benefits or to generate surpluses,<br />
on the other, are balanced.<br />
as of 31.12.2010 < 1 year 1–5 years 5–10 years > 10 years<br />
Without<br />
maturity Total<br />
in CHF million<br />
Loans (LAR) incl. money market<br />
instruments<br />
Held-to-maturity investments<br />
1 138.2 2 849.8 1 797.7 2 303.1 402.5 8 491.3<br />
(HTM)<br />
Available-for-sale investments<br />
249.0 877.9 814.6 1 594.1 - 3 535.6<br />
(AFS)<br />
Financial assets at fair value<br />
618.9 4 396.8 4 023.9 2 684.1 938.6 12 662.3<br />
through profit or loss 277.6 782.5 20.3 108.0 3 181.6 4 370.0<br />
Total financial assets 2 283.7 8 907.0 6 656.5 6 689.3 4 522.7 29 059.2<br />
as of 31.12.2009 < 1 year 1–5 years 5–10 years > 10 years<br />
Without<br />
maturity Total<br />
in CHF million<br />
Loans (LAR) incl. money market<br />
instruments<br />
Held-to-maturity investments<br />
2 039.1 2 632.4 1 738.6 1 956.3 20.5 8 386.9<br />
(HTM)<br />
Available-for-sale investments<br />
232.0 895.4 912.5 1 007.1 - 3 047.0<br />
(AFS)<br />
Financial assets at fair value<br />
621.1 5 626.7 3 958.3 1 683.5 916.9 12 806.5<br />
through profit or loss 225.6 956.9 53.5 75.2 3 107.2 4 418.4<br />
Total financial assets 3 117.8 10 111.4 6 662.9 4 722.1 4 044.6 28 658.8<br />
A statement on the ALM situation of a portfolio can be made by comparing the guaranteed<br />
interest rates with yields. Aggregated information on interest guarantees is given<br />
in the following diagram. The interest guarantees range from 1 to 6%. Less than 0.8%<br />
of <strong>Helvetia</strong> Group’s actuarial reserves carry an interest guarantee of more than 4%.<br />
Notes to the Consolidated financial statement of <strong>Helvetia</strong> Group 2010<br />
181