- Page 1 and 2: Helvetia Group Annual Report 2010
- Page 3: Contents 4 Letter to Shareholders C
- Page 7 and 8: 2010 also saw the conclusion of the
- Page 10 and 11: Helvetia Group‘s ambition is to s
- Page 12 and 13: Company profile › Board of Direct
- Page 14 and 15: Company profile › Board of Direct
- Page 16 and 17: Company profile › Executive Manag
- Page 18 and 19: The Executive Management (from left
- Page 20 and 21: Company profile › Executive Manag
- Page 22 and 23: Company profile › Group strategy
- Page 24 and 25: Company profile › Group structure
- Page 26: Helvetia‘s success is driven by t
- Page 29 and 30: In individual life, the broad range
- Page 31 and 32: The risk management process and the
- Page 33 and 34: Investment management Helvetia purs
- Page 35 and 36: “We support your development” G
- Page 37: Social responsibility Part of Helve
- Page 40 and 41: Helvetia is committed to responsibl
- Page 42 and 43: Governance › Corporate governance
- Page 44 and 45: Governance › Corporate governance
- Page 46 and 47: Governance › Corporate governance
- Page 48 and 49: Governance › Corporate governance
- Page 50 and 51: Governance › Corporate governance
- Page 52 and 53: Governance › Corporate governance
- Page 54 and 55:
Governance › Compensation report
- Page 56 and 57:
Governance › Compensation report
- Page 58:
Helvetia makes life easy for broker
- Page 61 and 62:
Business development 60 Group resul
- Page 63 and 64:
which was fully consolidated for a
- Page 65 and 66:
Combined Ratio in % Gruppe Group Di
- Page 67 and 68:
Business units The business units o
- Page 69 and 70:
Life business shows dynamic growth
- Page 71 and 72:
field with a strong growth rate of
- Page 73 and 74:
Dynamic life insurance business Hel
- Page 75 and 76:
Assumed reinsurance The strong perf
- Page 78 and 79:
We communicate openly, comprehensib
- Page 80 and 81:
Investor information 78 Investor in
- Page 82 and 83:
Investor information In 2010 Helvet
- Page 85:
The opinion of every employee is im
- Page 88 and 89:
Financial report Consolidated incom
- Page 90 and 91:
Financial report Consolidated balan
- Page 92 and 93:
Financial report Consolidated state
- Page 94 and 95:
Financial report Consolidated Cash
- Page 96 and 97:
Financial report › General inform
- Page 98 and 99:
Financial report › Summary of sig
- Page 100 and 101:
Financial report › Summary of sig
- Page 102 and 103:
Financial report › Summary of sig
- Page 104 and 105:
Financial report › Summary of sig
- Page 106 and 107:
Financial report › Summary of sig
- Page 108 and 109:
Financial report › Summary of sig
- Page 110 and 111:
108 Notes to the Consolidated finan
- Page 112 and 113:
Financial report › Segment inform
- Page 114 and 115:
Financial report › Segment inform
- Page 116 and 117:
Financial report › Segment inform
- Page 118 and 119:
Financial report › Segment inform
- Page 120 and 121:
Financial report › Segment inform
- Page 122 and 123:
Financial report › Property and e
- Page 124 and 125:
Financial report › Goodwill and o
- Page 126 and 127:
Financial report › Investments 7.
- Page 128 and 129:
Financial report › Investments 7.
- Page 130 and 131:
Financial report › Investments 7.
- Page 132 and 133:
Financial report › Investments 7.
- Page 134 and 135:
Financial report › Investments 7.
- Page 136 and 137:
Financial report › Investments 7.
- Page 138 and 139:
Financial report › Financial liab
- Page 140 and 141:
Financial report › Financial liab
- Page 142 and 143:
Financial report › Insurance busi
- Page 144 and 145:
Financial report › Insurance busi
- Page 146 and 147:
Financial report › Insurance busi
- Page 148 and 149:
Financial report › Income taxes 1
- Page 150 and 151:
Financial report › Income taxes 1
- Page 152 and 153:
Financial report › Equity 11.2 Re
- Page 154 and 155:
Financial report › Equity 11.2.5
- Page 156 and 157:
Financial report › Equity 11.7 Ca
- Page 158 and 159:
Financial report › Provisions and
- Page 160 and 161:
Financial report › Employee benef
- Page 162 and 163:
Financial report › Employee benef
- Page 164 and 165:
Financial report › Share-based pa
- Page 166 and 167:
Financial report › Related party
- Page 168 and 169:
Financial report › Compensation p
- Page 170 and 171:
Financial report › Compensation p
- Page 172 and 173:
Financial report › Risk managemen
- Page 174 and 175:
Financial report › Risk managemen
- Page 176 and 177:
Financial report › Risk managemen
- Page 178 and 179:
Financial report › Risk managemen
- Page 180 and 181:
Financial report › Risk managemen
- Page 182 and 183:
Financial report › Risk managemen
- Page 184 and 185:
Financial report › Risk managemen
- Page 186 and 187:
Financial report › Risk managemen
- Page 188 and 189:
Financial report › Risk managemen
- Page 190 and 191:
Financial report › Risk managemen
- Page 192 and 193:
Financial report › Events after t
- Page 194 and 195:
Financial report › Scope of conso
- Page 196 and 197:
Financial report › Scope of conso
- Page 198:
Financial report › Report of the
- Page 202 and 203:
Financial report 200 Financial stat
- Page 204 and 205:
Financial report 202 6. Additional
- Page 206 and 207:
Financial report › Report of the
- Page 208 and 209:
Financial reportt › Kapiteltitel
- Page 211 and 212:
Embedded value 210 Embedded value
- Page 213 and 214:
in CHF million Embedded value after
- Page 215 and 216:
Service 214 Glossary 217 Important
- Page 217 and 218:
account of changes in proportional
- Page 219 and 220:
Important addresses Group Head Offi
- Page 221 and 222:
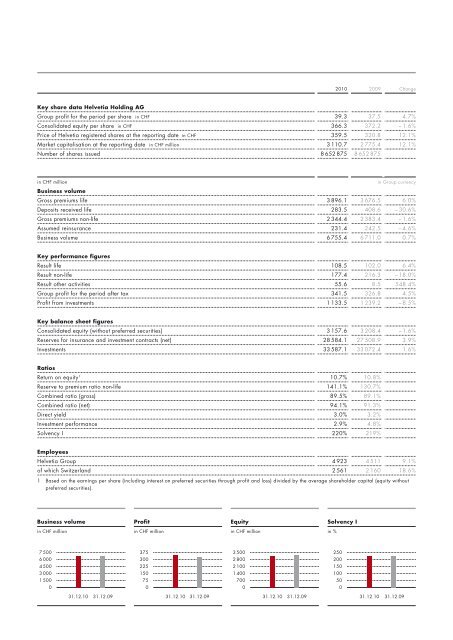
Multi-year overview Key share data
- Page 223 and 224:
Photo captions Cover photo Helvetia