sp_059
sp_059
sp_059

Create successful ePaper yourself
Turn your PDF publications into a flip-book with our unique Google optimized e-Paper software.
Geological Survey of Finland<br />
2016<br />
Developing Mining Camp Exploration<br />
Concepts and Technologies –<br />
Brownfield Exploration Project 2013–2016<br />
Edited by Soile Aatos<br />
Special Paper 59<br />
gtk.fi
Geological Survey of Finland, Special Paper 59<br />
Developing Mining Camp Exploration Concepts and<br />
Technologies – Brownfield Exploration Project 2013–2016<br />
Edited by<br />
Soile Aatos<br />
Geological Survey of Finland<br />
E<strong>sp</strong>oo 2016
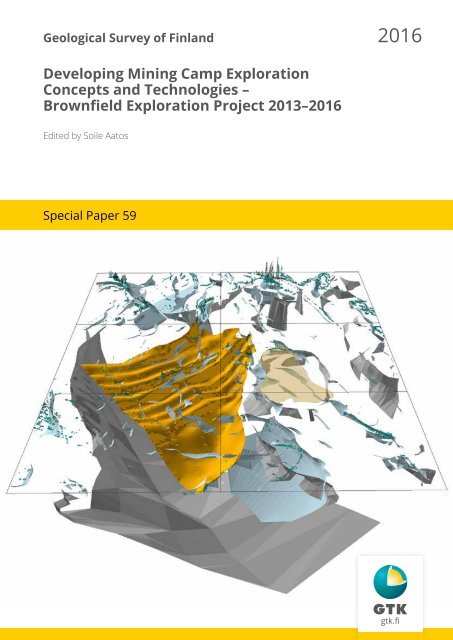
Front cover: A compilation of example background model data of the project<br />
visualized in 3D GIS. Image: Soile Aatos, GTK.<br />
Unless otherwise indicated, the figures have been prepared by the authors of the articles.<br />
ISBN 978-952-217-362-1 (pdf)<br />
ISBN 978-952-217-363-8 (paperback)<br />
ISSN 0782-8535<br />
Layout: Elvi Turtiainen Oy<br />
Printing house: Lönnberg Print & Promo
Aatos, S. (ed.) 2016. Developing Mining Camp Exploration Concepts<br />
and Technologies – Brownfield Exploration Project 2013–2016. Geological<br />
Survey of Finland, Special Paper 59, 214 pages, 141 figures, 16 tables.<br />
Deep exploration concepts and technologies in mining camps and other<br />
previously explored crystalline bedrock areas were developed in the<br />
project Developing Mining Camp Exploration Concepts and Technologies<br />
− Brownfield Exploration in 2013–2016. The project was funded by<br />
the Tekes Green Mining Programme and was conducted by the Geological<br />
Survey of Finland and the Seismological Institute of the University<br />
of Helsinki. The Outokumpu Cu-Co-Zn ore belt (Outokumpu Mining<br />
Camp) with its surroundings in Eastern Finland acted as the domain of<br />
study.<br />
Mining camps have usually been explored relatively thoroughly to<br />
depths of 200–300 m or more. The future challenge must be set at greater<br />
depths due to the exhausting resources of already exploited brownfield<br />
areas. This publication comprises nine papers demonstrating the<br />
development of the Outokumpu deep exploration concept, consisting of<br />
technologies and methods applicable for deep exploration data acquisition<br />
and interpretation of Outokumpu-type mineral deposits.<br />
The present technologies allowed the project to map the bedrock to<br />
depths of several kilometres using geophysical seismic reflection, audiomagnetotellurics<br />
and the airborne Z-axis tipper electromagnetic<br />
method, as well as potential field (gravity and magnetic) and electromagnetic<br />
methods. The aim of the project was to compile and further<br />
develop common earth models of the subsurface of the Outokumpu<br />
Mining Camp area based on its elastic, electric, density and magnetic<br />
properties. In a combination of coeval geophysical and geological<br />
modelling, the deep exploration concept of Outokumpu-type mineral<br />
deposits was improved by using an iterative multidisciplinary approach.<br />
The project developed an integrated assemblage of digital three-dimensional<br />
geo-referenced models and visualizations from a selected set of<br />
geophysical, geological and geochemical data and interpretations describing<br />
the bedrock geological features related to the Palaeoproterozoic<br />
Outokumpu nappe complex, embodying the deep mineral potential of<br />
Outokumpu ophiolites to the depth of 2 km, and in some cases to 5 km.<br />
Keywords: mineral exploration, deep-seated deposits, bedrock, geophysical<br />
methods, geology, geochemistry, interpretation, threedimensional<br />
models, integration, Palaeoproterozoic, Outokumpu<br />
Soile Aatos<br />
Geological Survey of Finland<br />
P.O. Box 1237<br />
FI-70211 Kuopio<br />
Finland<br />
E-mail: soile.aatos@gtk.fi
4
CONTENTS<br />
Editor’s preface .............................................................................................................................................................. 7<br />
Soile Aatos<br />
Introduction to the Developing Mining Camp Exploration Concepts and Technologies<br />
− Brownfield Exploration Project 2013–2016......................................................................................................... 11<br />
Soile Aatos<br />
Development of mining camp exploration and technologies for Outokumpu brownfield region................... 15<br />
Soile Aatos, Pekka J. Heikkinen and Ilmo Kukkonen<br />
Seismic ore exploration in the Outokumpu area, Eastern Finland: Constraints from seismic forward<br />
modelling and geometrical considerations.............................................................................................................. 31<br />
Kari Komminaho, Emilia Koivisto, Pekka J. Heikkinen, Hilkka Tuomi, Niina Junno and Ilmo Kukkonen<br />
ZTEM survey in the Outokumpu region................................................................................................................. 57<br />
Maija Kurimo, Ilkka Lahti and Maarit Nousiainen<br />
Petrophysical parameters and potential field modelling in the Outokumpu Belt.............................................. 67<br />
Hanna Leväniemi<br />
EM Sampo soundings in the Outokumpu region .................................................................................................. 97<br />
Maarit Nousiainen and Hanna Leväniemi<br />
Geophysical surveys of the Miihkali area, Eastern Finland ................................................................................ 113<br />
Ilkka Lahti, Hanna Leväniemi, Asko Kontinen, Peter Sorjonen-Ward, Soile Aatos and Esko Koistinen<br />
3D modelling of Outokumpu assemblage rocks – a geostatistical approach................................................... 139<br />
Eevaliisa Laine<br />
Sukkulansalo National Test Line in Outokumpu: A ground reference for deep exploration<br />
methods .................................................................................................................................................................... 163<br />
Suvi Heinonen, Asko Kontinen, Hanna Leväniemi, Ilkka Lahti, Niina Junno, Maija Kurimo and<br />
Emilia Koivisto<br />
Regional analysis of hydrothermal nickel pro<strong>sp</strong>ectivity in Outokumpu Mineral District ............................ 189<br />
Soile Aatos<br />
5
6
Developing Mining Camp Exploration Concepts and Technologies – Brownfield Exploration Project 2013–2016<br />
Edited by Soile Aatos<br />
Geological Survey of Finland, Special Paper 59, 7–10, 2016<br />
EDITOR’S PREFACE<br />
This Special Paper volume 59 compiles a set of articles reviewing<br />
and reporting the results of the Developing Mining Camp Exploration<br />
Concepts and Technologies − Brownfield Exploration Project<br />
(2013–2016). The project research was jointly conducted between the<br />
Geological Survey of Finland (GTK) and the University of Helsinki<br />
(UH), and coordinated by GTK. In this assemblage of nine papers, the<br />
project researchers review and introduce the concepts, methods and<br />
applications used or developed for deep exploration of Outokumputype<br />
mineral deposits. The project was established after identifying a<br />
common need of academia, sectoral research and industry to develop<br />
applicable deep exploration concepts and technologies for brownfields<br />
situated in crystalline bedrock areas, and to update the 3D understanding<br />
of the well-researched pro<strong>sp</strong>ective Outokumpu Mining<br />
Camp (OMC) area inside the Outokumpu Mineral District (OMD),<br />
North Karelia, Finland.<br />
The research consortium consisted of eighteen experts, twelve of<br />
whom were geophysicists, five geologists, and one mining engineer.<br />
Seven of the project geophysicists were seismologists by profession.<br />
In the nine articles of this volume, the authors describe the multidisciplinary<br />
developments in seismic reflection, audiomagnetotelluric<br />
(AMT), Z-axis tipper electromagnetic (ZTEM), electromagnetic<br />
(EM), petrophysical, potential fields (gravity, magnetic) and geological<br />
methods applicable for deep exploration of Outokumpu-type<br />
mineral systems.<br />
First, Aatos (this volume) introduces the reader to the general<br />
framework and settings of the project. The project combined the<br />
common interests of the participating research organizations and<br />
the industry sector in developing new and more feasible concepts for<br />
deep exploration of Outokumpu-type mineral systems in collaboration<br />
with international deep exploration research projects elsewhere<br />
as well. Deep exploration is very expensive and would benefit from<br />
nationally strategic, systematic approaches with long-term funding.<br />
In the first study paper, Aatos et al. (this volume) provide a general<br />
introduction to the project objectives and results and draw together<br />
the main accomplishments of the project, while the authors of the<br />
other eight articles of this volume (see below) report their case studies<br />
in a more detailed manner. The general concept of compiling and<br />
integrating suitable deep exploration data, selecting viable methods<br />
and applications that are being developed for Outokumpu-type<br />
deposits, encapsulates the Outokumpu deep exploration (OKUDEX)<br />
concept of this brownfield area. The concept integrates geophysical,<br />
geological and geochemical 3D interpretation, modelling and visualization<br />
methods being applied to selected study targets to identify and<br />
characterise the geophysical, geological and geochemical constraints<br />
7
Geological Survey of Finland, Special Paper 59<br />
Soile Aatos<br />
of future deep pro<strong>sp</strong>ecting in OMC-type areas. The concept is scalable<br />
and also applicable to greenfield regions having kindred mineral<br />
potential in crystalline bedrock areas with a relevant range of available<br />
data.<br />
The second article by Komminaho et al. (this volume) presents results<br />
from seismic forward modelling to gain better understanding<br />
of the seismic signature of the Outokumpu assemblage rocks and associated<br />
Outokumpu-type ores, as well as results from re-processing<br />
and analyses of seismic reflection data from the Outokumpu area.<br />
Their results, verified by geological data from the Outokumpu Deep<br />
Hole and the Kylylahti mine area, show that the reflectivity characteristics<br />
can be used to target potentially ore-bearing Outokumpu assemblage<br />
rocks at depth, and that the seismic reflection data provide<br />
a good basis for setting regional exploration targets in the Outokumpu<br />
area. Their results even suggest that in optimal circumstances it<br />
might be possible to directly detect high-amplitude seismic diffraction<br />
anomalies from the Outokumpu-type mineral deposits.<br />
The third paper by Kurimo et al. (this volume) introduces an overview<br />
of the parametrization, <strong>sp</strong>ecifications and 2D-3D inversion<br />
modelling results of the first systematic regional airborne helicopter<br />
ZTEM survey in Finland in 2013, with Geotech Airborne Ltd. as<br />
a contractor. The survey area covered the entire OMC research area<br />
to test the suitability of the data for deep exploration of conductive<br />
anomalies related to Outokumpu-type mineral deposits. The ZTEM<br />
survey method is suitable for systematic regional deep exploration in<br />
conductive environments resembling Outokumpu assemblage metallogeny.<br />
The most explicable results in geophysical interpretation<br />
of this novel test data were gained with a flight line <strong>sp</strong>acing of 500<br />
m to 1 km. Modelling in 3D inversion blocks favors over 2D inversion<br />
profiles in attaining the optimal dimensional coverage of the interpretation.<br />
The cri<strong>sp</strong>ness of depth interpretation of the ZTEM results<br />
is strongly affected by the camouflaging effects of multilayered conductive<br />
geometries.<br />
Leväniemi (this volume) presents in the fourth paper suitable potential<br />
field data forward and inversion modelling practices with deep<br />
exploration examples from the Outokumpu Belt, Miihkali massif and<br />
Kylylahti mining area. The scales of the shown modelling examples<br />
vary from regional to deposit scale and the modelling leans on and<br />
is constrained by petrophysics and geological interpretations. Petrophysical<br />
parameters described in this article were prepared by reprocessing,<br />
reclassifying and reanalysing the historical petrophysical<br />
data from drill-core samples. Potential field datasets of the region<br />
were complemented with new gravimetric profiles. A synthetic model<br />
example based on the constrained Kylylahti inversion model data<br />
shows that a deposit resembling Kylylahti by size and other properties<br />
would be detectable in gravity data from the depths of one kilometer<br />
or less. The paper also discusses the significant role of remanent<br />
magnetization in magnetic modelling in the OMC area.<br />
In the fifth article Nousiainen & Leväniemi (this volume) review<br />
the previous ground electromagnetic (EM) studies concentrating on<br />
Sampo Gefinex 400S (Sampo) method and data available from the<br />
OMC area, e<strong>sp</strong>ecially from Miihkali and Kylylahti subareas. In this<br />
project, new frequency domain EM field profiles were measured by<br />
8
Geological Survey of Finland, Special Paper 59<br />
Editor’s preface<br />
using Sampo method. The Sampo profiles crossed the known Outokumpu-type<br />
Perttilahti ore mineralization situating between 500-<br />
1000 m below ground surface to test the depth penetration of the<br />
method used. The data was interpreted with 1D inversion method,<br />
and the modelling results were compared to geological interpretations.<br />
The locating accuracy of the method is sensitive to dipping of<br />
examined structures and multiple layering of conductive structures,<br />
e.g. abundant blackschists in OMC area.<br />
In the sixth article, Lahti et al. (this volume) compiled, modelled<br />
and interpreted diverse systematically collected geophysical datasets<br />
varying from the regional to the target scale from geologically<br />
important profiles crossing the lesser-known Miihkali nappe to test<br />
the adequacy of the data and forward modelling and several inversion<br />
algorithms for deep exploration. The results of geophysical<br />
AMT, ZTEM, ground EM data interpretation and potential field modelling<br />
were applied iteratively with geological knowledge. The novel<br />
AMT measurements were stationed following the existing geophysical<br />
survey profiles where applicable, and also taking into account<br />
the bedrock geological objectives of the project, i.e. tracing the deep<br />
boundaries of the Outokumpu nappe complex in addition to tracking<br />
the Outokumpu-type mineralized zones within it. The study was<br />
able to open up more the dimensionalities of the Outokumpu nappe<br />
complex, Miihkali serpentinite massif and Saramäki mineral deposit<br />
with potential field modelling. Conductive structures on the western<br />
side (Saramäki) and inside the Miihkali nappe (Miihkali massif and<br />
Lipa<strong>sp</strong>uro-Kiskonjoki area) were revealed by 1D, 2D and 3D modelling<br />
of ground EM, AMT and ZTEM data, re<strong>sp</strong>ectively. The deep EM<br />
anomalies of the area are partly explained by the low, contrasting resistivities<br />
of Miihkali serpentinites and extremely conductive black<br />
schists. Some of the deep potential field and EM anomalies remain<br />
unverified due to the lack of geological verification.<br />
Laine introduces in the seventh paper (this volume) a workflow<br />
and the results of 3D structural geological modelling based on existing<br />
tectonic observations, metal grades in drill cores, interpreted geological<br />
profiles and 3D models from the sulphide deposits at Keretti,<br />
Vuonos and Sola in the middle parts of the OMC area. Lithological heterogeneity<br />
possibly predicting the related ore potential of the rather<br />
unusual and significantly sheared Outokumpu assemblage rocks was<br />
studied using various geostatistical simulation applications suitable<br />
for categorical variables to estimate the heterogeneity of metal concentrations<br />
and rock types of bedrock drill core data. The results indicate<br />
that the ore bodies are strongly elongated and discontinuous<br />
in structural character and that they are associated with shearing.<br />
However, the ore potential is not directly connected to shearing. The<br />
lithological heterogeneity correlates well with the reflective parts of<br />
the reflection seismic data. The resulting models visualized together<br />
with geophysical project data, e.g. ZTEM 3D inversions, may indicate<br />
undiscovered Outokumpu-type ore potential at depths below 500 m,<br />
beneath the reach of previous drill-core campaigns.<br />
In the eighth article, Heinonen et al. (this volume) conceptualize<br />
and demonstrate the idea of a regional, deep-reaching 2D test line<br />
integrating a composite selection of cross-sectional multi-parameter<br />
geophysical datasets with constraining geological interpretation<br />
9
Geological Survey of Finland, Special Paper 59<br />
Soile Aatos<br />
through the OMC area. The project has established the so-called<br />
Sukkulansalo National Test Line (SNTL), following the course of an<br />
existing high-resolution vibroseismic measurement profile (V7<br />
HIRE profile), with the most versatile and relevant deep geophysical<br />
measurements and interpreted data gathered before (low-altitude<br />
airborne magnetic, EM and radiometric data) or during (ZTEM, audiomagnetotellurics<br />
and gravimetry) this project. The profiled geological<br />
interpretation of bedrock and constraining geological models<br />
used in this work were based on bedrock field observations and drill<br />
core data. Seismic and gravity forward modelling results from the<br />
national test profile, combined with integrated interpretation of the<br />
available geophysical data from the profile of Heinonen et al. (this<br />
volume), propose the location of the basal contact of Outokumpu<br />
assemblage rocks against the Saarivaara thrust sheet package consisting<br />
of Karelian Supergroup quartzites intertwined with slices of<br />
basement upon Archaean basement gneisses. Synform structures<br />
and younger granites can be characterised based on integrated data<br />
as well. The sulphide mineralizations and black schists cause the<br />
main conductive anomalies in the SNTL area. The black schists are<br />
difficult to separate from mica gneisses in the area due to the lack of<br />
density contrast. The authors recommend in situ petrophysical studies<br />
in linking up geological observations with geophysics to improve<br />
geophysical modelling and interpretation.<br />
In the ninth and final article, Aatos (this volume) describes the<br />
preliminary results of the empirical scoping and conceptualization<br />
process for a regional GIS analysis of hydrothermal nickel pro<strong>sp</strong>ectivity<br />
in the OMD area. Airborne geophysical raster data provided<br />
a possibility to develop a pseudo-lithologically classified 2D earth<br />
model to be integrated into pro<strong>sp</strong>ectivity analysis. Some examples of<br />
the 2D GIS pro<strong>sp</strong>ectivity analysis of surface data are illustrated as a<br />
set of earth models and combined with 3D geological interpretations.<br />
The tectono-stratigraphic features possibly constraining the metallogeny<br />
related to the Outokumpu nappe complex are discussed based<br />
on the interpretation of integrated earth model results.<br />
I owe the most cordial thanks to all my co-workers in the project<br />
consortium for their endurance during this long writing process in<br />
an unpredictable and volatile operational environment. The idea of<br />
reporting the project results in the form of a Special Paper volume of<br />
GTK was suggested by H. Leväniemi. On behalf of the project groups<br />
from GTK and UH, and as the editor of this Special Paper volume, I<br />
express my heartfelt thanks to all our voluntary international and<br />
national referees and colleagues for sharing their precious time and<br />
expertise in reviewing the manuscripts, and for their constructive<br />
suggestions to improve the articles of the present volume. R. Siddall<br />
is thanked for checking the English language of the texts. P. Hölttä<br />
and P. Nurmi supervised and approved the scientific editing process<br />
of this compilation. The technical editor of this publication was<br />
P. Kuikka-Niemi.<br />
Kuopio, 21 September 2016<br />
Soile Aatos<br />
Editor of this Special Paper volume<br />
10
Developing Mining Camp Exploration Concepts and Technologies – Brownfield Exploration Project 2013–2016<br />
Edited by Soile Aatos<br />
Geological Survey of Finland, Special Paper 59, 11–14, 2016<br />
INTRODUCTION TO THE DEVELOPING MINING CAMP EXPLORATION<br />
CONCEPTS AND TECHNOLOGIES − BROWNFIELD EXPLORATION<br />
PROJECT 2013–2016<br />
Present and future pro<strong>sp</strong>ecting in long-operated<br />
exploration and mining areas, referred to as brownfield<br />
areas, demands more systematic, efficient and<br />
deeper-reaching mineral exploration means due to<br />
the exhausting shallow (from the Earth’s surface to<br />
depths of 0.5–1 km) mineral resources of these areas.<br />
Because the already explored and existing deposits<br />
are being more rapidly consumed, there is a<br />
need to go deeper, from 2 km to 5 km.<br />
The brownfield area of the Outokumpu Mining<br />
Camp (OMC) has encompassed continuous metal<br />
exploration and mining activities focused on Outokumpu-type<br />
mineral deposits since the Kivisalmi<br />
boulder was found while dredging a channel<br />
in Rääkkylä in 1908. This finding led to the emergence<br />
of the first mining and mineral beneficiation<br />
operations focused on Outokumpu-type sulphide<br />
copper ore, which was traced and discovered in<br />
1910 (Kuisma 1985). During the following decades,<br />
pro<strong>sp</strong>ecting for ore deposits in mineralized zones<br />
resembling the geological environment and the<br />
metallogeny of the original Outokumpu deposit in<br />
Outokumpu Ore Belt (or Outokumpu Belt) <strong>sp</strong>read<br />
to the surrounding regional entity, the Outokumpu<br />
Mineral District (OMD), now embodying<br />
several other Outokumpu-type deposits with active<br />
or ceased operations or known mineral potential.<br />
The ongoing operations in the OMD need<br />
temporal continuity and the securing of future<br />
sources of the raw materials to complement their<br />
decreasing resource base in the coming years.<br />
As a solution to meet the present and future<br />
needs of the exploration and mining industries<br />
operating in North Karelia, Finland, a research and<br />
development project was established: Developing<br />
Mining Camp Exploration Concepts and Technologies<br />
– Brownfield Exploration Project 2013–2016.<br />
This aimed at the integrated application or development<br />
of state-of-the-art deep exploration<br />
methods and concepts with common earth modelling<br />
(CEM) using the best available geophysical,<br />
geological and geochemical data to be reprocessed<br />
and compiled with new geophysical and geological<br />
datasets, and modelled and visualized as integrated<br />
3D interpretations covering the OMC area<br />
enclosed in the OMD.<br />
This multi-disciplinary and multi-scaled set<br />
of projects was funded by the Green Mining Programme<br />
of the Finnish Funding Agency for Innovation<br />
(Tekes), gathering and coordinating public<br />
and private funding to develop intelligent and<br />
minimum-impact mines and new mineral resources<br />
in Finland in 2011–2016. The project was carried out<br />
as a joint-funded partnership project by the Geological<br />
Survey of Finland (GTK) and the University<br />
of Helsinki (UH). The operating research units were<br />
the former Eastern Finland Office of GTK in Kuopio,<br />
acting as the coordinator of the joint project, and the<br />
Institute of Seismology (UH). The project was scheduled<br />
for 2013–2016 with a total budget of €883,000<br />
euros. Linked with this Tekes project, and to offer a<br />
new type of deep geophysical background dataset to<br />
be tested in the project, GTK acquired a subcontracted<br />
ZTEM flight operation from Geotech Airborne<br />
Ltd., Canada, including 2D-3D inversion modelling<br />
having a total cost of about €250,000 euros.<br />
Three international exploration and mining<br />
companies, FinnAust Mining Finland Oy, Boliden<br />
Kylylahti/Kylylahti Copper Oy (formerly Altona<br />
Mining Ltd/Kylylahti Copper Oy) and Mondo<br />
11
Geological Survey of Finland, Special Paper 59<br />
Soile Aatos<br />
Minerals B.V. Branch Finland, and a regional development<br />
company (Joensuun Seudun Kehittämiskeskus<br />
JOSEK Oy) operating in Eastern Finland<br />
funded the project, and also participated in<br />
the project steering group alongside the public<br />
funders, Tekes, GTK and UH. Additional experts<br />
were assigned to the steering group of the project<br />
from the Green Mining programme coordination,<br />
the University of Helsinki/Department of Physics<br />
and GTK. The industrial members also offered<br />
their expert knowledge, data and operating cases<br />
to act as research and excursion targets throughout<br />
the project collaboration.<br />
Administratively, the project consisted of two<br />
parallel sub-projects: one at GTK, coordinating<br />
the whole project, and the other at UH. Technically,<br />
the sub-projects were further divided into<br />
sub-tasks aimed at gathering and compiling data,<br />
and developing and producing methods, interpretations<br />
and models according to <strong>sp</strong>ecific methodological<br />
and/or geographical scopes. The GTK<br />
and UH sub-projects worked together, e<strong>sp</strong>ecially<br />
in the field of seismics and mutual modelling targets,<br />
but also shared some other common topics,<br />
such as international collaboration, meetings and<br />
publishing. International collaboration meetings<br />
and annual project seminars of the project took<br />
place in localities situated either in the premises<br />
of the project organizations or in the research<br />
area. In addition to the international project seminars,<br />
the industrial companies involved in the<br />
project were introduced to the project results in<br />
<strong>sp</strong>ecific data seminars.<br />
The Finnish Outokumpu deep exploration<br />
concept approach was benchmarked in discussions<br />
with ongoing or planned state-of-theart<br />
research projects developing deep exploration<br />
methods at the Geological Survey of Canada<br />
(GSC), the University of Uppsala in Sweden and<br />
IGME in Greece. The project also benefited from<br />
becoming familiar with some of the state-ofthe-art<br />
European geomodelling work through the<br />
future networking opportunities offered by the<br />
award-winning EU project ProMine. Compared to<br />
Finland, in the leading deep exploration countries<br />
of the world, Canada and Australia, deep exploration<br />
development projects of this kind have been<br />
programmed in the long term and sufficiently resourced<br />
with a systematic approach and control<br />
combined with high scientific ambitions. On the<br />
other hand, in recent years, some countries having<br />
deep mineral potential, for instance in Europe,<br />
have lacked the resources or social license<br />
to conduct deep pro<strong>sp</strong>ection. This may be due to<br />
the effects of international legislation, the national<br />
economic situation or the general lack of<br />
support of the local communities in exploration<br />
and mining districts (e.g. Greece, Nikolaos Laskaridis<br />
pers. comm. 2015). To further the development<br />
and optimize the costs, the demonstration<br />
and practicing of deep exploration applications in<br />
Finland, a national strategy implemented by an<br />
action plan with sufficiently multi-sourced and<br />
long-term resources linked to international progress<br />
and networks, is highly recommended.<br />
At GTK, this project was carried out in the context<br />
of the Mineral Potential Research Programme.<br />
During the project, our work was partly linked by<br />
mutual methodology (AMT) development to ongoing<br />
mineral systems, exploration and 3D modelling<br />
research at GTK, e.g. the project “Lapland mineral<br />
systems and exploration models” led by the former<br />
Northern Finland Office, and another Tekes<br />
Green Mining project entitled “Novel Technologies<br />
for Greenfield Exploration”. In collaboration<br />
with an in-house project of GTK, “Geologisen moniulotteisen<br />
mallinnuksen kehittäminen” (previously<br />
entitled “Numeerisen 3D-mallinnuksen<br />
kehittäminen”), dealing with the development of<br />
geological multi-dimensional modelling and led<br />
by the former Southern Finland Office, this project<br />
served as one of the cases in developing the structure<br />
of a general national database for 3D geomodels<br />
at GTK.<br />
When we started working together in early<br />
2013 with the steering group of the project and<br />
research colleagues in various research institutes<br />
and companies in Finland and abroad, exploration<br />
and mining industries were still fully<br />
enjoying the last warm days of resourceful bullish<br />
markets. Within a couple of years, everything<br />
had changed, and our organizations and businesses<br />
were struggling through a painfully sleepy<br />
global bear season, waiting for a turning point to<br />
come. Now, as faint positive economic indications<br />
may be lingering in the air, I hope that with<br />
our attempt to understand and explain some of<br />
the deeper features and mineral potential of the<br />
Outokumpu Mining Camp case as a whole, we<br />
could for our part enliven the present and future<br />
pro<strong>sp</strong>ects in North Karelia, and also revitalize expectations<br />
for tomorrow’s deep exploration and<br />
mining in other long-standing mining regions<br />
in hard rock environments elsewhere. As a sign<br />
of new times dawning, at least two science and<br />
technology projects were conceived during and<br />
12
Geological Survey of Finland, Special Paper 59<br />
Introduction to the Developing Mining Camp Exploration Concepts and Technologies − Brownfield Exploration Project 2013–2016<br />
in<strong>sp</strong>ired by this project, which aim to continue<br />
our work by developing computer simulation and<br />
passive seismic applications in the Outokumpu<br />
Mining Camp area.<br />
ACKNOWLEDGEMENTS<br />
In November 2012, when I unexpectedly inherited<br />
the management of this multidisciplinary project<br />
in its nascent form from Ilmo Kukkonen, who is<br />
nowadays Professor of Solid Earth Geophysics at<br />
the Department of Physics, University of Helsinki<br />
(UH), I did not yet fully realize how strategically<br />
important this subject and project would be to our<br />
business branches among industry and research,<br />
or how many new talented people and how much<br />
appreciation of their dedicated skills a simple decision<br />
to say “OK” would bring into my personal<br />
geo<strong>sp</strong>here. I will always be grateful for the openmindedness<br />
and managerial support of Ilmo, in<br />
addition to Pekka Nurmi, the accountable manager<br />
of the project Risto Pietilä, and Erkki Luukkonen<br />
at the Geological Survey of Finland (GTK)<br />
for giving me this unforgettable chance to live,<br />
learn and serve through new developments in<br />
the company of my highly talented and individual<br />
colleagues and teams at GTK, in the Institute of<br />
Seismology (UH), and elsewhere in the project<br />
networks. My grateful thanks go to Pekka J. Heikkinen,<br />
who most successfully managed the innovative<br />
seismological partner project team at the<br />
Institute of Seismology (UH) in the project consortium.<br />
Ilmo Kukkonen’s (UH) mentoring <strong>sp</strong>irit<br />
and scientific support for the project researchers<br />
throughout the project has been very much<br />
appreciated. Emilia Koivisto is acknowledged for<br />
her agile collaboration in educational sub-tasks<br />
included in the Institute of Seismology (UH) part<br />
of the project, producing two Master’s theses. I<br />
am most grateful to all the committed project researchers,<br />
students and co-workers at GTK and<br />
UH for putting their best foot forward to boost<br />
the common interest. Without their contribution,<br />
this project would not have come true. The supervisory<br />
navigation given to the project by Pekka<br />
Tuomela and Raimo Lahtinen as it drew to a close<br />
in 2016 is acknowledged.<br />
Our financiers, members and consulting experts<br />
of the project steering group, and the collaborating<br />
colleagues in companies are acknowledged. Urpo<br />
Kuronen (FinnAust Mining Oy), Chair of the Project<br />
Steering Group, is warmly thanked for his continuous<br />
support for the project management and interest<br />
in the project and its outcomes. The members<br />
of the Project Steering Group, Olli-Pekka Nordlund<br />
and Kari Keskinen (Tekes), Jarmo Vesanto<br />
(Boliden Kylylahti), Erkki Kuronen and Pasi Talvitie<br />
(Mondo Minerals B.V. Branch Finland), Ilkka<br />
Nykänen (JOSEK Oy), Pekka J. Heikkinen (UH),<br />
Risto Pietilä (GTK), and advising participants of the<br />
Project Steering Group, Harry Sandström (Tekes<br />
Green Mining coordination) and Ilmo Kukkonen<br />
(UH), are all thanked for their active and committed<br />
steering work, and for useful comments during<br />
each phase of the project where needed. The<br />
colleagues in exploration and mining companies<br />
supporting this project are heartily thanked for<br />
their collaboration in arranging the research data,<br />
research and excursion targets, and introductions<br />
to the mining operations situated in the research<br />
area, as well as their interest in the project seminars<br />
and outcomes.<br />
We are extremely thankful to our fellow research<br />
organizations, the Geological Survey of<br />
Canada (GSC), Uppsala University in Sweden and<br />
the Institute of Geology and Mineral Exploration<br />
(IGME) in Greece, for their fruitful benchmarking<br />
scientific collaboration in the project.<br />
David Snyder (GSC), Christopher Juhlin (UU) and<br />
Konstantinos Laskaridis (IGME) are acknowledged<br />
for their international networking support<br />
for the project management. Ernst Schetselaar<br />
had a major influence on our project work by<br />
showing us the leading achievements in mathematical<br />
CEM applied in deep exploration at the<br />
Geological Survey of Canada (GCS). María de los<br />
Angeles García Juanatey introduced us the geophysical<br />
3D CEM methods developed and used at<br />
UU. Nikolaos Arvanitidis is thanked for exchanging<br />
information in the early stages of the project<br />
about the geological 3D projects and procedures<br />
in process and the application of deep exploration<br />
methods in IGME Greece. Their collaboration<br />
and comments are highly appreciated. The<br />
ZTEM collaboration with Geotech Airborne Ltd.<br />
was not only crucial to this project but also enabled<br />
ground-breaking development of the Outokumpu<br />
deep exploration concept. The Geological<br />
Section of the Finnish Association of Mining and<br />
Metallurgical Engineers, Outokumpu Mining Museum<br />
and colleagues in the project companies and<br />
13
Geological Survey of Finland, Special Paper 59<br />
Soile Aatos<br />
GTK are thanked for arranging the international<br />
project seminar and workshop with excursions to<br />
the OMC area in North Karelia in 2014.<br />
Eija Verlander (GTK) and Liisa Ewart (Tekes) are<br />
heartily thanked for their rock-solid support in<br />
legal matters and contracting for the project. Irja<br />
Mykkänen and other personnel at GTK and UH are<br />
highly appreciated for their expert support in project<br />
administration and practicalities.<br />
Kuopio, 22 September 2016<br />
Soile Aatos<br />
Project manager<br />
REFERENCES<br />
Kuisma, M. 1985. Kuparikaivoksesta suuryhtiöksi. Outokumpu 1910−1985. Outokumpu Oy. Forssa: Forssan Kirjapaino<br />
Oy. 463 p. (in Finnish)<br />
14
Developing Mining Camp Exploration Concepts and Technologies – Brownfield Exploration Project 2013–2016<br />
Edited by Soile Aatos<br />
Geological Survey of Finland, Special Paper 59, 15–30, 2016<br />
DEVELOPMENT OF MINING CAMP EXPLORATION AND<br />
TECHNOLOGIES FOR THE OUTOKUMPU BROWNFIELD REGION<br />
by<br />
Soile Aatos 1) , Pekka J. Heikkinen 2) and Ilmo Kukkonen 3)<br />
Aatos, S., Heikkinen, P. J. & Kukkonen, I. 2016. Development of mining<br />
camp exploration and technologies for the Outokumpu brownfield region.<br />
Geological Survey of Finland, Special Paper 59, 15−30, 5 figures and 1 table.<br />
This article introduces the objectives and main achievements of the project<br />
Developing Mining Camp Exploration Concepts and Technologies –<br />
Brownfield Exploration (2013–2016), funded by the Tekes Green Mining<br />
programme and jointly conducted by the Geological Survey of Finland and<br />
the University of Helsinki. The project focused on developing deep exploration<br />
concepts and technologies for previously explored and exploited<br />
mining camps in crystalline bedrock areas. The Outokumpu Cu-Co-Zn-Ni-<br />
Ag-Au ore belt (Outokumpu Belt), situated in the Outokumpu brownfield<br />
region (Outokumpu Mining Camp area), North Karelia, Eastern Finland,<br />
and having an exploration and mining history extending back over a century,<br />
was chosen as the domain of the study.<br />
The project defined the Outokumpu Mining Camp (OMC) area, comprising<br />
the Outokumpu Belt, Miihkali Basin and Kylylahti mine area as the main<br />
research sub-areas, to demonstrate the development of the deep exploration<br />
concept by using state-of-the-art applications in deep geophysical<br />
data acquisition and modelling. The project surveyed the bedrock and<br />
ore potential of the OMC to the depth of 2 km, and to 5 km in cases, using<br />
seismic reflection data, audiomagnetotellurics, the airborne Z-axis tipper<br />
electromagnetic method, and electromagnetic and potential field methods<br />
(gravity and magnetic).<br />
The project compiled and further developed quantitative deep geophysical<br />
interpretations and common earth models of the subsurface of the<br />
OMC based on its petrophysical, elastic, electric, density and magnetic<br />
properties in concordance with interpretations of regional to target scale<br />
structural and bedrock geology in order to trace deep existing conductive,<br />
dense, reflective and magnetic zones implying anomalies related to Outokumpu<br />
assemblage rocks having mineral potential. By combining coeval<br />
geophysical and geological modelling, the deep exploration concept for<br />
Outokumpu-type mineral deposits was improved in an iterative multidisciplinary<br />
approach involving geophysics, structural and bedrock geology<br />
and geochemistry. The project produced digital geo-referenced, visually or<br />
computationally integrated earth models, in the form of surfaces, profiles<br />
and 3D objects.<br />
15
Geological Survey of Finland, Special Paper 59<br />
Soile Aatos, Pekka J. Heikkinen and Ilmo Kukkonen<br />
Keywords: mineral exploration, deep-seated deposits, bedrock, multidisciplinary<br />
research, concepts, methods, geophysics, geology, geochemistry,<br />
interpretation, three-dimensional models, integration, Palaeoproterozoic,<br />
Outokumpu, Finland<br />
1)<br />
Geological Survey of Finland, P.O. Box 1237, FI-70211 Kuopio, Finland<br />
2)<br />
University of Helsinki, Department of Geosciences and Geography, Institute of<br />
Seismology, P.O. Box 68, FI-00014 University of Helsinki, Finland<br />
3)<br />
University of Helsinki, Department of Physics, Division of Materials Physics,<br />
P.O. Box 64, FI-00014 University of Helsinki, Finland<br />
E-mail: soile.aatos@gtk.fi<br />
16
Geological Survey of Finland, Special Paper 59<br />
Development of mining camp exploration and technologies for the Outokumpu brownfield region<br />
INTRODUCTION<br />
In this paper, we introduce a common geophysical,<br />
geological and geochemical approach of the<br />
Geological Survey of Finland (GTK) and the University<br />
of Helsinki (UH) to develop the integration<br />
of deep exploration concepts and methods, digital<br />
conceptual or quantitative earth models and common<br />
earth modelling for locating or identifying<br />
the deep-seated ore potential of Paleoproterozoic<br />
Outokumpu-type serpentinite-derived formations<br />
(Outokumpu assemblage). The Outokumpu assemblage<br />
is disguised in or under packages of conductive<br />
layers of black schists included in Kalevian<br />
metasedimentary rocks rimming the western edge<br />
of the Archaean craton in North Karelia, Finland<br />
(Figs. 1 and 2). The deep exploration concept developed<br />
for Outokumpu-type deposits in this project<br />
is referred to as the Outokumpu deep exploration<br />
concept (OKUDEX concept).<br />
BACKGROUND<br />
There is a continuously increasing global need for<br />
metals. More efficient recycling is important, but<br />
the recycling rate of infrastructure metals is already<br />
close to the maximum in the EU. Thus, continuous<br />
exploration for and discoveries of base metals are<br />
required to feed the mining and metal industries<br />
with new resources. This requires the development<br />
of data- and model-based concepts of exploration<br />
in areas with resource potential.<br />
In modern society, all exploration activities have<br />
to take into account environmental, land-use and<br />
societal factors to a greater degree than before.<br />
Exploration in existing mining camps, known as<br />
brownfields, is one of the feasible alternatives for<br />
locating new resources. Brownfield exploration<br />
aims to grow or sustain the value of existing operations.<br />
The primary aim is to find or acquire new<br />
deposits within an economic tran<strong>sp</strong>ort distance<br />
of existing mines and processing facilities. Many<br />
mining camps that are considered to be geologically<br />
well known on the near surface level might<br />
actually hide undiscovered deposits not observed<br />
in previous exploration activities. In most cases,<br />
success requires going to depths previously only<br />
poorly covered by geophysical surveys and drilling.<br />
As mining camps have in most cases already<br />
been explored to depths of 200–300 m, or even<br />
deeper, using airborne and ground geophysics and<br />
drilling, the natural next step is to direct exploration<br />
activities exceeding this level. Going deeper<br />
at existing mining camps provides several advantages,<br />
such as the existing mining infrastructure,<br />
often extensive geological, for instance drill core,<br />
and geophysical databases, and in many cases easier<br />
societal acceptance of further exploration and<br />
mining than in areas with less or no previous exploration<br />
history (greenfields). Although the present<br />
mining industry does not yet routinely carry<br />
out exploration at such great depths, we anticipate<br />
that in the future there will be increasing interest<br />
in developing exploration and mining technologies<br />
for much greater depths than is common at<br />
present. One example of future deep mining is the<br />
giant Resolution Cu-Mo deposit in the USA, where<br />
an exploratory shaft has been constructed to over<br />
2000 m below the surface (Hehnke et al. 2012).<br />
Industrial exploration approaches to find metal<br />
ore potential at greater depths in Fennoscandian<br />
crystalline bedrock areas have already been developed<br />
and demonstrated for decades in greenfields<br />
by exploration and mining companies, such as by<br />
the Swedish company Boliden from at least the<br />
1970s and 1980s onwards (Juhani Nylander, Jarmo<br />
Vesanto pers. comm. 2015). The deep pro<strong>sp</strong>ecting<br />
field activities in companies have continued until<br />
today based on state-of-the-art geophysical applications,<br />
e.g. by acquiring helicopter-borne Z-<br />
axis tipper electromagnetic data in Finland (Kuronen<br />
2013) for a combined greenfield-brownfield<br />
approach.<br />
Current technological capabilities provide several<br />
geophysical deep exploration methods to<br />
survey the uppermost crust in detail, such as reflection<br />
seismic surveys, active transient time domain<br />
methods (both ground and airborne), magnetotelluric<br />
soundings and classical potential field<br />
(magnetic and gravity) modelling. However, deep<br />
exploration of existing mining camps calls for<br />
well-integrated geophysical and geological modelling<br />
and interpretation of the conductive, dense<br />
and reflective structures. There are challenges related<br />
to both the resolution and depth extent of the<br />
applied methods, as well as geological modelling of<br />
the detected anomalous features.<br />
During the last decade, GTK and the University<br />
of Helsinki, Institute of Seismology (UH), have<br />
17
Geological Survey of Finland, Special Paper 59<br />
Soile Aatos, Pekka J. Heikkinen and Ilmo Kukkonen<br />
Fig. 1. Location of the Outokumpu Mining Camp (OMC) area outlined in black inside the Outokumpu Mineral<br />
District (larger black rectangle) in Eastern Finland, plotted on the generalized bedrock map of Finland (scale of<br />
source material 1:10 000 000). Data from the digital archives of GTK.<br />
18
Geological Survey of Finland, Special Paper 59<br />
Development of mining camp exploration and technologies for the Outokumpu brownfield region<br />
been developing their knowledge base for deep<br />
exploration methods and Precambrian bedrock<br />
research with deep geophysical data acquisition,<br />
applications and tools (e.g. Kukkonen et al. 2006,<br />
Airo et al. 2011, Jokinen et al. 2011, Heinonen et al.<br />
2011, Korpisalo 2011, Kukkonen 2011, Kukkonen et<br />
al. 2011, Kukkonen et al. 2012, Heinonen 2013, Airo<br />
et al. 2014, Niiranen & al. 2014, Airo 2015, Karinen<br />
et al. 2015, Koivisto et al. 2015, Lahti 2015, Laine et<br />
al. 2015, Korpisalo 2016).<br />
At the same time, globally, 3D geological modelling<br />
has taken revolutionary steps towards regional<br />
interpretations and more quantitative<br />
common earth modelling (CEM) in solid bedrock<br />
geology, besides the oil industry applications (e.g.<br />
McGaughey 2006, Sprague et al. 2006, Martin et al.<br />
2007, Bellefleur et al. 2015, Schetselaar et al. 2016).<br />
The study area has been covered by systematic<br />
low-altitude geophysical surveys (by GTK),<br />
82 line-km of high-resolution seismic reflection<br />
surveys (FIRE and HIRE projects, Kukkonen et al.<br />
2012), over 900 drill cores (mostly acquired by Outokumpu<br />
Company), and ground gravity surveys.<br />
In addition, before the present project, GTK had<br />
measured test lines of audiomagnetotelluric (AMT)<br />
soundings in 2012, showing the potential of the<br />
method to test seismic reflectors for their conductivity<br />
(Lahti et al. unpublished, Lahti et al. 2015).<br />
Furthermore, GTK acquired a novel ZTEM airborne<br />
survey of the study area in 2013, which provided a<br />
systematic survey of resistivity to a depth of about<br />
1–2 km (Kurimo et al. 2016). The existing drill core<br />
and petrophysical data compiled by the GEOMEX<br />
joint venture project in 1999–2003 (Kuronen et al.<br />
2004) was an important asset for detailed analysis<br />
of potential field data. All the existing public datasets<br />
were available for the present project.<br />
As a continuation to all these multi-domain advances<br />
in data, concepts and technologies, Finnish<br />
research organizations and international companies<br />
operating in North Karelia, Eastern Finland,<br />
identified an opportunity to join the progress,<br />
partly due to the exhaustion of more easily detectable<br />
shallow depth metal resources in the Outokumpu<br />
Mining Camp (OMC, Fig. 1) area (Kuronen<br />
et al. 2005, Kontinen et al. 2006, Peltonen et al.<br />
2008, Rasilainen et al. 2014), and partly due to recent<br />
developments in the availability of 3D digital<br />
data from the research area, and applications and<br />
tools for geomodelling at the mining camp scale<br />
(e.g. Laine et al. 2012, Saalmann & Laine 2014,<br />
Laine et al. 2015).<br />
AIMS OF THE PROJECT<br />
The present investigation aimed to carry out a<br />
methodological and comparative analysis of concepts<br />
and technologies for deep exploration in the<br />
OMC area, one of the most important mining areas<br />
in Finland. The OMC is hosted by the Outokumpu<br />
Cu-Co-Zn-Ni±Ag-Au ore belt, also known as<br />
the Outokumpu Ore Belt or Outokumpu Belt (Figs.<br />
1 and 2). One of the objectives in this project was<br />
to apply the concept of common earth modelling<br />
to deep mineral exploration in the area. Modern<br />
3D software codes enable the construction of digital<br />
earth models and common earth models (CEM)<br />
comprising all available data from an area of interest.<br />
A CEM can be edited and updated after new<br />
data are collected so that the model fits the data<br />
constraints simultaneously, whether these data<br />
are geological or geophysical. This type of quantitative<br />
model can be further tested by drilling, as<br />
well as using other independent geophysical data.<br />
The project aimed at a modelling concept that is<br />
more quantitative than qualitative and a more efficient<br />
and reliable tool for exploration than traditional<br />
earth models, which are often collections<br />
of qualitative thoughts and descriptions about the<br />
subsurface.<br />
On a general level, the present project focused<br />
on developing methods, skills and concepts for<br />
deep exploration in mining camps using the Outokumpu<br />
Belt as an example case. With the help of<br />
deep geophysical data, surface geology, geochemistry<br />
and drilling data, geological 3D interpretations<br />
and models were compiled as constraints for<br />
further testing with forward and inverse geophysical<br />
modelling. The aim was to expand the surface<br />
and drilling information to much greater depths<br />
than had previously been feasible, i.e. to depths of<br />
1–2 km below the ground surface, and optionally to<br />
5 km if the data allowed.<br />
Geological modelling of geophysical deep structures<br />
was carried out in 3D with a future option to<br />
extend the modelling to 4D (i.e., additionally including<br />
the temporal evolution). The aim was to<br />
understand the geological evolution, structural<br />
development and ore potential of the area. One<br />
of the main questions was related to geologically<br />
interpreting the seismically reflective packages in<br />
19
Geological Survey of Finland, Special Paper 59<br />
Soile Aatos, Pekka J. Heikkinen and Ilmo Kukkonen<br />
the Outokumpu Belt and to developing cost-effective<br />
means to classify the reflectors with deep<br />
EM and potential field data. Although the metal<br />
sulphide ore deposits are known to be dense, electrically<br />
conductive and seismically reflective, the<br />
<strong>sp</strong>atial resolution of common EM and potential<br />
field methods is not sufficient for the direct detection<br />
of typical deposits in the Outokumpu area at<br />
depths exceeding 500–1000 m. Therefore, the aim<br />
was to provide models of the geological formations<br />
hosting the deposits for more direct testing in the<br />
future (i.e., deep drilling and drill-hole-based<br />
geophysical surveys).<br />
STUDY AREA AND GEOLOGICAL SETTING<br />
The present OMC study area is included in Outokumpu<br />
Mineral District (OMD) of this study, covering<br />
about 7200 km 2 and sharing the outlines of the<br />
previous GEOMEX project, which compiled most<br />
of the digital data from Outokumpu available before<br />
this project (Kuronen et al. 2005, Kontinen et<br />
al. 2006) (Figs. 1−5). At the beginning of this Tekes<br />
project, the GTK project group collaborated closely<br />
with the geophysical airborne ZTEM data acquisition<br />
project group of GTK (Kurimo et al. 2016) to adjust<br />
the ZTEM flight area to suit the needs of both<br />
of the projects. The flight operation area later came<br />
to outline the area of the interest with a surface<br />
area of circa 1200 km 2 . The Outokumpu Belt area<br />
inside the OMC, having a size of 30 km x 50 km, includes<br />
the main ore belt outcropping between the<br />
localities Kuusijärvi, Outokumpu and Polvijärvi.<br />
The OMC study area also included the extinct Keretti<br />
and Vuonos mines and the active Kylylahti and<br />
Horsmanaho mines, and the Miihkali Basin area<br />
(Figs. 2-5). Based on Kukkonen et al. (2012), an assumption<br />
was made that the minimum thickness<br />
of the interesting parts of the Outokumpu assemblage<br />
would be about 500 m.<br />
The Outokumpu ore deposit was discovered in<br />
1910 and mining started shortly thereafter. It can<br />
well be said that the discovery of the Outokumpu<br />
ore deposit led to the development of the modern<br />
metal industry in Finland. Due to its paramount<br />
importance to the metal industry, the Outokumpu<br />
Belt has been the target of numerous geological<br />
and geophysical studies over the last 100 years<br />
(see summaries in Koistinen (1981) and Peltonen<br />
et al. (2008)). Nowadays, the bedrock geology of<br />
the upmost 300 m of the research area is quite well<br />
known.<br />
Tectono-stratigraphically, Outokumpu assemblage<br />
rocks can be found in the Outokumpu nappe<br />
complex, consisting of the Outokumpu, Miihkali,<br />
Sukkulansalo and Kokka nappes (Aatos 2016, Lahti<br />
et al. 2016, Laine 2016). These nappes consist of<br />
1970-Ga-old reworked Palaeoproterozoic metaperidotites<br />
and metasediments emplaced on top<br />
of the Karelian Supergroup. The latter was deposited<br />
in a passive margin setting and thrusted upon<br />
the Archaean craton (Peltonen et al. 2008, Laajoki<br />
2005, Bedrock of Finland − DigiKP). The age range<br />
of the Palaeoproterozoic subunit is from 2500 to<br />
1600 Ma, of which the Orosirian period extends<br />
from 2050 to 1800 Ma (ICS 2015), coinciding with<br />
the age of global 2100-1800 Ga orogens portending<br />
the assembly of the pre-Rodinia supercontinent<br />
(Zhao et al. 2002), and having analogous simultaneous<br />
periods of mafic-ultramafic magmatic activity<br />
(Heaman et al. 2009, Peltonen et al. 1996).<br />
Lahti et al. (2016) and Laine 2016 have more thoroughly<br />
summarized the geological setting of the<br />
Outokumpu nappe complex.<br />
The Outokumpu-type, massive to semimassive,<br />
polygenetic Cu-Co-Ni ore deposits are bound to<br />
ophiolitic-sedimentary units with original or tectonic<br />
contact to skarns, quartz, carbonate rocks<br />
and black schists named the Outokumpu assemblage<br />
(Kontinen et al. 2006, Peltonen et al. 2008).<br />
According to Peltonen et al. (2008) the Outokumpu<br />
ore deposits include two main types: the primary<br />
Cu-rich proto ore and secondary disseminated Ni<br />
ore.<br />
The Outokumpu Belt hosted three major metal<br />
mines during 1913–1988. The Outokumpu mine<br />
achieved a total production of 28.5 Mt at 3.8% Cu,<br />
0.2% Co, 0.1% Ni, 1.1% Zn and 25.3% S. The Vuonos<br />
mine produced 5.89 Mt @ 2.45% Cu, 0.15% Co, 1.6%<br />
Zn, 0.13% Ni, 0.1g/t Au, 11.0g/t Ag and 24.8% S (Papunen<br />
1987, Parkkinen 1997, Peltonen et al. 2008),<br />
whereas the Luikonlahti mine produced 7.5 Mt<br />
of ore at 1.0% Cu, 0.1% Co, 0.5% Zn, 0.1% Ni and<br />
16.5% S (Parkkinen 1997, Kontinen et al. 2006).<br />
In 2014, Altona Mining Limited announced that<br />
the new Kylylahti underground mine in operation<br />
due northwest of the Outokumpu Belt had measured<br />
resources of 8.8 Mt at 1.33% Cu, 0.78 g∕t Au and<br />
0.54% Zn. The mine was acquired by Boliden from<br />
Altona Mining Limited in 2014 (Altona Mining<br />
20
Geological Survey of Finland, Special Paper 59<br />
Development of mining camp exploration and technologies for the Outokumpu brownfield region<br />
Fig. 2. Geological bedrock map (modified after Bedrock of Finland − DigiKP) of the Outokumpu Mineral District,<br />
including the Outokumpu Mining Camp research area (grey outline), audiomagnetotelluric measurement lines<br />
(blue, Lahti et al. 2016) and FIRE and HIRE seismic reflection lines (red, adapted from Kukkonen et al. 2012).<br />
21
Geological Survey of Finland, Special Paper 59<br />
Soile Aatos, Pekka J. Heikkinen and Ilmo Kukkonen<br />
Limited 2014, Boliden 2016, New Boliden 2016). In<br />
addition to metal sulphide deposits, the Outokumpu<br />
Belt hosts talc deposits, one of which is situated<br />
in Horsmanaho, presently being mined by Mondo<br />
Minerals B.V. Branch Finland. Moreover, exploration<br />
in the Outokumpu Belt is active and there are<br />
tens of exploration claims and permits (both active<br />
and pending) by several companies.<br />
DATA AND METHODS<br />
The available geological and geophysical datasets<br />
on the Outokumpu Belt included geological maps<br />
and models with a large coverage, over 900 drill<br />
cores, airborne low-altitude geophysical surveys<br />
(magnetic, electromagnetic (EM), U-Th-K gamma<br />
ray), ground geophysics (e<strong>sp</strong>ecially gravity) and<br />
petrophysical measurements of rock samples. Recently,<br />
the ore belt has been covered by extensive<br />
2D reflection seismic surveys (Kukkonen et al.<br />
2006, Kukkonen et al. 2011), which suggest possible<br />
deep-seated host rock formations of the metal sulphide<br />
ore deposits (Kukkonen et al. 2012) (Fig. 2). A<br />
2500-m-deep research borehole (the Outokumpu<br />
Deep Drill Hole) was drilled in 2004–2005 to reveal<br />
the geological character of the seismic reflections<br />
(Kukkonen 2011) (Fig. 2).<br />
Due to its depth extent of several kilometres,<br />
the modern deep EM audiomagnetotelluric (AMT)<br />
method is a very efficient means to map the electrical<br />
conductivity of the uppermost crust. Thus,<br />
AMT data provide an important dataset for classifying<br />
the seismic reflectors based on their electric<br />
Fig. 3. An illustrated example of geophysical survey data from the Outokumpu area integrated into a 3D bedrock<br />
geological earth model of the Outokumpu Mineral District (OMD). Geophysically interpreted AMT model data are<br />
suitable for delineating large regional deep conductive and resistive features and structures (Lahti 2015, Lahti et<br />
al. 2015, Lahti et al. 2016). Integrated model data on AMT profiles (purple = resistive, red = conductive bedrock)<br />
modelled by I. Lahti were inserted into a regional 3D geological interpretation (beige = Archaean basement rocks,<br />
red = Maarianvaara granitoid, grey lines = inferred and sketched faulting) by S. Aatos. The bedrock geological and<br />
fault interpretation were based on the digital bedrock map of Finland (Bedrock of Finland − DigiKP), the gravity<br />
map of the GEOMEX project (Ruotoistenmäki 2006), and aerogeophysical raster data (Airo et al. 2014). PjSZ =<br />
Polvijärvi Shear Zone. The extent of the geological solid model in the background is about 80 km x 90 km x 5 km.<br />
The depth of AMT model profiles ranges up to 8 km.<br />
22
Geological Survey of Finland, Special Paper 59<br />
Development of mining camp exploration and technologies for the Outokumpu brownfield region<br />
conductivity (Lahti 2015). At the beginning of the<br />
project, AMT data were rather limited in the Outokumpu<br />
Belt, although the first two test lines had<br />
been surveyed by GTK in 2012. During this project,<br />
four more test lines were measured over the research<br />
area, two of them concatenated (Figs. 2 and<br />
3). The ground-based AMT was complemented in<br />
2013 with the already commercially available ZTEM<br />
(Z-axis tipper electromagnetic) airborne method<br />
designed for surveying deep resistivity distributions<br />
to a depth of 1–2 km (Kurimo et al. 2016). The<br />
Outokumpu Belt provided an excellent opportunity<br />
to test the AMT and ZTEM methods in a wellknown<br />
ore belt, as Lahti et al. (2016) demonstrated<br />
also in the Miihkali Basin area.<br />
Analysis of potential fields (magnetic and gravity<br />
anomalies) was performed to estimate the sizes<br />
of geological formations and major ore potential<br />
deposits. Existing field measured gravity data<br />
of GTK were complemented with selected profile<br />
measurements (Leväniemi 2016) (Figs. 4 and 5).<br />
Together with petrophysical information, these<br />
were fitted with seismic observations of acoustic<br />
impedance discontinuities to produce border surfaces<br />
of geological objects (Komminaho et al. 2016,<br />
Tuomi 2016). Frequency-domain electromagnetic<br />
measurements were carried out at a known deepseated<br />
mineralization in Perttilahti (Figs. 4 and 5)<br />
to test the depth penetration of the method and<br />
to interpret the data with layered earth modelling<br />
application vs. geological interpretation (Nousiainen<br />
& Leväniemi 2016).<br />
Geological 3D modelling and visualization required<br />
the use of <strong>sp</strong>ecial software applications designed<br />
for geology and mine planning, structural<br />
and subsurface geology, geostatistics (Laine 2016),<br />
and 3D GIS (Aatos 2016) and 3D visualisation system<br />
tools. GIS modelling and visualisation tools<br />
with geo-processing and raster analysis modules<br />
enabled 2D pro<strong>sp</strong>ectivity mapping and the development<br />
of digital interpretation concepts and aids<br />
for bedrock mapping (Aatos 2016). All these codes<br />
had <strong>sp</strong>ecific features, and reflected different aims<br />
of modelling (for 3D, see e.g. Laine et al. 2012).<br />
The choice of software was highly relevant to later<br />
applications and needed to be carefully considered<br />
in designing concepts for deep exploration and<br />
modelling.<br />
A regional 3D bedrock geological interpretation<br />
was constructed (Fig. 3) based on a 2D pseudo-lithological<br />
computational GIS interpretation (Aatos<br />
2016), existing gravity interpretation (Ruotoistenmäki<br />
2006), present geological and structural<br />
geological knowledge of the model area, according<br />
to the national stratigraphic guide (Strand et<br />
al. 2010), and the bedrock geological map database<br />
(Bedrock of Finland − DigiKP). The concept model<br />
unit geological boundaries were further optimized<br />
according to the existing 3D bedrock geological observational<br />
and lithogeochemical data, structural<br />
geological 3D interpretations, and reflection seismic<br />
and ZTEM data (Aatos 2016).<br />
The project provided an excellent opportunity to<br />
establish a geophysical test line for deep-reaching<br />
geophysical methods. There is a need for validated<br />
data on deep exploration methods, e<strong>sp</strong>ecially their<br />
depth extent and <strong>sp</strong>atial resolution. The research<br />
group evaluated the premises of the reflection<br />
seismic lines measured earlier in HIRE and FIRE<br />
programmes (Kukkonen et al. 2006, Kukkonen et<br />
al. 2011) to choose an eligible test line. The chosen<br />
test line was vibroseismic line V7 of the HIRE project<br />
with known drilled targets at
Geological Survey of Finland, Special Paper 59<br />
Soile Aatos, Pekka J. Heikkinen and Ilmo Kukkonen<br />
Fig. 4. An example of integrating geophysical and geological 3D model data from the Outokumpu Mining Camp<br />
(OMC) area illustrated in 3D GIS scenery. Classified low-altitude airborne conductivity data by GTK (purple contours);<br />
interpolated surfaces based on regional ZTEM inversion data described by Kurimo et al. (2016) (beige, blue<br />
and pink surfaces); targeting density model data by Leväniemi (Lahti et al. 2016, Leväniemi 2016) (brown and<br />
grey bodies); geological model geometries of Keretti and Vuonos ore deposits by Laine et al. (2012) (black bodies).<br />
Outokumpu Deep Hole R-2500 (Kukkonen 2011, red asterisk). PjSZ = Polvijärvi Shear Zone (red dashed line). The<br />
extent of the model scenery is about 25 km x 45 km x 2 km.<br />
RESULTS<br />
The OMC turned out to be a highly suitable target<br />
area for developing deep exploration concepts and<br />
technologies on a mining camp scale. All the geophysical<br />
methods applied in this project were of<br />
use in achieving the main result of the project, i.e.<br />
the Outokumpu deep exploration concept (OKU-<br />
DEX concept) (Table 1). The results suggest that reprocessed<br />
and modelled reflection seismic survey<br />
data, potential field models based on petrophysical<br />
parameters, together with geological interpretations<br />
could be used to constrain other, geophysical<br />
data having a more robust resolution, such as deep<br />
EM (ZTEM and AMT). The chosen deep exploration<br />
methods of the project generally re<strong>sp</strong>onded to different<br />
petrophysical properties of the rock mass<br />
(elastic properties, conductivity, density, magnetic<br />
properties) and complemented each other (Heinonen<br />
et al. 2016, Komminaho et al. 2016, Kurimo et al.<br />
24
Geological Survey of Finland, Special Paper 59<br />
Development of mining camp exploration and technologies for the Outokumpu brownfield region<br />
Fig. 5. Indications of deep conductive anomalies (purple interpolated surface) based on regional ZTEM 3D inversion<br />
model data described in Kurimo et al. (2016) featured with Miihkali, Keretti and Vuonos 3D models. Miihkali<br />
density model data by Leväniemi (Lahti et al. 2016, Leväniemi 2016) (brown and grey bodies). Geological earth<br />
models of Keretti and Vuonos ore deposits by Laine et al. (2012) (black bodies). Outokumpu Deep Hole R-2500<br />
(Kukkonen 2011, red asterisk). PjSZ = Polvijärvi Shear Zone (red dashed line). Extent of the model scenery is<br />
about 25 km x 45 km x 2 km.<br />
2016, Lahti et al. 2016, Leväniemi 2016, Maitituerdi<br />
2016, Nousiainen & Leväniemi 2016, Tuomi 2016).<br />
The project interpreted the regional geology of<br />
the OMD and OMC as concepts and earth models<br />
compiled from geological and geophysical interpretations<br />
(Aatos 2016, Lahti et al. 2016) and as<br />
regional structural geological models based on geostatistics,<br />
simulations, and common earth modelling<br />
(Laine 2016).<br />
The project established the Sukkulansalo National<br />
Test Line (SNTL), following the location<br />
of high-resolution reflection seismic profile V7<br />
(Kukkonen et al. 2011) and encompassing a versatile<br />
set of geophysical and geological deep exploration<br />
data and interpretations to facilitate the<br />
development and testing of new deep exploration<br />
methodology in the future (Heinonen et al. 2016).<br />
The project was able to reach the main goals of<br />
the project, i.e. to develop deep (2–5 km) mineral<br />
exploration concepts and methods suitable<br />
for Outokumpu-type ore deposits and to build a<br />
general framework for common earth modelling<br />
and an integratable set of various types of earth<br />
models and CEMs of the OMC and surrounding areas.<br />
With integrated sceneries of state-of-the-art<br />
congruent geo-referenced field and model data<br />
and interpretations, the project was able to characterize<br />
the main regional bedrock formations and<br />
structures of the research area to a depth of 2 km<br />
and potentially to 5 km, possibly constraining the<br />
Outokumpu-type mineral potential below the relatively<br />
well known uppermost 300 m of the bed-<br />
25
Geological Survey of Finland, Special Paper 59<br />
Soile Aatos, Pekka J. Heikkinen and Ilmo Kukkonen<br />
Table 1. A generalized characterisation of the pre-competitive phase of the Outokumpu deep exploration concept (OKUDEX concept), comprising a combination of some<br />
equally important parts of the exploration process useful in predicting favourable deep features indicating the existence of Outokumpu assemblage rocks or Outokumputype<br />
mineral potential.<br />
Controlling feature Deep exploration proxies Geological data and<br />
methods<br />
I Tectono-stratigraphic<br />
units and their<br />
history<br />
Constraining unit boundaries<br />
and positioning favourable<br />
sequences of strata included<br />
in the Outokumpu nappe<br />
complex<br />
II Structures Continuation of structural controls<br />
related to favourable unit<br />
boundaries and remobilized<br />
zones related to mineral deposits<br />
in Outokumpu assemblage<br />
rock sequences<br />
III Properties of the ore<br />
or ore-hosting rock<br />
assemblages<br />
Mineralogy-bound, ore potential<br />
differentiating signatures and<br />
pathfinders in mineralized parts<br />
of Outokumpu assemblage<br />
rocks<br />
Regional to targeting bedrock<br />
geological inference by expert<br />
knowledge or by modelling<br />
Structural geological mapping<br />
and expert knowledge, predictions<br />
and simulations based on<br />
structures<br />
Geochemical whole-rock drill<br />
core analysis data, mineralogy<br />
Geophysical data and<br />
methods<br />
Systematically collected surface<br />
and deep geophysical airborne<br />
or field measurement data.<br />
Forward modelling of reflection<br />
seismics, inversion modelling of<br />
regional ZTEM, AMT data<br />
CEM modelling of deep EM and<br />
other deep geophysical survey<br />
data, constraining e.g. with<br />
reflection seismic data<br />
Petrophysical properties, potential<br />
field modelling, seismic<br />
forward modelling. Identifying<br />
coinciding anomalies e.g. highamplitude<br />
reflectors vs. ZTEM<br />
data.<br />
Verification of concepts and<br />
modelling<br />
Reviewing strategic targets with<br />
deep drilling, possibly complemented<br />
by shallow diamond<br />
drill coring, and with targeted<br />
field geophysical measurements<br />
and down-hole geophysics<br />
Reviewing strategic structures<br />
with structural geological<br />
mapping, oriented structural<br />
observations while deep drilling,<br />
analysis of whole rock and metal<br />
concentrations of drill-core<br />
samples, down-hole geophysics<br />
Reviewing strategic targets by<br />
deep drilling with whole rock<br />
and metal concentration analyses,<br />
down-hole geophysics<br />
26
Geological Survey of Finland, Special Paper 59<br />
Development of mining camp exploration and technologies for the Outokumpu brownfield region<br />
rock in the OMC area. The optimal operating depth<br />
for the exploration and mining industry in Finland<br />
would probably be above 1.5 km. The main mineralized<br />
deep indications of Outokumpu-type mineral<br />
deposition revealed by this project are situated<br />
in known conductive and reflective anomaly zones<br />
in Viurusuo-Outokumpu-Perttilahti (Outokumpu<br />
Belt), Kylylahti-Sola (Polvijärvi Shear Zone), and<br />
the Saramäki Belt plunging due south (Miihkali<br />
Basin). The deep EM model data revealed a previously<br />
undescribed regional SW–NE-trending deep<br />
conductor belt between Lake Viitajärvi and Lake<br />
Juojärvi (Kuminvaara Belt) at a depth of about 1–2<br />
km. The width of the Kuminvaara Belt equals that<br />
of the Outokumpu Belt (Fig. 5).<br />
The project developed new technologies and<br />
competence in the field of common earth modelling<br />
for deep exploration in Finland. The project is<br />
expected to have an impact on future business opportunities<br />
and society, with new expert services<br />
and data. The future continuation of research and<br />
competence development were ensured by inviting<br />
experienced and junior geophysicists and geologists<br />
to work together in order to extend the common<br />
knowledge base of deep exploration, common<br />
earth modelling and Outokumpu-type ore deposits<br />
during the project.<br />
Being able to visualize integrated data, earth<br />
models and CEM results consistently in commonly<br />
used 3D applications and environments is crucial<br />
when enhancing the communication between<br />
science branches or academia and industry. The<br />
project collected existing or digitized 3D datasets<br />
that allowed the development of integrated georeferenced<br />
3D data and model sceneries, e.g. for<br />
further multidisciplinary <strong>sp</strong>atial orientation and<br />
queries on a mining camp scale. The data files of<br />
the project, e.g. observation, measurement, interpretation<br />
and model data and their metadata,<br />
will be stored in the GIS databases of GTK. They<br />
will become publically available for further use and<br />
development according to the usual data product<br />
conventions of GTK, after the project qualifying<br />
period has expired.<br />
SUMMARY<br />
Long-term exploration and mining activities in<br />
brownfield areas related to <strong>sp</strong>ecific type(s) of mineral<br />
systems have an increasing need to develop<br />
cost-efficient and informative predicting methods<br />
for deep exploration reaching depths extending<br />
500 m. This is due to the exhausting of near<br />
surface deposits and high cost of deep data collection.<br />
Exploration in brownfield areas also requires<br />
technologies that avoid unnecessary disturbance<br />
of inhabitants and the environment. One solution<br />
fulfilling these demands is the efficient integration<br />
of existing, and if necessary, diversely optimised<br />
new geo-data with interpretation and modelling<br />
for deducing the deep characteristics of geological<br />
features indicative of the mineral deposit styles in<br />
focus.<br />
Most of the methods applied and developed in<br />
this project are suitable for regional deep exploration<br />
projects in the orienting work phase, before<br />
the targeting phase with complementary field observations<br />
and measurements. One geological key<br />
for focusing the deep exploration of a brownfield<br />
region more cost-efficiently is understanding of<br />
the mineral system context of the sought ore type,<br />
as well as thorough knowledge of the surficial geology<br />
of the explored region. Modelling results<br />
should always be evaluated and validated with field<br />
data (e.g. by drilling) and interpretations updated<br />
in an iterative way. Brownfield areas usually have<br />
advantages on their side when compared to greenfield<br />
areas, such as plentiful data. In many cases,<br />
however, there may be a lack of <strong>sp</strong>ecific data and<br />
knowledge needed for CEM or 3D earth model purposes<br />
(e.g. geological, geophysical and geochemical<br />
deep drilling data combined with reflection<br />
seismic profiles) from a location of interest, and in<br />
such cases, the gathering of new complementary<br />
data cannot be avoided.<br />
The geological environments hosting the Outokumpu-type<br />
ores are known for difficulties in<br />
interpreting the confusing or disguising effects<br />
of black schist interbeds or other conductive rock<br />
types typical of these regions. All of the used EM<br />
methods are sensitive to the masking effects<br />
caused by multiple layers of conductive rocks,<br />
emphasizing the need to develop complementary<br />
deep EM measurements and modelling methods<br />
(e.g. joint inversion with other relevant geophysical<br />
data) to resolve these issues. The results of<br />
seismic modelling, other geophysical interpretation<br />
and CEM can mostly be verified inside a measurement<br />
profile where geological interpretation<br />
of deep drilling data is available. Potential field<br />
modelling provides multi-disciplinary perceivable<br />
27
Geological Survey of Finland, Special Paper 59<br />
Soile Aatos, Pekka J. Heikkinen and Ilmo Kukkonen<br />
geometries for constraining the ore potential of<br />
rock formations. Expanding geophysical interpretation<br />
to greater depths increases the uncertainty<br />
of the results as a function of depth and the detectability<br />
of the deposit. The uncertainty of the results<br />
generally increases as a function of distance from<br />
the observation points or measurement lines, unless<br />
the observation or measurement density in the<br />
area of interest is increased. The uncertainty of the<br />
results can be diminished by using multi-sourced<br />
data and integrated interpretations. Systematic<br />
observations of surficial and subsurface structural<br />
geological data and interpretations are indi<strong>sp</strong>ensable<br />
in constructing geological earth models constraining<br />
geophysical CEM.<br />
As a whole, the project was able to delineate<br />
geophysical anomalies and geological constraints,<br />
probably indicating the main deep-reaching zones<br />
of Outokumpu assemblage rocks in the OMC area.<br />
At the end of the project, the present compiled<br />
versions of the project earth and common earth<br />
models represent the best available geophysical<br />
interpretations backed up by bedrock and structural<br />
geological and geochemical expert knowledge<br />
of the OMC. Eventually, the main outcome<br />
of the project, the OKUDEX concept, will provide<br />
suggestions for general concepts, experience and<br />
guidance for novel applications of such datasets in<br />
modelling the bedrock at mining camps and exploration<br />
in analogous areas resembling the OMD. The<br />
most strategic targets of the project are proposed<br />
to be reviewed, or undergo deep drilling (1000 m),<br />
possibly complemented with shallow diamond<br />
coring of the surface (300 m).<br />
ACKNOWLEDGEMENTS<br />
Maija Kurimo (GTK), Doug Pitcher and his teams at<br />
Geotech Airborne Ltd. are acknowledged for delivering<br />
the first systematic regional ZTEM airborne<br />
helicopter survey and model data in Finland for use<br />
in the project. Special thanks in connection with<br />
ZTEM go to Urpo Kuronen (FinnAust Mining Oy),<br />
who shared his experience of commissioning the<br />
first ZTEM data for deep exploration purposes in<br />
Finland. The proficiency in technical field measurements<br />
of Heikki Forss and his operating staff (GTK)<br />
is highly valued. Urpo Kuronen and the researchers<br />
collaborating on the project are acknowledged for<br />
their contribution to formulating the OKUDEX concept.<br />
Perttu Mikkola (GTK) and Esa Heilimo (GTK)<br />
are thanked for commenting on the manuscript of<br />
this article.<br />
This project was supported by Tekes (the Finnish<br />
Funding Agency for Innovation), the Geological<br />
Survey of Finland, the University of Helsinki and<br />
the exploration and mining companies FinnAust<br />
Mining Oy, Boliden Kylylahti (previously Altona<br />
Mining Ltd) and Mondo Minerals B.V. Branch Finland,<br />
as well as the regional development company<br />
JOSEK Oy operating in Eastern Finland.<br />
REFERENCES<br />
Aatos, S. 2016. Regional analysis of hydrothermal nickel<br />
pro<strong>sp</strong>ectivity in the Outokumpu Mineral District. In:<br />
Aatos, S. (ed.) Developing Mining Camp Exploration<br />
Concepts and Technologies – Brownfield Exploration<br />
Project 2013–2016. Geological Survey of Finland,<br />
Special Paper 59. (this volume)<br />
Airo, M.-L. 2015. Geophysical signatures of mineral deposit<br />
types – synopsis. In: Airo, M.-L. (ed.) Geophysical<br />
signatures of mineral deposit types in Finland.<br />
Geological Survey of Finland, Special Paper 58, 9–70.<br />
Airo, M.-L., Hyvönen, E., Lerssi, J., Leväniemi, H. &<br />
Ruotsalainen, A. 2014. Tips and tools for the application<br />
of GTK’s airborne geophysical data. Geological<br />
Survey of Finland, Report of Investigation 215. 33 p.<br />
Airo, M.-L., Säävuori, H. & Vuoriainen, S. 2011. Petrophysical<br />
properties of the Outokumpu Deep Drill Core<br />
and the surrounding bedrock. In: Kukkonen, I. (ed.)<br />
Outokumpu Deep Drilling Project 2003–2010. Geological<br />
Survey of Finland, Special Paper 51, 63–82.<br />
Altona Mining Limited 2014. Kylylahti resource increased.<br />
26 March 2014. ASX/Media Announcement.<br />
Available at: https://d381lo9f9jd9w0.cloudfront.net/<br />
uploads/documents/AOH0567-Kylylahti-Resource-<br />
Increased-260314.pdf<br />
Bedrock of Finland − DigiKP. Digital map database [Electronic<br />
resource]. E<strong>sp</strong>oo: Geological Survey of Finland<br />
[referred 22.02.2016]. Version 2.0.<br />
Bellefleur, G., Schetselaar, E., White, D., Miah, K. &<br />
Dueck, P. 2015. 3D seismic imaging of the Lalor volcanogenic<br />
massive deposit, Manitoba, Canada. Geophysical<br />
Pro<strong>sp</strong>ecting 63, 813−832.<br />
Boliden 2016. This is Boliden. Presentation. Boliden. Available<br />
at: http://www.boliden.com/Documents/Press/<br />
Presentations/Group_Presentation_2014-15_ENG.pdf<br />
Heaman, L.M., Peck, D. & Toope, K. 2009. Timing and<br />
geochemistry of 1.88 Ga Molson Igneous Events,<br />
Manitoba: Insights into the formation of a cratonscale<br />
magmatic and metallogenic province. Precambrian<br />
Research 172, 143–162.<br />
28
Geological Survey of Finland, Special Paper 59<br />
Development of mining camp exploration and technologies for the Outokumpu brownfield region<br />
Hehnke, C., Ballantyne, G., Martin, H., Hart, W.,<br />
Schwarz, A. & Stein, H. 2012. Geology and Exploration<br />
Progress at the Resolution Porphyry Cu-Mo Deposit,<br />
Arizona. Chapter 7. In: Hedenquist, J. W., Harris, M.<br />
& Camus, F. (eds) Geology and Genesis of Major Copper<br />
Deposits and Districts of the World: A Tribute to<br />
Richard H. Sillitoe, Society of Economic Geologists,<br />
Inc., Special Publication 16, 147−166.<br />
Heinonen, S. 2013. Seismic reflection profiling for massive<br />
sulphide exploration in Finland. Synopsis. Academic<br />
dissertation. Report S-59. Institute of Seismology,<br />
University of Helsinki. 49 p.<br />
Heinonen, S., Kontinen, A., Leväniemi, H., Lahti, I.,<br />
Junno, N., Kurimo, M. & Koivisto, E. 2016. Sukkulansalo<br />
National Test Line in Outokumpu: A ground<br />
reference for deep explorations methods. In: Aatos, S.<br />
(ed.) Developing Mining Camp Exploration Concepts<br />
and Technologies – Brownfield Exploration Project<br />
2013–2016. Geological Survey of Finland, Special Paper<br />
59. (this volume)<br />
Heinonen, S., Kukkonen, I. T., Heikkinen, P. J. &<br />
Schmitt, D. R. 2011. High resolution reflection seismics<br />
integrated with deep drill hole data in Outokumpu,<br />
Finland. In: Kukkonen, I. T. (ed.) Outokumpu Deep<br />
Drilling Project 2003−2010. Geological Survey of Finland,<br />
Special Paper 51, 105–118.<br />
ICS 2015. International Chronostratigraphic Chart.<br />
V2015/01. The International Commission on Stratigraphy,<br />
IUGS. Available at: www.stratigraphy.org<br />
Jokinen, J., Korpisalo, A. & Hongisto, H. 2011. New<br />
down-hole geophysical techniques in exploration of<br />
deep ore deposits. In: Nenonen, K. & Nurmi. P. A. (eds)<br />
Geoscience for Society 125th Anniversary Volume.<br />
Geological Survey of Finland, Special Paper 49, 59–70.<br />
Karinen, T., Lahti, I. & Konnunaho, J. 2015. 3D/4D geological<br />
modelling of the Hietakero and Vähäkurkkio<br />
areas in the Lätäseno Schist Belt, Enontekiö, northern<br />
Finland. In: Sarala, P. (ed.) Novel technologies for<br />
greenfield exploration. Geological Survey of Finland,<br />
Special Paper 57, 121−134.<br />
Koistinen, T. 1981. Structural evolution of an early Proterozoic<br />
strata-bound Cu-Co-Zn deposit, Outokumpu,<br />
Finland. Transactions of the Royal Society of Edinburgh-Earth<br />
Sciences, 72, 115−158.<br />
Koivisto, E., Malehmir, A., Hellqvist, N., Voipio, T.<br />
& Wijns, C. 2015. Building a 3D model of lithological<br />
contacts and near-mine structures in the Kevitsa<br />
mining and exploration site, Northern Finland: constraints<br />
from 2D and 3D reflection seismic data. Geophysical<br />
Pro<strong>sp</strong>ecting 63, 754–773.<br />
Komminaho, K., Koivisto, E., Heikkinen, P. J., Tuomi, H.,<br />
Junno, N. & Kukkonen, I. 2016. Seismic ore exploration<br />
in the Outokumpu area, Eastern Finland: Constraints<br />
from seismic forward modelling and geometrical considerations.<br />
In: Aatos, S. (ed.) Developing Mining Camp<br />
Exploration Concepts and Technologies – Brownfield<br />
Exploration Project 2013–2016. Geological Survey of<br />
Finland, Special Paper 59. (this volume)<br />
Kontinen, A., Peltonen, P. & Huhma, H. 2006. Description<br />
and genetic modelling of the Outokumpu-type<br />
rock assemblage and associated sulphide deposits.<br />
Final technical report for GEOMEX J.V., Work<strong>sp</strong>ace<br />
Geology. Geological Survey of Finland, archive report<br />
M10.4/2006/1. 378 p.<br />
Korpisalo, A. 2011. Principles of RIM method: EMRE system.<br />
ESY, ESY/Merigeologia ja geofysiikka. Geological<br />
Survey of Finland, archive report 46/2011. 36 p.<br />
Korpisalo, A. 2016. Electromagnetic Geotomographic<br />
Research on Attenuating Material Using Middle Radio<br />
Frequency Band. Geological Survey of Finland, Special<br />
Publications 94. 68 p.<br />
Kukkonen, I. T. (ed.) 2011. Outokumpu Deep Drilling<br />
Project 2003−2010. Geological Survey of Finland, Special<br />
Paper 51. 252 p.<br />
Kukkonen, I. T., Heikkinen, P., Ekdahl, E., Hjelt, S.-<br />
E., Yliniemi, J., Jalkanen, E. & FIRE Working Group<br />
2006. Acquisition and geophysical characteristics of<br />
reflection seismic data on FIRE transects, Fennoscandian<br />
Shield. In: Kukkonen, I. T. & Lahtinen, R. (eds)<br />
Finnish Reflection Experiment 2001−2005. Geological<br />
Survey of Finland, Special Paper 43, 13-43.<br />
Kukkonen, I. T., Heikkinen, P., Heinonen, S., Laitinen,<br />
J. & HIRE Working Group of the Geological Survey of<br />
Finland 2011. Reflection seismics in exploration for<br />
mineral deposits: initial results from the HIRE project.<br />
In: Nenonen, K. & Nurmi. P. A. (eds) Geoscience for<br />
Society 125th Anniversary Volume. Geological Survey<br />
of Finland, Special Paper 49, 49–58.<br />
Kukkonen, I. T., Heinonen, S., Heikkinen, P. & Sorjonen-Ward,<br />
P. 2012. Delineating ophiolite-derived<br />
host rocks of massive sulphide Cu-Co-Zn deposits<br />
with 2D high-resolution seismic reflection data in Outokumpu,<br />
Finland. Geophysics, 77(5), WC213–WC222.<br />
Kurimo, M., Lahti, I. & Nousiainen, M. 2016. ZTEM survey<br />
in the Outokumpu region. In: Aatos, S. (ed.) Developing<br />
Mining Camp Exploration Concepts and<br />
Technologies – Brownfield Exploration Project 2013–<br />
2016. Geological Survey of Finland, Special Paper 59.<br />
(this volume)<br />
Kuronen, U. 2013. FinnAust Mining Plc – High Impact Exploration.<br />
High Impact Exploration in a World-class<br />
Producing Copper-nickel Region. FEM Presentation,<br />
October 2013. FinnAust Mining Plc. 20 p. Available at:<br />
http://fem.lappi.fi/c/document_library/get_file?folde<br />
rId=1405164&name=DLFE-20770.pdf<br />
Kuronen, U., Kontinen, A. & Kokkonen, J. 2004. GE-<br />
OMEX project report 1999-2003. GEOMEX JV Report.<br />
Geological Survey of Finland & Outokumpu Co. 38 p.<br />
Laajoki, K. 2005. Karelian supracrustal rocks. In: Lehtinen,<br />
M., Nurmi, P. A. & Rämö, O. T. (eds) Precambrian<br />
geology of Finland – Key to the evolution of the<br />
Fennoscandian Shield. Amsterdam: Elsevier B.V.,<br />
279–342.<br />
Lahti, I. 2015. Audiomagnetotelluric (AMT) measurements:<br />
A new tool for mineral exploration and upper<br />
crustal research at the Geological Survey of Finland.<br />
In: Sarala, P. (ed.) Novel technologies for greenfield<br />
exploration. Geological Survey of Finland, Special<br />
Paper 57, 155−172.<br />
Lahti, I., Kontinen, A., Aatos, S. & Smirnov, M. 2015.<br />
AMT survey in the Outokumpu ore Belt, Eastern<br />
Finland. Geophysical Research Abstracts. Vol. 17,<br />
EGU2015-3336, EGU General Assembly. 1 p.<br />
Lahti, I., Leväniemi, H., Kontinen, A., Sorjonen-Ward,<br />
P., Aatos, S. & Koistinen, E. 2016. Geophysical surveys<br />
of the Miihkali area, Eastern Finland. In: Aatos, S.<br />
(ed.) Developing Mining Camp Exploration Concepts<br />
and Technologies – Brownfield Exploration Project<br />
2013–2016. Geological Survey of Finland, Special Paper<br />
59. (this volume)<br />
Laine, E. 2016. 3D modelling of the Outokumpu assemblage<br />
rocks − a geostatistical approach. In: Aatos, S.<br />
(ed.) Developing Mining Camp Exploration Concepts<br />
and Technologies – Brownfield Exploration Project<br />
2013–2016. Geological Survey of Finland, Special Paper<br />
59. (this volume)<br />
Laine, E., Koistinen, E., Saalmann, K., Coirrioux, G.,<br />
Diaz, R., Salminen, N. & Tervo, T. 2012. 3D modelling<br />
of polydeformed and metamorphosed rocks at<br />
different scales using geological and geophysical data<br />
from Outokumpu area. In: Laine, E. (ed.) 3D modelling<br />
of polydeformed and metamorphosed rocks: the<br />
29
Geological Survey of Finland, Special Paper 59<br />
Soile Aatos, Pekka J. Heikkinen and Ilmo Kukkonen<br />
old Outokumpu Cu-Co-Zn mine area as a case study.<br />
Geological Survey of Finland, Report of Investigation<br />
195, 31–66.<br />
Laine, E., Luukas, J., Mäki, T., Kousa, J., Ruotsalainen,<br />
A., Suppala, I., Imaña, M., Heinonen, S. & Häkkinen,<br />
T. 2015. The Vihanti-Pyhäsalmi Area. In: Weihed, P.<br />
(ed.) 3D, 4D and Predictive Modelling of Major Mineral<br />
Belts in Europe. Mineral Resource Reviews. Springer<br />
International Publishing, 123–144.<br />
Maitituerdi, A. 2015. Seismic Reflection Method for Ore<br />
Exploration in Outokumpu Area, Finland: Insights<br />
from Data Processing. MSc Thesis in Geophysical<br />
Pro<strong>sp</strong>ecting. Geology Division, School of Science and<br />
Technology, University of Camerino. 78 p.<br />
Martin, L., Perron, G. & Masson, M. 2007. Discovery<br />
from 3-D visualization and quantitative modelling. In:<br />
Milkereit, B. (ed.) Conference Proceedings of Exploration<br />
07: Fifth Decennial International Conference on<br />
Mineral Exploration: Toronto, Decennial Mineral Exploration<br />
Conferences, 543–550. Available at: http://<br />
www.mirageoscience.com/data/media/target/original/noranda_01.pdf<br />
McGaughey, J. 2006. The Common Earth Model: A Revolution<br />
in Mineral Exploration Data Integration. In:<br />
Harris, J. R. (ed.) GIS applications in the earth sciences,<br />
Geological Association of Canada Special Publication<br />
44, 567–576.<br />
Mondo Minerals 2016. Who We Are: An Overview. The<br />
Talc Company. Mondo Minerals. Available at: http://<br />
www.mondominerals.com/en/the-talc-company/anoverview/?no_cache=1&sword_list[]=vuonos<br />
New Boliden 2016. Boliden Kylylahti. Operations. Mines.<br />
Boliden Group web pages. Available at: http://www.<br />
boliden.com/Operations/Mines/Boliden-Kylylahti/<br />
Niiranen, T., Lahti, I., Nykänen, V. & Karinen, T. 2014.<br />
Central Lapland Greenstone Belt 3D modelling project<br />
final report. Geological Survey of Finland, Report of<br />
Investigation 209. 78 p.<br />
Papunen, H. 1987. Outokumpu-type ores. In: Häkli, T.<br />
A. (ed.) Otto Trustedt symposium in Finland on June<br />
3−5, 1985. Geological Survey of Finland, Special Paper<br />
1, 41–50.<br />
Parkkinen, J. 1997. An outline of the history of exploration<br />
and mining in the Outokumpu district. In:<br />
Loukola-Ruskeeniemi, K. & Sorjonen-Ward, P. (eds)<br />
Research and exploration – where do they meet? 4th<br />
Biennial SGA Meeting, August 11−13, 1997, Turku, Finland.<br />
Excursion guidebook A4: ore deposits in eastern<br />
Finland. Geological Survey of Finland, Guide 42,<br />
27–28.<br />
Peltonen, P., Kontinen, A. & Huhma, H. 1996. Petrology<br />
and Geochemistry of Metabasalts from the 1.95 Ga<br />
Jormua Ophiolite, Northeastern Finland. Journal of<br />
Petrology 37, 1359–1383.<br />
Peltonen, P., Kontinen, A., Huhma, H. & Kuronen, U.<br />
2008. Outokumpu revisited: New mineral deposit<br />
model for the mantle peridotite-associated Cu–Co–<br />
Zn–Ni–Ag–Au deposits. Ore Geology Reviews, 33,<br />
559–617.<br />
Rasilainen, K., Eilu, P., Halkoaho, T., Karvinen, A., Kontinen,<br />
A., Kousa, J., Lauri, L., Luukas, J., Niiranen,<br />
T., Nikander, J., Sipilä, P., Sorjonen-Ward, P., Tiainen,<br />
M., Törmänen, T., & Västi, K. 2014. Quantitative<br />
assessment of undiscovered resources in volcanogenic<br />
massive deposits, porphyry copper deposits and Outokumpu-type<br />
deposits in Finland. Geological Survey of<br />
Finland, Report of Investigation 208. 60 p.<br />
Ruotoistenmäki, T. 2006. Geophysical Characteristics of<br />
the Outokumpu Area, SE Finland. Geological Survey of<br />
Finland, Report of Investigation 162. 37 p.<br />
Saalmann, K. & Laine, E. 2014. Structure of the Outokumpu<br />
ore district and ophiolite-hosted Cu-Co-Zn-<br />
Ni-Ag-Au sulphide deposits revealed from 3D modelling<br />
and 2D high-resolution seismic reflection<br />
data. Ore Geology reviews 62, 156–180.<br />
Schetselaar, E., Pehrsson, S., Devine, C., Lafrance, B.,<br />
White, D. & Malinowski, M. 2016. 3-D Geologic Modeling<br />
in the Flin Flon Mining District, Trans-Hudson<br />
Orogen, Canada: Evidence for Polyphase Imbrication<br />
of the Flin Flon-777-Callinan Volcanogenic Massive<br />
Sulfide Ore System. Economic Geology 111, 877−901.<br />
Sprague, K., de Kemp, E., Wong, W., McGaughey, J.,<br />
Perron, G. & Barrie, T. 2006. Spatial targeting using<br />
queries in a 3-D GIS environment with application<br />
to mineral exploration. Computers & Geosciences 32,<br />
396−418.<br />
Strand, K., Köykkä, J. & Kohonen, J. (eds) 2010. Guidelines<br />
and Procedures for Naming Precambrian Geological<br />
Units in Finland. 2010 Edition Stratigraphic Commission<br />
of Finland: Precambrian Sub-Commission.<br />
Geological Survey of Finland, Guide 55. 41 p.<br />
Tuomi, H. 2016. Seismic forward modelling constraints<br />
for seismic ore exploration at the Kylylahti Cu-<br />
Co-Zn-Ni-Ag-Au sulfide deposit. Master’s thesis,<br />
Department of Geosciences and Geography, University<br />
of Helsinki. 84 p.<br />
Zhao, G., Cawood, P. A., Wilde, S. & Sun, M. 2002. Review<br />
of global 2.1–1.8 Ga orogens: implications for a<br />
pre-Rodinia supercontinent. Earth-Science Reviews<br />
59, 125–162.<br />
30
Developing Mining Camp Exploration Concepts and Technologies – Brownfield Exploration Project 2013–2016<br />
Edited by Soile Aatos<br />
Geological Survey of Finland, Special Paper 59, 31–56, 2016<br />
SEISMIC ORE EXPLORATION IN THE OUTOKUMPU AREA,<br />
EASTERN FINLAND: CONSTRAINTS FROM SEISMIC<br />
FORWARD MODELLING AND GEOMETRICAL CONSIDERATIONS<br />
by<br />
Kari Komminaho 1) , Emilia Koivisto 2) , Pekka J. Heikkinen 1) , Hilkka Tuomi 1) ,<br />
Niina Junno 1) and Ilmo Kukkonen 3)<br />
Komminaho, K., Koivisto, E., Heikkinen, P. J., Tuomi, H., Junno, N. &<br />
Kukkonen, I. 2016. Seismic ore exploration in the Outokumpu area, Eastern<br />
Finland: Constraints from seismic forward modelling and geometrical<br />
considerations. Geological Survey of Finland, Special Paper 59, 31−56, 15 figures<br />
and 2 tables.<br />
The main goals of the work presented here were (1) to utilize seismic forward<br />
modelling to gain a better understanding of the seismic signature of<br />
the Outokumpu assemblage rocks and associated Outokumpu-type semimassive<br />
to massive sulphide Cu–Co–Zn–Ni–Ag–Au deposits, and (2) to develop<br />
tailored seismic reflection data processing schemes and analyses for<br />
aiding seismic ore exploration in the Outokumpu area. Seismic reflection<br />
profile OKU1 at the southwestern end of the Outokumpu area was chosen<br />
as the main focus of the seismic forward modelling and processing efforts,<br />
because OKU1 is located close to the 2.5-km-deep Outokumpu Deep Drill<br />
Hole, which provides direct lithological control for the observed reflectivity<br />
and well-documented acoustic properties of the Outokumpu rocks to<br />
be used in forward modelling. The forward modelling results show that<br />
within mica schist hosting them, the Outokumpu assemblage rocks (and<br />
black schist enveloping them) form internally strongly reflective packages<br />
typically characterized by numerous diffraction hyperbolas in the stacked<br />
sections. These reflectivity characteristics can be used to target the potentially<br />
ore-bearing Outokumpu assemblage rocks at depth, and the seismic<br />
reflection data provide a good basis for setting regional exploration targets<br />
in the Outokumpu area. Based on the results of this study, it seems also<br />
possible that the Outokumpu-type sulphide mineralizations could even be<br />
directly observed as high-amplitude anomalies in the seismic reflection<br />
sections, if the dimensions and orientation are optimal. A careful crookedline<br />
data processing sequence should be able to preserve the direct signals,<br />
if present in the measured seismic reflection data, except for very shallow<br />
signals that are more likely to be distorted by the crooked-line effects.<br />
However, the crooked-line effects can also potentially produce high-amplitude<br />
anomalies, and care is required when interpreting the high-amplitude<br />
anomalies in the light of ore exploration. In addition to seismic<br />
reflection profile OKU1, forward modelling results are also presented for<br />
the Kylylahti mine area at the northwestern side of the Outokumpu area,<br />
where the complex 3D geometry - e<strong>sp</strong>ecially the occasionally near-vertical<br />
orientation of the Outokumpu assemblage rock units - poses a challenge<br />
for surface seismic data acquisition. Finally, seismic reflection profile V7<br />
31
Geological Survey of Finland, Special Paper 59<br />
Kari Komminaho, Emilia Koivisto, Pekka J. Heikkinen, Hilkka Tuomi, Niina Junno and Ilmo Kukkonen<br />
is used as an example of another strongly reflective unit present in the<br />
Outokumpu area in addition to the Outokumpu assemblage rocks, i.e., the<br />
Archaean basement and overlying Proterozoic supracrustal rocks, and how<br />
the true orientation of the reflectors obtained from a 2D seismic reflection<br />
section can be analysed with the help of surface geological data.<br />
Keywords: Seismic methods, reflection methods, mineral exploration,<br />
modelling, Outokumpu<br />
1)<br />
University of Helsinki, Department of Geosciences and Geography, Institute of<br />
Seismology, P.O. Box 68, FI-00014 University of Helsinki, Finland<br />
2)<br />
University of Helsinki, Department of Geosciences and Geography, Division of<br />
Geology and Geochemistry, P.O. Box 64, FI-00014 University of Helsinki,<br />
Finland<br />
3)<br />
University of Helsinki, Department of Physics, Division of Materials Physics,<br />
P.O. Box 64, FI-00014 University of Helsinki, Finland<br />
E-mail: kari.komminaho@helsinki.fi<br />
32
Geological Survey of Finland, Special Paper 59<br />
Seismic ore exploration in the Outokumpu area, Eastern Finland:<br />
Constraints from seismic forward modelling and geometrical considerations<br />
INTRODUCTION<br />
Over the past few decades, considerable research<br />
efforts have been put into developing seismic reflection<br />
methods, initially developed for hydrocarbon<br />
exploration in sedimentary environments, to<br />
better match the needs of hard-rock ore exploration<br />
(e.g., Eaton et al. 2003, 2010, Salisbury & Snyder<br />
2007, Malehmir et al. 2012 and the references<br />
therein). In addition to their depth penetration<br />
and resolution, seismic reflection methods are of<br />
particular interest because the elastic properties<br />
of sulphide minerals imply that in many of their<br />
typical host environments, the ore deposits could<br />
potentially be directly observed if they meet the<br />
geometrical constraints required for reflection or<br />
diffraction (e.g., Salisbury et al. 2003, Salisbury &<br />
Snyder 2007). However, in terms of direct delineation,<br />
seismic reflection methods are currently only<br />
likely to be cost effective in brownfield environments<br />
and for ore bodies that are several hundreds<br />
of metres across (Malehmir et al. 2012 and the references<br />
therein). Consequently, the goal of seismic<br />
reflection surveying in hard-rock mining and<br />
exploration areas has most commonly been to map<br />
structures or contacts between rock units where<br />
ore deposits are known to accumulate (e.g., Drummond<br />
et al. 1998, Malehmir et al. 2007, Willman et<br />
al. 2010, Koivisto et al. 2015).<br />
Seismic forward modelling can be used to gain<br />
a better understanding of the seismic signatures<br />
of ore deposits and ore-bearing formations (e.g.,<br />
Bohlen et al. 2003, Ahmadi et al. 2013). First, seismic<br />
forward modelling is used to predict the seismic<br />
signature that would be recorded given an<br />
assumed ore body and host formation within the<br />
crust. Then, the model is compared with real seismic<br />
reflection data. For forward seismic modelling,<br />
a preliminary 3D geological model, or competing<br />
models, of the target of interest is needed, along<br />
with the density and seismic velocity structure of<br />
the medium in which the seismic waves are travelling.<br />
Based on the forward modelling results, the<br />
underlying 3D geological model can be verified or<br />
further improved, and in the light of the acquired<br />
understanding of the seismic re<strong>sp</strong>onse at the deposit<br />
scale, real data can be analysed for potential<br />
direct indications of new ore deposits. Furthermore,<br />
forward modelling can, for example, also<br />
be used for testing of optimal acquisition geometries<br />
and data processing schemes for seismic ore<br />
exploration.<br />
Extensive seismic reflection data are available<br />
from the Outokumpu area, including a crustalscale<br />
seismic reflection profile crossing the area<br />
(Kukkonen et al. 2006, Sorjonen-Ward 2006) and<br />
altogether 82 km of high-resolution 2D profiles<br />
across central parts of the area (Kukkonen et al.<br />
2011, 2012, Fig. 1). These seismic data have revealed<br />
internally reflective units that have been interpreted<br />
as deeper occurences of the Outokumpu<br />
assemblage rocks, known to contain Cu–Co–Zn–<br />
Ni–Ag–Au ores (Kukkonen et al. 2006, 2011, 2012,<br />
Heinonen et al. 2011, Saalmann & Laine 2014). The<br />
bodies of Outokumpu assemblage rocks, which<br />
consist of serpentinite, carbonate, skarn (calcsilicate)<br />
and quartz rocks, are usually wrapped in<br />
black schist, which also occurs as separate layers<br />
in the hosting mica schist (Fig. 1). Kukkonen et al.<br />
(2012) and Saalmann & Laine (2014) have used the<br />
Outokumpu seismic reflection data to constrain<br />
3D geological models of the deep continuation<br />
of the Outokumpu assemblage rocks. Kukkonen<br />
et al. (2012) have also identified high-amplitude<br />
diffractions within their interpreted units of the<br />
Outokumpu assemblage rocks as potential direct<br />
indicators of new Outokumpu-type ore deposits.<br />
The work presented here builds on the findings<br />
of these earlier studies with the main goals (1) to<br />
utilize seismic forward modelling to gain a better<br />
understanding of the seismic signature of the orebearing<br />
Outokumpu assemblage rocks and the Outokumpu-type<br />
semi-massive to massive sulphide<br />
Cu–Co–Zn–Ni–Ag–Au deposits, and (2) to develop<br />
data processing schemes and analyses for aiding<br />
seismic ore exploration in the Outokumpu area.<br />
33
Geological Survey of Finland, Special Paper 59<br />
Kari Komminaho, Emilia Koivisto, Pekka J. Heikkinen, Hilkka Tuomi, Niina Junno and Ilmo Kukkonen<br />
Fig. 1. Geological map of the Outokumpu area and the high-resolution seismic reflection profiles OKU1, OKU2,<br />
OKU3, V1, V2, V3, V7, V8 and E1. The work presented in this paper is focused on the seismic reflection profiles<br />
OKU1 and V7, and the Kylylahti mine area. Black dashed lines indicate the geological cross-sections of Koistinen<br />
(1981) (cross-section profiles 188.170, 189.900 and 192.000) and Kontinen et al. (2006) (cross-section profile<br />
6972.700) utilized in building of the geological models used for seismic forward modelling along OKU1 and in the<br />
Kylylahti mine area, re<strong>sp</strong>ectively. The thicker yellow line in the OKU1 area indicates the location of the crosssection<br />
used for seismic forward modelling (shown in Fig. 5A). The geological cross-section used for the Kylylahti<br />
seismic forward modelling (presented in Fig. 10) is the same as the cross-section profile 6972.700 of Kontinen<br />
et al. (2006) shown on the geological map. The location of the 2.5-km-deep Outokumpu Deep Drill Hole (R2500)<br />
is indicated with a larger red circle, and the shallower Itikkapöksynkangas drill holes in the Saarivaa area with<br />
smaller red circles. The red dashed line in the Saarivaara area indicates the calculated surface projection of the<br />
reflection event marked with A in the seismic reflection profile V7 in Figure 13.<br />
Below, we first review the acquisition parameters<br />
of the Outokumpu seismic reflection surveys and<br />
discuss the processing of these data, with a <strong>sp</strong>ecific<br />
focus on the reprocessing of seismic reflection<br />
profile OKU1 (Fig. 1). Seismic forward modelling<br />
results for the seismic re<strong>sp</strong>onse of the Outokumpu<br />
assemblage rocks and Outokumpu-type sulphide<br />
deposits are then presented along the seismic reflection<br />
profile OKU1. Profile OKU1 at the southwestern<br />
end of the Outokumpu area was chosen as<br />
the main focus of the seismic forward modelling<br />
and reprocessing efforts, because OKU1 is located<br />
only 400 meters away from the 2.5-km-deep Outokumpu<br />
Deep Drill Hole (Fig. 1), which provides direct<br />
lithological control for the observed reflectivity<br />
and well-documented acoustic properties of the<br />
Outokumpu rocks (Heinonen et al. 2011, Kern et al.<br />
2009, Elbra et al. 2011, Aalto et al. 2011) to be used<br />
in forward modelling. In addition to seismic profile<br />
OKU1, forward modelling results are also presented<br />
for the Kylylahti mine area at the northeastern end<br />
of the Outokumpu area (Fig. 1), where the complex<br />
3D geometry – e<strong>sp</strong>ecially the occasionally nearvertical<br />
orientation of the Outokumpu assemblage<br />
rock units - poses a challenge for surface seismic<br />
data acquisition. Then, seismic reflection profile<br />
V7 is used as an example of another strongly reflective<br />
unit present in the Outokumpu area in addition<br />
to the Outokumpu assemblage rocks, i.e.,<br />
the Archaean basement and overlying Proterozoic<br />
supracrustal rocks, and how the true orientation of<br />
the reflectors obtained from a 2D seismic reflection<br />
section can be analysed with the help of surface<br />
geological data. Finally, the implications of all these<br />
results for seismic ore exploration in the Outokumpu<br />
area are discussed.<br />
Initial seismic forward modelling results for the<br />
seismic reflection profile V7 have been discussed<br />
in Heinonen et al. (this volume). For background<br />
geology, the reader is referred to Koistinen (1981),<br />
Park et al. (2004), Kontinen et al. (2006), Peltonen<br />
et al. (2008) and Aatos et al. (this volume).<br />
34
Geological Survey of Finland, Special Paper 59<br />
Seismic ore exploration in the Outokumpu area, Eastern Finland:<br />
Constraints from seismic forward modelling and geometrical considerations<br />
SEISMIC REFLECTION SURVEYS IN THE OUTOKUMPU AREA<br />
Acquisition parameters of the Outokumpu seismic reflection data<br />
Altogether, 82 km of high-resolution seismic reflection<br />
profiles have been collected in the Outokumpu<br />
area (Fig. 1). From these, the vibroseis profiles<br />
OKU1, OKU2 and OKU3 were collected in 2002<br />
as a part of the project FIRE (FInnish Reflection<br />
Experiment 2003–2006, Kukkonen et al. 2006) and<br />
vibroseis profiles V1, V2, V3, V7 and V8 and explosion<br />
profile E1 in 2008 as a part of the project HIRE<br />
(HIgh REsolution reflection seismics for ore exploration<br />
2007–2010, Kukkonen et al. 2011, 2012).<br />
The project FIRE also includes a crustal-scale FIRE3<br />
profile that crosses the Outokumpu area. SFUE<br />
Vniigeofizika, Moscow, Russia, worked as the seismic<br />
contractor for all these surveys. The seismic<br />
reflection survey profiles are di<strong>sp</strong>layed in Figure 1<br />
on a geological map of the Outokumpu area, and<br />
the acquisition parameters for the high-resolution<br />
FIRE and HIRE surveys have been presented in Table<br />
1. The acquisition of these Outokumpu seismic<br />
reflection data has been explained in more detail by<br />
Kukkonen et al. (2012).<br />
For the interpretation of seismic reflection data,<br />
it is essential to know the size of the structures<br />
that are resolvable given the acquisition parameters<br />
used in the surveys. The dominant frequency<br />
of the high-resolution FIRE profiles (OKU1, OKU2<br />
and OKU3) is about 80 Hz, and that of the HIRE<br />
profiles (V1–V8 and E1) about 100 Hz. Using the<br />
Rayleigh quarter-wavelength criterion (Widess<br />
1973) for an assumed average P-wave velocity of<br />
6000 m/s (typical velocity for the Outokumpu<br />
area; see below for more), the vertical resolution,<br />
i.e., the ability to resolve the top and bottom of a<br />
layer, is about 20 m for the FIRE data and 15 m for<br />
the HIRE data. However, thin layers (down to 2–3<br />
m) could be detectable if the signal-to-noise ratio<br />
and impedance contrasts are sufficiently high, and<br />
the boundary has sufficient lateral continuity (e.g.,<br />
Yilmaz 2001). Using the Fresnel zone criterion<br />
(e.g., Yilmaz 2001) for given depths of 500 m and<br />
1000 m, the horizontal resolution of unmigrated<br />
stacked data is re<strong>sp</strong>ectively about 270 m and 390 m<br />
Table 1. Acquisition parameters for the Outokumpu high-resolution seismic reflection profiles shown in Figure 1<br />
(modified from Kukkonen et al. 2012). Vibroseis profiles OKU1, OKU2 and OKU3 were collected in 2002 as a part of<br />
the project FIRE (FInnish Reflection Experiment 2003–2006, Kukkonen et al. 2006) and vibroseis profiles V1, V2,<br />
V3, V7 and V8 and explosion profile E1 in 2008 as a part of the project HIRE (HIgh REsolution reflection seismics<br />
for ore exploration 2007–2010, Kukkonen et al. 2011, 2012).<br />
FIRE<br />
HIRE<br />
Vibroseis<br />
OKU1, OKU2, OKU3<br />
Vibroseis<br />
V1, V2, V3, V7, V8<br />
Explosion<br />
E1<br />
Recording system I/O-2 I/O-4<br />
Acquisition geometry<br />
Symmetrical,<br />
Symmetrical, <strong>sp</strong>lit <strong>sp</strong>read<br />
<strong>sp</strong>lit <strong>sp</strong>read<br />
Spread length 7775–11825 m 5012.5 m 3500 m<br />
Number of active channels 312–474 402 280<br />
Geophone type<br />
GS-20DX (Fres = 10 Hz) GS-20DX (Fres = 10 Hz)<br />
Number of geophones in a group 12 6 3 or 6<br />
Geophone group length 25 m 12.5 m<br />
Geophone group <strong>sp</strong>acing 25 m 12.5 m<br />
Seismic source 3 x Geosvip 15.4 t 3 x Geosvip 14.5 t 125–250 g dynamite<br />
Source <strong>sp</strong>acing 50 m 25 or 50 m 50 m<br />
Number of sweeps/ shots/point 8 6 1<br />
Shot hole depth 2.5 m<br />
Sweep frequencies 20–130 Hz 30–165 Hz<br />
Sweep length 12 s 16 s<br />
Listening time 18 s 24 s 6 s<br />
Recording time after correlation 6 s 6 s<br />
Sampling interval 1 ms 1 ms<br />
35
Geological Survey of Finland, Special Paper 59<br />
Kari Komminaho, Emilia Koivisto, Pekka J. Heikkinen, Hilkka Tuomi, Niina Junno and Ilmo Kukkonen<br />
for the FIRE data and 240 m and 350 m for the<br />
HIRE data. Nevertheless, objects smaller than the<br />
Fresnel zone can produce diffractions, and successful<br />
migration can collapse the Fresnel zone<br />
to approximately the dominant wavelength, thus<br />
increasing the horizontal resolution to at least the<br />
dominant wavelength (or half of that). However,<br />
it should be noted that the presence of migrationvelocity<br />
errors and noise adversely affects migration,<br />
and could significantly degrade the horizontal<br />
resolution.<br />
Data processing<br />
All the Outokumpu seismic reflection profiles have<br />
been commercially processed by the Russian company<br />
SFUE Vniigeofizika. Generally, these commercially<br />
processed sections are of good quality<br />
and have been used for the interpretations presented<br />
by Kukkonen et al. (2012) and Saalmann<br />
& Laine (2014). However, the quality can be further<br />
enhanced via reprocessing, as also previously<br />
documented by Koivisto et al. (2012) and Heinonen<br />
et al. (2013) with HIRE seismic reflection data sets<br />
from Kevitsa and Vihanti mining and exploration<br />
camps. Specifically, good control of the processing<br />
parameters is required for the comparisons<br />
between the real and simulated data. In this work,<br />
the seismic reflection profile OKU1 was chosen as<br />
the main focus of the reprocessing efforts, because<br />
the seismic forward modelling also focused along<br />
profile OKU1. Profiles OKU2 and OKU3 were also<br />
reprocessed with similar processing flows to that<br />
of OKU1. Reprocessing of seismic reflection profile<br />
V7, also conducted as a part of the overall project,<br />
has been reported by Aihemaiti (2014).<br />
In the reprocessing sequence of OKU1, <strong>sp</strong>ecific<br />
emphasis was given on finding the optimal geometry<br />
of the CMP line (Common Mid-Point line, i.e.,<br />
the processing line) for the crooked-line survey geometry,<br />
on static corrections in order to compensate<br />
for near-surface time delays caused by variations<br />
in the low-velocity weathering layer, and due<br />
to the highly variable bedrock velocities, on detailed<br />
velocity analysis. Amplitudes were first corrected<br />
for geometrical <strong>sp</strong>reading, and each trace was balanced<br />
with a slowly time-varying scalar before and<br />
after stacking. This simple balancing procedure<br />
was preferred over the commonly used automatic<br />
gain control or other similar nonlinear processes,<br />
which destroy relative amplitude information and<br />
can alter the frequency content of the traces. The<br />
final sections were then migrated using the Stolt<br />
f-k migration algorithm (Stolt & Benson 1986) employing<br />
a 1D velocity model that was derived from<br />
the velocity analysis of the data by obtaining the<br />
optimal stacking velocity function for approximately<br />
horizontal reflectors. The same velocity<br />
Table 2. Processing sequence of profile OKU1.<br />
36
Geological Survey of Finland, Special Paper 59<br />
Seismic ore exploration in the Outokumpu area, Eastern Finland:<br />
Constraints from seismic forward modelling and geometrical considerations<br />
function, with root-mean-square velocities varying<br />
from 5400 to 6200 m/s, was also used for the<br />
final time-to-depth conversion. The processing<br />
flow of the profile OKU1 is presented in Table 2.<br />
Seismic surveys in hard rock environments are<br />
typically so-called crooked-line surveys, i.e., the<br />
survey profiles are not straight, but more or less<br />
crooked because the surveys are forced to follow<br />
existing roads for logistical and economic reasons.<br />
This is also the case in Outokumpu. Crooked-line<br />
seismic data challenge many common processing<br />
tools, which are based on straight-line geometry<br />
(e.g., Schmelzbach et al. 2007, Malehmir et al.<br />
2009). A critical step in crooked-line processing<br />
is the choice of a CMP processing line to represent<br />
the subsurface reflection points, which can<br />
potentially have a significant impact on the final<br />
results (e.g., Koivisto et al. 2012). To test the effect<br />
of the CMP processing line choice, OKU1 was<br />
processed along three different CMP lines: along a<br />
line closely following the survey line (which is here<br />
used to present the results of this work), along a<br />
more smoothly varying processing line always<br />
approximately in the middle of the cloud defined<br />
by the source–receiver midpoints, and also along<br />
a processing line that was as straight as possible<br />
(Fig. 2). Shallow reflections at depths of less than<br />
a few hundred meters are generally better imaged<br />
and located along the processing line closer to the<br />
survey line. This is because for crooked survey-line<br />
Fig. 2. The CMP geometries tested in the processing. For presenting the results of this work, the CMP processing<br />
line following the survey geometry as closely as possible was chosen (black line). The CMP locations along this<br />
CMP line have been indicated on the map to aid comparisons with Figures 5, 7, 8 and 9.<br />
37
Geological Survey of Finland, Special Paper 59<br />
Kari Komminaho, Emilia Koivisto, Pekka J. Heikkinen, Hilkka Tuomi, Niina Junno and Ilmo Kukkonen<br />
geometry, the source–receiver midpoints of traces<br />
associated with shorter offsets, and thus potentially<br />
including shallower reflections, always lie<br />
closer to the survey line. Consequently, shallow<br />
reflections are more likely to stack constructively<br />
along processing lines more closely following the<br />
actual survey geometry. On the other hand, it is<br />
the source–receiver midpoints of traces associated<br />
with larger source–receiver offsets, and thus<br />
containing deeper information, that deviate most<br />
from the survey geometry. Depending on the geometrical<br />
relationship between the survey line and<br />
the CMP processing line, the midpoint distribution<br />
may be such that a CMP line approximately<br />
in the middle of the distribution may allow, on<br />
average, better imaging of some deeper reflections;<br />
however, this comes at the cost of losing the<br />
shallow reflections. Nevertheless, the final results<br />
were similar for all our CMP processing line tests.<br />
For presenting the results of this work, the CMP<br />
processing line following the survey geometry as<br />
closely as possible (Fig. 2) was chosen.<br />
SEISMIC FORWARD MODELLING<br />
Crystalline bedrock is a challenging environment<br />
for seismic forward modelling, in particular at the<br />
ore deposit scale. This is because the structures involved<br />
tend to have a very complex geometry and<br />
heterogeneous petrophysical properties due to<br />
their complicated geological history, and because<br />
the dimensions of the ore bodies, if present, are<br />
typically comparable to seismic wavelengths. This<br />
means that approximative methods, e.g. those<br />
based on ray tracing (e.g.,Č Červeny 2005) or Born<br />
approximation (e.g., Eaton 1997), are not suitable<br />
as they do not handle diffractions and the scattering<br />
of seismic waves from a heterogeneous medium<br />
and small objects. For example, results presented<br />
by Bohlen et al. (2003) indicate that massive sulphide<br />
ore bodies produce a strong and complex<br />
scattering re<strong>sp</strong>onse characterized by strong dependence<br />
on azimuth and offset, as well as phase<br />
reversals. Consequently, fully elastic algorithms<br />
are required for accurate seismic forward modeling,<br />
e<strong>sp</strong>ecially at the ore deposit scale.<br />
In this study we used Sofi2D/3D, a parallel finite<br />
difference (FD) code which implements 2D/3D<br />
full waveform viscoelastic wave equations (Bohlen<br />
2002). The code shows good performance on massive<br />
parallel supercomputers, which makes the<br />
computation of very large grids feasible.<br />
Modelling scheme<br />
The geological models were created using the inhouse<br />
program MODEL. In MODEL, the geological<br />
models are constructed by cubic <strong>sp</strong>line interfaces<br />
defining the geometry of different formations and<br />
rock units. The petrophysical parameter distribution<br />
(P-wave velocity, S-wave velocity, density)<br />
associated with the model is also defined by cubic<br />
<strong>sp</strong>lines, and can be varied in the desired way. There<br />
are no limits to the number or complexity of interfaces.<br />
3D geometries and models are formed by the<br />
scaling and rotation of interfaces between 2D sections<br />
using program codes developed in this project.<br />
The final grid of seismic velocities and density<br />
is then discretized from the original model to the<br />
desired grid <strong>sp</strong>acing for the FD seismic forward<br />
modelling code. Below, the construction of the geological<br />
models and assigning of the petrophysical<br />
parameters for OKU1 and the Kylylahti area are described<br />
in more detail.<br />
In FD modelling two factors are crucial: discretization<br />
in <strong>sp</strong>ace and sampling in time. These parameters<br />
have to be small enough to guarantee<br />
accuracy and stability of the calculations, but they<br />
also should be as large as possible to guarantee efficient<br />
computing because they control the computing<br />
time. In our case, we have used grid point<br />
<strong>sp</strong>acing of 2.0-2.5 meters to meet the requirements<br />
of numerical calculation accuracy and to<br />
be able to model small details like ore lenses. The<br />
sampling interval used is 1.6e-4 s.<br />
For running Sofi2D/3D, free surface condition<br />
was used at the top of the model. Absorbing<br />
boundary conditions based on exponential wave<br />
field damping were applied at the bottom and side<br />
boundaries of the model to minimize wave fields<br />
reflecting back from these boundaries. All synthetic<br />
sections di<strong>sp</strong>lay the divergence of the particle<br />
velocity field.<br />
38
Geological Survey of Finland, Special Paper 59<br />
Seismic ore exploration in the Outokumpu area, Eastern Finland:<br />
Constraints from seismic forward modelling and geometrical considerations<br />
OKU1 profile<br />
Seismic signature of the Outokumpu assemblage<br />
along OKU1<br />
Kukkonen et al. (2012) have suggested that most<br />
of the reflectivity within the uppermost 2 km of<br />
high-resolution seismic reflection sections OKU1,<br />
OKU2 and OKU3 (as well as V1–V8 and E1) could be<br />
due to bodies of the potentially ore-bearing Outokumpu<br />
assemblage rocks, i.e., serpentinites, and<br />
carbonate, skarn and quartz rocks enveloped by<br />
black schists and enclosed within rather homogeneous<br />
mica schists (Figs. 1 and 3). This conclusion<br />
is based on the known surface geological features<br />
and drill-hole data, in particular the 2.5-km-deep<br />
Outokumpu Deep Drill Hole. At the depth of about<br />
1.3 km, the Outokumpu Deep Drill Hole intersects a<br />
previously unknown, approximately 200-m-thick<br />
body of the Outokumpu assemblage rocks, which<br />
correlates well with the onset of the strongly reflective<br />
package on the seismic reflection section<br />
OKU1, a package that can also be followed along<br />
the seismic reflection profiles OKU2 and OKU3<br />
(Fig. 3). Furthermore, density and seismic velocity<br />
data from the Outokumpu Deep Drill Hole, i.e.,<br />
geophysical logging data and laboratory measurements<br />
reported by Heinonen et al. (2011), Kern et<br />
al. (2009) and Elbra et al. (2011), indicate a strong<br />
contrast in acoustic impedance (product of density<br />
and seismic velocity) between the Outokumpu assemblage<br />
rocks and the surrounding mica schists,<br />
as well as strongly varying acoustic impedances of<br />
the various Outokumpu assemblage rocks as the<br />
cause of the internally reflective appearance of the<br />
units (Figs. 3 and 4).<br />
The near surface structures of our 3D geological<br />
model, used for seismic forward modelling, are<br />
based on the geological cross-sections by Koistinen<br />
(1981). The model has been continued to greater<br />
depths by creating a model of the deeper units<br />
from the seismic reflection data, based on the rock<br />
units observed in the Outokumpu Deep Drill Hole<br />
(Figs. 3 and 5). Besides Outokumpu assemblage<br />
rocks, metagabbro and amphibolite could be the<br />
cause of reflectivity in the Outokumpu mica schist<br />
Fig. 3. 3D view from south showing seismic reflection profiles OKU1–OKU3 (Fig. 1), the location of the Outokumpu<br />
Deep Drill Hole (R2500) and geological cross-sections 189.900, 192.000 and 194.500 by Koistinen (1981)<br />
(green: serpentinite, yellow: quartz rock; lilac: black schist). The depth range of Outokumpu assemblage rocks<br />
intersected by the Outokumpu Deep Drill Hole is indicated by a black dashed line along OKU1, with the continuation<br />
of the same unit along OKU2 also indicated by a black dashed line. The seismic sections have been presented<br />
as variable area plots of averaged instantaneous amplitude and di<strong>sp</strong>layed on a dB scale in the background as a<br />
colour-coded map.<br />
39
Geological Survey of Finland, Special Paper 59<br />
Kari Komminaho, Emilia Koivisto, Pekka J. Heikkinen, Hilkka Tuomi, Niina Junno and Ilmo Kukkonen<br />
Fig. 4. Average density and P-wave velocity for the different rock types of the Outokumpu Deep Drill Hole (R2500<br />
in Fig. 1) derived from gamma-gamma density and sonic logging (Heinonen et al. 2011), with standard deviations<br />
presented as error bars. These data indicate strong contrasts in acoustic impedance (product of density and seismic<br />
velocity) between the Outokumpu assemblage rocks, the black schists enveloping them and the surrounding<br />
mica schists, as well as strongly varying acoustic impedances of the various Outokumpu assemblage rocks. The<br />
massive sulphide mineralizations have a distinctly higher density, and therefore acoustic impedance, than the<br />
other rock types. The properties of the Outokumpu-type massive sulphide mineralization were theoretically<br />
calculated based on the average composition of the Keretti deposit (Fig.1, Peltola 1978, Peltonen et al. 2008,<br />
see Kukkonen et al. 2012 for details), because the Outokumpu Deep Drill Hole does not penetrate any sulphide<br />
mineralization. Furthermore, the average values for amphibolites and metagabbro have been adapted from Kern<br />
(2009) and Salisbury et al. (2003), re<strong>sp</strong>ectively, as no representative P-wave velocity measurements are available<br />
for these rock types from the Outokumpu Deep Drill Hole. However, the average densities of amphibolites<br />
and metagabbros (Leväniemi, this volume) in the general Outokumpu area are very close to the average densities<br />
listed in these sources. Constant impedance curves (black lines) are shown for reference. A difference between<br />
two lines should be enough for a detectable reflection. .<br />
environments (see Fig. 4). For comparing the<br />
seismic re<strong>sp</strong>onses from different sources, some<br />
metagabbro and amphobolite were added to the<br />
northwestern lower part of the model. The transformation<br />
to 3D was carried out for the near surface<br />
part by interpolating rock units along strike<br />
to agree with the geological cross-sections presented<br />
by Koistinen (1981) ~1.8 km apart (see Fig. 1<br />
for the locations of the cross-sections). For deeper<br />
units, the transformation was based on the surface<br />
part and 3D correlation of the same reflectivity<br />
unit along the seismic reflection sections OKU1,<br />
OKU2 and OKU3. P-wave velocities and densities<br />
are averages for the rock units as obtained from<br />
the Outokumpu Deep Drill Hole geophysical logging<br />
data (Heinonen et al. 2011), complemented by<br />
values from the literature for the amphibolites and<br />
metagabbros (Kern 2009, Salisbury et al. 2003), as<br />
shown in Figure 4. S-wave velocities are theoretical,<br />
because no logging data for S-wave velocities<br />
are available. Theoretically, the S-wave velocity in<br />
crystalline bedrock can be calculated by dividing<br />
the P-wave velocity values by 1.732 (e.g., Salisbury<br />
et al. 2003).<br />
The seismic forward modelling results for the 3D<br />
geological model described above are presented in<br />
Figure 5. Seismic forward modelling was carried out<br />
with the real survey geometry of OKU1. The modelled<br />
shot gathers were processed with the same<br />
processing sequence (listed in Table 2) as used<br />
for obtaining the stacked section of the real OKU1<br />
shown in Figure 5C, as applicable (adding the CMP<br />
geometry, muting of air waves and first arrivals,<br />
NMO corrections and stacking). The main features<br />
of real OKU1 profile are visible in the synthetic<br />
data, confirming that the Outokumpu assemblage<br />
40
Geological Survey of Finland, Special Paper 59<br />
Seismic ore exploration in the Outokumpu area, Eastern Finland:<br />
Constraints from seismic forward modelling and geometrical considerations<br />
Fig. 5. A) A cross-section (location of the cross-section shown in Fig. 1) of the 3D geological model used for seismic<br />
forward modelling in the OKU1 area. Near the surface, the model has been derived from the digitized crosssections<br />
of Koistinen (1981); lower parts have been interpreted from the 2D seismic reflection data based on the<br />
rock units observed in the Outokumpu Deep Drill Hole. Some metagabbro and amphobolite were added to the<br />
northwestern lower part of the model for a comparison. The area inside the large red rectangle corre<strong>sp</strong>onds to<br />
the sections shown in this figure and in Figures 7 and 8. The area inside the small red rectangle corre<strong>sp</strong>onds to<br />
the sections shown in Figure 9. The black dashed rectangles indicate close-ups of the geological model presented<br />
in Figure 6. R2500 indicates the location of the Outokumpu Deep Drill Hole. B) Forward modelling results for the<br />
model presented in A. Modelling has been carried out with the real survey geometry of OKU1. The modelled shot<br />
gathers have been processed with the same processing sequence as used for obtaining the stacked section of<br />
the real OKU1 shown in Figure C, as applicable (adding the CMP geometry, muting of air waves and first arrivals,<br />
NMO corrections and stacking). C) The processed CMP stack of OKU1. The processing sequence used for the data<br />
is provided in Table 2. While there are differences, the reflection events marked by R1, R2, R3 in the OKU1 section<br />
in Figure C are generally in good agreement with the simulated ones presented in Figure B (see text for more<br />
details). The CMP locations are indicated on the map of Figure 2.<br />
41
Geological Survey of Finland, Special Paper 59<br />
Kari Komminaho, Emilia Koivisto, Pekka J. Heikkinen, Hilkka Tuomi, Niina Junno and Ilmo Kukkonen<br />
rocks can be identified from the seismic sections<br />
as internally strongly reflective packages (see reflections<br />
marked by R2 in Figs. 5B and 5C). However,<br />
the real observed reflectivity patterns shown in<br />
Figure 5C have not been completely reproduced in<br />
the synthetic section presented in Figure 5B. This<br />
naturally means that the geological model (Fig. 5A)<br />
used for seismic forward modelling is not 100%<br />
correct. For example, the upper reflection package<br />
marked by R3 in Figures 5B and 5C is more complex<br />
in the modelled than in the real data. This indicates<br />
that in reality, the unit causing the observed upper<br />
reflection events is simpler than in our geological<br />
model (for example, just black schists within mica<br />
schists). In the scope of this study, further modifications<br />
to the geological model were not possible,<br />
and will be the focus of future work.<br />
Seismic signature of the Outokumpu-type sulphide<br />
deposits<br />
As discussed above, internal lithological contacts<br />
within the Outokumpu assemblage are strongly reflective<br />
(Figs. 3, 4 and 5). To examine the seismic<br />
re<strong>sp</strong>onse of the Outokumpu-type, typically semimassive<br />
to massive sulphide ore bodies within the<br />
Outokumpu assemblage, we added hypothetical ore<br />
bodies to our geological model. The Outokumputype<br />
sulphide deposits typically form thin, narrow<br />
and sharply bounded sheets, lenses or rods of<br />
semi-massive to massive sulphides, located along<br />
or close to the interfaces between black schists and<br />
quartz–carbonate rocks. For example, the footwall<br />
of the main Outokumpu (Keretti) ore body, discovered<br />
in 1910, was dominantly against quartz rocks,<br />
while at its hanging wall the ore body was in contact<br />
with serpentinite and skarn–carbonate rocks.<br />
The contacts of the ore body with the wall rocks<br />
are typically very sharp (Peltonen et al. 2008). Accordingly,<br />
our hypothetical ore bodies (Fig. 6) have<br />
been placed in contact with quartz rock, skarn and<br />
serpentinite, and just for a theoretical comparison,<br />
also between amphibolites and metagabbros. Our<br />
ore bodies are 12–16-m-thick and 75–120-m-wide<br />
lenses, with a length <strong>sp</strong>anning the whole length of<br />
the 3D geological model (about 1 km) perpendicular<br />
to the cross-section shown in Figure 5A. For a comparison,<br />
the main Outokumpu (Keretti) ore body<br />
was a sheet of semi-massive to massive sulphides<br />
∼4 km long, 50–350 m wide and up to 30–40 m<br />
thick (on average ∼10 m) (Peltonen et al. 2008, Papunen<br />
1987). Petrophysical values for the ore bodies<br />
are from Kukkonen et al. (2012), i.e., a P-wave<br />
velocity of 5900 m/s and density of 3800 kg/m 3 (Fig.<br />
4). With these seismic velocity and density values,<br />
the ore should have a sufficient acoustic impedance<br />
contrast with all the Outokumpu assemblage<br />
rocks to produce a detectable reflection (Fig. 4).<br />
Fig. 6. Close-ups of sections in Figure 5A, in which the sections shown here are indicated by dashed black rectangles.<br />
Here, the geological model additionally involves four 12–16-m-thick and 75–120-m-wide sulphide lenses<br />
striking perpendicular to the cross-section presented in the figure, across the whole 3D geological model. Our<br />
test ore bodies have been placed between quartz rock, skarn and serpentinite, and for a comparison also in contact<br />
with amphibolites and metagabbros. Otherwise, the geological model is the same as in Figure 5A. The colour<br />
scheme used for the lithologies is the same as in Figure 5.<br />
42
Geological Survey of Finland, Special Paper 59<br />
Seismic ore exploration in the Outokumpu area, Eastern Finland:<br />
Constraints from seismic forward modelling and geometrical considerations<br />
Fig. 7. A) Forward modelling<br />
results for the geological model<br />
presented in Figure 5 without<br />
ore bodies. B) Forward modelling<br />
results for the geological<br />
model presented in Figure 6<br />
with the hypothetical ore bodies.<br />
C) Residual re<strong>sp</strong>onse of<br />
the ore derived by subtracting<br />
the stack obtained without the<br />
hypothetical ore bodies shown<br />
in Figure 7A from the stack<br />
obtained with the ore bodies<br />
and shown in Figure 7B. D) An<br />
amplitude envelope image of<br />
the stack di<strong>sp</strong>layed in Figure<br />
7B (black and dark grey tones<br />
showing high and white and<br />
light grey tones low amplitudes,<br />
re<strong>sp</strong>ectively). The signals<br />
produced by the ore bodies<br />
in Figure 6 are shown with<br />
labels ORE1–ORE4. To produce<br />
these sections, modelling of<br />
shot gathers was carried out<br />
with the real survey geometry<br />
of OKU1. The shot gathers were<br />
then processed with the same<br />
processing sequence as also<br />
used to obtain the final stacked<br />
image of the real OKU1 presented<br />
in Figure 5C, as applicable for<br />
the synthetic data.<br />
43
Geological Survey of Finland, Special Paper 59<br />
Kari Komminaho, Emilia Koivisto, Pekka J. Heikkinen, Hilkka Tuomi, Niina Junno and Ilmo Kukkonen<br />
However, it should be noted that Kukkonen et al.<br />
(2012) theoretically calculated their P-wave velocity<br />
and density values based on the known average<br />
composition of Keretti deposit (Peltola 1978, Peltonen<br />
et al. 2008, location of the historical Outokumpu<br />
mine indicated in Fig. 1), as no representative<br />
direct measurements were available. For more<br />
detailed future work, direct density and seismic<br />
velocity measurements of the Outokumpu-type<br />
sulphide deposits as well as host rocks across the<br />
Outokumpu area are required.<br />
The seismic forward modelling results for the 3D<br />
geological model without (Fig. 5A) and with (Fig. 6)<br />
the hypothetical ore bodies are di<strong>sp</strong>layed in Figure<br />
7. Seismic forward modelling was conducted with<br />
the real crooked-line survey geometry of OKU1.<br />
The modelled shot gathers were then processed<br />
with the same processing sequence as used to obtain<br />
the stacked section of the real OKU1, as applicable<br />
for the synthetic data. As seen in Figure<br />
7C, which presents the residual re<strong>sp</strong>onse of the ore<br />
bodies only (derived by subtracting the stack obtained<br />
without the hypothetical ore bodies shown<br />
in Fig. 7A from the stack obtained with the ore<br />
bodies shown in Fig. 7B), diffractions are produced<br />
from all the hypothetical ore bodies. The strongest<br />
re<strong>sp</strong>onse is from the ore body placed in contact between<br />
serpentinite and quartz rocks (ORE4 in Figs.<br />
6, 7C and 7D), as expected based on the acoustic<br />
impedance contrasts shown in Figure 4. However,<br />
comparison of the stacks presented in Figures 7A<br />
and 7B indicates that the diffractions produced by<br />
the ore bodies are not easily distinguishable from<br />
the other reflective contacts within the Outokumpu<br />
assemblage, and the amplitude envelope image<br />
in Figure 7D shows that while all the hypothetical<br />
ore bodies within the Outokumpu assemblage<br />
rocks are associated with high-amplitude anomalies,<br />
there are also other high-amplitude anomalies.<br />
At least some of these appear to be associated<br />
with crooked-line effects (see Fig. 9 and discussion<br />
below). Therefore, any high-amplitude anomalies<br />
need to be interpreted with care.<br />
Migrated sections of the stacks di<strong>sp</strong>layed in Figure<br />
7 are presented in Figure 8. The migrated re<strong>sp</strong>onse<br />
from the ore is even more difficult to separate<br />
from the other reflective contacts within the<br />
Outokumpu assemblage than the re<strong>sp</strong>onse seen in<br />
the stacks.<br />
To test the effect of the crooked-line survey geometry<br />
and processing on the visibility of the ore<br />
bodies, seismic forward modelling was conducted<br />
for shot gathers with the real crooked-line survey<br />
geometry of OKU1 (results presented in Figs. 5<br />
to 8), as well as for shot gathers along a straight<br />
survey line approximating the survey geometry of<br />
OKU1, for a part of the geological model near the<br />
Outokumpu Deep Drill Hole (the part of the model<br />
indicated in Fig. 5A with the smaller red rectangle).<br />
The modelled shot gathers were processed with<br />
the same processing sequence as used to obtain<br />
the stacked section of the real OKU1, as applicable<br />
for the synthetic data. As seen in Figure 9, diffractions<br />
from the hypothetical ore bodies, labelled as<br />
ORE3 and ORE4 (Fig. 6), are visible in both stacked<br />
sections (Figs. 9A, 9B and 9C for straight survey<br />
geometry and Figs. 9D, 9E and 9F for crooked-line<br />
survey geometry). This can been seen most clearly<br />
in the residual re<strong>sp</strong>onse of the ore bodies in Figures<br />
9C and 9F, for the straight and crooked survey line,<br />
re<strong>sp</strong>ectively, derived by subtracting the ore-free<br />
stacks (Figs. 9A and 9D) from the ore-containing<br />
stacks (Figs. 9B and 9E). The residual re<strong>sp</strong>onse<br />
is similar for both stacks. This indicates that the<br />
seismic signature of the ore bodies is preserved in<br />
the crooked-line processing. However, it should be<br />
noted that the diffractions observed in Figures 9D,<br />
9E and 9F for the crooked-line survey geometry<br />
are smeared and less clear when compared to the<br />
diffractions observed in Figures 9A, 9B and 9C for<br />
the straight survey geometry, and that e<strong>sp</strong>ecially<br />
the shallow parts of the geological model (Outokumpu<br />
assemblage rocks near the surface based on<br />
the cross-sections by Koistinen (1981) in Fig. 5A)<br />
produce a more detailed re<strong>sp</strong>onse with the straight<br />
survey geometry. Furthermore, the crooked-line<br />
survey geometry and/or processing produces features<br />
that are not present in the stacks obtained<br />
for the straight survey geometry. For example,<br />
note the events marked by Rx in the stack obtained<br />
for the crooked-line survey geometry in Figure 9D.<br />
These events are not present in the stack obtained<br />
for the straight survey geometry (Fig. 9A). Such<br />
differences indicate that the crooked-line survey<br />
geometry and processing may neglect shallow signals<br />
and yield artefacts, and that the results therefore<br />
need to be approached with care (a subject for<br />
future research).<br />
44
Geological Survey of Finland, Special Paper 59<br />
Seismic ore exploration in the Outokumpu area, Eastern Finland:<br />
Constraints from seismic forward modelling and geometrical considerations<br />
Fig. 8. A) A migrated synthetic stack (stack shown in Fig. 7A) without ore bodies. B) A migrated synthetic stack<br />
(stack shown in Fig. 7B) with hypothetical ore bodies. C) The residual re<strong>sp</strong>onse of the ore derived by subtracting<br />
the migrated section in Figure 8A from the migrated section in Figure 8B. The residual signals produced by the<br />
ore bodies (Fig. 6) are identified with labels ORE1-ORE4.<br />
45
Geological Survey of Finland, Special Paper 59<br />
Kari Komminaho, Emilia Koivisto, Pekka J. Heikkinen, Hilkka Tuomi, Niina Junno and Ilmo Kukkonen<br />
Fig. 9. A) A synthetic stack obtained with straight-line survey geometry following the dashed straight line shown<br />
in yellow in Figure 1 (i.e., the location of the cross section presented in Fig. 5A) for the geological model in Figure<br />
5A (without the ore bodies). The part of the geological model presented in this set of figures is indicated with the<br />
smaller red rectangle in Figure 5A. B) A synthetic stack obtained with straight-line survey geometry approximating<br />
the real geometry of OKU1 for the geological model presented in Figure 6 (with the ore bodies). C) The<br />
residual re<strong>sp</strong>onse of the ore derived by subtracting the stack in Figure 9A from the stack in Figure 9B. The signals<br />
produced by the ore bodies numbered in Figure 6 have been identified with labels ORE3 and ORE4. D) A synthetic<br />
stack obtained with the real crooked-line survey geometry of OKU1 for the geological model presented in Figure<br />
5A (without the ore bodies). E) A synthetic stack obtained with the real crooked-line survey geometry of OKU1<br />
for the geological model presented in Figure 6 (with the ore bodies). F) The residual re<strong>sp</strong>onse of the ore derived<br />
by subtracting the stack in Figure 9D from the stack in Figure 9E.<br />
46
Geological Survey of Finland, Special Paper 59<br />
Seismic ore exploration in the Outokumpu area, Eastern Finland:<br />
Constraints from seismic forward modelling and geometrical considerations<br />
Seismic re<strong>sp</strong>onse of the near-vertical Kylylahti formation<br />
Currently, the Kylylahti mine run by Boliden is the<br />
only operational sulphide mine in the Outokumpu<br />
area. At Kylylahti (as also elsewhere in the Outokumpu<br />
area), the Outokumpu assemblage rocks<br />
hosting the ore show multiple phases of deformation<br />
with strong foliations, faulting and folding. The<br />
Cu–Co–Zn–Ni–Ag–Au mineralization is located in<br />
a tight synformal fold along the near-vertical eastern<br />
limb of the Kylylahti formation (Fig. 10). The<br />
Kylylahti deposit comprises three north-northeast<br />
elongated semi-massive–massive sulphide<br />
lenses along the contact of the carbonate–skarn–<br />
quartz rocks and the black schists (Fig. 10). The total<br />
length of the mineralized zone is about 1.5 km.<br />
Whether the deposit continues to greater depths<br />
towards the south is not yet known. The deepest<br />
and largest one of the subvertically oriented ore<br />
lenses has a maximum height of approximately<br />
150 m, and a thickness ranging between 5 and 60<br />
m. Our geological model for the Kylylahti deep ore<br />
body (Fig. 10) is based on a geological cross section<br />
presented in Kontinen et al. (2006). In the seismic<br />
forward modelling, the east-west section is for<br />
simplicity assumed to keep its geometry constant<br />
in the north-south direction. The petrophysical<br />
values used in the seismic forward modeling were<br />
the same as used for modeling along the OKU1 profile<br />
(Fig. 4).<br />
In Figures 11 and 12 snapshots of the P-wave<br />
field (divergence of the particle velocity field) are<br />
shown for a shot located at the surface and for another<br />
located in a borehole at the depth of 500 m,<br />
re<strong>sp</strong>ectively, for the Kylylahti geological model<br />
(presented in Fig. 10). Also shown in Figures 11 and<br />
12 are residual wave fields obtained by extracting<br />
the wave field of a geological model without the<br />
ore from the wave field of the geological model<br />
with the ore presented in Figure 10. In the case<br />
Fig. 10. The geological model used for the Kylylahti seismic forward modeling (modified from Fig. 74 in Kontinen<br />
et al. 2006). The location of the cross section is indicated on the geological map of Figure 1.<br />
47
Geological Survey of Finland, Special Paper 59<br />
Kari Komminaho, Emilia Koivisto, Pekka J. Heikkinen, Hilkka Tuomi, Niina Junno and Ilmo Kukkonen<br />
of the surface shot (Fig. 11), most of the scattered<br />
energy is directed downwards through the ore body<br />
and only a minor part is scattered to the sides. Almost<br />
no energy is scattered upwards back to surface.<br />
In this case, there is no recordable re<strong>sp</strong>onse<br />
of the ore at the surface and only a weak re<strong>sp</strong>onse<br />
in borehole receivers. This illustrates well the difficulty<br />
in observing near-vertical contacts from<br />
surface seismic data. In the case of a borehole shot<br />
(Fig. 12), clear P-waves are scattered back from the<br />
ore towards to the shot location and would be recordable<br />
with borehole receivers.<br />
Fig. 11. (A) Snapshots for a surface shot at t ~ 0.097 s, for the full wave field obtained from the geological model<br />
presented in Figure 10 and the residual wave field obtained by extracting the wave field of a geological model<br />
without the ore from the wave field of the geological model with the ore shown in Figure 10 (i.e., residual re<strong>sp</strong>onse<br />
of the ore). (B) Snapshots for a surface shot at t ~ 0.131 s. The shot point location is indicated by a red star.<br />
48
Geological Survey of Finland, Special Paper 59<br />
Seismic ore exploration in the Outokumpu area, Eastern Finland:<br />
Constraints from seismic forward modelling and geometrical considerations<br />
Fig. 12. (A) Snapshots for a borehole shot at t ~ 0.079 s, for the full wave field obtained from the geological<br />
model presented in Figure 10 and the residual wave field obtained by extracting the wave field of a geological<br />
model without the ore from the wave field of the geological model with the ore shown in Figure 10 (i.e., residual<br />
re<strong>sp</strong>onse of the ore). (B) Snapshots for a borehole shot at t ~ 0.107 s. The shot point location in the borehole is<br />
indicated by a red star.<br />
49
Geological Survey of Finland, Special Paper 59<br />
Kari Komminaho, Emilia Koivisto, Pekka J. Heikkinen, Hilkka Tuomi, Niina Junno and Ilmo Kukkonen<br />
Effect of petrophysical variation on the seismic re<strong>sp</strong>onse of the Outokumpu assemblage and<br />
Outokumpu-type sulphide deposits<br />
Reliable knowledge on the densities and seismic<br />
velocities is crucial for successful seismic forward<br />
modeling. The gamma-gamma density and sonic<br />
logging data from the Outokumpu Deep Drill Hole<br />
(Heinonen et al. 2011) provide a good basis for modeling<br />
along OKU1. Gravimetric density measurements<br />
are available for samples across the Outokumpu<br />
area (Leväniemi, this volume), however, in<br />
addition to the sonic logging data from the Outokumpu<br />
Deep Drill Hole, only some laboratory<br />
measurements of P-wave velocities for samples<br />
from the Saarivaara area (Fig. 1) were available for<br />
this work, including mainly data for a Proterozoic<br />
supracrustal sequence on the top the Archaean<br />
basement underlying the Outokumpu allochthon<br />
(Kontinen & Säävuori 2013). Thus, we have also used<br />
the densities and P-wave velocities of the Outokumpu<br />
Deep Drill Hole for the Kylylahti seismic<br />
forward modelling.<br />
However, based on the available petrophysical<br />
data across the Outokumpu area, i.e., in particular<br />
the density measurements (Leväniemi, this volume),<br />
it is clear that the petrophysical characteristics<br />
of the Outokumpu assemblage rocks and Outokumpu-type<br />
sulphide mineralizations vary, and<br />
consequently are expected to affect the seismic<br />
re<strong>sp</strong>onse. In particular, the relative amplitudes<br />
produced by the internal contacts within the Outokumpu<br />
assemblage are likely to vary across the<br />
area. Furthermore, if the density and seismic velocity<br />
properties of the Outokumpu-type ores are<br />
assumed approximately the same across the study<br />
area, then the implied higher density values of<br />
the Outokumpu assemblage rocks in the Kylylahti<br />
mine area (Leväniemi, this volume) in the east decrease<br />
the acoustic impedance contrasts between<br />
the Outokumpu assemblage rocks and the ore bodies<br />
when compared to the western part of the Outokumpu<br />
area (where the Outokumpu Deep Drill<br />
Hole is located and where the parameters for the<br />
modeling work presented here thus come from).<br />
The contrasts should still be enough to cause detectable<br />
reflected signals. However, as also the<br />
composition of the sulphide mineralizations (in<br />
particular, with changing contents of pyrite and<br />
pyrrhotite, which are characterized with high and<br />
low seismic velocities, re<strong>sp</strong>ectively) varies across<br />
the Outokumpu area, the relative strengths of the<br />
expected signals need to be further investigated.<br />
Currently there are simply not enough density, and<br />
e<strong>sp</strong>ecially seismic velocity measurements, to really<br />
understand the detailed variation in the seismic<br />
signature of the Outokumpu assemblage and the<br />
Outokumpu-type sulphide mineralizations across<br />
the whole area. Such measurements are crucial for<br />
the success of any future project focusing on seismic<br />
exploration in the Outokumpu area.<br />
THE CAUSE OF REFLECTIVITY ALONG SEISMIC REFLECTION PROFILE V7<br />
A major problem with seismic reflection surveys<br />
in areas of crystalline bedrock is the complexity of<br />
the structures, which can only be properly imaged<br />
by using expensive 3D acquisition geometry. However,<br />
because of the tyranny of costs, in most cases<br />
we have to be satisfied with 2D reflection surveys.<br />
The location and orientation of a reflector observed<br />
in a seismic section acquired along a 2D profile can<br />
only be determined with re<strong>sp</strong>ect to the profile: all<br />
structures that are cylindrically symmetrical with<br />
re<strong>sp</strong>ect to the profile will give a similar seismic image.<br />
To estimate the true attitude of a reflector seen<br />
in a 2D section, we need additional information. If<br />
two crossing survey line image the same reflector,<br />
the true dip and strike can be determined. Unfortunately,<br />
this can only be applied in the vicinity of<br />
the crossing point; quite often, the reflectors cannot<br />
reliably be continued very far. The second possibility<br />
arises if the survey line is suitably crooked<br />
(Nedimovic and West 2003a, 2003b, Schmelzbach<br />
et al. 2007). Then, the lateral <strong>sp</strong>read of the source–<br />
receiver midpoints can potentially be used to estimate<br />
the cross-dip of a reflector. The cross-dip<br />
here is defined as the angle of the reflector from<br />
the horizontal in the plane perpendicular to the<br />
seismic profile. The third option is to utilize the information<br />
provided by geological mapping or drilling,<br />
which is what was used to analyse the origin of<br />
the reflectivity patterns observed along the seismic<br />
reflection profile V7.<br />
Figure 13 presents the migrated and depth-converted<br />
section of the seismic reflection profile V7<br />
(see Fig. 1 for the location), di<strong>sp</strong>laying two groups<br />
of cross-cutting reflected signals with different<br />
50
Geological Survey of Finland, Special Paper 59<br />
Seismic ore exploration in the Outokumpu area, Eastern Finland:<br />
Constraints from seismic forward modelling and geometrical considerations<br />
Fig. 13. The migrated and depth-converted section of seismic reflection profile V7 (Fig. 1). The uppermost reflection<br />
events A and B of two cross-cutting reflective packages (see the text for details) are marked with red and<br />
green lines, re<strong>sp</strong>ectively.<br />
orientations at the northwestern end of the profile.<br />
The uppermost reflection events of these two<br />
groups are marked with A and B in Figure 13. The<br />
reflection event marked with A, and the parallel<br />
events beneath it, is dipping to the southeast<br />
(called group A). The reflection event marked with<br />
B, and the parallel events beneath it, is more or<br />
less horizontal (called group B). The interpreted<br />
orientations of the reflecting boundaries along the<br />
seismic reflection section are of course apparent,<br />
because all structures that are cylindrically symmetrical<br />
with re<strong>sp</strong>ect to a 2D profile give similar<br />
seismic images.<br />
There are no deep holes that would provide us<br />
with a possibility to correlate the subhorizontal reflection<br />
events of group B with geology. However,<br />
the dipping reflection events of group A can be<br />
correlated with the surface geology. Slightly further<br />
to the northwest from the end of the seismic<br />
reflection profile V7, the mica schists of the Outokumpu<br />
allochthon change into granite gneiss of<br />
the Archaean basement on the surface geological<br />
map (Fig. 1) approximately where the reflection<br />
event marked by A in Figure 13 is expected to reach<br />
the surface. If we assume that the cross-dip of reflection<br />
event A is about 20⁰ to the northeast, the<br />
calculated projection on the surface (shown with<br />
a red dashed line in the Saarivaara area in Fig. 1)<br />
coincides quite closely with the boundary between<br />
the Kalevian schists and Archaean basement indicated<br />
on the geological map to the northwest of<br />
the profile V7. With this orientation, the true dip of<br />
the reflecting boundary is 32⁰, which is close to the<br />
dip value of 30⁰ estimated by Kontinen & Säävuori<br />
(2013) for a supracrustal sequence on top of the Archaean<br />
basement rocks (see more below).<br />
Fitting geometry alone is not enough for the interpretation<br />
of seismic results. The suggested reflective<br />
structures should also have large enough<br />
acoustic impedance contrasts with their host rocks,<br />
and in this case, particularly the internally reflective<br />
nature of the reflective groups A and B needs<br />
to be explained. The observed reflectivity of group<br />
A can be understood in the light of the lithological<br />
and petrophysical parameters determined by Kontinen<br />
& Säävuori (2013) for samples from two shallow<br />
boreholes at Itikkapöksynkangas in the Saarivaara<br />
area (Fig. 1). The holes were drilled to dissect<br />
the contact between the Archaean basement and<br />
the Outokumpu allochthon to the northwest of<br />
the northwestern end of seismic reflection profile<br />
V7 (Fig. 1). Instead of the expected sharp boundary<br />
between the Archaean basement and the Outokumpu<br />
allochthon, Kontinen & Säävuori (2013)<br />
found at least 300-m-thick southeast-dipping<br />
Proterozoic supracrustal sequence, composed of<br />
intercalated amphibolite, black schist, mica schist,<br />
quartzite and arkosite mica-quartzite. Within this<br />
so called Heinä-Sukkula sequence, the layer thicknesses<br />
vary from metres to tens of metres, with<br />
sharp contacts between the individual pervasively<br />
schistose rock layers. Densities vary from 2.45 to<br />
3.18 g/cm 3 and P-wave velocities from 3.2 to 7.2 km/s<br />
(determined by laboratory measurements of drill<br />
51
Geological Survey of Finland, Special Paper 59<br />
Kari Komminaho, Emilia Koivisto, Pekka J. Heikkinen, Hilkka Tuomi, Niina Junno and Ilmo Kukkonen<br />
Fig. 14. The locations of reflectors A and B in Figure 13, seen from above. For di<strong>sp</strong>lay purposes, the reflectors are<br />
drawn as 500-m-wide rectangular elements. The colours are the same as in Figure 13.<br />
core samples). By taking into account the sharpness<br />
of the contacts one can expect strong reflectivity<br />
that could be furthermore enhanced by constructive<br />
interference produced by layering within<br />
the sequence. Thus, it can be concluded that the<br />
dipping reflectors of group A image the Heinä-<br />
Sukkula sequence between the Archaean basement<br />
and the Outokumpu allochthon. However, as the<br />
Heinä-Sukkula sequence has been estimated to be<br />
at most about 400–500 m thick, while the reflective<br />
package of group A in Figure 13 is over 1 km<br />
thick, Kontinen & Säävuori (2013) propose that the<br />
lowermost reflectors of the package could be the<br />
relatively high density amphibolite layers in the<br />
strongly foliated, relatively low density granodiorite<br />
gneisses of the Archaean basement below the<br />
supracrustal Heinä-Sukkula sequence.<br />
However, the reflectors of group B are not necessarily<br />
explained by the Heinä-Sukkula sequence<br />
and Archaean basement rocks. If we assume that<br />
reflector B and the parallel reflectors beneath it<br />
have no cross-dip, then the areas illuminated by<br />
groups A and B are clearly different, and the reflectors<br />
of group B appear to be located above the<br />
reflectors of group A (Fig. 14). This leaves <strong>sp</strong>ace<br />
for <strong>sp</strong>eculation that the reflectors of group B could<br />
be Outokumpu assemblage rocks instead of the<br />
Archaean basement and Proterozoic cover as has<br />
been interpreted by Kukkonen et al. (2012) and<br />
Saallmann & Laine (2014).<br />
IMPLICATIONS FOR SEISMIC ORE EXPLORATION IN THE OUTOKUMPU AREA<br />
The lithological contacts within the Outokumpu<br />
assemblage are reflective (Figs. 4 and 5) and produce<br />
internally reflective packages in the seismic<br />
reflection sections (Fig. 5). Units of the Outokumpu<br />
assemblage rocks are characterized by multiple<br />
phases of deformation and consequently associated<br />
with short reflector segments. This is e<strong>sp</strong>ecially<br />
noticeable in the stacked sections as numerous diffraction<br />
hyperbolas (Fig. 5) that are caused by the<br />
short segments and disruptions of the reflectors.<br />
In addition to the Outokumpu assemblage rocks,<br />
Archean basement rocks and the overlying supra-<br />
52
Geological Survey of Finland, Special Paper 59<br />
Seismic ore exploration in the Outokumpu area, Eastern Finland:<br />
Constraints from seismic forward modelling and geometrical considerations<br />
crustal Heinä-Sukkula sequence are also characterized<br />
by internally strongly reflective packages<br />
in the Outokumpu seismic reflection sections (Fig.<br />
13). However, the piecewise reflectivity characteristics<br />
of the known units of the Outokumpu assemblage<br />
rocks is somewhat different from the more<br />
continuous southeast dipping reflectors that have<br />
been interpreted as the supracrustal Heinä-Sukkula<br />
sequence and Archaean basement rocks at the<br />
northwestern end of seismic reflection profile V7<br />
(Fig. 13). Thus, in addition to the <strong>sp</strong>atial relationships<br />
between different internally reflective units,<br />
the units of the Archaean basement and supracrustal<br />
rocks can potentially be separated from units of<br />
the Outokumpu assemblage rocks based on their<br />
different reflectivity characteristics.<br />
In our seismic forward modelling example from<br />
the Kylylahti area, the near-vertical orientation of<br />
the Outokumpu assemblage causes surface seismic<br />
data to have only a weak re<strong>sp</strong>onse from the Outokumpu<br />
assemblage (Figs. 11 and 15). However, the<br />
real seismic reflection sections across the Kylylahti<br />
area show continued reflectivity at depth below<br />
Fig. 15. Seismic reflection profile E1 across the Kylylahti<br />
deposit (Fig. 1). The black dashed line indicates<br />
the approximate <strong>sp</strong>atial extent of the enhanced piecewise<br />
reflectivity beneath the crossing of Outokumpu<br />
assemblage rocks, and black schist enveloping them,<br />
on the surface geological map (Fig. 1).<br />
the known depth extent of the Outokumpu assemblage<br />
rocks (an example from seismic reflection<br />
profile E1 is presented in Fig. 15), which indicates<br />
continuation of the Outokumpu assemblage rocks<br />
at depth (see also Heinonen et al. 2016). To image<br />
the near-vertical parts of the Kylylahti formation,<br />
borehole data acquisition is required (Fig. 12). To<br />
ensure the most optimal survey geometry of any<br />
future campaign, the best way forward would be to<br />
use forward modelling with a realistic 3D geological<br />
model of the area to test different data acquisition<br />
strategies.<br />
As discussed earlier, the petrophysical variation<br />
across the Outokumpu area (Leväniemi, this<br />
volume) indicates that the reflectivity characteristics<br />
of the Outokumpu assemblage rocks and the<br />
Outokumpu-type ores change across the region.<br />
However, as representative seismic velocity measurements<br />
are currently only available from the Outokumpu<br />
Deep Drill Hole, and no seismic velocity<br />
measurements exist for the Outokumpu-type ores<br />
at all, in particular new seismic velocity measurements,<br />
in addition to density measurements, are<br />
critical for better understanding of the seismic<br />
signature of the Outokumpu assemblage and the<br />
Outokumpu-type ores across the area. Nevertheless,<br />
the available petrophysical data indicate that<br />
the petrophysical characteristics of mica schists<br />
remain relatively stable across the area, and there<br />
should always be sufficient contrast between the<br />
mica schists and Outokumpu assemblage rocks<br />
to cause a reflected signal. However, the relative<br />
strengths of the reflected signals from internal<br />
contacts within the Outokumpu assemblage might<br />
vary. In addition, the Outokumpu-type semi-massive<br />
to massive sulphide ores should always have<br />
a sufficient acoustic impedance contrast with the<br />
Outokumpu assemblage rocks to produce a detectable<br />
reflection, or more likely a diffraction signal;<br />
however, these signals could easily be masked by<br />
other reflective contacts within the Outokumpu<br />
assemblage (Fig. 7).<br />
Even if strictly only applicable in this particular<br />
case, the seismic forward modelling results indicate<br />
that the crooked-line survey geometry and<br />
processing can preserve direct signals from the ore<br />
deposits (Fig. 9). However, the crooked-line survey<br />
geometry and processing may contribute to<br />
the loss of shallow signals and cause artefacts, and<br />
need to be approached with care. Specifically, the<br />
crooked-line effects might cause high-amplitude<br />
anomalies comparable to those caused by the ores<br />
(Fig. 7D).<br />
53
Geological Survey of Finland, Special Paper 59<br />
Kari Komminaho, Emilia Koivisto, Pekka J. Heikkinen, Hilkka Tuomi, Niina Junno and Ilmo Kukkonen<br />
Kukkonen et al. (2012) and Saalmann & Laine<br />
(2014) have interpreted both the southeast dipping<br />
and the more horizontal reflection packages at the<br />
northwestern end of seismic reflection profile V7<br />
(uppermost reflection events of these two packages<br />
marked with A and B, re<strong>sp</strong>ectively, in Fig. 13) as<br />
one unit corre<strong>sp</strong>onding to the Archaean basement<br />
and Proterozoic supracrustal rocks. Our example<br />
from profile V7 illustrates the importance of taking<br />
into account the 3D effects when interpreting<br />
2D seismic profiles. In particular, it is possible that<br />
the more horizontal reflectivity at the northwestern<br />
end of profile V7 is actually associated with yet<br />
another unit of the Outokumpu assemblage rocks;<br />
this unit is <strong>sp</strong>atially separate from the southeast<br />
dipping reflectors.<br />
CONCLUSIONS<br />
The Outokumpu assemblage rocks, and black schist<br />
enveloping them, form internally strongly reflective<br />
packages within the mica schist, typically<br />
characterized by numerous diffraction hyperbolas<br />
in the stacked sections. The reflectivity characteristics<br />
can be used to target the Outokumpu assemblage<br />
rocks at depth, and the seismic reflection data<br />
provide a good basis for setting regional exploration<br />
targets in the Outokumpu area, in particular in<br />
combination with other geophysical and geological<br />
study approaches (e.g., see Leväniemi, this volume<br />
and Lahti et al., this volume).<br />
New seismic velocity measurements, as well as<br />
more and better constrained density data, are required<br />
to investigate the seismic re<strong>sp</strong>onse of the<br />
Outokumpu assemblage rocks across the Outokumpu<br />
area, and in particular the Outokumputype<br />
sulphide mineralizations, in more detail.<br />
Nevertheless, based on the results of this study, it<br />
seems possible that the Outokumpu-type sulphide<br />
mineralizations could even be directly observed as<br />
high-amplitude anomalies in the seismic reflection<br />
sections, if the dimensions and orientation<br />
are optimal. A careful crooked-line data processing<br />
sequence should enable the preservation of direct<br />
signals, if they are present in the data, except<br />
for very shallow signals that are more likely to be<br />
distorted by the crooked-line effects. The crooked-line<br />
effects can also potentially produce highamplitude<br />
anomalies, and care is required when<br />
interpreting the high-amplitude anomalies in the<br />
light of ore exploration.<br />
For surface seismic data acquisition, as expected,<br />
near-vertically orientated formations, such as that<br />
of the Kylylahti deposit, are problematic. Seismic<br />
forward modelling is an excellent tool to test and<br />
improve 3D geological models, and also for optimally<br />
planning new surveys if an initial geological<br />
model of the target area is available. The Outokumpu<br />
area has a complex geology, but numerous<br />
geological models are available. Thus, any future<br />
seismic endeavours should already resort to seismic<br />
forward modelling in the planning stage of the<br />
seismic surveys to ensure optimal data acquisition.<br />
When interpreting 2D seismic reflection profiles,<br />
3D effects must be taken into account. In<br />
particular, our results indicate that the reflectivity<br />
previously interpreted as one unit at the northwestern<br />
end of seismic reflection profile V7 is<br />
probably caused by two <strong>sp</strong>atially separated units,<br />
one dipping towards the southeast and one with a<br />
more horizontal orientation. While the southeast<br />
dipping reflective package has been confirmed to<br />
represent Archaean basement with a supracrustal<br />
Heinä-Sukkula sequence (Kontinen & Säävuori<br />
2013), the more horizontal reflection events could<br />
even be associated with Outokumpu assemblage<br />
rocks located above the southeast dipping Archaean<br />
basement and supracrustal rocks.<br />
ACKNOWLEDGEMENTS<br />
This work has been conducted at the Institute of<br />
Seismology, Department of Geosciences and Geography,<br />
University of Helsinki as a part of the Tekes<br />
Green Mining project Developing Mining Camp Exploration<br />
Concepts and Technologies − Brownfield<br />
Exploration.<br />
CSC – The Finnish IT Center for Science is acknowledged<br />
for providing computing resources.<br />
Seismic Unix (Stockwell 1999) was used to prepare<br />
figures for theoretical seismic sections. Globe<br />
Claritas was used for seismic processing.<br />
54
Geological Survey of Finland, Special Paper 59<br />
Seismic ore exploration in the Outokumpu area, Eastern Finland:<br />
Constraints from seismic forward modelling and geometrical considerations<br />
Special thanks to Asko Kontinen and Hanna Leväniemi<br />
for very helpful comments on the manuscript.<br />
Finally, we are grateful to the reviewer of the<br />
manuscript, Gilles Bellefleur, for very good suggestions<br />
for improving the manuscript.<br />
REFERENCES<br />
Aalto, M.-L., Säävuori, H. & Vuoriainen, S. 2011. Petrophysical<br />
properties of the Outokumpu Deep Drill<br />
Core and the surrounding bedrock. In: Kukkonen,<br />
I. (ed.) Outokumpu Deep Drilling Project 2003-<br />
2010. Geological Survey of Finland, Special Paper<br />
51, 63−82.<br />
Aatos, S., Heikkinen, P. J. & Kukkonen, I. 2016.<br />
Development of mining camp exploration and<br />
technologies for Outokumpu brownfield region.<br />
In: Aatos, S. (ed.) Developing Mining Camp Exploration<br />
Concepts and Technologies–Brownfield<br />
Exploration Project 2013–2016. Geological<br />
Survey of Finland, Special Paper 59. (this volume)<br />
Adam, E., Perron, G., Arnold, G., Matthews, L. &<br />
Milkereit, B. 2003. 3D seismic imaging for VMS<br />
deposit exploration, Matagami, Quebec. Hardrock<br />
Seismic Exploration: SEG, 229−246.<br />
Ahmadi, O., Juhlin, C., Malehmir, A. & Munck, M.<br />
2013. High-resolution 2D seismic imaging and<br />
forward modeling of a polymetallic sulphide deposit<br />
at Garpenberg, central Sweden. Geophysics,<br />
78(6), B339−B350.<br />
Aihemaiti, M. 2014. Seismic reflection method for ore<br />
exploration in Outokumpu area, Finland: Insights<br />
from data processing. Master’s thesis in Geophysical<br />
Pro<strong>sp</strong>ecting, University of Camerino, School of<br />
Science and Technology, Geology Division.<br />
Bohlen, T. 2002. Parallel 3-D viscoelastic finite difference<br />
seismic modelling. Computers & Geosciences,<br />
28(8), 887−899.<br />
Bohlen, T., Müller, C. & Milkereit, B. 2003. Elastic<br />
seismic-wave scattering from massive sulphide<br />
orebodies: On the role of composition and shape.<br />
In: Milkereit, B., Eaton, D. & Salisbury, M. (eds)<br />
Hardrock seismic exploration: SEG, 70−89.<br />
Červeny, V. 2005. Seismic ray theory. Cambridge university<br />
press.<br />
Drummond, B. J., Goleby, B. R., Goncharov, A. G.,<br />
Wyborn, L., Collins, C. & MacCready, T. 1998.<br />
Crustal-scale structures in the proterozoic Mount<br />
Isa Inlier of north Australia: Their seismic re<strong>sp</strong>onse<br />
and influence on mineralisation. Tectonophysics,<br />
288(1), 43−56.<br />
Eaton, D. 1997. BMOD3D: A program for three-dimensional<br />
seismic modelling using the Born approximation.<br />
Open File, p. 3357<br />
Eaton, D. W., Adam, E., Milkereit, B., Salisbury, M.,<br />
Roberts, B., White, D. & Wright, J. 2010. Enhancing<br />
base-metal exploration with seismic imaging.<br />
Canadian Journal of Earth Sciences, 47(5), 741−760.<br />
Eaton, D. W., Milkereit, B. & Salisbury, M. 2003.<br />
Seismic methods for deep mineral exploration:<br />
Mature technologies adapted to new targets. The<br />
Leading Edge, 22(6), 580−585.<br />
Elbra, T., Karlqvist, R., Lassila, I., Hæggström, E. &<br />
Pesonen, L. J. 2011. Laboratory measurements of<br />
the seismic velocities and other petrophysical properties<br />
of the Outokumpu deep drill core samples,<br />
eastern Finland. Geophysical Journal International,<br />
184(1), 405−415.<br />
Heinonen, S., Heikkinen, P. J., Kousa, J., Kukkonen,<br />
I. T. & Snyder, D. B. 2013. Enhancing hardrock<br />
seismic images: Reprocessing of high resolution<br />
seismic reflection data from Vihanti, Finland. Journal<br />
of Applied Geophysics, 93, 1−11.<br />
Heinonen, S., Kontinen, A., Leväniemi, H., Lahti, I.,<br />
Junno, N., Kurimo, M. & Koivisto, E. 2016. Sukkulansalo<br />
National Test Line in Outokumpu: A ground<br />
reference for deep exploration methods. In: Aatos,<br />
S. (ed.) Developing Mining Camp Exploration Concepts<br />
and Technologies – Brownfield Exploration<br />
Project 2013–2016. Geological Survey of Finland,<br />
Special Paper 59. (this volume)<br />
Heinonen, S., Kontinen, A., Sorjonen-Ward, P. &<br />
Aatos, S. 2016. Integration of geophysical data for<br />
deep exploration in the Kylylahti Cu-mining area,<br />
eastern Finland. EAGE 2016, Workshop in Deep<br />
Mineral Exploration, Abstracts<br />
Heinonen, S., Kukkonen, I. T., Heikkinen, P. J. &<br />
Schmitt, D. R. 2011. High resolution seismic reflections<br />
integrated with deep drill hole data in<br />
Outokumpu, Finland. In: Kukkonen, I. (ed.) Outokumpu<br />
Deep Drilling Project 2003-2010. Geological<br />
Survey of Finland, Special Paper 51, 105−118.<br />
Kern, H., Mengel, K., Strauss, K. W., Ivankina, T.<br />
I., Nikitin, A. N. & Kukkonen, I. T. 2009. Elastic<br />
wave velocities, chemistry and modal mineralogy<br />
of crustal rocks sampled by the Outokumpu scientific<br />
drill hole: Evidence from lab measurements<br />
and modeling. Physics of the Earth and Planetary<br />
Interiors, 175(3-4), 151−166.<br />
Koistinen, T. 1981. Structural evolution of an early<br />
Proterozoic strata-bound Cu-Co-Zn deposit, Outokumpu,<br />
Finland. Helsinki: University of Helsinki.<br />
(unpublished)<br />
Koivisto, E., Malehmir, A., Heikkinen, P., Heinonen,<br />
S. & Kukkonen, I. 2012. 2D seismic reflection<br />
investigations at the Kevitsa Ni-Cu-PGE deposit,<br />
northern Finland. Geophysics, 77(5), WC149−<br />
WC162.<br />
Koivisto, E., Malehmir, A., Hellqvist, N., Voipio, T.<br />
& Wijns, C. 2015. Building a 3D model of lithological<br />
contacts and near‐mine structures in the Kevitsa<br />
mining and exploration site, northern Finland:<br />
Constraints from 2D and 3D seismic reflection data.<br />
Geophysical Pro<strong>sp</strong>ecting, Vol. 63, Issue 4, 754−773.<br />
Kontinen, A. & Säävuori, H. 2013. Geologic correlation<br />
and significance of the prominent Saarivaara<br />
reflector from the HIRE V7 vibroseismic survey in<br />
the Outokumpu area. Geological Survey of Finland,<br />
Report of Investigation 198, 81−85.<br />
Kontinen, A., Peltonen, P. & Huhma, H. 2006. Description<br />
and genetic modelling of the Outokumputype<br />
rock assemblage and associated sulphide<br />
deposits. Geological Survey of Finland, archive Report<br />
M, 10(2006), 1.<br />
Kukkonen, I. T., Heikkinen, P., Ekdahl, E., Hjelt, S.,<br />
Yliniemi, J. & Jalkanen, E. 2006. Acquisition and<br />
geophysical characteristics of seismic reflection<br />
data on FIRE transects, Fennoscandian Shield. In:<br />
Kukkonen, I. T. & Lahtinen, R. (eds) Finnish Reflection<br />
Experiment 2001–2005. Geological Survey<br />
of Finland, Special Paper 43, 13–43.<br />
55
Geological Survey of Finland, Special Paper 59<br />
Kari Komminaho, Emilia Koivisto, Pekka J. Heikkinen, Hilkka Tuomi, Niina Junno and Ilmo Kukkonen<br />
Kukkonen, I. T., Heikkinen, P., Heinonen, S. & Laitinen,<br />
J. 2011. Seismic reflections in exploration<br />
for mineral deposits: Initial results from the HIRE<br />
project. In: Nenonen, K. & Nurmi, P. A. (eds) Geoscience<br />
for Society: 125th Anniversary Volume. Geological<br />
Survey of Finland, Special Paper 49, 49−58.<br />
Kukkonen, I. T., Heinonen, S., Heikkinen, P. & Sorjonen-Ward,<br />
P. 2012. Delineating ophiolite-derived<br />
host rocks of massive sulphide Cu-Co-Zn deposits<br />
with 2D high-resolution seismic reflection<br />
data in Outokumpu, Finland. Geophysics, 77(5),<br />
WC213−WC222.<br />
Lahti, I., Leväniemi, H., Kontinen, A., Sorjonen-Ward,<br />
P., Aatos, S. & Koistinen, E. 2016.<br />
Geophysical surveys of the Miihkali area, Eastern<br />
Finland. In: Aatos, S. (ed.) Developing Mining<br />
Camp Exploration Concepts and Technologies –<br />
Brownfield Exploration Project 2013–2016. Geological<br />
Survey of Finland, Special Paper 59. (this<br />
volume)<br />
Leväniemi, H. 2016. Petrophysical parameters and<br />
potential field modelling in the Outokumpu Belt.<br />
In: Aatos, S. (ed.) Developing Mining Camp Exploration<br />
Concepts and Technologies – Brownfield<br />
Exploration Project 2013–2016. Geological Survey<br />
of Finland, Special Paper 59. (this volume)<br />
L’Heureux, E., Milkereit, B. & Vasudevan, K. 2009.<br />
Heterogeneity and seismic scattering in exploration<br />
environments. Tectonophysics, 472(1),<br />
264−272.<br />
Malehmir, A., Durrheim, R., Bellefleur, G., Urosevic,<br />
M., Juhlin, C., White, D. J., Milkereit, B. & Campbell,<br />
G. 2012. Seismic methods in mineral exploration<br />
and mine planning: A general overview of<br />
past and present case histories and a look into the<br />
future. Geophysics, 77(5), WC173−WC190.<br />
Malehmir, A., Schmelzbach, C., Bongajum, E.,<br />
Bellefleur, G., Juhlin, C. & Tryggvason, A. 2009.<br />
3D constraints on a possible deep> 2.5 km massive<br />
sulphide mineralization from 2D crooked-line<br />
seismic reflection data in the Kristineberg mining<br />
area, northern Sweden. Tectonophysics, 479(3),<br />
223−240.<br />
Malehmir, A., Tryggvason, A., Lickorish, H. & Weihed,<br />
P. 2007. Regional structural profiles in the<br />
western part of the Palaeoproterozoic Skellefte ore<br />
district, northern Sweden. Precambrian Research,<br />
159(1), 1−18.<br />
Milkereit, B., Berrer, E., King, A. R., Watts, A. H.,<br />
Roberts, B., Adam, E., Eaton, D. W., Wu, J. &<br />
Salisbury, M. 2000. Development of 3-D seismic<br />
exploration technology for deep nickel-copper deposits-A<br />
case history from the Sudbury Basin, Canada.<br />
Geophysics, 65(6), 1890−1899.<br />
Nedimovic, M. R. & West, G. F. 2003a. Crookedline<br />
2D seismic reflection imaging in crystalline<br />
terrains: Part 1, data processing. Geophysics, 68(1),<br />
274−285.<br />
Nedimovic, M. R. & West, G. F. 2003b. Crooked-line<br />
2D seismic reflection imaging in crystalline terrains:<br />
Part 2, migration. Geophysics, 68(1), 286−296.<br />
Papunen, H. 1987. Outokumpu-type ores. In: Häkli,<br />
T. A. (ed.) Otto Trustedt symposium in Finland<br />
on June 3–5, 1985. Geological Survey of Finland,<br />
Special Paper 1, 41−50.<br />
Park, A., Bowes, D., Halden, N. & Koistinen, T. 1984.<br />
Tectonic evolution at an early Proterozoic continental<br />
margin: The Svecokarelides of eastern<br />
Finland. Journal of Geodynamics, 1(3), 359−386.<br />
Peltola, E. 1978. Origin of Precambrian copper sulphides<br />
of the Outokumpu district, Finland. Economic<br />
Geology and the Bulletin of the Society of Economic<br />
Geologists, 73(4), 461−477.<br />
Peltonen, P., Kontinen, A., Huhma, H. & Kuronen,<br />
U. 2008. Outokumpu revisited: New mineral deposit<br />
model for the mantle peridotite-associated Cu-<br />
Co-Zn-Ni-Ag-Au sulphide deposits. Ore Geology<br />
Reviews, 33(3-4), 559−617.<br />
Saalmann, K. & Laine, E. L. 2014. Structure of the<br />
Outokumpu area and ophiolite-hosted Cu-Co-Zn-<br />
Ni-Ag-Au sulphide deposits revealed from 3D modeling<br />
and 2D high-resolution seismic reflection<br />
data. Ore Geology Reviews, 62, 156−180.<br />
Salisbury, M. & Snyder, D. 2007. Application of seismic<br />
methods to mineral exploration. Mineral Deposits<br />
of Canada: A Synthesis of Major Deposit<br />
Types, District Metallogeny, the Evolution of Geological<br />
Provinces, and Exploration Methods. Geological<br />
Association of Canada, Mineral Deposits<br />
Division, Special Publication, 5, 971−982.<br />
Salisbury, M. H., Harvey, C. & Matthews, L. 2003.<br />
The acoustic properties of ores and host rocks in<br />
hardrock terranes. Hardrock Seismic Exploration,<br />
(10), 9−19.<br />
Schmelzbach, C., Juhlin, C., Carbonell, R. & Simancas,<br />
J. F. 2007. Prestack and poststack migration of<br />
crooked-line seismic reflection data: A case study<br />
from the south Portuguese zone fold belt, southwestern<br />
Iberia. Geophysics, 72(2), B9−B18.<br />
Sorjonen-Ward, P. 2006. Geological and structural<br />
framework and preliminary interpretation of the<br />
FIRE 3 and FIRE 3A seismic reflection profiles, central<br />
Finland. . In: Kukkonen, I. T. & Lahtinen, R.<br />
(eds) Finnish Reflection Experiment 2001–2005.<br />
Geological Survey of Finland, Special Paper 43,<br />
105−159.<br />
Stockwell, J. W. 1999. The CWP/SU: Seismic un*x package.<br />
Computers & Geosciences, 25(4), 415−419.<br />
Stolt, R. H. & Benson, A. K. 1986. Seismic migration.<br />
Theory and practice Pergamon.<br />
Widess, M. 1973. How thin is a thin bed? Geophysics,<br />
38(6), 1176−1180.<br />
Willman, C., Korsch, R., Moore, D., Cayley, R., Lisitsin,<br />
V., Rawling, T., Morand, V. & O’Shea, P. 2010.<br />
Crustal-scale fluid pathways and source rocks in<br />
the Victorian gold province, Australia: Insights<br />
from deep seismic reflection profiles. Economic<br />
Geology, 105(5), 895−915.<br />
Yilmaz, Ö. 2001. Seismic data processing SEG. 826 p.<br />
56
Developing Mining Camp Exploration Concepts and Technologies – Brownfield Exploration Project 2013–2016<br />
Edited by Soile Aatos<br />
Geological Survey of Finland, Special Paper 59, 57–66, 2016<br />
ZTEM SURVEY IN THE OUTOKUMPU REGION<br />
by<br />
Maija Kurimo 1) , Ilkka Lahti 1) and Maarit Nousiainen 2)<br />
Kurimo, M., Lahti, I. & Nousiainen, M. 2016. ZTEM survey in the Outokumpu<br />
region. Geological Survey of Finland, Special Paper 59, 57–66, 7 figures.<br />
Geotech Ltd. carried out a helicopter-borne geophysical survey for the<br />
Geological Survey of Finland over the Outokumpu Mining Camp area in<br />
2013. Geophysical sensors included a Z-axis tipper electromagnetic (ZTEM)<br />
system, and a caesium magnetometer. A total of 1250 line-kilometers of<br />
geophysical data were acquired during the survey. The line <strong>sp</strong>acings were<br />
2 km, 1 km and 500 m.<br />
The delivered survey results included in- and cross-line ZTEM tipper components<br />
at six frequencies (25, 37, 75, 150, 300 and 600 Hz), total magnetic<br />
intensity data, and various derivatives of ZTEM tipper data. 2D inversion<br />
tests over selected lines were performed by the contractor in support of<br />
the ZTEM survey results. Additional inversions were purchased from the<br />
contractor after the survey: 2D inversions from all survey lines, 3D inversion<br />
with a large cell size from the whole survey area, and high resolution<br />
3D inversion from the area with 500 m line <strong>sp</strong>acing.<br />
Here, we present an overview of the ZTEM survey and compare the delivered<br />
inversion results. Although the results are generally in good agreement,<br />
the 3D inversion model with the finest mesh yields the best results.<br />
The inversion models are used in other papers of this volume.<br />
Keywords: Electromagnetic methods, airborne methods, ZTEM, geophysics,<br />
geophysical surveys, three-dimensional models, Outokumpu<br />
1)<br />
Geological Survey of Finland, P.O. Box 77, FI-96101 Rovaniemi, Finland<br />
2)<br />
Geological Survey of Finland, P.O. Box 1237, FI-70211 Kuopio, Finland<br />
E-mail: maija.kurimo@gtk.fi, ilkka.lahti@gtk.fi, maarit.nousiainen@gtk.fi<br />
57
Geological Survey of Finland, Special Paper 59<br />
Maija Kurimo, Ilkka Lahti and Maarit Nousiainen<br />
INTRODUCTION<br />
The ZTEM or Z-Axis Tipper Electromagnetic system is<br />
variant of the electromagnetic (EM) airborne tipper<br />
AFMAG method (Ward 1959) for studying the electrical<br />
conductivity of bedrock in the depth range<br />
of 0 – 2 km. The method uses the natural or passive<br />
fields of the Earth as the source of transmitted<br />
energy. The naturally occurring audio frequency<br />
magnetic fields are used as the source of the primary<br />
field signal. The primary field is usually ~ 1<br />
Hz - 1 kHz, derived from worldwide atmo<strong>sp</strong>heric<br />
thunderstorm activity, and propagates vertically up<br />
to several kilometers into the earth. This magnetotelluric<br />
(MT) skin depth is directly proportional to<br />
the ratio of the bedrock resistivity to the frequency.<br />
(Sattel & Witherly 2012a,b, Legault et al. 2009a,b,<br />
Holtham & Oldenburg 2010, 2012, Geotech technical<br />
reports and presentations).<br />
In ZTEM system, the vertical magnetic field<br />
component (H z<br />
) is recorded by a sensor mounted<br />
on a bird towed by a helicopter (Fig. 1). The vertical<br />
magnetic field component (H z<br />
) is caused by lateral<br />
conductivity contrasts in the Earth. The ZTEM base<br />
station deployed in this survey consisted of three<br />
orthogonal coils. The fields measured by these<br />
coils provide horizontal X and Y components of<br />
the magnetic reference field, which is further used<br />
with the airborne coil data to calculate the in-line<br />
and cross-line tipper component (T zx<br />
and T zy<br />
) field<br />
data.<br />
The aim of the ZTEM survey was e<strong>sp</strong>ecially to<br />
test the capability of the ZTEM system in deep exploration.<br />
A challenge was to test how well very<br />
narrow geological units could be verified from<br />
ZTEM inversion results.<br />
Fig. 1. ZTEM system in Outokumpu. Lowermost sensor is the receiver coil having a 7.4 meter diameter. Magnetic<br />
field sensor is situated 15 meters above the coil. The total length of the cable is 85 meters. Photo: Aimo Ruotsalainen,<br />
GTK.<br />
SURVEY<br />
The survey was planned to cover the Outokumpu<br />
and Miihkali formations to support the Developing<br />
Mining Camp Exploration Concepts and Technologies<br />
- Brownfield Exploration project in deep<br />
exploration targeting. The survey was funded by<br />
Geological Survey of Finland (GTK). It was regarded<br />
as useful to cover the existing deep seismic<br />
survey lines (HIRE and FIRE) in the area for<br />
comparison purposes. The survey line plan (Fig.<br />
2) was a difficult compromise between available<br />
resources and the need for high-quality<br />
<strong>sp</strong>atial information. Altogether, 1250 line kilometers<br />
58
Geological Survey of Finland, Special Paper 59<br />
ZTEM survey in the Outokumpu region<br />
Fig. 2. ZTEM flight lines in yellow with the real component of GTK’s airborne electromagnetic 3 kHz measurement.<br />
were flown during the survey. The central area was<br />
flown with 500 m line <strong>sp</strong>acing, and elsewhere with<br />
1 km <strong>sp</strong>acing, while the furthermost lines had line<br />
<strong>sp</strong>acing of even 2 km. The line direction was 140<br />
degrees, roughly SE-NW. It was understood that<br />
cultural noise could have a marked influence on the<br />
results, as two major and several minor power lines<br />
cross the area, and many other sources of electromagnetic<br />
disturbance also exist, such as industrial<br />
plants, active mines and Outokumpu town.<br />
The helicopter flights were conducted in June<br />
2013 during six active days. The survey was operated<br />
by Geotech Ltd. Joensuu airport acted as the<br />
main base for the helicopter, and the base station<br />
was situated inside the survey area, in a remote,<br />
uninhabited and electrically quiet location. The<br />
base station measured the horizontal X and Y magnetic<br />
components of the electromagnetic field,<br />
and this reference field was further utilized in data<br />
processing. In-field data quality assurance and<br />
preliminary processing were carried out on a daily<br />
basis during the data acquisition phase. Preliminary<br />
and final data processing, including the generation<br />
of the final digital data and map products,<br />
were undertaken from the office of Geotech Ltd. in<br />
Canada. In general, the data quality was good, as<br />
well as the ZTEM re<strong>sp</strong>onses. The quality also depended<br />
on the primary signal recorded at the base<br />
station, which during the survey was strong. For<br />
this reason, it was possible to record 300 Hz and<br />
600 Hz data during all flights, which could not be<br />
guaranteed beforehand.<br />
GTK representatives received the raw data almost<br />
daily for quality control (QC) purposes and<br />
paid a visit to the survey area and the field and base<br />
stations. The operator was very helpful in providing<br />
ample information on the survey methodology<br />
and progress. The survey process was described in<br />
detail in the Technical Report (Geotech 2013a).<br />
59
Geological Survey of Finland, Special Paper 59<br />
Maija Kurimo, Ilkka Lahti and Maarit Nousiainen<br />
SURVEY DATA<br />
The survey data included real (in-phase) and imaginary<br />
(quadrature) parts of the tipper transfer<br />
functions both in-line (Tzx) and cross-line (Tzy)<br />
at six frequencies (25, 37, 75, 150, 300 and 600 Hz)<br />
totaling 24 electromagnetic data components. The<br />
data were processed using receiver and base station<br />
coil data, corrected for the local magnetic field declination<br />
and filtered for power line monitor (PLM)<br />
and helicopter noise frequencies. The final data<br />
set included all tipper components, coordinates,<br />
elevation and terrain clearance information, total<br />
magnetic field with base station data and IGRF and<br />
Power Line Monitor (PLM) recordings (50 Hz).<br />
The calculated EM grids provided by Geotech<br />
Ltd. were Total Divergence (DT, sum of horizontal<br />
derivatives) and Total Phase-Rotation (TPR,<br />
changes bipolar anomalies into single pole anomalies<br />
with a maximum over conductors) of all<br />
components, totaling 48 grids. The varying flight<br />
line plan caused variation in the resolution of the<br />
grids, which were interpolated with 150 m cell size.<br />
The average terrain clearance of the helicopter<br />
ZTEM receiver coil was 95 m with standard deviation<br />
of 10 m, and due to rather windy conditions,<br />
its horizontal position and angle somewhat varied.<br />
The attitudinal position of the coil was recorded<br />
by 3 GPS antennas for internal QC and attitude<br />
correction.<br />
The locations of the power lines were available<br />
digitally. It was noted that the PLM revealed well<br />
the main power line (110 kV transmission line)<br />
crossing the area from about SEE to NWW. The other<br />
regional power line, with a direction almost N-S<br />
in the middle of the area, was mostly recognized by<br />
PLM, but not always. According to the information<br />
from Geotech, the effect of the power line on the<br />
ZTEM results was surprisingly minor, as power lines<br />
could easily be modelled in the inversions. The reason<br />
was unclear, but might be connected with the<br />
well-grounded and precise 50 Hz frequency of the<br />
regional power line utility grid and the power lines<br />
not being major, but only 110 kV.<br />
2D INVERSION<br />
Prior to the inversion, the optimal resistivity for<br />
the initial model was studied. This was done by<br />
performing several 2D inversions using a broad<br />
range of initial half-<strong>sp</strong>ace resistivities along the<br />
few selected lines. Values from 500 to 8000 Ωm<br />
were tested, and according to the input error calculation<br />
(Geotech 2013b) and discussions, the 2000<br />
Ωm value was chosen, as this value yielded to lowest<br />
RMS misfit values.<br />
After examination of the example inversions,<br />
the whole-data 2D inversions were performed by<br />
Geotech using Av2dtopo software. The 2D inversion<br />
uses only the in-line component T zx<br />
whereas<br />
the 3D inversion utilizes both T zx<br />
and the cross-line<br />
components T zy<br />
. Flight lines were divided into two<br />
or three parts in which the inversions were performed.<br />
Each model mesh consisted of 440 cells<br />
laterally and 112 cells vertically, and the cell size<br />
consequently varied slightly depending on line<br />
length. The typical cell size was 20 - 30 meters.<br />
3D INVERSIONS: WHOLE AREA<br />
The start value test was now run for the whole area<br />
using 3D inversion software and a 1 km cell size.<br />
The tested resistivities were 1000, 2000 and 4000<br />
Ωm (Fig. 3). Again, the start value had an effect on<br />
the model depth, and the most resistive start value<br />
gave the deepest and most resistive model. According<br />
to the previous study, the same initial resistivity<br />
value, 2000 Ωm, was chosen. Due to the<br />
large survey area and the limited cell number (max<br />
80 x 80 x 80) of the inversion code, to achieve better<br />
resolution, the whole survey area was divided into 8<br />
smaller overlapping sub-blocks using the method<br />
described by Holtham and Oldenburg (2012). The<br />
mesh cell size of the sub-blocks was 250 x 300 x 50 m<br />
and the initial resistivity value was 2000 Ω. The<br />
sub-block inversion models were merged together<br />
using the Geosoft Oasis Merge-Voxel function.<br />
The resistivity value range for the model was<br />
100 – 40 000 Ωm.<br />
The 3D inversion model was congruent with the<br />
known geology in the middle area of 500 m line<br />
<strong>sp</strong>acing, but was sometimes inconsistent in the<br />
60
Geological Survey of Finland, Special Paper 59<br />
ZTEM survey in the Outokumpu region<br />
Fig. 3. 2D inversion and initial resistivity value tests of 3D inversion. White denotes the most resistive, and<br />
violet the most conductive structures. In boreholes, a dark violet colour refers to black schist, which correlates<br />
well with the 3D boundaries with all tested initial resistivity values. Borehole information is from the GEOMEX<br />
database (Anonymous 2006).<br />
area of 1-2 km line <strong>sp</strong>acing. The lithology of the<br />
boreholes is described in the GEOMEX database<br />
(Anonymous 2006), which is a result of a large research<br />
project GEOMEX in 1999-2003 in the Outokumpu<br />
area (Kontinen et al. 2006). Like the 2D<br />
inversion, all 3D inversions were performed by<br />
Geotech.<br />
3D INVERSION: FINE MESH IN THE CENTRAL AREA<br />
A sub-area was selected for detailed inversion in<br />
order to obtain a better understanding of 3D inversion<br />
possibilities and to try to enhance the resolution<br />
of the results (Fig. 4). The 3D inversion was<br />
carried out using a much finer mesh: a cell size of<br />
50m along line, 50m vertically and 250m across the<br />
lines. The selected area had been flown with 500m<br />
line <strong>sp</strong>acing. The cell size effect was tested, and<br />
with this line <strong>sp</strong>acing and geology it was noted that<br />
the smaller cross-line cell size of 125m did improve<br />
the results slightly. In this area, the wider model<br />
resistivity range between 1 and 100 000 Ωm was<br />
utilized.<br />
61
Geological Survey of Finland, Special Paper 59<br />
Maija Kurimo, Ilkka Lahti and Maarit Nousiainen<br />
Fig. 4. Fine mesh and normal 3D resistivity inversions: Resistivity at the depth of 500 m. The fine mesh inversion<br />
area is outlined by a black line. Both resistivity grids have the same colour scale, but the fine mesh 3D inversion<br />
results are presented in brighter colours than the result of the normal 3D inversion. Grey lines are the flight<br />
lines. Lines 1106 and 1130 (highlighted in blue) and boreholes OKU-754, OKU-755 and OKU-759 are used in the<br />
comparison of the inversions. Contains data from the National Land Survey of Finland Topographic Database<br />
03/2013.<br />
DISCUSSION AND CONCLUSIONS: COMPARISONS IN THE OUTOKUMPU<br />
SURVEY AREA<br />
Figure 5 compares the three different inversions<br />
along line L1106, whose location is presented in the<br />
Figure 4. The topmost panel di<strong>sp</strong>lays 3D inversion<br />
with a 50 m cell size, the middle panel 3D inversion<br />
with a 250 m cell size and the lowest panel 2D<br />
inversion. As mentioned above, the 3D inversion<br />
with a 50 m cell size was a test and is only available<br />
for a subarea of the whole Outokumpu study area.<br />
The location of the conductors is rather similar<br />
in all inversions, but the depth extent varies considerably.<br />
Conductive zones are notably larger in<br />
2D inversion than either of the 3D inversions, i.e<br />
the resolution is better in 3D inversion than in 2D<br />
inversion. The 2D inversion combines some conductors<br />
that are seen as separate bodies in the 3D<br />
inversions.<br />
62
Geological Survey of Finland, Special Paper 59<br />
ZTEM survey in the Outokumpu region<br />
Fig. 5. Comparison of inversions on line 1106: upper panel 3D with 50 m cell, middle panel 3D with 250 m cell<br />
size and lower panel 2D (view to SW). White dashed lines outline the area that will be considered in more detail<br />
in the Figure 6.<br />
Figure 6 presents a detail from line L1106. As one<br />
would assume, the 3D inversion with the smallest<br />
cell size shows the most detail. The 3D inversion<br />
with a larger cell size also has the conductor<br />
on the left side, but there is no sign of the near<br />
surface conductor on the right side. The 2D inversion<br />
has no resolution power in this area. Comparison<br />
with drillholes illustrates the different<br />
scales of inversions and lithology. Whereas inversions<br />
mostly show large and round conductive<br />
areas, the real lithology is complex and full of details<br />
(Anonymous 2006). The boreholes in the figure<br />
are located about 140 m to the NE of the flight<br />
line and they do not therefore represent the exact<br />
geology under the flight line. In general, black<br />
schists and sulphides have low resistivity and can<br />
thus be interpreted as conductors in this type of<br />
data. The lowest resistivities of the blackshists<br />
in the main Outokumpu zone and Miihkali area<br />
are of the magnitude of 10 -2 -10 -1 Ωm but not all<br />
the blackschists are conductive (Lehtonen 1981).<br />
Figure 7 compares inversion results on line<br />
L1130, whose location is also presented in the Figure<br />
4. At location N697 0000, the 3D inversion with<br />
a 250 m cell size shows barely anything conductive,<br />
whereas the 3D inversion with a 50 m cell size and<br />
the 2D inversion di<strong>sp</strong>lay a large and deep conductor.<br />
The resolution of 2D inversion is again poorer<br />
than in 3D inversions. The observed differences<br />
could be also partly explained by the wider allowed<br />
resistivity ranges that were used in 2D and high<br />
resolution 3D inversions (50 m cell size).<br />
The 3D inversion report by Geotech compares<br />
the 2D and 3D inversions on lines L1070 and L1106.<br />
This comparison also states that 3D resistivity inversion<br />
has a better resolution than 2D inversion.<br />
The report additionally includes a list of 10 interpreted<br />
conductive targets of interest. Six of these<br />
are discussed in detail in the report. In this report<br />
Geotech finds it unlikely that ZTEM would re<strong>sp</strong>ond<br />
directly to Outokumpu deposits, but it images the<br />
black shale and serpentinite units and possibly the<br />
surrounding hydrothermal mineralized halo.<br />
63
Geological Survey of Finland, Special Paper 59<br />
Maija Kurimo, Ilkka Lahti and Maarit Nousiainen<br />
Fig. 6. A detailed view from profile L1106. The upper row presents 3D inversion slices with a 50 m cell size on the<br />
left, 3D inversion with a 250 m cell size in the middle and 2D inversion on the right. The lower row presents three<br />
drillholes and their lithology about 140 m to the NE of the flight line. Black schists (purple) and sulphides (red)<br />
are usually conductive. The view is to SW and all inversions have the same colour scale. Northings 696 7200 and<br />
696 7400 are marked as thick black lines in all images to help comparing the locations of the images. Boreholes<br />
are from the GEOMEX database (Anonymous 2006).<br />
64
Geological Survey of Finland, Special Paper 59<br />
ZTEM survey in the Outokumpu region<br />
Fig. 7. Comparison of inversions L1130: upper panel 3D with a 50m cell size, middle panel 3D with a 250 m cell<br />
and lower panel 2D (view to SW).<br />
ACKNOWLEDGEMENTS<br />
The authors acknowledge the reviews of the manuscript<br />
by Juliane Hübert and an anonymous reviewer.<br />
We also thank Jean Legault and other Geotech<br />
geophysicists for many useful explanations and<br />
answers by email during the project.<br />
REFERENCES<br />
Anonymous 2006. Geological and exploration data of<br />
Outokumpu area, East Finland: GEOMEX JV project<br />
1999-2003. (DVD-disc)<br />
Geotech Ltd. 2013a. Report on a Helicopter-Borne Z-axis<br />
Tipper Electromagnetic (ZTEM) and Aeromagnetic<br />
Geophysical Survey: Outokumpu Mining Camp Area.<br />
22p. and appendices. (unpublished report)<br />
Geotech Ltd. 2013b. 2D ZTEM Inversion Results for Geological<br />
Survey of Finland, Outokumpu Mining Camp<br />
Area. 153 p. (unpublished report)<br />
Geotech Ltd. 2014. Summary Report on 3D Inversion of<br />
a Helicopter-Borne Z-Axis Tipper Electromagnetic<br />
(ZTEM) Geohysical Survey: Outokumpu Mining Camp<br />
Area. 29 p. and appendices. (unpublished report)<br />
Geotech Ltd. 2015. 3D ZTEM Inversion results for Geological<br />
Survey of Finland, Outokumpu Mining Camp<br />
Area. 73 p. (unpublished report)<br />
Holtham, E. & Oldenburg, D. W. 2010. Three-dimensional<br />
inversion of ZTEM data, Geophysical Journal International,<br />
182, 168−182.<br />
Holtham, E. & Oldenburg, D. W. 2012. Large-scale inversion<br />
of ZTEM data, Geophysics 77, WB37−45.<br />
Kontinen, A., Peltonen, P. & Huhma, H. 2006. Description<br />
and genetic modelling of the Outokumpu-type<br />
rock assemblage and associated sulphide deposits.<br />
Final technical report for GEOMEX J.V., Workpackage<br />
Geology. Geological Survey of Finland, archive report<br />
M10.4/2006/1. 378 p.<br />
Lehtonen, T. 1981. Outokummun alueen kivilajien petrofysikaalisista<br />
ominaisuuksista. Diploma thesis, Helsinki<br />
University of Technology. 77 p. (in Finnish)<br />
Legault, J. M., Kumar, H., Milicevic, B. & Hulbert, L.<br />
2009a. ZTEM airborne tipper AFMAG test survey over<br />
a magmatic copper-nickel target at Axis Lake in northern<br />
Saskatchewan, SEG Expanded Abstracts, 28,<br />
1272−1276<br />
65
Geological Survey of Finland, Special Paper 59<br />
Maija Kurimo, Ilkka Lahti and Maarit Nousiainen<br />
Legault, J. M., Kumar, H., Milicevic, B. & Wannamaker,<br />
P. 2009b. ZTEM tipper AFMAG and 2D inversion results<br />
over an unconformity uranium target in northern<br />
Saskatchewan, SEG Expanded Abstracts, 28,<br />
1277−1281.<br />
Sattel, D. & Witherly, K. 2012a. Extracting information<br />
from ZTEM with 2D inversions, 22ND International<br />
Geophysical Conference and Exhibition, ASEG, Extended<br />
Abstracts. 4 p.<br />
Sattel, D. & Witherly, K. 2012b. The modeling of ZTEM<br />
data with 2D and 3D algorithms, SEG, Expanded Abstracts.<br />
5 p.<br />
Ward, S. H. 1959. AFMAG − Airborne and Ground.<br />
Geophysics, 24, 761−787<br />
66
Developing Mining Camp Exploration Concepts and Technologies – Brownfield Exploration Project 2013–2016<br />
Edited by Soile Aatos<br />
Geological Survey of Finland, Special Paper 59, 67–96, 2016<br />
PETROPHYSICAL PARAMETERS AND POTENTIAL FIELD MODELLING IN<br />
THE OUTOKUMPU BELT<br />
by<br />
Hanna Leväniemi<br />
Leväniemi, H. 2016. Petrophysical parameters and potential field modelling<br />
in the Outokumpu Belt. Geological Survey of Finland, Special Paper 59,<br />
67−96, 23 figures and 6 tables.<br />
The Outokumpu and Miihkali regions have been extensively covered by<br />
drilling and geophysical ground surveys. The work presented in this paper<br />
aimed at defining suitable parameters and methods for modelling the re<strong>sp</strong>onses<br />
of deep-set bedrock features in gravity and magnetic (i.e. potential<br />
field) datasets in the Outokumpu region in order to study the depth ranges,<br />
dimensions and characteristics of the anomaly sources. The first part of this<br />
paper considers the typical petrophysical parameters for the various Outokumpu<br />
region rocks from both outcrop and drill core sample data and the<br />
second part illustrates the application of these parameters with modelling<br />
examples (with emphasis on gravity data).<br />
Results from 2D/3D forward modelling and inversion demonstrate that in<br />
the study region, gravity modelling is a more easily controlled process than<br />
magnetic modelling due to high amount of remanent magnetization, the<br />
parameters of which vary locally and are mostly only known on a general<br />
level. However, lithological units also show petrophysical heterogeneity,<br />
and changes in metamorphic grade, in particular, can significantly affect<br />
the densities within a certain rock class; in order to understand the density<br />
distributions, it is also necessary to include a <strong>sp</strong>atial a<strong>sp</strong>ect in the petrophysical<br />
data classification and analysis. Modelling examples show that<br />
with the careful application of geological and geophysical constraints, potential<br />
field modelling can detect sources at depths of several kilometres.<br />
Keywords: geophysical methods, potential field, gravity methods, magnetic<br />
methods, petrophysics, density, magnetic properties, numerical models,<br />
Outokumpu<br />
Geological Survey of Finland, P.O. Box 96, FI-02151 E<strong>sp</strong>oo, Finland<br />
E-mail: hanna.levaniemi@gtk.fi<br />
67
Geological Survey of Finland, Special Paper 59<br />
Hanna Leväniemi<br />
INTRODUCTION<br />
Geophysical modelling and inversion is by nature<br />
ambiguous: for any given observed dataset, there<br />
are countless combinations of source geometries<br />
and properties that result in the observed anomalies.<br />
Thus, in order to produce geologically realistic<br />
models from geophysical data, knowledge of the<br />
dimensions and geometries of geological formations,<br />
and also their physical properties, is crucial<br />
for delimiting the degrees of freedom and for constraining<br />
and guiding the modelling towards the<br />
most realistic solution.<br />
This study aims at discovering suitable model<br />
constraints, modelling parameter values and<br />
modelling methods in order to extend the detection<br />
depth ranges of potential field models (with<br />
emphasis on gravity data) for the Outokumpu Belt<br />
and its surroundings (Fig. 1). The first part of the<br />
study focuses on re-evaluating the existing petrophysical<br />
outcrop and drill core sample data. In<br />
the second part the petrophysical data is applied<br />
to modelling and inversion to study the potential<br />
for gravity and magnetic models to detect anomaly<br />
sources of different dimensions and at various<br />
depths.<br />
An essential a<strong>sp</strong>ect in potential field modelling<br />
is the use of realistic petrophysical parameter values.<br />
Most recent petrophysical study in the Outokumpu<br />
region is the paper by Airo et al. (2011) that<br />
presents the petrophysical data from the Outokumpu<br />
Deep Drill Hole core samples. Petrophysical<br />
modelling parameter values “typical of the region”<br />
are listed in several reports, but they show<br />
some variation (Ahokas 1984, Ketola 1973, Ketola<br />
1974, Ruotoistenmäki & Tervo 2006, Pekkarinen &<br />
Rekola 1994), most likely reflecting the modelling<br />
purposes and increase in the amount of data and<br />
regional coverage during the decades of exploration.<br />
The two previous comprehensive key documentations<br />
concentrating on petrophysical data<br />
are the detailed statistical approach of Lehtonen<br />
(1981), which uses lithological classification as a<br />
starting point, and the study by Ruotoistenmäki<br />
& Tervo (2006) based on petrophysical clustering.<br />
Although both of these works offer useful insights<br />
into the physical properties of the rocks in<br />
the study region, the statistical analysis according<br />
to rock classes of Lehtonen (1981) is the closer of<br />
these two to the purpose of this study. However,<br />
since Lehtonen’s work, more data and also knowledge<br />
of the <strong>sp</strong>atial variation in the properties has<br />
become available, and it is therefore appropriate at<br />
this point to update and complement his work.<br />
Several extensive geological studies have been<br />
published in the Outokumpu region (e.g. Gaál et<br />
al. 1975, Koistinen 1981, Kontinen et al. 2006), but,<br />
although potential field data have been collected<br />
and modelled for the Outokumpu Belt throughout<br />
its exploration history, the previously documented<br />
modelling cases appear mostly scattered in various<br />
reports and unpublished papers. Ketola (1979)<br />
summarized the geophysical studies of the time on<br />
the Vuonos and Saramäki deposits: potential field<br />
modelling played an important role in exploration<br />
by Outokumpu Oy, albeit more as an indirect exploration<br />
tool. The gravimetric modelling that revealed<br />
the existence of the deep-plunging extension<br />
of the Outokumpu Belt between Vuonos and<br />
Kylylahti (“Papan putki”) is extensively covered by<br />
Ahokas (1984) and discussed by Rekola & Hattula<br />
(1995) and Outokumpu News (1982).<br />
The potential field datasets used in the examples<br />
of this study comprise ground gravity and<br />
magnetic data (by Outokumpu Oy) and various regional<br />
datasets. Four new gravimetric profiles were<br />
also measured as part of this study to complement<br />
the existing ground datasets.<br />
Several reflection seismic profiles have been<br />
acquired in the study region during 2002-2008 in<br />
the FIRE and HIRE projects (Kukkonen & Lahtinen<br />
2006, Kukkonen et al. 2011, Kukkonen et al. 2012).<br />
These seismic profiles provide a natural starting<br />
point for potential field modelling of deep-set<br />
sources. We discuss the possibilities and challenges<br />
on forward modelling of gravity data along the<br />
extended V7 and V8 seismic profiles. Deposit-scale<br />
modelling examples examine the application of the<br />
determined petrophysical parameters at the ends<br />
of the Outokumpu Belt, the Keretti and Kylylahti<br />
mining sites. The source detection depth range for<br />
gravity modelling is investigated with a synthetic<br />
example similar to the Kylylahti formation.<br />
68
Geological Survey of Finland, Special Paper 59<br />
Petrophysical parameters and potential field modelling in the Outokumpu Belt<br />
GEOLOGICAL SETTING<br />
The Outokumpu Belt, part of the Northern Karelian<br />
Schist Belt (NKSB), is located in Eastern Finland,<br />
close to the suture between the Archean gneissicgranitoid<br />
basement domain in the northeast and<br />
the Palaeoproterozoic Svecofennian domain in the<br />
southwest (Fig. 1). The Outokumpu area within the<br />
NSKB has been one of the most important mining<br />
districts in Finland, the main target having been<br />
the Outokumpu-type semi-massive–massive Co-<br />
Cu-Zn sulphides. The sulphide ores are hosted by<br />
the “Outokumpu assemblage” or “Outokumpu<br />
association” rocks, a rock assemblage comprising<br />
carbonate, skarn and quartz rocks appearing as<br />
folded and faulted fringes to massive serpentinised<br />
peridotite bodies (Gaál et al. 1975, Gaál & Parkkinen<br />
1993, Peltonen et al. 2008). The Outokumpu assemblage<br />
rocks are hosted by allochthonous, metaturbiditic<br />
Kaleva greywackes (“mica schists”) with intercalations<br />
of graphitic shales (“black schists”), in<br />
a nappe complex that rests upon the Archean gneiss<br />
granitoid basement. A sheet of Jatulian quartzites<br />
and arkoses occurs northwest of the Miihkali area<br />
in between the Archean basement and overlying<br />
Kalevian strata. The quartzite sheet is intruded by<br />
Fig. 1. Generalised bedrock map of the Outokumpu region. Modified from Bedrock of Finland − DigiKP. Contains<br />
data from the National Land Survey of Finland Topographic Database 03/2013.<br />
69
Geological Survey of Finland, Special Paper 59<br />
Hanna Leväniemi<br />
Fig. 2. Outokumpu geological section 186.630 (from Koistinen 1981).<br />
ultramafic-mafic sills up to hundreds of metres<br />
thick that are also common in the Archean basement<br />
close to the Jatuli-Archean interface. West of<br />
the Outokumpu Belt, the Archean basement is intruded<br />
by the 1.86 Ga Maarianvaara granitoid suite.<br />
(Huhma 1971, Huhma 1986, Koistinen 1981, Peltonen<br />
et al. 2008, Kontinen et al. 2006).<br />
The cross-section for profile 186.630 (Koistinen<br />
1981) across the Outokumpu rock assemblage<br />
at the Outokumpu mine presented in Figure 2 illustrates<br />
a local geological set-up typical of the<br />
Outokumpu Belt: the meta-ultramafic massif,<br />
here mainly comprising serpentinised peridotite,<br />
quartz rocks and carbonate-skarn rocks, reaches<br />
the depth of several hundreds of metres, and with<br />
some variation extends along its northeast-bound<br />
strike for tens of kilometres. The carbonate, skarn<br />
and quartz rocks flank the folded serpentinite body<br />
(originally a thin, wide sheet (Koistinen 1981)) as<br />
thin fringes; all the presently known Outokumputype<br />
sulphide deposits are found in association<br />
with the fringing carbonate-skarn-quartz rock<br />
assemblage (Peltonen et al. 2008 and references<br />
therein). The black schists envelope the ultramafic<br />
rocks, and outside the Outokumpu assemblage<br />
rocks also appear as layers in the mica schist.<br />
The ultramafic bodies may also contain deformed<br />
and metamorphosed mafic rocks, mainly as small<br />
stocks, sills or dykes (Peltonen et al. 2008).<br />
DESCRIPTION OF DATASETS<br />
Petrophysical data<br />
In this study we use petrophysical data from two<br />
sources: the regional GTK petrophysical database<br />
and the petrophysical data from drill core samples.<br />
The <strong>sp</strong>arsely sampled GTK regional petrophysical<br />
database lacks data from the Outokumpu association<br />
rock types, but contains samples from all surrounding<br />
lithologies listed in Figure 1 except the<br />
volcanic and ultramafic rocks and black schists.<br />
70
Geological Survey of Finland, Special Paper 59<br />
Petrophysical parameters and potential field modelling in the Outokumpu Belt<br />
Thus it is ideal for characterizing the physical properties<br />
of regional lithological units. As the Outokumpu<br />
Belt has been quite thoroughly covered by<br />
drilling, for the Outokumpu association rock types,<br />
petrophysical cognizance can be augmented with<br />
analysis of the petrophysical samples from the drill<br />
cores, mainly produced by mining companies.<br />
GTK database<br />
The regional petrophysical database of Geological<br />
Survey of Finland (GTK) (Airo & Säävuori 2013)<br />
currently contains petrophysical data on more than<br />
130,000 outcrop samples systematically collected<br />
over the whole country. The database entries contain<br />
location coordinates, rock class attributes and<br />
determinations of density, magnetic susceptibility<br />
and intensity of remanent magnetization. Petrophysical<br />
sampling methods, data acquisition and<br />
measurement equipment are described in Airo &<br />
Säävuori (2013). In the study region, the data selected<br />
for analysis amount to 591 samples (Fig. 1).<br />
The selection only includes samples that could be<br />
properly assigned to one of the lithological units in<br />
Figure 1 based on their rock class.<br />
Petrophysical samples from drill cores<br />
The Outokumpu Belt has been extensively drilled<br />
during the decades of exploration. In this study,<br />
three different data sources for petrophysical data<br />
from drill cores could be <strong>sp</strong>ecified:<br />
1. The GEOMEX project (Kontinen et al. 2006,<br />
Peltonen et al. 2008) assembled a database<br />
comprising historic drill core data from the<br />
Outokumpu Oy archives, as well as a few drill<br />
cores acquired during the GEOMEX project. For<br />
a significant number of the drill holes, petrophysical<br />
data (magnetic susceptibility, density<br />
and galvanic resistivity) are also available:<br />
within the GEOMEX project, the petrophysical<br />
data were addressed by Ruotoistenmäki & Tervo<br />
(2006).<br />
2. Petrophysical drill core sample data from the<br />
Horsmanaho talc mine and its surroundings<br />
(Alava, Pehmytkivi and Karnukka sites), courtesy<br />
of Mondo Minerals B.V. (Pasi Talvitie, pers.<br />
comm. 2014).<br />
3. Petrophysical drill core sample data from the<br />
Kylylahti Cu-Au-Zn mine site, courtesy of Boliden<br />
Kylylahti (Jari Juurela, pers. comm. 2015).<br />
The data selected for analysis amount to ca. 38,000<br />
density and 26,000 magnetic susceptibility samples.<br />
In order to manage large amounts of data in a<br />
reasonable and meaningful way for modelling purposes,<br />
two questions must be considered: what is<br />
the suitable lithological classification and scale for<br />
analysing the data, and what are the factors affecting<br />
the value distributions within the selected<br />
lithological classification scheme?<br />
The selected drill core data contains hundreds of<br />
distinct rock unit names (“field names”) that make<br />
the classification of samples according to rock<br />
type an arduous task. For this reason, this study<br />
adapted the classification of the rock unit names<br />
used by Outokumpu Oy provided by the GEO-<br />
MEX team in their assembled drill-core database.<br />
The data in the two other mining site databases<br />
were reclassified according to the GEOMEX<br />
convention. The classification was further narrowed<br />
down to seven key classes as per the typical<br />
geological setting (Fig. 2), each of which, for the<br />
Table 1. Rock classes adopted from the GEOMEX project.<br />
General class Class name Abbreviation Description<br />
Outokumpu assemblage<br />
Serpentinites SP Serpentinised peridotites<br />
/ Rocks Talc-carbonate rocks<br />
SS<br />
Over 90% of carbonate and<br />
of ultramafic (soapstones)<br />
talc<br />
origin<br />
Other Outokumpu assemblage OUM<br />
Carbonate rocks, skarns and<br />
rocks of ultramafic origin<br />
quartz rocks<br />
Outokumpu assemblage<br />
/ other<br />
rocks<br />
Outokumpu metabasites OBA Metamorphosed mafic rocks:<br />
gabbros, amphibolites and<br />
chlorite schists<br />
Sulphide mineralizations SUL Semi-massive to massive<br />
mineralizations<br />
Schists (sedimentary<br />
origin)<br />
Mica schists MCS Meta-greywackes<br />
Black schists BS Black schists<br />
71
Geological Survey of Finland, Special Paper 59<br />
Hanna Leväniemi<br />
purposes of potential field modelling, form a single<br />
modelling unit. The seven classes and their<br />
abbreviation used throughout this study are presented<br />
in Table 1.<br />
The rocks within the rock classes presented in<br />
Table 1 show variation in mineral composition<br />
largely due to an increase in the metamorphic<br />
grade from a low amphibolite facies grade in the<br />
east to a high amphibolite facies grade in the west.<br />
Additional variables such as the local redox conditions<br />
and intensity of retrograde alteration also<br />
affect the variation, with all of these particularly<br />
affecting the serpentinites, but also calc-silicates<br />
and the hosting metasediments (Säntti et al. 2006).<br />
Thus, the region and accordingly the petrophysical<br />
databases should be further divided based on<br />
metamorphic zoning.<br />
Figure 3 illustrates the locations and <strong>sp</strong>atial division<br />
of the drill holes with petrophysical samples<br />
in the GEOMEX database, together with the metamorphic<br />
zoning. For serpentinites, antigorite and<br />
carbonate-antigorite serpentinites are most abundant<br />
in the east (zone A in Fig. 3), whereas the serpentinites<br />
in the west (zones B and C) are mainly<br />
mesh-textured lizardite-chrysotile serpentinites,<br />
in B zone dominantly derived from talc-olivine<br />
and anthophyllite olivine rocks and in zone C from<br />
anthophyllite and enstatite-anthophyllite rocks.<br />
Talc-carbonate rocks (soapstones) are restricted<br />
to zone A, there flanking the antigorite serpentinites.<br />
In zones B and C no prograde talc-carbonate<br />
rocks occur but retrograde talc-schists are met in<br />
late thin shear/fault zones dissecting serpentinites<br />
and skarn rocks. (Säntti et al. 2006)<br />
In this study, the GEOMEX database was divided<br />
into five regional groups (Fig. 3): the Keretti group<br />
comprises the drill holes in Zone C, zone B is divided<br />
into the Vuonos group (in the Outokumpu Belt)<br />
and Miihkali group in the north, and in Zone A the<br />
database is divided into Horsmanaho and Kylylahti<br />
groups. Zone A also includes the Horsmanaho and<br />
Kylylahti mine site datasets.<br />
Fig. 3. Sites for the drill cores with petrophysical sampling and the metamorphic zones A, B and C (after Säntti et<br />
al. 2006). Bedrock map modified from Bedrock of Finland − DigiKP. Contains data from the National Land Survey<br />
of Finland Topographic Database 03/2013.<br />
72
Geological Survey of Finland, Special Paper 59<br />
Petrophysical parameters and potential field modelling in the Outokumpu Belt<br />
Fig. 4. Internal rock-class distributions of density samples within each data group. KER = Keretti (GEOMEX), VUO<br />
= Vuonos (GEOMEX), MII = Miihkali (GEOMEX), HOR = Horsmanaho (GEOMEX), HOR_MINE = Horsmanaho (mine<br />
site), KYL = Kylylahti (GEOMEX), KYL_MINE = Kylylahti (mine site). For rock class descriptions, see Table 2.<br />
As emphasised by Ruotoistenmäki & Tervo (2006),<br />
all available drill-core data originate from various<br />
exploration projects and as such do not provide an<br />
objective view of the geological setting, but are biased<br />
towards certain rock types or, independently<br />
of the rock type, may be abnormally enriched in<br />
disseminated sulphides. The rock class distributions<br />
from samples with density measurements for<br />
each drill-hole data group are presented in Figure<br />
4. The serpentinites (SP) are most abundant in the<br />
westernmost zones (Keretti-Miihkali-Vuonos).<br />
Talc-carbonate rocks (SS) are most dominantly<br />
present in the data from the Horsmanaho mining<br />
site, but the distribution also depicts the relative<br />
scarcity of soapstones in the west (see text related<br />
to Fig. 3). The Kylylahti mine data emphasise the<br />
Outokumpu altered ultramafic rock class (OUM),<br />
which hosts the sulphide mineralization. The<br />
GEOMEX database drill holes in Horsmanaho and<br />
Kylylahti mainly consist of mica schists and enclosed<br />
black schist layers.<br />
Potential field datasets<br />
Both ground gravity and magnetic data (by Outokumpu<br />
Oy) exist for the study region and for the<br />
most part cover the Outokumpu Belt and Miihkali<br />
massif formations (Fig. 5). The vertical component<br />
gravity data were mostly collected with 100-m line<br />
<strong>sp</strong>acing and 20-m sample <strong>sp</strong>acing, and the vertical<br />
component magnetic data with 50-m line <strong>sp</strong>acing<br />
and 10-m sample <strong>sp</strong>acing.<br />
In addition to local ground surveys, the study region<br />
is mostly covered by more <strong>sp</strong>arsely sampled<br />
regional gravity data (Elo 2003) with mostly di<strong>sp</strong>ersed<br />
sample locations and ca. 500–1000 m sample<br />
<strong>sp</strong>acing, the 5 x 5 km gravity grid of the Finnish<br />
Geo<strong>sp</strong>atial Research Institute FGI (Kääriäinen<br />
& Mäkinen 1997) and airborne magnetic data of<br />
GTK (Hautaniemi et al. 2005). The regional gravity<br />
datasets are used and referred to, together with local<br />
data, in the modelling examples.<br />
Several reflection seismic profiles have been<br />
acquired in the study region during 2002-2008 in<br />
73
Geological Survey of Finland, Special Paper 59<br />
Hanna Leväniemi<br />
Fig. 5. Ground gravity (A) and magnetic (B) surveys in the Outokumpu-Miihkali region. Bedrock map: Bedrock of<br />
Finland – DigiKP.<br />
the FIRE and HIRE projects (Kukkonen & Lahtinen<br />
2006, Kukkonen et al. 2011, and Kukkonen et al.<br />
2012). The profile locations are shown in Figure<br />
6. One aim of this study is to model the deep-set<br />
features accross the Outokumpu region, and the<br />
existing seismic profiles provide a natural starting<br />
point for potential field modelling. However, as<br />
the existing detailed potential field datasets were<br />
found to cover the Outokumpu Belt rather narrowly<br />
(Fig. 5), in order to complement the data on<br />
the reflection seismic profiles and in other regions<br />
lacking coverage, new gravity profiles were measured<br />
as part of this study along local roads with<br />
50-m sample <strong>sp</strong>acing in 2014 (Fig. 6).<br />
74
Geological Survey of Finland, Special Paper 59<br />
Petrophysical parameters and potential field modelling in the Outokumpu Belt<br />
Fig. 6. New gravimetric profile locations. Contains data from the National Land Survey of Finland Topographic<br />
Database 03/2013.<br />
PETROPHYSICAL DATA ANALYSIS<br />
GTK database<br />
The density-susceptibility diagram for the rock<br />
classes in the GTK database is presented in Figure 7<br />
and the characterizing density statistics in Table 2.<br />
The granites (mostly from the Maarianvaara batholith)<br />
have the lowest densities, with a median of ca.<br />
2600 kg/m 3 , although the medians of granodiorites<br />
and quartzites are quite close (2622 and 2635 kg/<br />
m 3 , re<strong>sp</strong>ectively). The granite gneisses (2666 kg/<br />
m 3 ) dominating the Archean basement complex<br />
are lighter than the mica schists in the overlying<br />
Kaleva package (2704 kg/m 3 ). Gabbroic rocks in the<br />
ultramafic-mafic sills along the Archaean-Proterozoic<br />
interface expectedly have the highest densities,<br />
with the median value of 2985 kg/m 3 .<br />
The susceptibilities of the samples mainly remain<br />
in the paramagnetic population (values below<br />
2000 μSI as defined by Airo & Säävuori 2013).<br />
The only rock class with clearly ferrimagnetic<br />
samples is the gabbro class, indicating the presence<br />
of magnetite-rich, high-density gabbros in<br />
the region. Some granites also have high magnetic<br />
susceptibilities.<br />
75
Geological Survey of Finland, Special Paper 59<br />
Hanna Leväniemi<br />
Fig. 7. Density-susceptibility diagram for the rock classes in the GTK database.<br />
Table 2. Descriptive density statistics for the rock classes in the GTK database.<br />
Rock class N Mean (kg/m 3 ) Median (kg/m 3 ) Standard deviation (kg/m 3 )<br />
Granites 77 2598 2596 25<br />
Granodiorites 23 2610 2622 44<br />
Granite gneisses 9 2666 2666 20<br />
Quartzites 14 2625 2635 48<br />
Mica schists 450 2702 2704 58<br />
Gabbros 18 2985 2985 142<br />
Total 591<br />
Drill-core data<br />
Density distributions<br />
Density distributions and statistical key figures for<br />
each group are presented in Figure 8 and Table 3.<br />
The serpentinite (SP) densities clearly reflect the<br />
metamorphic zonation; the chrysotile serpentinites<br />
in the west are on average notably lighter<br />
than the antigorite serpentinites in the east. This<br />
difference was also noted on a general level by<br />
Lehtonen (1981). The talc-carbonate rocks (SS),<br />
which are in fact restricted to zone A in Figure 3,<br />
have a median density of 2908 kg/m 3 in Horsmanaho,<br />
where this rock type is most abundantly present<br />
in the data; in the west, the rocks labelled as<br />
talc-carbonate rocks are most likely shear-related<br />
talc schists (A. Kontinen, pers. comm. 2015). The<br />
other rocks of ultramafic origin (OUM) show a wider<br />
range of values, but the value distributions are<br />
quite similar to the median values, ranging around<br />
2800–2900 kg/m 3 . Metabasites (OBA) are mostly<br />
76
Geological Survey of Finland, Special Paper 59<br />
Petrophysical parameters and potential field modelling in the Outokumpu Belt<br />
Fig. 8. Density distributions for each Outokumpu Belt rock type according to region (KER = Keretti (GEOMEX),<br />
VUO = Vuonos (GEOMEX), MII = Miihkali (GEOMEX), HOR = Horsmanaho (GEOMEX), HOR_MINE = Horsmanaho<br />
(mine site), KYL = Kylylahti (GEOMEX), KYL_MINE = Kylylahti (mine site). The vertical scale for the sulphide<br />
mineralization class differs from the rest of the diagrams. (Note: not all groups have samples from all rock<br />
classes).<br />
77
Geological Survey of Finland, Special Paper 59<br />
Hanna Leväniemi<br />
Table 3. Density statistics according to rock class for each drill-hole group. For rock classes, see Table 1. For<br />
groups, see Figures 3 and 4. Q1 = first quartile, Q3 = third quartile. The unit for values is kg/m 3 . (Note: not all<br />
groups have samples from all rock classes). KER = Keretti (GEOMEX), VUO = Vuonos (GEOMEX), MII = Miihkali<br />
(GEOMEX), HOR = Horsmanaho (GEOMEX), HOR_MINE = Horsmanaho (mine site), KYL = Kylylahti (GEOMEX),<br />
KYL_MINE = Kylylahti (mine site).<br />
ROCK CLASS GROUP N Mean Q1 Median Q3 Std.dev.<br />
KER 820 2568 2490 2550 2620 123<br />
VUO 1963 2598 2510 2570 2640 167<br />
MII 1721 2572 2510 2550 2620 106<br />
SP<br />
HOR<br />
HOR_MINE 109 2742 2662 2756 2826 104<br />
KYL<br />
KYL_MINE 313 2772 2760 2760 2770 66<br />
KER 42 2727 2655 2715 2810 131<br />
VUO 469 2843 2800 2860 2910 99<br />
MII 192 2825 2780 2850 2910 124<br />
SS<br />
HOR<br />
HOR_MINE 626 2901 2878 2908 2931 44<br />
KYL 2 2854 2838 2854 22<br />
KYL_MINE 978 2811 2770 2790 2850 59<br />
KER 979 2842 2690 2800 2970 175<br />
VUO 1906 2837 2700 2800 2960 172<br />
MII 1603 2933 2850 2930 2990 144<br />
OUM<br />
HOR 13 2843 2750 2830 2945 113<br />
HOR_MINE 268 2869 2783 2880 2943 138<br />
KYL 28 2795 2732 2780 2862 85<br />
KYL_MINE 7802 2926 2820 2910 2990 136<br />
KER 106 2865 2760 2855 2950 133<br />
VUO 130 2829 2688 2800 2960 194<br />
MII 710 2900 2830 2920 2970 121<br />
OBA<br />
HOR<br />
HOR_MINE 45 2854 2804 2828 2880 83<br />
KYL<br />
KYL_MINE 284 2914 2810 2900 3000 133<br />
KER 2654 2747 2730 2740 2760 54<br />
VUO 5063 2757 2730 2750 2770 58<br />
MII 4102 2753 2730 2750 2770 62<br />
MCS<br />
HOR 467 2742 2720 2740 2750 42<br />
HOR_MINE 247 2754 2728 2745 2773 44<br />
KYL 648 2746 2730 2740 2770 41<br />
KYL_MINE 262 2894 2807 2870 2950 122<br />
KER 423 2819 2740 2800 2880 106<br />
VUO 1367 2804 2740 2790 2850 96<br />
MII 566 2850 2770 2820 2900 133<br />
BS<br />
HOR 249 2840 2785 2820 2880 96<br />
HOR_MINE 90 2799 2756 2790 2829 73<br />
KYL 55 2837 2770 2840 2900 97<br />
KYL_MINE 2018 2986 2890 2970 3080 135<br />
KER 7 2794 2620 2810 2890 140<br />
VUO 29 3210 3025 3260 3455 301<br />
MII 36 3494 3028 3430 3963 463<br />
SUL<br />
HOR<br />
HOR_MINE<br />
KYL<br />
KYL_MINE 882 3454 3290 3450 3610 230<br />
78
Geological Survey of Finland, Special Paper 59<br />
Petrophysical parameters and potential field modelling in the Outokumpu Belt<br />
relevant to the large Miihkali massif (see Fig. 4),<br />
and there have a median density of 2920 kg/m 3 .<br />
The density value distributions for mica schists<br />
are very uniform, with median values of 2740–<br />
2750 kg/m 3 , although there is a <strong>sp</strong>read from c.<br />
2650 to 2780 kg/m 3 . The median is slightly higher<br />
than the median value for the mica schists in the<br />
GTK regional database (Table 1), which probably<br />
reflects two factors: 1) the general enrichment of<br />
sulphides in the mica schists in drill cores from ore<br />
environments where mica schists often occur close<br />
and grade into sulphiditic black schists, and 2) the<br />
more weathered nature of the outcrops where the<br />
GTK samples have been collected (A. Kontinen,<br />
pers. comm. 2015). The black schists, heavier than<br />
the mica schists, also show more deviation in their<br />
densities. For both of the schist classes, the Kylylahti<br />
mine densities are notably higher than for the<br />
other datasets; Pekkarinen & Rekola (1994) also reported<br />
high densities for black schists, but as the<br />
GEOMEX database does not confirm the uncustomary<br />
increase in mica schist densities in Kylylahti,<br />
the reason for the high mica schist densities<br />
in the mine site database remains unclear.<br />
The number of sulphide mineralization samples<br />
is generally very low, with the exception of<br />
the Kylylahti mine site dataset. Moreover, the sulphide<br />
mineralization grades in the samples vary<br />
from semi-massive to massive ore, which inevitably<br />
affects the density ranges. The most reliable<br />
(with regard to the number of samples) Kylylahti<br />
dataset has a median density of 3450 kg/m 3 . Given<br />
the relatively low density of the Keretti samples,<br />
they most likely originate from the disseminated/<br />
veined type Co-Ni Hautalampi deposit parallel to<br />
the Keretti main ore (A. Kontinen, pers. comm.<br />
2015).<br />
Magnetic susceptibility distributions<br />
The GEOMEX magnetic susceptibility dataset proved<br />
to be more problematic than the density data, as it<br />
contains an abnormally large number of zero susceptibility<br />
values (18% of all data). Some of these<br />
values are without doubt true readings, but the<br />
high number of zero values leads to a su<strong>sp</strong>icion that<br />
missing values have been transformed into zeroes<br />
sometime during the long life <strong>sp</strong>an of this dataset.<br />
Therefore, in this study, all the zero values were rejected<br />
from the statistical analysis. Given that this<br />
most likely also removed true readings, the statistics<br />
may be slightly biased towards larger ends of<br />
the value ranges. It should also be noted that some<br />
of the data may date back to a time when the measurement<br />
sensitivity for magnetic susceptibilities<br />
was not yet up to current standards, and this may<br />
affect the overall accuracy of the data analysis.<br />
The magnetic susceptibility value distributions<br />
are often bi-peaked due to their paramagnetic<br />
and ferromagnetic components (e.g. Airo & Säävuori<br />
2013), and as such are often best presented as<br />
value distribution histograms instead of statistical<br />
key figures. The histograms for magnetic susceptibilities<br />
according to the region and rock class are<br />
presented in Figure 9 (note: some groups have no<br />
or very few samples from a certain rock class; if the<br />
number of samples N < 15, no histogram is plotted).<br />
The two clear rock classes with moderately<br />
high magnetic susceptibilities are the (chrysotile)<br />
serpentinites (SP), due to their magnetite content,<br />
and the black schists (BS), due to their monoclinic<br />
pyrrhotite content. In general, according to the<br />
distributions, the magnetic susceptibility values of<br />
the serpentinites appear to decrease towards the<br />
east, mirroring the change from chrysotile serpentinites<br />
in the west to antigorite serpentinites<br />
in the east (Horsmanaho, Kylylahti). The black<br />
schist susceptibilities similarly decrease towards<br />
the east, reflecting either a decrease in the amount<br />
of pyrrhotite or the presence of hexagonal (antiferromagnetic)<br />
pyrrhotite, which has also been<br />
detected in the black schists of the Outokumpu region<br />
(Airo et al. 2011).<br />
Remanent magnetization<br />
The GEOMEX database does not contain remanent<br />
magnetization measurements. According to Ahokas<br />
(1980), during 1974–1977, Outokumpu Oy performed<br />
measurements of remanent magnetization<br />
intensities and directions on an outcrop sample<br />
set mostly containing black schists, serpentinites<br />
and skarn rocks. However, due to the low number<br />
of samples and large <strong>sp</strong>read of values, the results<br />
were not considered reliable except for the black<br />
schists: the remanence magnetization parameters<br />
in the Outokumpu and Miihkali regions are presented<br />
in Table 4.<br />
The Horsmanaho mine site dataset contains<br />
determinations for the intensity of remanent<br />
magnetization, which enables calculation of the<br />
Koenigsberger ratio (Q), i.e. the ratio of remanent<br />
magnetization to induced magnetization (dependant<br />
on magnetic susceptibility k). The Q value indicates<br />
whether induced or remanent magnetization<br />
is more dominant in a given sample; for the<br />
79
Geological Survey of Finland, Special Paper 59<br />
Hanna Leväniemi<br />
Fig. 9. Magnetic susceptibility histograms according to the rock class and region. KER = Keretti (GEOMEX), VUO =<br />
Vuonos (GEOMEX), MII = Miihkali (GEOMEX), HOR = Horsmanaho (GEOMEX), HOR_MINE = Horsmanaho (mine<br />
site), KYL = Kylylahti (GEOMEX), KYL_MINE = Kylylahti (mine site). For rock class descriptions, see Table 1.<br />
80
Geological Survey of Finland, Special Paper 59<br />
Petrophysical parameters and potential field modelling in the Outokumpu Belt<br />
Table 4. Remanent magnetization parameters for black schists (from Ahokas 1980).<br />
Koenigsberger ratio (Q) Inclination Declination<br />
Outokumpu Belt 8 45° 70°<br />
Miihkali 10 45° 90°<br />
latter (Q > 1), modelling becomes more challenging<br />
if the direction of the remanent magnetization is<br />
not known (as is often the case). This is e<strong>sp</strong>ecially<br />
the case for small-grained pyrrhotite and magnetite,<br />
as they can better retain stable remanent magnetization<br />
directions that deviate from the current<br />
direction of the Earth’s field (e.g. Clarke 1997).<br />
In the Horsmanaho mine site dataset, for samples<br />
with moderate to high susceptibility (k > 1000<br />
μSI), there are numerous Q values of 10–100, most<br />
notably for the black schists (for other rock classes,<br />
the majority of the samples belong to the k <<br />
1000 μSI population; see Fig. 9). This conforms<br />
to or, in fact, exceeds the findings of Outokumpu<br />
Oy discussed above, indicating that e<strong>sp</strong>ecially for<br />
black schists, remanent magnetization plays a<br />
prominent role as the magnetic anomaly source.<br />
For serpentinites, Q reaches values of 1–5, but the<br />
dominant direction of remanent magnetization, if<br />
exists, remains unknown.<br />
Fig. 10. Magnetic susceptibility (k) versus Q ratio diagram for the Horsmanaho mine site dataset for samples with<br />
k > 1000 μSI. Data courtesy of Mondo Minerals B.V. For rock class descriptions, see Table 1.<br />
MODELLING EXAMPLES<br />
The following chapters present both regional-scale<br />
(along the extended V7 and V8 seismic profiles) as<br />
well as the deposit-scale (the Keretti profile and<br />
the Kylylahti deposit) modelling examples. Modelling<br />
of the Miihkali massif north of the Outokumpu<br />
Belt is presented by Lahti et al. (2016, this volume)<br />
and the V7 example is discussed in a more extensive<br />
context by Heinonen et al. (2016, this volume).<br />
81
Geological Survey of Finland, Special Paper 59<br />
Hanna Leväniemi<br />
Regional modelling of seismic profiles V7 and V8<br />
To study the deep-set features across the Outokumpu<br />
region, the gravity data were forward modelled<br />
along the extended V7 and V8 seismic profiles<br />
(Kukkonen & Lahtinen 2006) (Fig. 11). The modelling<br />
was performed with Tensor Research Model-<br />
Vision 14.1 software.<br />
For the V7 profile, the gravity modelling data<br />
consist of the new 2014 profile data (Fig. 6 and related<br />
text). For the profile V8, the data were sampled<br />
from the interpolated regional gravity data<br />
(Elo 2003), and outside the regional data coverage<br />
the values were estimated based on the interpolated<br />
raster of the 5 x 5 km national data grid courtesy<br />
of the Finnish Geo<strong>sp</strong>atial Research Institute FGI<br />
(Kääriäinen & Mäkinen 1997).<br />
The seismic section images of the profiles V7<br />
and V8 show strong reflectors at the depths of<br />
one kilometre and below. These are similar to the<br />
strong upper-crust reflector on FIRE-3 pierced<br />
by the Outokumpu Deep Drill Hole; the reflective<br />
re<strong>sp</strong>onse there was confirmed to originate from<br />
Outokumpu assemblage rocks (Kukkonen 2011),<br />
and consequently, Kukkonen et al. (2012) discussed<br />
all the seismic profiles and the nature of<br />
strong reflectors in the region. For profile V7, instead<br />
of or at least in addition to possible Outokumpu<br />
assemblage rocks, the most likely source<br />
candidate for the strong, deep-plunging reflectors<br />
was discovered by Kontinen & Säävuori (2013), who<br />
documented a shallow two-hole drilling in Saarivaara,<br />
ca. 1 km NW of the northern end of V7 (Fig.<br />
11). The data have since been augmented by two<br />
additional drill holes (Fig. 12). The drilling revealed<br />
a sequence of alternating layers of calc-silicate<br />
gneisses, metadiabases, Jatulian quartzites and<br />
Archean gneisses, and the strike and dip of the layers<br />
is well in accordance with the strong reflectors<br />
in the northwestern part of the V7 seismic section<br />
image. For profile V8, there are similar reflective<br />
features, and as the distance between the profiles<br />
is relatively small, it is assumed here that the same<br />
geological environment prevails in both profiles.<br />
Fig. 11. Gravity modelling profile locations (in red) along the seismic lines V7 and V8 (in black). The sample coverage<br />
of the regional gravity data is marked by dot symbols. Outside the regional data coverage, the map di<strong>sp</strong>lays<br />
FGI data.<br />
82
Geological Survey of Finland, Special Paper 59<br />
Petrophysical parameters and potential field modelling in the Outokumpu Belt<br />
Fig. 12. Saarivaara drilling profile. Input data provided by A. Kontinen. Figure modified from Kontinen & Säävuori<br />
(2013).<br />
Based on the drill core densities in the Saarivaara<br />
drilling profile, the density of quartzites and arkosites<br />
in the strata is ca. 2650 kg/m 3 , mica gneisses<br />
ca. 2750 kg/m 3 , calc-silicate gneisses ca. 2850–3150<br />
kg/m 3 and amphibolites 2950–3050 kg/m 3 . The unit<br />
of alternating layers is estimated to be 300–500 m<br />
thick and internally strongly foliated. Even more<br />
high-density amphibolites layers may exist within<br />
the underlying Archean gneisses, which would explain<br />
the considerable thickness of the reflectors.<br />
(Kontinen & Säävuori 2013)<br />
The V7 profile is located on the metamorphic<br />
zone B (Fig. 3) and the V8 profile crosses from zone<br />
A to B. The strong upper-crust reflector on FIRE-3<br />
related to Outokumpu assemblage rocks encountered<br />
at the depths of 1300-1500 m in the Outokumpu<br />
Deep Drill Hole (also on zone B, ca. 2 km east of<br />
the Outokumpu town) shows mean densities of ca.<br />
2600 kg/m 3 (serpentinites) to ca. 2900-3000 kg/<br />
m3 (skarns and black schists) (Airo et al. 2011). On<br />
zone B, in general, the median density of serpentinites<br />
is ca. 2550 g/cm3 and on zone A 2760 kg/m 3 .<br />
The density of the other altered ultramafic rocks<br />
varies approximately between 2800-2930 kg/m 3<br />
(Table 3).<br />
The density ranges of both the Saarivaara reflector<br />
rocks and Outokumpu association rocks are<br />
wide and for any gravity model body, the overall<br />
density contrast with the host rock (mica schist)<br />
depends on the rock composition. With the many<br />
degrees of freedom present in interpretation models,<br />
the Outokumpu association rocks and Saarivaara<br />
type rocks could not be reliably separated<br />
from each other by their overall densities, even if<br />
some of the strong seismic reflectors were due to<br />
the Outokumpu association. In the model presented<br />
here, the estimated average density of 2800 kg/<br />
m 3 is used for all reflective packages.<br />
The modelling parameters on gravimetric profiles<br />
V7 and V8 are presented in Table 5. The V8<br />
profile extends from the Maarianvaara granite in<br />
the northwest to the Archean Sotkuma gneiss in<br />
the southeast (Fig. 1, Fig. 11). On the gravimetric<br />
Bouguer anomaly map, granite and gneiss present<br />
as gravity minima due to the low density of the<br />
granitoids of ca. 2670 kg/m 3 (Table 2). This value<br />
Table 5. Gravity model parameters.<br />
Gravity data source<br />
Model body extents /<br />
densities<br />
Regional level<br />
Profile V7<br />
Profile V8<br />
GTK 2014 survey (projected on a Regional gravity data (APV); outside the<br />
straight profile)<br />
APV survey region, FGI data were used<br />
Outokumpu allochthon metasediments: 20 km / 2720–2740 kg/m 3<br />
Saarivaara reflectors: 10 km / 2800 kg/m 3<br />
Outokumpu Belt (on V8): 5 km / 2800 kg/m 3<br />
-13.0 mgal<br />
83
Geological Survey of Finland, Special Paper 59<br />
Hanna Leväniemi<br />
Fig. 13. Bouguer anomaly model along seismic profile V8.<br />
Fig. 14. Bouguer anomaly model along seismic profile V7 (after Heinonen et al. 2016 (this volume)).<br />
84
Geological Survey of Finland, Special Paper 59<br />
Petrophysical parameters and potential field modelling in the Outokumpu Belt<br />
was used as the background density value for the<br />
model.<br />
For seismic profile V8, the measured gravity<br />
profile shows a large, long-wavelength maximum<br />
between the profile ends (Fig. 13). The first model<br />
bodies to enter in the model were the deep-plunging<br />
high reflectivity bodies, named here as Saarivaara<br />
reflectors and constructed after the seismic<br />
profile images; they produce a major part of the total<br />
Bouguer anomaly at the NW end of the profile.<br />
The metasediments are on average heavier than<br />
the granitoids (Fig. 7, Table 2), and thus contribute<br />
to the long-wavelength maximum between the<br />
granitoid minima; as the strong reflectors more or<br />
less disappear towards the southeast, their absence<br />
is compensated in the model by the thickening<br />
metasediment layer. The SE-dipping Outokumpu<br />
Belt formation shows as a local gravity maximum<br />
23–25 km from the NW end of the profile.<br />
The density of the metasediment formation in<br />
the model varies between 2720 and 2740 kg/m 3 so<br />
that the SW part of the formation is heavier. The<br />
density values for metasediments in the model are<br />
thus slightly lower than metasediment values in<br />
the drill holes (Table 3), suggesting that the rocks<br />
labelled as metasediments in the Outokumpu Belt<br />
may be slightly heavier than the metasediments<br />
regionally.<br />
The V7 profile model (Fig. 14) is described in detail<br />
by Heinonen et al. (2016, this volume). The data<br />
on this profile were collected with denser sample<br />
<strong>sp</strong>acing than the data used for modelling V8, but<br />
with the deep structure re<strong>sp</strong>onses, the effect of<br />
sample <strong>sp</strong>acing on the model is quite insignificant.<br />
Deposit-scale modelling examples<br />
Keretti profile: magnetic and gravity<br />
interpretation<br />
No systematic gravity data exist or remain in the<br />
Outokumpu Oy gravimetric database for the historic<br />
Keretti mine (see Fig. 6). However, as it is probably<br />
the best place to validate the density parameters<br />
for chrysotile serpentinites due to both the<br />
abundance of serpentinites and the well-known<br />
geological constraints, one of the new gravity profiles<br />
(Fig. 6) was measured across the Outokumpu<br />
Belt at Keretti.<br />
The new gravity data were jointly modelled with<br />
vertical component magnetic data (profile 185.400)<br />
from the data archives of Outokumpu Oy. The locations<br />
of the new gravimetric profile and the magnetic<br />
profile are indicated in Figure 15. The map<br />
also plots soil thickness readings derived from the<br />
drill-core database; they show values as high as<br />
>50 m in the mid-part of the gravity profile. This<br />
NE-trending region (Sumppi) is part of the Outokumpu/Keretti<br />
mines tailings area (e.g. Tornivaara<br />
& Kauppila 2014). Even though the region has been<br />
reworked since drilling, it can be assumed that in<br />
the mid-part of the profile, the soil cover can reach<br />
thicknesses of dozens of metres, and this information<br />
should be included in the model.<br />
The physical/geological model (Fig. 16) comprises<br />
three rock classes (excluding the model background<br />
rock mica schist) and the soil cover, assumed<br />
to be wet sand with a density of 2000 kg/m 3<br />
(Parasnis 1971). The density values for the model<br />
rocks were selected according to median values in<br />
Table 3 and magnetic susceptibilities estimated<br />
from Figure 9. As remanent magnetization parameters<br />
are known only for the black schists (BS)<br />
(Table 4), the values were included in the model.<br />
However, in the course of modelling, the Koenigsberger<br />
ratio (Q) values were increased from eight to<br />
fifteen, as this improved the model fit; the Horsmanaho<br />
data example (Fig. 10) shows that for black<br />
schists, values of Q > 10 are also well justifiable.<br />
Two nearby cross-profiles of Koistinen (1981)<br />
were used as geological constraints (Fig. 17). All<br />
model bodies were extended 1500 m away from the<br />
profile in both directions.<br />
The magnetic model re<strong>sp</strong>onse in Figure 16 highlights<br />
the importance of understanding the role<br />
of remanent magnetization as an anomaly source.<br />
Assuming the remanent magnetization parameters<br />
were not known, i.e. the magnetization of<br />
black schists was assumed to be caused by induced<br />
magnetization only (model profile Q bs<br />
= 0), it is<br />
practically impossible (considering the geological<br />
constraints and the measured susceptibility range)<br />
to match the model re<strong>sp</strong>onse to the observed values.<br />
However, as soon as the remanent magnetization<br />
parameters are included (model profile<br />
Q bs<br />
= 15), the model re<strong>sp</strong>onse amplitudes increase<br />
significantly and the modelled re<strong>sp</strong>onse conforms<br />
significantly better to the observed data.<br />
On the gravimetric profile, the 2.5-mgal minimum<br />
is largely caused by the low-density chrysotile<br />
serpentinite (SP) body, but the rather thick soil<br />
cover in the Sumppi region also contributes to the<br />
minimum. On this profile, OUM and BS rock class<br />
85
Geological Survey of Finland, Special Paper 59<br />
Hanna Leväniemi<br />
Fig. 15. Keretti modelling profile locations and soil thicknesses (as circle symbols) based on the drill-core database.<br />
Contains data from the National Land Survey of Finland Topographic Database 03/2013.<br />
Fig. 16. Joint magnetic (MG, model profiles on the top) and gravity (GR, model profiles in the middle) forward<br />
model over Keretti (model bodies on the bottom). Rock class abbreviations as per Table 1; ρ = density, k = magnetic<br />
susceptibility, Q = Koenigsberger ratio.<br />
86
Geological Survey of Finland, Special Paper 59<br />
Petrophysical parameters and potential field modelling in the Outokumpu Belt<br />
Fig. 17. Model cross section (MG+GR) in comparison to the geological profiles 185.100 and 186.630 of Koistinen<br />
(1981).<br />
model densities are identical, and thus here the<br />
two rock classes cannot be distinguished from each<br />
other by gravity modelling.<br />
Kylylahti model<br />
The isolated gravity anomaly in the Outokumpu<br />
Oy systematic ground survey data over Kylylahti<br />
(see location in Fig. 6) was interpreted with 3D inversion.<br />
Contrary to the conventional 2D and 3D<br />
forward modelling of previous examples, which<br />
calculates the theoretical re<strong>sp</strong>onse of a given subsurface<br />
property distribution, inversion results in a<br />
model that predicts the property distribution for a<br />
given observed re<strong>sp</strong>onse. The UBC-GIF GRAV3D inversion<br />
algorithm (Li & Oldenburg 1996), when run<br />
without any constraints, can be used for a quick,<br />
first-pass estimation of the gravity distribution,<br />
but for a more careful and realistic end result it is<br />
advisable to apply physical and/or geological constraints<br />
to inversion (e.g. Williams 2006).<br />
The observed gravity data (Pekkarinen & Rekola<br />
1994) contain vertical component gravity data<br />
collected with 50–100-m line <strong>sp</strong>acing and 20-m<br />
sample <strong>sp</strong>acing (Fig. 18A). The data lines were reorganised<br />
and the data microlevelled to improve<br />
the quality. The total value range in the dataset is<br />
ca. 4.5 mgal (Fig. 18B). Much of the re<strong>sp</strong>onse at the<br />
lower end of the range results from the regional<br />
long-wavelength feature in the southeast, caused<br />
by the low-density Sotkuma granite gneiss formation<br />
(Fig. 1). Prior to inversion, the regional trend<br />
must be subtracted from the observed data. The<br />
resulting residual anomaly (Fig. 18C) has its maximum<br />
at ca. 2.5 mgal.<br />
In this study, the inversion constraints were<br />
based on the drill-core densities in the vicinity of<br />
the ore zone (Fig. 19) provided by Boliden Kylylahti.<br />
The drill-core data extend from the northern<br />
shallow drill holes along the ore zone to the depth<br />
of ca. 850 m, penetrating the deepest of the three<br />
separate mineralizations, the Wombat ore (Altona<br />
Mining Limited 2014). Two high-density zones can<br />
be identified in the density dataset, one related to<br />
the main mineralization zone by the eastern contact<br />
of the Kylylahti formation and the second to a<br />
shallower black schist zone; the densities of black<br />
schists in the Kylylahti region are notably higher<br />
than elsewhere in Outokumpu (Pekkarinen &<br />
Rekola 1995; Table 3).<br />
Based on the drill-core densities, three mutually<br />
excluding density zones were extracted from<br />
87
Geological Survey of Finland, Special Paper 59<br />
Hanna Leväniemi<br />
Fig. 18. A) Survey lines on a geological map (Bedrock of Finland − DigiKP), B) observed gravimetric data,<br />
C) residual data after regional trend removal.<br />
Fig. 19. Drill-core densities in the vicinity of the mineralised zone (viewed from southeast). Drill-core data and<br />
ore body model courtesy of Boliden Kylylahti. The geological map with gravity survey lines (bottom right) outlines<br />
the surface projection of the drill holes (black rectangle).<br />
the data and used as inversion constraints (Fig.<br />
20; values presented relative to to the density (ρ)<br />
of 2750 kg/m 3 (2.75 g/cm 3 ), the common density<br />
value of mica schist in Outokumpu (Table 3)). The<br />
constraints were included in the inversion as subregions<br />
where the recovered density is not allowed<br />
to vary outside the density boundaries indicated by<br />
the constraint. Outside the constraining density<br />
zones, i.e. in the unconstrained part of the inversion<br />
volume, the density is allowed to vary in the<br />
range -1.0 ≤ ρ ≤ 1.0 g/cm 3 . Inversion parameters are<br />
presented in Table 6.<br />
To validate the effect of the applied constraints,<br />
the inversion was also run without constraints<br />
(with the universal allowed value range of<br />
-1.0 ≤ ρ ≤ 1.0 g/cm 3 ). Comparison between the con-<br />
88
Geological Survey of Finland, Special Paper 59<br />
Petrophysical parameters and potential field modelling in the Outokumpu Belt<br />
Fig. 20. Density zones corre<strong>sp</strong>onding to inversion constraints. A) True densities 2.75–2.78 g/cm 3 , B) true densities<br />
over 2.95 g/cm 3 , C) true densities over 3.1 g/cm 3 .<br />
Table 6. GRAV3D parameters for the Kylylahti gravity inversion.<br />
Inversion parameter Value<br />
Mesh size<br />
100 x 120 x 100 cells (excluding padding)<br />
Cell size<br />
50 x 50 m, cell height increasing downwards<br />
Maximum depth<br />
5000 m<br />
Data error<br />
0.1 mgal<br />
Chifact 0.5<br />
Topography level<br />
100 m<br />
Depth weighting β = 2.0, z 0<br />
= 51.00<br />
Initial and reference models 0.0 mgal<br />
strained and unconstrained results (Fig. 21) demonstrates<br />
that the selected constraints have a crucial<br />
effect on the results. The constrained model<br />
shows the two high-density zones in the densely<br />
drilled region (marked as a constraint region in Figure<br />
21A) as expected, but in addition, it also shows<br />
better continuity of features in the regions where<br />
constraints do not apply. The unconstrained model<br />
is not able to separate between the two high-density<br />
zones, but goes for the simplest solution, that<br />
is, a single high-density structure that shows little<br />
correlation with the drilling results. Based on<br />
this, the southern high-density structure outside<br />
the constraint region in Figure 21A may just as well<br />
be divided in several parts, but the inversion is unable<br />
to separate between the parts. The necessary<br />
constraints could possibly be constructed based on<br />
the crossing reflection seismic profile V1.<br />
Three north–south cross-sections of the constrained<br />
model (Fig. 22) highlight the main features<br />
in more detail. In the ore zone (A) and the<br />
shallow black schist zone (B), the model shows<br />
densities ≥ 3.0 g/cm 3 due to the initial constraints;<br />
in the western section (C), the two high-density<br />
features are effectively solved unconstrained, as<br />
no or very few drill holes with density data are<br />
available in this section. The features most likely<br />
represent an imprecise, smoothed version of the<br />
actual physical value distribution.<br />
Synthetic example<br />
The constrained Kylylahti inversion model provides<br />
an opportunity to examine the theoretical change<br />
in the gravimetric Bouguer anomaly re<strong>sp</strong>onse as a<br />
function of source depth in the case of the highdensity<br />
Outokumpu association rocks. Figure 23<br />
shows the forward modelled gravity re<strong>sp</strong>onse of<br />
the 2-km-deep 3D density mesh extracted from<br />
the top part of the Kylylahti constrained inversion<br />
model and transferred to various depths. With the<br />
top of the structure at the surface (depth 0 m), the<br />
corre<strong>sp</strong>onding anomaly amplitude is ca. 2 mgal. As<br />
the source is moved deeper, the amplitude naturally<br />
attenuates; were the top of the formation located<br />
at 500 m depth, the corre<strong>sp</strong>onding anomaly could<br />
still be separated from the background level, but at<br />
1000 m depth the low amplitude and longer wavelength<br />
already make the task more challenging.<br />
Below 1000 m, it would be difficult to distinguish<br />
the re<strong>sp</strong>onse of the formation from the regional<br />
level, e<strong>sp</strong>ecially with there is any noise included in<br />
measurement data.<br />
89
Geological Survey of Finland, Special Paper 59<br />
Hanna Leväniemi<br />
Fig. 21. The general shape of high-density structures according to the constrained (A) and unconstrained (B)<br />
recovered inversion models clipped at 0.1 g/cm 3 in the vicinity of the Kylylahti mine (viewed from the east).<br />
90
Geological Survey of Finland, Special Paper 59<br />
Petrophysical parameters and potential field modelling in the Outokumpu Belt<br />
Fig. 22. Constrained inversion model clipped with NS plane A) E=3619650, B) E=3619450, C) E=3619200, together<br />
with a surface geological map (Bedrock of Finland – DigiKP), geological cross-section (Kontinen et al. 2006) and<br />
drill-core densities courtesy of Boliden Kylylahti.<br />
91
Geological Survey of Finland, Special Paper 59<br />
Hanna Leväniemi<br />
Fig. 23. The modelled gravity re<strong>sp</strong>onse of the Kylylahti formation located at various depths (depth values indicate<br />
the top of the formation). Data contours at 0.2-mgal intervals.<br />
DISCUSSION<br />
A major part of this study focused on the classification<br />
and grouping of the large petrophysical drillcore<br />
sample datasets available for the Outokumpu-<br />
Miihkali region. When connected to modelling,<br />
petrophysical data cannot be treated as a solitary<br />
dataset, but need to be evaluated together with<br />
other sample qualifiers. In order to manage, classify<br />
and analyse the data for modelling purposes, the<br />
rock type and location of samples need to be correctly<br />
defined. It is therefore not only the quality<br />
of the petrophysical measurements performed on<br />
samples, but also the quality and accuracy of other<br />
qualifiers that is essential for a successful modelling<br />
outcome.<br />
The historical data used in this study have been<br />
generated over several decades of exploration in<br />
the Outokumpu region. Inevitably, lithological<br />
definitions for the drill-core samples, in particular,<br />
show great diversity. The work performed in<br />
the GEOMEX project in standardizing and documenting<br />
the rock classes in the drill-core database<br />
is noteworthy. Without their antecedent efforts it<br />
would not have been possible to complete the petrophysical<br />
classification presented in this study.<br />
The choice of data classification scheme in this<br />
study was based on major rock classes and rock<br />
combinations typical of the Outokumpu association.<br />
It may be justifiably argued that, for example,<br />
92
Geological Survey of Finland, Special Paper 59<br />
Petrophysical parameters and potential field modelling in the Outokumpu Belt<br />
the OUM class containing carbonate rocks, skarns<br />
and quartz rocks should be subdivided in petrophysical<br />
analysis, as the densities of the rock types<br />
within the class diverge from each other. However,<br />
the subjective choice of combining the rock classes<br />
in the way presented in this study was based on the<br />
available geological cross-sections: the aim was to<br />
have the geophysical models equate to the existing<br />
geological models with reasonably sized modelling<br />
units.<br />
The importance of including all available geological<br />
and geophysical background knowledge in<br />
the modelling/inversion process is evident, e<strong>sp</strong>ecially<br />
when dealing with low-amplitude re<strong>sp</strong>onses<br />
from deep-set sources. In the Outokumpu region,<br />
density modelling is better controlled than magnetic<br />
modelling: the significant amount of remanent<br />
magnetization, e<strong>sp</strong>ecially in black schists but<br />
also in other rocks, can easily lead the modeller<br />
astray, as even today the remanent magnetization<br />
parameters are only known on a general level.<br />
Modelling examples demonstrated that with the<br />
help of background data and constraints, gravity<br />
modelling can detect sources at depths of several<br />
kilometres; however, the geological nature<br />
of these sources is not easily resolved. When the<br />
sources are set deeper or the density distributions<br />
become more complex, the roles of reliable constraints<br />
and integration of data in an effective 3D<br />
modelling environment increase.<br />
CONCLUSIONS<br />
The data from petrophysical drill-core samples<br />
from the Outokumpu brownfield mining camp,<br />
collected over several decades of exploration, were<br />
re-classified and reanalysed in this study. In addition<br />
to lithological classification, the data were also<br />
grouped by location, because, mainly due to the<br />
changing metamorphic grade, the Outokumpu Belt<br />
and its vicinity cannot be treated as a homogeneous<br />
region with regard to any of the rock unit’s physical<br />
parameter ranges.<br />
In the Outokumpu Belt and Miihkali, serpentinites<br />
are present in the Outokumpu assemblage<br />
throughout the region. Due to metamorphic zoning<br />
and the resulting mineral compositions, their<br />
densities vary from ca. 2560 kg/m 3 in the southwest<br />
to ca. 2760 kg/m 3 in the northeast. At the<br />
high end of the density range, the sulphide ore in<br />
Kylylahti has a median density of 3450 kg/m 3 . The<br />
talc-carbonate rocks and talc schists and the rest<br />
of the rocks of ultramafic origin have densities of<br />
ca. 2800–2850 kg/m 3 , and locally even 2900 kg/m 3 .<br />
The metabasites, most prominent in Miihkali, have<br />
there densities of 2920 kg/m 3 . The density range<br />
for the Outokumpu allochthon metasediments is<br />
narrowly constricted to values around 2750 kg/m 3<br />
and for black schists around 2800 kg/m 3 . Various<br />
granitoids (2600–2670 kg/m 3 ) are lighter than the<br />
allochthon metasediments that, in the regional<br />
gravity models presented in this study, give rise to<br />
a regional long-wavelength Bouguer anomaly between<br />
the granitoids in the Maarianvaara-Saarivaara<br />
region and Sotkuma.<br />
Both forward modelling and inversion algorithms<br />
were applied in gravity modelling cases.<br />
The regional and deposit-scale modelling problems<br />
set in the study could all be reliably solved by<br />
applying the density parameters obtained from the<br />
petrophysical data together with available geological<br />
and geophysical constraints. Forward models<br />
for the seismic profiles V7 and V8 presented in the<br />
study have their deepest model bodies at depths<br />
of 8–9 km. However, as the re<strong>sp</strong>onse from these<br />
depths is already strongly attenuated, the model is<br />
at these depths a rather subjective interpretation<br />
of the seismic reflection image: detailing these<br />
sources without the constraints provided by the<br />
seismic data would be a challenge. Also, as shown<br />
by the V7 and V8 profile model cases with the Saarivaara<br />
reflector rocks that have the overall density<br />
similar to Outokumpu association rocks, reliably<br />
judging the yet unknown geological nature of other<br />
strong, deep reflectors on the profiles based on<br />
the long-wavelength re<strong>sp</strong>onse in the gravity data<br />
is a task that remains unresolved by petrophysical<br />
classification and potential field modelling.<br />
In addition to density contrasts, the depth of<br />
detection also depends on the source body dimensions:<br />
a synthetic gravity modelling example indicates<br />
that a body with dimensions and properties<br />
similar to the Kylylahti formation, small in size in<br />
comparison to the massive reflectors on the seismic<br />
profiles, can be detected in gravity data from a<br />
depth of one kilometre or less.<br />
All the rock classes show low to moderately high<br />
magnetic susceptibilities. Most of the induced<br />
magnetization originates from serpentinites and<br />
black schists. However, remanent magnetization<br />
often dominates over induced magnetization as the<br />
93
Geological Survey of Finland, Special Paper 59<br />
Hanna Leväniemi<br />
magnetic anomaly source, as shown by the Keretti<br />
modelling example in this work. Including remanent<br />
magnetization as a petrophysical parameter<br />
is an a<strong>sp</strong>ect that warrants careful consideration in<br />
magnetic modelling on the region.<br />
ACKNOWLEDGEMENTS<br />
The author would like to warmly thank A. Kontinen<br />
for his generous help and comments, which<br />
helped improve the manuscript. T. Ruotoistenmäki<br />
is thanked for sharing his experience of the geophysical<br />
characteristics of the Outokumpu region.<br />
S. Mertanen and T. Ahokas are acknowledged for<br />
reviewing the manuscript. Boliden Kylylahti and<br />
Mondo Minerals B.V. are thanked for providing<br />
petrophysical data for the study.<br />
REFERENCES<br />
Ahokas, T. 1980. Petrofysikaalisia sovellusesimerkkejä.<br />
In: Pesonen. L. J. (ed.) Sovelletun geofysiikan jatkokurssi<br />
1979−1980: ”Petrofysiikan sovellutuksia”. Otaniemi:<br />
Helsinki University of Technology. (in Finnish)<br />
Ahokas, T. 1984. Vuonos – Kylylahti (ns. Papan putki)<br />
geofysikaalisista tutkimuksista. Outokumpu Oy. 11 p.<br />
(in Finnish)<br />
Airo, M.-L. & Säävuori, H. 2013. Petrophysical characteristics<br />
of Finnish bedrock: Concise handbook on the<br />
physical parameters of bedrock. Geological Survey of<br />
Finland, Report of Investigation 205. 33 p.<br />
Airo, M.-L., Säävuori, H. & Vuoriainen, S. 2011. Petrophysical<br />
properties of the Outokumpu Deep Drill Core<br />
and the surrounding bedrock. In: Kukkonen, I. T. (ed.)<br />
Outokumpu Deep Drilling Project 2003-2010. Geological<br />
Survey of Finland, Special Paper 51, 64−82.<br />
Altona Mining Limited 2014. Kylylahti Resources Increased.<br />
ASX/Media Announcement, 26 March 2014.<br />
Bedrock of Finland – DigiKP. Digital map database [Electronic<br />
resource]. E<strong>sp</strong>oo: Geological Survey of Finland<br />
[referred 09.03.2016]. Version 2.0.<br />
Clark, D. A. 1997. Magnetic petrophysics and magnetic<br />
petrology: aids to geological interpretation of magnetic<br />
surveys. AGSO Journal of Australian Geology &<br />
Geophysics, 17(2), 83−103.<br />
Elo, S. 2007. Gravity Operations of the Geological Survey<br />
of Finland. In: Poutanen, M. & Koivula, H. (eds.) Geodetic<br />
Operations in Finland 2004-2007. Finnish Geodetic<br />
Institute, 33−36.<br />
Gaál, G. & Parkkinen, J. 1993. Early Proterozoic ophiolite-hosted<br />
copper-zinc-cobalt deposits of the Outokumpu<br />
type. In: Kirkham, R. V., Sinclair, W. D.,<br />
Thorpe, R. I. & Duke, J. M. (eds) Mineral Deposit Modelling.<br />
Geological Association of Canada, Special<br />
Paper 40, 335−341.<br />
Gaál, G., Koistinen, T. & Mattila, E. 1975. Tectonics and<br />
stratigraphy of the vicinity of Outokumpu, North Karelia,<br />
Finland: including a structural analysis of the<br />
Outokumpu ore deposit. Geological Survey of Finland,<br />
Bulletin 271. 67 p.<br />
Hautaniemi, H., Kurimo, M., Multala, J., Leväniemi,<br />
H. & Vironmäki, J. 2005. The “Three In One” aerogeophysical<br />
concept of GTK in 2004. In: Airo, M.-L.<br />
(ed.) Aerogeophysics in Finland 1972-2004: Methods,<br />
System Characteristics and Applications. Geological<br />
Survey of Finland, Special Paper 39, 21−74.<br />
Heinonen, S., Kontinen, A., Leväniemi, H., Lahti, I.,<br />
Junno, N., Kurimo, M. & Koivisto, E. 2016. Sukkulansalo<br />
National Test Line in Outokumpu: A ground<br />
reference for deep exploration methods. In: Aatos,<br />
S. (ed.) Developing Mining Camp Exploration<br />
Concepts and Technologies – Brownfield Exploration<br />
Project 2013–2016. Geological Survey of<br />
Finland, Special Paper 59. (this volume)<br />
Huhma, A. 1971. Outokumpu. Geological Map of Finland<br />
1:100 000, Pre-Quarternary Rocks, Sheet 4222. Geological<br />
Survey of Finland.<br />
Huhma, H. 1986. Sm-Nd, U-Pb and Pb-Pb isotopic evidence<br />
for the origin of the Early Proterozoic Svecokarelian<br />
crust in Finland. Geological Survey of Finland,<br />
Bulletin 337. 48 p.<br />
Kääriäinen, J. & Mäkinen, J. 1997. The 1979−1996 Gravity<br />
Survey and Results of the Gravity Survey of Finland<br />
1945−1996. Publications of the Finnish Geodetic Institute<br />
125. 24 p.<br />
Ketola, M. 1973. Outokummun alueen geofysiikasta.<br />
Outokumpu Oy. 15 p. (in Finnish)<br />
Ketola, M. 1974. Karttalehdellä 4313 suoritetun alueellisen<br />
gravimetraustuloksen tulkinta profiililla X=990.00.<br />
Outokumpu Oy. 2 p. (in Finnish)<br />
Ketola, M. 1979. On the application of geophysics in the<br />
indirect exploration for copper sulphide ores in Finland.<br />
In: Hood, P. J. (ed.) Geophysics and Geochemistry<br />
in the Search for Metallic Ores. Geological Survey<br />
of Canada, Economic Geology Report 31, 665−684.<br />
Koistinen, T. J. 1981. Structural evolution of an early Proterozoic<br />
stratabound Cu-Co-Zn deposit, Outokumpu,<br />
Finland. Transactions of the Royal Society of Edingburgh:<br />
Earth Sciences 72(2), 115−158.<br />
Kontinen, A. & Säävuori, H. 2013. Geological correlation<br />
and significance of the prominent Saarivaara reflector<br />
from the HIRE V7 vibroseismic survey in the Outokumpu<br />
area. In: Hölttä, P. (ed.) Current Research:<br />
GTK Mineral Potential Workshop, Kuopio, May 2012.<br />
Geological Survey of Finland, Report of Investigation<br />
198, 81−85.<br />
Kontinen, A., Peltonen, P. & Huhma, H. 2006. Description<br />
and genetic modelling of the Outokumpu-type<br />
rock assemblage and associated sulphide deposits.<br />
Final technical report for GEOMEX J.V., Workpackage<br />
Geology. Geological Survey of Finland, archive report<br />
M10.4/2006/1. 378 p.<br />
Kukkonen, I. T. (ed.) 2011. Outokumpu Deep Drilling<br />
Project 2003−2010. Geological Survey of Finland,<br />
Special Paper 51. 252 p.<br />
94
Geological Survey of Finland, Special Paper 59<br />
Petrophysical parameters and potential field modelling in the Outokumpu Belt<br />
Kukkonen, I. T. & Lahtinen, R. (eds) 2006. Finnish Reflection<br />
Experiment FIRE 2001−2005. Geological Survey<br />
of Finland, Special Paper 43. 247 p.<br />
Kukkonen, I. T., Heikkinen, P., Heinonen, S. Laitinen,<br />
J. & HIRE Working Group of the Geological Survey of<br />
Finland 2011. Reflection seismics in exploration for<br />
mineral deposits: Initial results from the HIRE project.<br />
In: Nenonen, K. & Nurmi, P. A. (eds) Geoscience for<br />
Society: 125 th Anniversary Volume. Geological Survey<br />
of Finland, Special Paper 49, 49–58.<br />
Kukkonen, I. T., Heinonen, S., Heikkinen, P. J. & Sorjonen-Ward,<br />
P. 2012. Delineating ophiolite-derived<br />
host rocks of massive sulfide Cu-Co-Zn deposits with<br />
2D high-resolution seismic reflection data in Outokumpu,<br />
Finland. Geophysics 77, WC213−WC222.<br />
Lahti, I., Leväniemi, H., Kontinen, A., Sorjonen-Ward,<br />
P., Aatos, S. & Koistinen, E. 2016. Geophysical surveys<br />
of the Miihkali area, Eastern Finland. In: Aatos, S.<br />
(ed.) Developing Mining Camp Exploration Concepts<br />
and Technologies – Brownfield Exploration Project<br />
2013–2016. Geological Survey of Finland, Special Paper<br />
59. (this volume)<br />
Lehtonen, T. 1981. Outokummun alueen kivilajien petrofysikaalisista<br />
ominaisuuksista. Unpublished master’s<br />
thesis, Helsinki University of Technology. 77 p. (in<br />
Finnish)<br />
Li, Y. & Oldenburg, D. W. 1998. 3-D inversion of gravity<br />
data. Geophysics 63, 109−119.<br />
Mäkelä, M. 1983. Outokumpu-jakso ennen ja nyt. Vuoriteollisuus<br />
– Bergshanteringen 1/1983, 18−22. (in Finnish)<br />
Outokumpu News 3/82. How to explore deep-seated ores.<br />
Outokumpu Oy, 4−7.<br />
Parasnis, D. S. 1971. Principles of Applied Geophysics,<br />
Third edition. Chapmann and Hall Ltd. 275 p.<br />
Pekkarinen, L. & Rekola, T. 1994. Raportti Polvijärven<br />
Kylylahden alueen malmitutkimuksista 1992−1994.<br />
Outokumpu Finnmines Oy, Exploration report. 26 p.<br />
(in Finnish)<br />
Peltonen, P., Kontinen, A., Huhma, H. & Kuronen, U.<br />
2008. Outokumpu revisited: New mineral deposit model<br />
for the mantle peridotite-associated Cu-Co-Zn-<br />
Ni-Ag-Au sulphide deposits. Ore Geology Reviews 33,<br />
559−617.<br />
Ruotoistenmäki, T. & Tervo, T. 2006. Geophysical characteristics<br />
of Outokumpu area, SE Finland. Geological<br />
Survey of Finland, Report of Investigation 162. 37 p.<br />
Rekola, T. & Hattula, A. 1995. Geophysical surveys for<br />
strata-bound Outokumpu-type CU-CO-ZN deposits<br />
at Kylylahti, Eastern Finland. Exploration Geophysics<br />
26, 60−65.<br />
Säntti, J., Kontinen, A., Sorjonen-Ward, P., Johanson,<br />
B. & Pakkanen, L. 2006. Metamorphism and Chromite<br />
in Serpentinized and Carbonate-Silicate-Altered<br />
Peridotites of the Paleoproterozoic Outokumpu-Jormua<br />
Ophiolite Belt, Eastern Finland. International<br />
Geology Reviews 48, 494−546.<br />
Tornivaara, A. & Kauppila, P. 2014. Kaivoksen sulkeminen<br />
ja jälkihoito: Ekskursio Luikonlahden ja Keretin<br />
kaivosalueille. Geological Survey of Finland, Guide 60.<br />
35 p. (in Finnish)<br />
Williams, N. C. 2006. Applying UBC-GIF potential fiels<br />
inversions in greenfields or brownfields exploration.<br />
Australian Earth Sciences Convention, Melbourne,<br />
Australia, ASEG/GSA, Abstracts.<br />
95
Geological Survey of Finland, Special Paper 59<br />
Hanna Leväniemi<br />
96
Developing Mining Camp Exploration Concepts and Technologies – Brownfield Exploration Project 2013–2016<br />
Edited by Soile Aatos<br />
Geological Survey of Finland, Special Paper 59, 97–112, 2016<br />
EM SAMPO SOUNDINGS IN THE OUTOKUMPU REGION<br />
by<br />
Maarit Nousiainen 1) and Hanna Leväniemi 2)<br />
Nousiainen, M. & Leväniemi, H. 2016. EM Sampo soundings in the<br />
Outokumpu region. Geological Survey of Finland, Special Paper 59, 97−112,<br />
16 figures and 1 table.<br />
Electromagnetic (EM) methods have been widely used over decades in<br />
mineral exploration of the Outokumpu ore belt in Eastern Finland. This<br />
paper describes a frequency-domain electromagnetic Sampo Gefinex 400S<br />
survey carried out in 2014 at Perttilahti, and reviews the older Sampo datasets<br />
of Miihkali and Kylylahti. At Perttilahti, there is ca. 2-km-long Cu-<br />
Co-Zn ore lens with a thickness of less than 10 m and a width of 30–50 m.<br />
The depth of the ore lens increases from less than 500 m to 800–1000 m,<br />
which offers an opportunity to test the depth penetration of the method<br />
used. This was done by using different coil <strong>sp</strong>acings (distance between the<br />
transmitter coil and the receiver coil) in the Sampo survey.<br />
In this paper, Sampo data are interpreted using 1D (layered earth) inversion<br />
and the interpreted models are compared with geological sections.<br />
The detected conductors are shallower than the known Perttilahti mineralization<br />
and assumed to be black schists. However, their location may not<br />
be accurately detected with the available 1D interpretation method due to<br />
various 3D effects caused by e.g. the dipping structures. The tilt correction<br />
addressing the possible misorientation of transmitter and/or receiver coils<br />
and its effect on the interpretation are also discussed.<br />
Keywords: Electromagnetic methods, geophysical methods, geophysics,<br />
mineral exploration, deep-seated deposits, Outokumpu.<br />
1)<br />
Geological Survey of Finland, P.O. Box 1237, FI-70211 Kuopio, Finland<br />
2)<br />
Geological Survey of Finland, P.O. Box 96, FI-02151 E<strong>sp</strong>oo, Finland<br />
E-mail: maarit.nousiainen@gtk.fi, hanna.levaniemi@gtk.fi<br />
97
Geological Survey of Finland, Special Paper 59<br />
Maarit Nousiainen and Hanna Leväniemi<br />
INTRODUCTION<br />
This paper and the Sampo survey in Perttilahti belong<br />
to the project Developing Mining Camp Exploration<br />
Concepts and Technologies – Brownfield<br />
Exploration. The project took place in 2013-2016 in<br />
Outokumpu area (Fig. 1). The aim of this particular<br />
study is to understand and define the geological<br />
constraints and challenges for ground EM data<br />
interpretation. In addition, the Perttilahti deposit<br />
provides an opportunity to study the range and<br />
resolution of EM measurements for deep-seated<br />
targets. In this project, we employed Sampo Gefinex<br />
400S equipment in order to compare the results<br />
with the earlier datasets, as well as to examine<br />
the feasibility of the Sampo interpretation software<br />
with Outokumpu-type geology.<br />
The role of geophysics in the exploration of the<br />
Outokumpu zone has generally been in localizing<br />
the Outokumpu-type of lithological association,<br />
not the ore itself. The outer part of the association<br />
is commonly composed of black schist (graphite<br />
schist) (Rekola & Hattula 1995). The most common<br />
resistivity values of the black schists in the<br />
Outokumpu zone and Miihkali are of the magnitude<br />
of 0.01 – 0.1 Ωm but there are also very poor<br />
conductors among these black schists (Lehtonen<br />
1981). Black schists, chrysotile serpentinites and<br />
copper ore can be distinguished from the resistive<br />
surroundings using electromagnetic methods<br />
(Ketola 1973).<br />
Fig. 1. Sampo surveys in Miihkali, Kylylahti and Perttilahti and the Perttilahti and Vuonos mineralizations. Contains<br />
data from the National Land Survey of Finland Topographic Database 03/2013. (Saalmann & Laine 2014)<br />
98
Geological Survey of Finland, Special Paper 59<br />
EM Sampo soundings in the Outokumpu region<br />
The Outokumpu Belt has been thoroughly covered<br />
by ground frequency-domain EM slingram surveys<br />
dating back to the 1960s (Ketola 1973). These surveys,<br />
although quite intuitively interpretable, only<br />
offer depth penetration of less than 50 m and as<br />
such the interpretation results are too shallow for<br />
the current work. Other ground EM methods can<br />
provide information on greater depths but their<br />
data coverage available in the archives of Geological<br />
Survey of Finland (GTK) (including historical<br />
Outokumpu Oy datasets) in the Outokumpu study<br />
region is significantly poorer, mainly single to a<br />
few survey profiles. Anyhow, the results from the<br />
historical wide-band frequency-domain Sampo<br />
surveys in Miihkali and Kylylahti areas have been<br />
collected and are analysed here in parallel with the<br />
new Sampo survey in the Perttilahti region.<br />
In addition to slingram and Sampo, there has<br />
been a variety of other EM methods applied in the<br />
Outokumpu area. To mention a few documented<br />
examples, horizontal loop electromagnetic method<br />
(HLEM) and mise-a-la-masse were used for<br />
outlining a small-scale mineralization in Kylylahti<br />
(Rekola & Hattula 1995). Time-domain PRO-<br />
TEM method was used in Viurusuo in 2000 both<br />
in borehole and on the ground together with the<br />
borehole method SlimBoris (Västi et al. 2003).<br />
Both audiomagnetotellurics (AMT) and controlled<br />
source audiomagnetotellurics (CSAMT) are applied<br />
in Polvijärvi and Saramäki (Hjelt et al. 1990). The<br />
whole Outokumpu area is also covered by airborne<br />
EM measurement by GTK in 1980-81 (Hautaniemi<br />
et al. 2005).<br />
CASE STUDY: SAMPO MEASUREMENT IN 2014 AT PERTTILAHTI<br />
The Perttilahti deposit, ca. 5 km NE of the Vuonos<br />
deposit, was first discovered in the early 1980s<br />
(Mäkelä 1983, Rekola & Hattula 1995) when investigating<br />
an assumed plunging extension of the<br />
Vuonos ore. The first deep-drilling profile, Sukkulanjoki<br />
200.000, intersected six meters of ore,<br />
and later drillings confirmed the presence of a ca.<br />
2-km-long near-horizontal ore lens with a thickness<br />
of less than 10 m and a width of 30–50 m (Hakanen<br />
1985). The SW part of the formation is located<br />
at a depth of 500 m, and towards the NE the orehosting<br />
formation plunges to depths of 800–1000<br />
m and can be followed on the cross-cutting seismic<br />
profile V1 (Kukkonen et al. 2012) (Fig. 2). The Perttilahti<br />
deposit, digitized from geological sections<br />
(Kontinen et al. 2006), bears a resemblance to the<br />
Vuonos deposit, and Kontinen et al. (2006) suggested<br />
that the former may even be a direct extension<br />
of the latter.<br />
Fig. 2. The Perttilahti formation presented as geological sections (from Kontinen et al. 2006) on seismic profile<br />
V1 (Kukkonen et al. 2012). Viewed from the west.<br />
99
Geological Survey of Finland, Special Paper 59<br />
Maarit Nousiainen and Hanna Leväniemi<br />
At Perttilahti, as usual in Outokumpu, the orehosting<br />
formation is mostly surrounded by black<br />
schists, and they also appear scattered within the<br />
mica gneiss. In the Kylylahti deposit NE of Perttilahti<br />
(Fig. 1), the black schists have resistivities<br />
of 0.01-10 Ωm. In the ore-hosting layers, the<br />
black schists contain disseminated pyrite and the<br />
conductivity is low in comparison to the ore mineralization<br />
(10-1000 S/m equaling to 0.001-0.1<br />
Ωm). Thus, although in other parts of the formation<br />
there exist layers of pyrrhotite-bearing black<br />
schists with high conductivity, in Kylylahti, the<br />
employment of EM surveys enables direct exploration.<br />
(Rekola & Hattula 1995) This information<br />
encouraged us to apply the same methodology at<br />
Perttilahti, although it was already in advance clear<br />
that the source of any conductivity anomaly could<br />
be su<strong>sp</strong>ected to be a black schist layer.<br />
The Sampo equipment comprises a wide-band<br />
frequency-domain ground EM system developed<br />
by Outokumpu Oy in co-operation with GTK. A<br />
brief description of the system has been provided,<br />
for example, by Rekola & Hattula (1995), and<br />
more recently by Korhonen & Lehtimäki (2007).<br />
The Sampo system consists of a loop transmitter<br />
and a three-axial receiver. The system operates<br />
in the frequency domain and employs 82 discrete<br />
frequencies from 2 to 20,000 Hz (Korhonen<br />
& Lehtimäki 2007). The measured re<strong>sp</strong>onses are<br />
processed into ratios of vertical to radial field.<br />
These ratios are transformed into apparent resistivity<br />
versus depth values which can be presented<br />
as apparent resistivity versus depth curves (ARD<br />
curves, Aittoniemi et al. 1987). The interpretation<br />
is completed with a 1D layered model inversion<br />
using the ratios.<br />
Sampo measurements were conducted along<br />
four profiles (Fig. 3) at Perttilahti, Outokumpu, at<br />
the beginning of November 2014. The mineralization<br />
lies deepest, at 950 m, at the northeastern end<br />
of the formation, and rises up to the depth of c. 450<br />
m in the southwest. The Sampo lines are aligned<br />
perpendicular to the mineralization. Planning of<br />
the line locations was also affected by the need to<br />
avoid power lines, which would disturb the measurement.<br />
Fig. 3. The Sampo lines in black, geological sections in grey and the geology of Perttilahti. The yellow body is<br />
the surface projection of the Perttilahti sulphide mineralization. Boreholes OKU-740 and OKU-745 are marked<br />
on the map. Geology from Bedrock of Finland − DigiKP. Contains data from the National Land Survey of Finland<br />
Topographic Database 03/2013.<br />
100
Geological Survey of Finland, Special Paper 59<br />
EM Sampo soundings in the Outokumpu region<br />
The outcropping black schists shown on the geological<br />
map (Fig. 3) can be seen as magnetic and<br />
conductive features on the magnetic (Fig. 4) and<br />
1,775 kHz slingram in-phase (Fig. 5) maps. In<br />
the western parts of the magnetic and slingram<br />
surveys there are similar features that are likely<br />
to originate from black schists within the mica<br />
schist outside the Outokumpu Belt. Based on geological<br />
interpretations (Fig. 2), the general dip direction<br />
in Perttilahti is 35–40 degrees towards the<br />
southeast.<br />
Conductivity logging is done only in two boreholes<br />
in the Perttilahti area, holes OKU-740 and<br />
OKU-745 (location presented in Fig. 3). Borehole<br />
information used in this paper is from GEOMEX<br />
database (Anonymous 2006), which is a result of<br />
a large research project GEOMEX in 1999-2003 in<br />
the Outokumpu area (Kontinen et al. 2006). The<br />
conductivity logging of OKU-745 is presented later<br />
with geology (Fig. 16).<br />
The Sampo measurement was carried out using<br />
a broadside configuration in which the transmitter<br />
and receiver are offset from the actual survey line<br />
in a direction perpendicular to it (Fig. 3). Dipping<br />
features and 3D features in general can introduce<br />
problems in the 1D inversion applied in Sampo<br />
data interpretation. However 1D inversion results<br />
using the broadside approach have proven superior<br />
to other configurations in the case of dipping<br />
conductors (Korhonen & Lehtimäki 2007). Nevertheless,<br />
de<strong>sp</strong>ite the configuration, as the dip angle<br />
of the conducting structure increases, 1D inversion<br />
unavoidably fails to represent the whole 3D<br />
electrical conductivity structure reliably, and distortions<br />
and artefacts may remain in the final<br />
interpretation (Fig. 6).<br />
The actual Sampo measurement stations lie between<br />
the transmitter and the receiver. There are<br />
different views about the accurate location of the<br />
stations for data presentation. According to Ahokas<br />
(2003) and Korhonen & Lehtimäki (2007), the<br />
stations should be located at the midpoint between<br />
the transmitter and the receiver. The other convention<br />
is to locate the measuring station from one<br />
quarter or one third of the coil <strong>sp</strong>acing from the<br />
transmitter towards the receiver. This convention<br />
is common in GTK but not properly documented.<br />
Nevertheless, in this Perttilahti study, the stations<br />
Fig. 4. Ground magnetic data for Perttilahti (Ketola 1973). Contains data from the National Land Survey of<br />
Finland Topographic Database 03/2013.<br />
101
Geological Survey of Finland, Special Paper 59<br />
Maarit Nousiainen and Hanna Leväniemi<br />
Fig. 5. Electromagnetic slingram survey at Perttilahti, in-phase component (Ketola 1973). The coil <strong>sp</strong>acing of<br />
the survey was 40 m and measuring frequency 1,775 Hz. Contains data from the National Land Survey of Finland<br />
Topographic Database 03/2013.<br />
Fig. 6. A synthetic example of 1D interpretation of Sampo results with different configurations (moving left to<br />
right) over a thin conductive sheet with 60° dip (conductance 1 S, background resistivity of 5000 Ωm, coil <strong>sp</strong>acing<br />
of 200 m). From Korhonen & Lehtimäki 2007.<br />
102
Geological Survey of Finland, Special Paper 59<br />
EM Sampo soundings in the Outokumpu region<br />
Table 1. Technical details of the Perttilahti survey.<br />
Transmitter loop size<br />
50 x 50 m<br />
Nominal point separation 50<br />
Total number of sounding points 59<br />
Total length of all measuring lines<br />
2750 m<br />
Date 3–6 November 2014<br />
Typical frequency band<br />
54.98– 19,840 Hz<br />
(Varies a little from point to point)<br />
are projected one third of the coil <strong>sp</strong>acing from the<br />
transmitter.<br />
The depth extent of a Sampo survey is approximately<br />
the same as the coil <strong>sp</strong>acing (Sipola 2002,<br />
Rekola & Hattula 1995). In this survey, to compensate<br />
for the increasing depth of the formation towards<br />
NE, the coil <strong>sp</strong>acing was different for each<br />
line, from southwest to northeast being 600, 800,<br />
700 and 900 m. Details of the measurement are<br />
presented in Table 1.<br />
Interpretation<br />
The interpretation was carried out with the Sampo<br />
1D layered earth inversion software Salt and Grain<br />
(Sipola 2002). The data are presented as apparent<br />
resistivity vs. depth curves (ARD curves) and interpreted<br />
as layer models.<br />
Figure 7 presents the interpreted resistivity on<br />
line 1. The Perttilahti mineralization is projected<br />
in the section, but does not correlate with the interpreted<br />
conductors. At every station except one,<br />
there is a layer where the resistivity is less than<br />
10 Ωm. The depth of these layers is approximately<br />
250–450 m below the surface. The electromagnetic<br />
field attenuates in a conductor (skin effect) and<br />
therefore overlaying conductors can prevent the<br />
Fig. 7. Sampo results from line 1. Colour bands present the interpreted layer model from which the black and<br />
white grid is created. The lilac body at point 1-2350 is a projection of the Perttilahti mineralization. The coil<br />
<strong>sp</strong>acing of the survey was 600 m and the view is from the southwest.<br />
103
Geological Survey of Finland, Special Paper 59<br />
Maarit Nousiainen and Hanna Leväniemi<br />
propagation of the EM waves to a deeper ore body.<br />
Thus, the most reliable part of the interpreted layer<br />
models is the upper boundary of the uppermost<br />
conductive layer and the layer(s) above it.<br />
On the left of the section (in the northwest),<br />
there is a nearly horizontal conductive layer. Its<br />
upper boundary is approximately at the depth of<br />
240–250 m. The conductive layers of the stations<br />
2300–2400 can also be seen as a conductor with a<br />
dip of about 45°. In the nearest geological section<br />
197.500 (Fig. 3), there are black schists of a similar<br />
dip above the Perttilahti mineralization. The geological<br />
section is located 180–210 m away from line<br />
1 (the Sampo line and the geological section are not<br />
exactly parallel).<br />
The interpreted resistivity of line 2 is presented<br />
in Figure 8. When the location of the actual measurement<br />
station between the transmitter and receiver<br />
is projected as explained earlier, the distance<br />
between lines 1 and 2 is only about 66 m. Both lines<br />
di<strong>sp</strong>lay the nearly horizontal conductor on the<br />
left of the section (in the northwest). The dipping<br />
structure at stations 2400–2600 is clearer in line<br />
2 than line 1. The dip is the same as the general<br />
dipping direction in the geological section 197.500<br />
(Fig. 3). The distance between the geological section<br />
197.500 and Sampo line 2 is 250-270 meters.<br />
The coil <strong>sp</strong>acing on the survey on line 1 is 600<br />
m and on the survey line 2 800 m, and the depth<br />
penetration of a Sampo measurement is estimated<br />
to equal the coil distance. However, increasing the<br />
coil <strong>sp</strong>acing did not increase the depth penetration<br />
in this case, because the depth of the conductors<br />
was shallower than the coil <strong>sp</strong>acing. Thus the coil<br />
<strong>sp</strong>acing was not the limiting factor in detecting the<br />
conductors.<br />
Figure 9 di<strong>sp</strong>lays the Sampo results for line 3.<br />
The data from stations 2400, 2550 and 2750 were<br />
not suitable to be interpreted as a layer model.<br />
There are thin conductive layers at each interpreted<br />
station and their depth varies from 160 to<br />
390 m. The conductive layers at stations from 2800<br />
to 3000 can be seen as a dipping conductive structure.<br />
Although there are no interpreted geological<br />
sections such as presented in Figure 3 near line 3<br />
for detailed comparison, the dip of this structure<br />
is consistent with the general dip of the geological<br />
units in this area.<br />
Figure 10 di<strong>sp</strong>lays the Sampo results for line 4 in<br />
the same format as previous lines are presented.<br />
Fig. 8. Sampo results from line 2. Colour bands present the interpreted layer model from which the black and<br />
white grid is created. The lilac body at point 2-2350 is a projection of the Perttilahti mineralization. The coil<br />
<strong>sp</strong>acing of the survey was 800 m and the view is from the southwest.<br />
104
Geological Survey of Finland, Special Paper 59<br />
EM Sampo soundings in the Outokumpu region<br />
Fig. 9. Sampo results from line 3. Colour bands present the interpreted layer model from which the black and<br />
white grid is created. The lilac body at point 3-2500 is a projection of the Perttilahti mineralization. The coil<br />
<strong>sp</strong>acing of the survey was 700 m and the view is from the southwest<br />
Fig. 10. Sampo results from line 4. Colour bands present the interpreted layer model from which the black and<br />
white grid is created. The lilac body at point 4-2580 is a projection of the Perttilahti mineralization. The coil<br />
<strong>sp</strong>acing of the survey was 900 m and the view is from the southwest.<br />
105
Geological Survey of Finland, Special Paper 59<br />
Maarit Nousiainen and Hanna Leväniemi<br />
Fig. 11. Sampo results from line 4 and the geological section 200.000 (from Kontinen et al. 2006). The distance<br />
between the Sampo line and the geological profile is from 60 to 90 m. Colour bands present the interpreted layer<br />
model of the Sampo data. In this figure the intersection of the Perttilahti mineralization at station 4-2580 is<br />
marked in yellow and highlighted with a black box around it. The view is from the southwest.<br />
The geological section 200.00 is only from 30 to<br />
60 m away from the line 4 so they are presented<br />
together in Figure 11. Many of the interpreted conductive<br />
layers are really thin, only some meters or<br />
less than one meter and their resistivity is of the<br />
magnitude of 0.1-1 Ωm. There is no equivalent to<br />
the Sampo conductors in the geological section,<br />
but again the dip of the Sampo conductors in the<br />
northwest is similar to the dip of the geological<br />
structures seen in section 200.000 (Fig. 2). In this<br />
1D interpretation, the dip of the conductor at stations<br />
from 2400 to 2550 seems to be opposite to the<br />
geological structure. However, it is possible that<br />
this feature is a 3D effect such as shown in Figure 6<br />
from the shallow black schists on the southeastern<br />
side of the Sampo stations.<br />
106
Geological Survey of Finland, Special Paper 59<br />
EM Sampo soundings in the Outokumpu region<br />
HISTORICAL DATASETS<br />
Although the Sampo Gefinex 400S system may<br />
have been widely used in the region by the Outokumpu<br />
Oy exploration teams, only few properly<br />
documented results remain to be found today. In<br />
addition to the measurements of Outokumpu Oy,<br />
some later profiles in the region have been reported<br />
by the GEOMEX team. Ruotoistenmäki &<br />
Tervo (2006) give an overview of the geophysical<br />
work conducted in the project, but do not discuss<br />
the Miihkali Sampo survey. The available data<br />
were digitized into a 3D environment in order to<br />
integrate and better compare various datasets and<br />
the performance of frequency-domain ground EM<br />
systems in the region.<br />
Miihkali<br />
The Miihkali massif and the enveloping and nearby<br />
black schists were mapped in the GEOMEX project<br />
with Sampo profiles (Fig. 12). The survey was conducted<br />
as broadside measurement with 500 m coil<br />
<strong>sp</strong>acing and 50x50 m transmitter loop.<br />
The serpentinite massif together with the thin<br />
black schist layers on its eastern and western<br />
boundaries show as a conductive structure. The<br />
Lipa<strong>sp</strong>uro profiles in the north appear to indicate<br />
west-dipping black schists when compared with<br />
the slingram results. The conductors in the northernmost<br />
Kiskonjoki profiles are likewise interpreted<br />
to be black schists, although the results have<br />
not been verified by drilling (Kuronen et al. 2003).<br />
The Miihkali interpretations are discussed in more<br />
detail by Lahti et al. (2016, this volume).<br />
Fig. 12. The interpolated 700-m-deep Sampo profile interpretations combined with a lithological map (Bedrock<br />
of Finland – DigiKP) (on the left) and with the old slingram survey (on the right). For the slingram survey, a red<br />
colour denotes conductive structures and a blue colour resistive regions. The size of the region is approximately<br />
7.5 x 7.5 km. On the lithological map SP = serpentinite and MCS = mica schist. Viewed from the south.<br />
Kylylahti<br />
Two documented Sampo profile interpretations<br />
can readily be found: the Outokumpu Oy profile reported<br />
by Rekola & Hattula (1995) and discussed by<br />
Pekkarinen & Rekola (1995) and the later GEOMEX<br />
project profile reported by Ruotoistenmäki & Tervo<br />
(2006) (Fig. 13). Both profiles run approximately in<br />
a direction parallel to the mineralized zone west<br />
of it; the Outokumpu profile covers the northern<br />
part of the formation in the general strike direction,<br />
whereas the GEOMEX profile turns slightly<br />
southwest and probes the western margins of the<br />
main formation (Fig. 13). The GEOMEX survey was<br />
conducted with 300–500-m coil <strong>sp</strong>acing and an inline<br />
configuration, whereas in the Outokumpu survey<br />
used 300–1000-m coil <strong>sp</strong>acing and a broadside<br />
configuration.<br />
A synthesis of the interpretation results is presented<br />
in Figure 14. The GEOMEX profile is interpreted<br />
to mainly depict conductive black schist<br />
structures (Ruotoistenmäki & Tervo 2006). The<br />
107
Geological Survey of Finland, Special Paper 59<br />
Maarit Nousiainen and Hanna Leväniemi<br />
Fig. 13. Sampo profile locations of Outokumpu Oy and GEOMEX project on a Kylylahti geological map (Bedrock of<br />
Finland − DigiKP).<br />
Fig. 14. Sampo surveys in the Kylylahti region viewed from the southeast. Regions < 100 Ωm are digitized.<br />
Geological cross-section from Kontinen et al. (2006), schematic ore presentation after Pekkarinen & Rekola<br />
(1995). Surface geological map: Bedrock of Finland – DigiKP.<br />
108
Geological Survey of Finland, Special Paper 59<br />
EM Sampo soundings in the Outokumpu region<br />
deepest-plunging, most conductive part of the<br />
more northern Outokumpu profile was reached by<br />
drilling. Based on the geological drill-hole logging<br />
and resistivity logging, Pekkarinen & Rekola (1995)<br />
suggested that the conductive layer is caused by a<br />
thin (13 m) sulphide conductor within quartz rock,<br />
but black schists interfere with the interpretation<br />
(Rekola & Hattula 1995). Together, the interpretation<br />
profiles give insights into the longitudinal<br />
conductivity distribution within the Kylylahti formation.<br />
However, with no further constraints on<br />
the local conductivity of the black schists, it is impossible<br />
to separate the various sources of conductivity<br />
anomalies in detail.<br />
DISCUSSION<br />
An important factor concerning the reliability of<br />
Sampo data is the tilt error between the transmitter<br />
and receiver. The tilt error is mainly due to either a<br />
difference in level between the transmitter and the<br />
receiver or not having the transmitter or the receiver<br />
in exactly horizontal position (Sipola 2002).<br />
Since the receiver is a solid coil with a stand and a<br />
<strong>sp</strong>irit level, its position should be vertical whereas<br />
for example in a sloping area the position of the<br />
transmitter is likely not vertical.<br />
In the 1D interpretation software Salt and Grain<br />
(Sipola 2002), the interpreter can correct the tilt<br />
error manually or automatically. Automatic tilt<br />
error correction is based on the assumption that<br />
Fig. 15. Tilt correction. The black ARD curve presents a<br />
sounding with a typical tilt error. The resistivity of the<br />
lowest frequencies is erroneously low. The blue ARD<br />
curve presents the tilt-corrected curve. (From Sipola<br />
2002)<br />
no induction occurs in the lowest measuring frequency<br />
and therefore the field should be purely<br />
vertical. Hence any deviation from vertical can be<br />
attributed to the tilt of the transmitter or receiver<br />
and/or level differences between them i.e. tilt error<br />
(Korhonen & Lehtimäki 2007).<br />
Thus, Salt and Grain uses the five lowest measuring<br />
frequencies to determine the tilt error automatically.<br />
Figure 15 presents an example of Sampo<br />
data and tilt correction as ARD curves. Often, these<br />
curves should more or less vertical at lowest frequencies,<br />
but a tilt error can notably change the<br />
direction of the curve.<br />
In the interpretation of the data from Perttilahti,<br />
the suggested automatic tilt error values would<br />
have been tens of degrees in magnitude, which<br />
seems unrealistic. This is possibly caused by the<br />
conducting black schists nearby at various depths,<br />
which affect the signal of the lowest frequencies.<br />
In other words, the base assumption of automatic<br />
tilt error correction is not met.<br />
Testing different values for tilt error correction<br />
showed that the chosen tilt correction has an essential<br />
effect on the ARD curve, which forms the<br />
base of the layer model. The conductive layers<br />
along line 4 would have been located some hundreds<br />
of meters deeper if automatic tilt correction<br />
had been used. However, it was decided not to apply<br />
any tilt error correction.<br />
For profile 199.000 (Kontinen et al. 2006; see<br />
location in Fig. 3), galvanic conductivity logging<br />
results from drill hole OKU-745 can be found in<br />
the Outokumpu Oy drill-core dataset (Fig. 16).<br />
These data clearly indicate that both the shallow<br />
and deep black schists appear highly conductive<br />
in comparison to other rocks, with the exception<br />
of the ore intersection at deeper levels. Since the<br />
layers of shallower conductive black schists effectively<br />
mask the conductive re<strong>sp</strong>onse from lower<br />
depths, it is highly unlikely to obtain a direct re<strong>sp</strong>onse<br />
from the ore formation in a geological scenario,<br />
as illustrated in Figure 16.<br />
109
Geological Survey of Finland, Special Paper 59<br />
Maarit Nousiainen and Hanna Leväniemi<br />
Fig. 16. Conductivity logging in drill hole OKU-745 on the geological profile 199.000 (Kontinen et al. 2006). Blue<br />
= mica schist, purple = black schist, various greens = Outokumpu association rocks. Conductivity scale: 0 units =<br />
0.001 S/m, 5 units = 100 S/m.<br />
110
Geological Survey of Finland, Special Paper 59<br />
EM Sampo soundings in the Outokumpu region<br />
CONCLUSIONS<br />
There is an abundance of highly conductive black<br />
schists in the Outokumpu region which, even as<br />
thin layers can mask other nearby or underlying<br />
conductors, such as ore bodies. As we have no previous<br />
deep-penetrating ground EM data directly on<br />
top of ore formations in the available data archives,<br />
the new Perttilahti Sampo survey was thought<br />
to give the current project a reference for using<br />
ground EM surveys as a direct exploration tool in<br />
the region. The conductors detected in the Perttilahti<br />
Sampo survey are assumed to be black schists.<br />
However, their location may not be truthfully detected<br />
with the available 1D interpretation method<br />
due to various 3D effects caused by for example the<br />
35–40-degree dip angle of the structures. The interpreted<br />
Sampo conductors show moderate correlation<br />
with the geological loggings, which may be<br />
due to the screening by black schists or problems<br />
defining the tilt correction of Sampo measurements.<br />
The geological setting and e<strong>sp</strong>ecially the abundance<br />
of black schists in Outokumpu is, as shown<br />
by various examples presented in this study, challenging<br />
for EM surveys, which in general are one of<br />
the most effective tools for sulphide exploration. In<br />
the case of the black schists appearing in connection<br />
with the Outokumpu association rocks, a correctly<br />
interpreted conductivity structure related to<br />
the former may lead to traces of the latter. However,<br />
direct geophysical exploration for sulphide ore<br />
still seems, based on these examples, a demanding<br />
task in this region. Careful survey planning,<br />
synthetic advance modelling, result interpretation<br />
and validation with all available reference data in a<br />
3D environment become increasingly important as<br />
the complexity of the problem grows.<br />
ACKNOWLEDGEMENTS<br />
The authors acknowledge the helpful reviews of the manuscript by I. Suppala and H. Salmirinne.<br />
REFERENCES<br />
Ahokas, T. 2003. Electromagnetic Frequency Soundings<br />
(Gefinex) in Olkiluoto 2002. Posiva working report<br />
2003-24, 89. 31 p.<br />
Aittoniemi, K., Rajala, J. & Sarvas, J. 1987. Interactive<br />
Inversion Algorithm and Apparent Resistivity Versus<br />
Depth (ARD) Plot in Multifrequency Depth Soundings.<br />
Acta Polytechnica Scandinavica, Applied Physics<br />
Series 157. 34 p.<br />
Anonymous 2006. Geological and exploration data of<br />
Outokumpu area, East Finland: GEOMEX JV project<br />
1999−2003. (DVD-disc)<br />
Bedrock of Finland − DigiKP. Digital map database [Electronic<br />
resource]. E<strong>sp</strong>oo: Geological Survey of Finland<br />
[referred 04.04.2016]. Version 2.0.<br />
Hakanen, P. 1985. Kaivoslain 19 §:n edellyttämä tutkimustyöselostus<br />
Outokummun Perttilahdessa valtausalueilla<br />
Perttilahti, Sukkula, Perttilahti 2 (kaiv.rek.<br />
numerot 3356/1-2, 3452/1) tehdyistä tutkimuksista.<br />
Outokumpu Oy. 3 p. (in Finnish)<br />
Hautaniemi, H., Kurimo, M., Multala, J., Leväniemi, H.<br />
& Vironmäki, J. 2005. The ‘three in one’ aerogeophysical<br />
concept of GTK in 2004. In: Airo, M.-L. (ed.)<br />
Aerogeophysics in Finland 1972−2004: Methods,<br />
System Characteristics and Applications. Geological<br />
Survey of Finland, Special Paper 39, 21−74.<br />
Hjelt, S.-E., Heikka, J. V., Lakanen, E., Pelkonen, R.<br />
& Pietilä, R. 1990. The audiomagnetotelluric (AMT)<br />
method and its use in ore pro<strong>sp</strong>ecting and structural<br />
research. In: Hjelt, S.-E. & Fokin, A. (ed.) Electrical<br />
pro<strong>sp</strong>ecting for ore deposits in the Baltic Shield, Part<br />
2: Electromagnetic methods. Geological Survey of<br />
Finland, Report of Investigation 95, 69−86.<br />
Ketola, M. 1973. Outokummun alueen geofysiikasta.<br />
Outokumpu Oy. 15 p. (in Finnish)<br />
Kontinen, A., Peltonen, P. & Huhma, H. 2006. Description<br />
and genetic modelling of the Outokumpu-type<br />
rock assemblage and associated sulphide deposits.<br />
Final technical report for GEOMEX J.V., Workpackage<br />
Geology. Geological Survey of Finland, archive report<br />
M 10.4/2006/1. 378 p.<br />
Korhonen, K. & Lehtimäki, J. 2007. Electromagnetic<br />
Sampo Soundings at Olkiluoto in 2007. Posiva Oy,<br />
Working Report 2007-80, 60. 48 p.<br />
Kukkonen, I. T., Heinonen, S., Heikkinen, P. & Sorjonen-Ward,<br />
P. 2012. Delineating ophiolite-derived<br />
host rocks of massive sulfide Cu-Co-Zn deposits with<br />
2D high-resolution seismic reflection data in Outokumpu,<br />
Finland. Geophysics 77 (5), 213−222.<br />
Kuronen, U., Kontinen, A. & Kokkonen, J. 2003. GEO-<br />
MEX Project Report 1999–2003. (unpublished report)<br />
Lahti, I., Leväniemi, H., Kontinen, A., Sorjonen-Ward,<br />
P., Aatos, S. & Koistinen, E. 2016. Geophysical surveys<br />
of the Miihkali area, Eastern Finland. In: Aatos, S.<br />
(ed.) Developing Mining Camp Exploration Concepts<br />
and Technologies – Brownfield Exploration Project<br />
2013–2016. Geological Survey of Finland, Special Paper<br />
59. (this volume)<br />
Lehtonen, T. 1981. Outokummun alueen kivilajien petrofysikaalisista<br />
ominaisuuksista. Diploma thesis, Helsinki<br />
University of Technology. 77 p. (in Finnish)<br />
Mäkelä, M. 1983. Outokumpu-jakso ennen ja nyt. Vuoriteollisuus<br />
1/1983, 18−22. (in Finnish, with English<br />
summary)<br />
111
Geological Survey of Finland, Special Paper 59<br />
Maarit Nousiainen and Hanna Leväniemi<br />
Pekkarinen, L. & Rekola, T. 1995. Raportti Polvijärven<br />
Kylylahden alueen malmitutkimuksista ensimmäisellä<br />
vuosipuoliskolla 1995. Outokumpu Finnmines Oy,<br />
Exploration report 030/4224. 26 p. (in Finnish)<br />
Rekola, T. & Hattula, A. 1995. Geophysical surveys for<br />
strata-bound Outokumpu-type Cu-Co-Zn deposits at<br />
Kylylahti, Eastern Finland. Exploration Geophysics 26,<br />
60−65.<br />
Ruotoistenmäki, T. & Tervo, T. 2006. Geophysical characteristics<br />
of Outokumpu Area, SE Finland. Geological<br />
Survey of Finland, Report of Investigation 162. 37 p.<br />
Saalmann, K. & Laine, E. 2014. Structure of the Outokumpu<br />
ore district and ophiolite-hosted Cu-Co-Zn-<br />
Ni-Ag-Au sulphide deposits revealed from 3D modelling<br />
and 2D high-resolution seismic reflection data.<br />
Ore Geology reviews, vol. 62, 156−180.<br />
Sipola, V.-P. 2002. Sähkömagneettisen Sampo-monitaajuusluotaimen<br />
uusi tuloskäsittely- ja tulkintaohjelmisto.<br />
Master’s thesis, Helsinki University of<br />
Technology, Otaniemi, 69 p. (in Finnish)<br />
Västi, K., Tervo, T. & Kuronen, U. 2003. Tutkimustyöselostus<br />
Outokummun kaupungissa valtausalueella<br />
Viurusuo 1 (kaivosrekisterinro 7007/1) suoritetuista<br />
kuparimalmitutkimuksista vuosina 2000−2002. Geological<br />
Survey of Finland, archive report M06/4222/-<br />
03-1-10. 6 p. (in Finnish)<br />
112
Developing Mining Camp Exploration Concepts and Technologies – Brownfield Exploration Project 2013–2016<br />
Edited by Soile Aatos<br />
Geological Survey of Finland, Special Paper 59, 113–138, 2016<br />
GEOPHYSICAL SURVEYS OF THE MIIHKALI AREA,<br />
EASTERN FINLAND<br />
by<br />
Ilkka Lahti 1) , Hanna Leväniemi 2) , Asko Kontinen 3) , Peter Sorjonen-Ward 3) ,<br />
Soile Aatos 3) and Esko Koistinen 3)<br />
Lahti, I., Leväniemi, H., Kontinen, A., Sorjonen-Ward, P., Aatos, S. &<br />
Koistinen, E. 2016. Geophysical surveys of the Miihkali area, Eastern Finland.<br />
Geological Survey of Finland, Special Paper 59, 113−138, 26 figures and<br />
1 table.<br />
The Miihkali area in the northeastern Outokumpu ore belt is an excellent<br />
place to carry out geophysical research, as the area is characterized by diverse<br />
geophysical anomalies and is also pro<strong>sp</strong>ective for Outokumpu-type<br />
massive sulphide ore deposits. In this paper, we deal with geophysical<br />
surveys that have been conducted during the last decades in the area, including<br />
ground electromagnetic (EM) and potential field surveys, airborne<br />
surveys and petrophysical measurements of drill cores. These data have<br />
been acquired by the Outokumpu Mining Company, the Geological Survey<br />
of Finland, and their joint venture, the GEOMEX project. We also report new<br />
data from deep EM (ZTEM and AMT) surveys carried out during the ongoing<br />
Outokumpu (OKU) mining camp project. All these geophysical data are<br />
summarized and modelled from various standpoints, and the geological<br />
implications are discussed.<br />
The potential field datasets predate the current project. In this study, we<br />
tested both 3D forward modelling and inversion as deep exploration tools.<br />
The results imply that the current drilling scope covers the majority of the<br />
anomaly sources, although some discrepancies remain between the new<br />
density model and the drill core logs. We applied 3D inversion to a regional<br />
magnetic dataset with partial success; it became clear that comprehensive<br />
interpretation would need to accommodate for remanent magnetization,<br />
which plays a significant role in magnetic modelling in the Miihkali region.<br />
The 3D models suggest that the deep-set magnetic and high-density features<br />
east of the more shallow main Miihkali massif may not be thoroughly<br />
explored, and further work on these features could provide some previously<br />
undiscovered information on the Miihkali massif region.<br />
Deep EM results show conductors along the western margin of the Miihkali<br />
mica gneisses and the Miihkali serpentinite massif. The ZTEM and AMT<br />
2D inversion results indicate a gently eastwards-dipping conductor in the<br />
Miihkali mica gneiss located at the bottom of the inferred Miihkali nappe,<br />
reaching depths greater than 1 km near to its eastern margin. The gently<br />
dipping conductor is probably related to the N–S elongated airborne EM<br />
anomalies coinciding with the Miihkali serpentinite massif and the black<br />
schist band along the western margin of the allochthonous Miihkali mica<br />
gneisses. In most cases, the near-surface airborne EM anomalies can be<br />
113
Geological Survey of Finland, Special Paper 59<br />
Ilkka Lahti, Hanna Leväniemi, Asko Kontinen, Peter Sorjonen-Ward, Soile Aatos and Esko Koistinen<br />
connected to deep ZTEM anomalies, showing the continuation of elongated<br />
conductive features to greater depths. The densely <strong>sp</strong>aced Sampo soundings<br />
distinguished separate conductors in the Miihkali serpentinite massif<br />
and within the western margin of the Miihkali mica gneisses. In addition,<br />
the Sampo surveys revealed conductors at the Kiskonjoki pro<strong>sp</strong>ect, which<br />
have been proved to be caused by Outokumpu-type rocks intersected by<br />
drillings at the depth of 300 m.<br />
Keywords: geophysical surveys, geophysical methods, gravity method,<br />
magnetic method, electromagnetic methods, airborne methods, Outokumpu<br />
area<br />
1)<br />
Geological Survey of Finland, P.O. Box 77, FI-96101 Rovaniemi, Finland<br />
2)<br />
Geological Survey of Finland, P.O. Box 96, FI-02151 E<strong>sp</strong>oo, Finland<br />
3)<br />
Geological Survey of Finland, P.O. Box 1237, FI-70211 Kuopio, Finland<br />
E-mail: ilkka.lahti@gtk.fi<br />
114
Geological Survey of Finland, Special Paper 59<br />
Geophysical surveys of the Miihkali area, Eastern Finland<br />
GEOLOGICAL SETTING<br />
The Miihkali area is located within the northern<br />
part of the largely metasedimentary early Proterozoic<br />
North Karelia Schist Belt (NKSB) (Fig. 1). The<br />
main content of the c 12 000 km 2 NSKB are Kaleva<br />
stage (2.1–1.9 Ga) intercalated wackes and shales.<br />
Older, Sariola (2.3–2.2 Ga) and Jatuli stage (2.2–2.1<br />
Ga) arenitic sequences are found narrowly rimming<br />
the belt in the north and east, deposited on a deeply<br />
eroded dominantly gneissic-migmatitic granitoid<br />
(>2.6 Ga) basement. A major part of the main Kaleva<br />
fill is composed of deep-water metaturbidites<br />
that contain zones of black schists, the latter<br />
in part with sheets and lenses of serpentinized<br />
peridotites±metagabbroic–amphibolitic rocks interpreted<br />
as fault-bound ophiolite fragments. The<br />
ophiolite-bearing parts of the NSKB have long been<br />
considered allochthonous (Wegmann 1928, 1929,<br />
Väyrynen 1939, Koistinen 1981, Park & Bowes 1983,<br />
Park & Doody 1990), and are collectively known as<br />
the Outokumpu nappe/nappe complex or allochthon<br />
(Park & Doody 1990, Peltonen et al. 2008). The<br />
Saramäki sulphide deposit (Hallikainen 1980) is<br />
located in the present study area.<br />
A <strong>sp</strong>ecial feature of the Outokumpu allochthon<br />
is that the peridotite bodies in the included ophiolite<br />
fragments are all not only serpentinized but<br />
also thinly altered (max 50 m) at their margins<br />
to carbonate, carbonate-silica and silica rocks<br />
(birbirites). This alteration occurred before or<br />
early during the regional deformation and metamorphism<br />
(Kontinen 1998, Peltonen et al. 2008).<br />
The alteration appears to have been most intense<br />
where the parent serpentinized peridotite bodies<br />
were/are located against particularly thick layers<br />
of sulphide-graphite rich black shale. The assemblage<br />
of serpentinite-carbonate-calc-silicate<br />
rock-quartz rock-black schist constitute the Outokumpu<br />
association or assemblage (Gaal et al. 1975,<br />
Park 1988), famous for being the host environment<br />
of the Outokumpu-type massive-semi-massive<br />
Fig. 1. Geological map of the study area (Bedrock of Finland − DigiKP). The dashed rectangle indicates the location<br />
of the study area. The location of the cross-section view in Figure 2 is shown by the black E–W line (N=6990000).<br />
The red dashed line denotes the approximate location of the antigorite-out isograd from Säntti et al. (2006),<br />
implying 550 °C to the west of the line.<br />
115
Geological Survey of Finland, Special Paper 59<br />
Ilkka Lahti, Hanna Leväniemi, Asko Kontinen, Peter Sorjonen-Ward, Soile Aatos and Esko Koistinen<br />
Co-Cu-Zn sulphide ores (Gaal & Parkkinen 1993,<br />
Peltonen et al. 2008).<br />
The Miihkali area comprises the northernmost<br />
part of the eastern main segment of the Outokumpu<br />
allochthon. The allochthon rests in the area on<br />
an Archaean-aged, dominantly granite gneissic<br />
basement thinly covered by a relatively flat-lying<br />
Early Proterozoic (Jatuli-stage) sequence of cratonic-epicontinental<br />
feld<strong>sp</strong>athic to quartz arenitic<br />
metasands with some thin calc silicate rock–carbonaceous<br />
metapelite intercalations. The interface<br />
of the basement and the Jatuli sequence is intruded<br />
by laterally extensive, up to 200 -300 m thick,<br />
metamorphosed-deformed pyroxenite-gabbroleucogabbro<br />
sills. The basal contact of the allochthon<br />
is defined in the area by a thrust fault with<br />
thin slivers of obvious Archaean gneisses, as seen,<br />
for example, at Saarivaara and Matovaara, west of<br />
Lake Miihkalinjärvi.<br />
In the study area, the Outokumpu allochthon<br />
is traditionally divided, largely based on the interpretation<br />
of anomaly patterns on geophysical<br />
maps, into two overlapping thrust sheets or nappes<br />
(e.g. Park & Doody 1990, Sorjonen-Ward et al.<br />
1997). The lower one, in the area of the basal unit<br />
of the Outokumpu allochthon, we refer to as the<br />
Sukkulansalo nappe, while we refer to the discontinuously<br />
serpentinite and black schist-rimmed, c.<br />
10 x 25 km oval feature in the middle part of the<br />
Miihkali area as the Miihkali nappe. This is traditionally<br />
interpreted as a down-folded thrust sheet<br />
into a structural basin on the Sukkulansalo nappe.<br />
There are a few minor lenses of ophiolitic rocks<br />
in the Sukkulansalo nappe, whereas the interpreted<br />
western basal part of the Miihkali nappe<br />
hosts perhaps the largest cohesive serpentinitemafic<br />
massif so far recognized in the Outokumpu<br />
allochthon, the near 15 km long and up to 1.5 km<br />
wide Miihkali massif. Unlike the better known<br />
bodies in the Outokumpu-Vuonos-Horsmanaho<br />
zone, which tend to be >90% ultramafic, there<br />
is a variably significant, in some parts over 50%<br />
mafic, mostly coarse-grained, foliated metagabbroic<br />
component within the Miihkali massif. Most<br />
of this component occurs as relatively thin dykes<br />
or sills in the serpentinite; for example, within a<br />
735 m, near perpendicular section through the<br />
massif, the drill hole Jumi-46 contains 38.4%<br />
(n = 79) mafic sheets/dykes averaging 3.58 ± 6.54<br />
m in thickness. This may be exploration-wise an<br />
important a<strong>sp</strong>ect to recognize, as the Outokumpu<br />
alteration assemblage appears to be a noticeably<br />
less abundant component in the Miihkali massif<br />
than in the sulphide-ore-blessed Outokumpu,<br />
Vuonos or Kylylahti massifs (Saastamoinen 1972).<br />
It must be noted here that the drill-core logging by<br />
the Outokumpu company for the Miihkali pro<strong>sp</strong>ect<br />
was predominantly rather sketchy, failing to consistently<br />
distinguish skarns (calc-silicate rocks)<br />
from metabasic rocks (metagabbros and amphibolites)<br />
and ultramafic-derived quartz rocks (metabirbirites)<br />
from epiclastic quartzites, and lumping<br />
together the various, petrophysically differing<br />
types of ultramafic rocks (antigorite serpentinite,<br />
serpentinized talc-olivine and olivine-talc-carbonate<br />
rock). The ambiguity in rock identification<br />
and naming severely complicates and reduces the<br />
usability of the drilling-related lithology database.<br />
An important factor to consider in most geophysical<br />
interpretations is the increasing metamorphic<br />
grade from east to west in the Miihkali<br />
area. A change from lower to middle amphibolite<br />
facies takes place across a line running approximately<br />
N–S through the middle of the Miihkali area,<br />
coinciding with the antigorite out/talc-olivine (in<br />
low CO 2<br />
/H 2<br />
O) reaction in ultramafic rocks (Säntti et<br />
al. 2006). The discordant nature of the isograd implies<br />
that the peak metamorphism post-dated the<br />
main deformations. Because of the metamorphic<br />
zoning, ultramafic bodies in the eastern part of the<br />
area are antigorite serpentinites grading towards<br />
their margins (towards higher CO 2<br />
/H 2<br />
O at the peak<br />
of metamorphism) to carbonate-antigorite serpentinites<br />
and talc-carbonate rocks, whereas in<br />
the western part these rocks are transformed into<br />
talc-olivine rocks and distinctly olivine porphyroblastic<br />
(”dalmatian”) talc-carbonate rocks. In a<br />
similar way, only tremolite is met in calc-silicate<br />
rocks in the east, whereas diopside appears in<br />
compositionally similar rocks in the west. The reactions<br />
involved increase rock density (Lehtonen<br />
1981, Leväniemi 2016 (this volume)), and also<br />
contribute to the rock magnetic properties, but<br />
these effects are complicated by the usually extensive<br />
retrogression of ferromanganese minerals,<br />
e<strong>sp</strong>ecially olivine, to lizardite and chrysotile serpentine.<br />
No detailed field-based study has yet been carried<br />
out on the structural geology of the Miihkali<br />
area. All existing structural interpretations have<br />
been presented in connection with broader regional<br />
overviews, based on rock distribution and<br />
structural data on 1:100 000 scale maps, which<br />
were compiled during the 1970s (based on data<br />
mainly collected by trainee students), and on the<br />
interpretation of geophysical anomaly maps. Some<br />
116
Geological Survey of Finland, Special Paper 59<br />
Geophysical surveys of the Miihkali area, Eastern Finland<br />
attempts to geophysically evaluate/model the<br />
Miihkali structure were made by the Outokumpu<br />
company, but the results were mostly only presented<br />
in company reports (e.g. Ketola 1973, Ketola<br />
1974, Soininen 1979, Lehtonen 1980). An early<br />
attempt to model the 3D structure of the whole<br />
northern part of the eastern NKSB is included in<br />
an exploration report by Saastamoinen (1972), in<br />
the form of a block diagram constructed on seven<br />
interpreted SW-NE trending cross-sections. The<br />
diagram was prepared before the major revitalization<br />
of the early adopted Alpine concepts in the<br />
1980s (Wegmann 1928, Väyrynen 1939) in the analysis<br />
of the tectonic nature of the NKSB, but now<br />
from a plate tectonic per<strong>sp</strong>ective (e.g. Koistinen<br />
1981, Park & Bowes 1983, Park et al. 1984, Park &<br />
Doody 1990). Reflecting its time of completion,<br />
the interpretation in Saastamoinen (1972) makes<br />
no distinction between autochthonous and allochthonous<br />
units, and the Kalevian deep water sedimentary<br />
rocks are also considered autochthonous<br />
materials sedimented in a geosynclinal basin and<br />
the enclosed serpentinites as intrusive units. For<br />
the geosynclinal Kaleva, a maximum thickness of<br />
about 5 km was inferred in the middle part of the<br />
Miihkali area. The Kalevian sediments were seen<br />
as directly deposited on the Archaean basement or<br />
its thin cover of Jatulian quartzites.<br />
In the more recent regional structural models<br />
(e.g. Koistinen 1981, Park & Bowes 1983, Park et<br />
al. 1984, Sorjonen-Ward et al. 1997), the Miihkali<br />
nappe is usually interpreted as an erosional remnant<br />
of the Outokumpu nappe that now includes as<br />
its main preserved part the Viinijärvi “basin” delineated<br />
in the west by the Outokumpu-Vuonos-<br />
Horsmanaho and in the east by the Sola-Onkilahti-Petäjäjärvi<br />
serpentinite black schist chains. As<br />
there is a quite distinct difference in the maficultramafic<br />
ratio between the Miihkali and Outokumpu<br />
ophiolite fragments, it is possible that they<br />
represent different oceanic proto-sources, and<br />
hence their Miihkali and Outokumpu hosts possibly<br />
separate nappe sheets. We note here that in<br />
their synthesis across the NKSB, Park and Doody<br />
(1990, Fig. 11) correlated the Miihkali structure<br />
with their Kaavi area “duplexes”. Large recumbent<br />
folds have been interpreted as an early (F1) character<br />
of the Viinijärvi basin or synform (Koistinen<br />
1981, Park & Doody 1990). If the routinely assumed<br />
direct correlation of Miihkali and Viinijärvi<br />
was true, the possibility of early recumbent folds<br />
should also be assumed in the Miihkali nappe.<br />
Finally, we note that the customary interpretation<br />
of the Sukkulansalo and Miihkali nappes<br />
forming a simple synformal structural basin is in<br />
fact in conflict with structural data on the published<br />
geological maps, which show that across the<br />
entire central part of the assumed basin, schistosities<br />
systematically dip eastwards (
Geological Survey of Finland, Special Paper 59<br />
Ilkka Lahti, Hanna Leväniemi, Asko Kontinen, Peter Sorjonen-Ward, Soile Aatos and Esko Koistinen<br />
also mostly dipping to the east, although gently N<br />
or S plunging outcrop-scale S-type folds were locally<br />
observed to cause minor complications to this<br />
simple general pattern. Importantly, we also saw<br />
no outcrop evidence suggestive of the expected<br />
(see above) isoclinal/recumbent F1 folding. One<br />
option is that the Miihkali basin was actually defined<br />
by a west overturned asymmetrical syncline<br />
(with a steeper eastern limb), although this model<br />
also requires subsequent faulting to explain departures<br />
from the expected ideal structural (foliation/<br />
So) pattern.<br />
If the Miihkali nappe is still poorly understood,<br />
even less is known for certain about the internal<br />
structure of the underlying Sukkulansalo nappe.<br />
Overall, the only reconnaissance-style general<br />
mapping currently available for the area does not<br />
allow a truly meaningful structural analysis, which<br />
we assess would be a very difficult task, even if<br />
detailed, structurally-oriented field mapping was<br />
carried out, given the missing topographical relief<br />
and only mediocre exposure in the area. Quite plentiful<br />
and partly fairly deep-reaching (up to 1.2 km)<br />
drilling helps to constrain the structure of the<br />
western part of the Miihkali area, but in the eastern<br />
part there are only a few deeper holes concentrated<br />
around the Lipasvaara talc-mining site.<br />
Figure 2 presents an interpreted geological crosssection<br />
(E–W) of the area.<br />
POTENTIAL FIELD MODELLING<br />
The potential field dataset for the region modelled<br />
in this study (Fig. 3a) comprises systematic linebased<br />
and regional gravity data collected by Outokumpu<br />
Oy (Ketola 1973) and the airborne magnetic<br />
dataset of GTK (Hautaniemi et al. 2005).<br />
The systematic gravity survey comprises Bouguer<br />
anomaly data with mainly 100 and 200 m line <strong>sp</strong>acing<br />
and 20 m sample <strong>sp</strong>acing along the lines. The<br />
station density for the regional gravity data in the<br />
study area is 4.65 p/km 2 in the west and c. 2 p/km 2<br />
in the east (Fig. 3c). The modelling dataset was constructed<br />
by combining the interpolated grids of the<br />
systematic and regional surveys so that the former<br />
data (first corrected for level) were used where<br />
available and the latter were used to fill the remaining<br />
regions (Fig. 3d). The final modelling dataset<br />
was sampled from the combined grid with 500 m<br />
line <strong>sp</strong>acing and 50 m sample <strong>sp</strong>acing along lines<br />
that cross the study area in an east–west direction.<br />
The magnetic dataset (Fig. 3b) contains data<br />
from the Juankoski airborne survey area completed<br />
in August-September 1980, corre<strong>sp</strong>onding to an<br />
IGRF total field intensity of 52 129 nT, field inclination<br />
74.5° and declination 7.5°. The survey was conducted<br />
with 200 m line <strong>sp</strong>acing; in the study area,<br />
the median sample <strong>sp</strong>acing was 24 m and the median<br />
altitude 35 m. For this work, the data were interpolated<br />
with 50 m cell <strong>sp</strong>acing, upward continued<br />
to 50 m altitude for noise-reduction purposes<br />
and finally sampled with 100 m line <strong>sp</strong>acing (east–<br />
west lines) and 50 m sample <strong>sp</strong>acing. The regional<br />
level of 51 300 nT was removed from the data.<br />
We used both forward modelling and 3D inversion<br />
in interpreting the Miihkali potential field<br />
dataset. The density model was constructed using<br />
forward modelling. This approach was selected due<br />
to the abundance of drill hole data that could be<br />
used in model construction and also because of the<br />
double-peaked density distribution of the Miihkali<br />
massif rocks (see Leväniemi 2016), which proved<br />
challenging for the inversion algorithms tested in<br />
the course of the work. The aeromagnetic data for<br />
the Miihkali region were modelled with 3D inversion<br />
algorithms. We employed the UBC-GIF inversion<br />
algorithm MAG3D v4.0 (e.g. Li & Oldenburg<br />
1996) run via the Pitney Bowes ModelVision v14.0<br />
interface; the latter was also used for all forward<br />
modelling.<br />
Gravity modelling<br />
The forward modelling was performed on east–<br />
west-trending lines with 500 m line <strong>sp</strong>acing and<br />
50 m station <strong>sp</strong>acing. Terrain topography was included<br />
in the model. The Bouguer anomaly map<br />
(Fig. 3d) shows two main gravity components: a<br />
broad, long-wavelength regional maximum and<br />
more local features, most of which are probably<br />
related to the Miihkali massif. The modelling was<br />
re<strong>sp</strong>ectively performed in two phases: firstly, the<br />
generation of the regional level model, and then<br />
modelling of the ultramafic massif.<br />
118
Geological Survey of Finland, Special Paper 59<br />
Geophysical surveys of the Miihkali area, Eastern Finland<br />
Fig 3. a) Geological map of the area (potential field modelling region outlined in black) (Bedrock of Finland −<br />
DigiKP), b) an aeromagnetic map, c) gravity data sampling locations for systematic and regional datasets, and d)<br />
a Bouguer anomaly of the gravimetric dataset.<br />
Regional level<br />
A wide long-wavelength anomaly located in the<br />
mid-part of the study area (Fig. 3d) is assumed to<br />
be caused by the metasediments (‘mica schists’)<br />
that lie over the slightly lower-density Archaean<br />
basement, as earlier demonstrated by Ketola<br />
(1974). In the model, the mica schist density was<br />
set to a relative value of 0.08 g/cm 3 (in comparison<br />
to the Archaean gneisses) (see Leväniemi 2016)<br />
and the model regional level at -8.5 mgal. With<br />
these parameters, we were able to model the mica<br />
schists with a 3D model body that has a maximum<br />
thickness of less than 3 km and a western contact<br />
dipping towards the east (Fig. 4).<br />
The regional level model conforms moderately<br />
well to the geological cross-section presented in<br />
geology chapter (Fig. 2) and in Figure 5, and as<br />
such it is plausible that the regional gravity maximum<br />
is mainly caused by the metasediments.<br />
Any mafic dykes and sills within the underlying<br />
Jatuli and Archaean rock are assumed to be of<br />
119
Geological Survey of Finland, Special Paper 59<br />
Ilkka Lahti, Hanna Leväniemi, Asko Kontinen, Peter Sorjonen-Ward, Soile Aatos and Esko Koistinen<br />
Fig. 4. Two cross-sections of the regional level model.<br />
relatively high density and would also contribute<br />
to the total anomaly, but with the currently available<br />
information, the undi<strong>sp</strong>uted separation of<br />
various regional anomaly sources is unavoidably<br />
infeasible.<br />
The calculated gravity re<strong>sp</strong>onse of the mica<br />
schist model body was removed from the original<br />
Bouguer anomaly data in order to disclose the residual<br />
re<strong>sp</strong>onse, mainly comprising the re<strong>sp</strong>onse<br />
from the Miihkali massif rocks (Fig. 6).<br />
Fig. 5. Regional level model (dark blue) in comparison with the geological cross-section of N=6990000 (Fig. 2).<br />
The potential field modelling study area is outlined in black.<br />
Fig. 6 a) Modelled re<strong>sp</strong>onse of the mica schist body, i.e. regional level and b) the gravity residual. Note the difference<br />
in the colour palettes. The residual data were only modelled for the region outlined in black on the gravity<br />
residual map.<br />
120
Geological Survey of Finland, Special Paper 59<br />
Geophysical surveys of the Miihkali area, Eastern Finland<br />
Modelling of the Miihkali Massif<br />
The residual gravity data for the Miihkali massif<br />
(Fig. 6) consist of gravity maxima and a distinct<br />
gravity minimum. This indicates that the massif<br />
is, in terms of densities, divided into a low-density<br />
part, i.e. the chrysotile serpentinite, and a highdensity<br />
part, which comprises the rest of the Outokumpu<br />
altered ultramafic rocks (OAUM), as well as<br />
the metagabbros.<br />
For the residual model, we used relative density<br />
values of -0.25 g/cm 3 for the serpentinites<br />
and 0.18 g/cm 3 for the OAUM rocks and metagabbros<br />
(in comparison to the mica schist; Leväniemi<br />
2016). For the serpentinites, the density used in<br />
modelling was lower than the local median value<br />
of serpentinites (see Leväniemi 2016); this value<br />
was selected by comparing the modelling results<br />
with drilling: a lower density gives better-suited<br />
bottom depths for model bodies. We suggest this<br />
is because the modelled units contain few ‘impurities’<br />
that would increase the density, i.e. the<br />
modelled units represent the low-value end of the<br />
density histogram, perhaps partly due to incompatibilities<br />
between the geological logging terminology<br />
and geophysical characteristics.<br />
The final model is presented in Figure 7 and its<br />
re<strong>sp</strong>onse in comparison to the residual gravity data<br />
in Figure 8.<br />
Fig. 7. The Miihkali massif density model, with the<br />
tran<strong>sp</strong>arent gray surface part outlining the extent of<br />
the massif on the bedrock map. Model colours: Green =<br />
serpentinite, orange = OAUM rocks and metagabbros.<br />
Fig. 8 a) The residual gravity data from Figure 6b, and b) the re<strong>sp</strong>onse from the model presented in Figure 7.<br />
121
Geological Survey of Finland, Special Paper 59<br />
Ilkka Lahti, Hanna Leväniemi, Asko Kontinen, Peter Sorjonen-Ward, Soile Aatos and Esko Koistinen<br />
In the course of forward modelling, the classification<br />
data of the drill core lithology were used as<br />
guide in constructing the model bodies. However,<br />
as the model only uses two density values, some<br />
discrepancies between the drilling results and the<br />
model remain. For example, in Figure 9, in the<br />
eastern bottom part of the massif (e.g. drillhole<br />
JU-MI-114), black schists appear among the OAUM<br />
rocks, which lowers the bulk density; the model<br />
density may be assumed to be too high and consequently<br />
the bottom depth too shallow. In this<br />
profile, a noteworthy feature is the high-density<br />
feature at the eastern end of the massif; this was<br />
modelled as a curved, upward-reaching extension<br />
of the ultramafic rock.<br />
In some cases, in order to maintain the best<br />
compatibility with drilling results, the low-density<br />
serpentinite sections in the drill hole were omitted,<br />
i.e. were assumed to be of high density. An<br />
example of this is shown in Figure 10.<br />
Fig. 9. Comparison of the gravity model with drill hole profile N=6989000 (Finland Uniform Coordinate System).<br />
Green = serpentinite, orange = OAUM rocks and metagabbros, purple = black schists, blue = mica schists.<br />
Fig. 10. Comparison of the gravity model with drill hole profile N=6988500. Green = serpentinite, orange = OAUM<br />
rocks and metagabbros, purple = black schists, blue = mica schists.<br />
122
Geological Survey of Finland, Special Paper 59<br />
Geophysical surveys of the Miihkali area, Eastern Finland<br />
Modelling of the Saramäki deposit<br />
The Saramäki mineralization south of the main<br />
massif (see Fig. 1) consists of a
Geological Survey of Finland, Special Paper 59<br />
Ilkka Lahti, Hanna Leväniemi, Asko Kontinen, Peter Sorjonen-Ward, Soile Aatos and Esko Koistinen<br />
Fig. 12. Two E–W sections of the Saramäki deposit.<br />
exceed a relative value of 0.1 g/cm 3 within this body;<br />
outside the body boundaries, the density was allowed<br />
to vary between -0.1 and 0.5 g/cm 3 . The aim<br />
of inversion is to determine whether the recovered<br />
model suggests high densities outside the limiting<br />
body. The cell size in inversion is 50 by 50 m.<br />
The resulting constrained inversion model (Fig.<br />
15) suggests that either the high densities related<br />
to mineralization and its host rock do not extend<br />
further north than is covered by the current<br />
drilling, or, if there is continuation, the density<br />
contrast is not high enough to give rise to gravity<br />
anomalies in ground surveys. At the northern<br />
end of the model, the altered rocks of ultramafic<br />
origin in the Miihkali massif explain well the shallow<br />
density structures in the recovered inversion<br />
model.<br />
124
Geological Survey of Finland, Special Paper 59<br />
Geophysical surveys of the Miihkali area, Eastern Finland<br />
Fig. 13. Drill-hole lithologies.<br />
Fig. 14. The constraining high-density body viewed from the a) east and b) south.<br />
Fig. 15. The Saramäki 3D gravity inversion model (clipped at 0.06 g/cm 3 ).<br />
125
Geological Survey of Finland, Special Paper 59<br />
Ilkka Lahti, Hanna Leväniemi, Asko Kontinen, Peter Sorjonen-Ward, Soile Aatos and Esko Koistinen<br />
Magnetic modelling<br />
Magnetic modelling was conducted with the MAG3D<br />
inversion algorithm. The size of the study area was<br />
19.0 km by 16.5 km; the inversion cell size in a horizontal<br />
direction was selected to be 100 m. The input<br />
data were upward-continued to a nominal altitude<br />
of 50 m prior to inversion. The inversion parameter<br />
values are listed in Table 1.<br />
Remanent magnetization in inversion<br />
In the Miihkali region, as in the Outokumpu region<br />
in general, there is one inversion precondition<br />
that is known not to be fulfilled: the inversion algorithms<br />
do not usually take remanent magnetization<br />
into account. However, most notably, the<br />
black schists in the study region are known to have<br />
high ratios of remanent to induced magnetization<br />
(Koenigsberger ratio or Q ratio). In Miihkali, the ratio<br />
for black schists is c. Q = 10 and the direction<br />
of remanent magnetization also deviates from the<br />
inducing field direction (inclination = 45°, declination<br />
= 90°) (Ahokas 1980), i.e. the magnitude of the<br />
remanent magnetization is ten-fold greater than<br />
the induced magnetization, and the magnetization<br />
direction also differs from that of the induced<br />
magnetization. For serpentinites and skarn rocks,<br />
Ahokas (1980) reports such wide value ranges and<br />
standard deviations that the generalized remanent<br />
magnetization parameters for these rocks cannot<br />
be established from the sample set.<br />
Figure 16 presents a synthetic model re<strong>sp</strong>onse of<br />
a dipping black schist body 1) with induced magnetization<br />
only and 2) with added remanent magnetization,<br />
such as the body would appear in the<br />
Miihkali region. With remanent magnetization of<br />
this direction and magnitude, the amplitude of the<br />
modelled re<strong>sp</strong>onse is c. ten-fold greater in comparison<br />
to the re<strong>sp</strong>onse from the induced magnetization<br />
only; the shape of the anomaly is also<br />
notably different.<br />
To examine the effect of remanent magnetization<br />
in inversion that only assumes induced magnetization<br />
to be present, unconstrained inversions<br />
of the calculated re<strong>sp</strong>onses from the synthetic<br />
a) b) c)<br />
Fig. 16. a) Model body with dimensions 100 x 400 x 620 m and 30-degree dip, magnetic susceptibility k = 0.02 SI<br />
and the top surface at the depth of 10 m, the magnetic anomaly re<strong>sp</strong>onse b) without and (c) with remanent magnetization<br />
(Q = 10, I = 45° and D = 90°). The results are modelled at 15 m altitude with field parameters matching<br />
the Miihkali airborne survey. Note the difference in the magnitudes of the magnetic anomalies.<br />
a) b)<br />
Fig. 17. Cross sections of inversion results of the synthetic model re<strong>sp</strong>onses of Figure 16: a) the model with Q = 0<br />
and b) the model with Q = 10. The original model body is outlined in white. Note the difference in the colour<br />
scales.<br />
126
Geological Survey of Finland, Special Paper 59<br />
Geophysical surveys of the Miihkali area, Eastern Finland<br />
models demonstrated that the inversion algorithm<br />
manages to solve the general dip direction and<br />
depth extent for the model with Q = 0, although<br />
the inferred dip is too steep (Fig. 17a). However,<br />
for the model Q = 10 (Fig. 17b), the direction of the<br />
remanent magnetization greatly affects the solved<br />
dip direction as the recovered model body appears<br />
nearly vertical. The results provide an indication<br />
of the effects we may see in the Miihkali inversion<br />
results whenever black schists are present.<br />
Inversion results<br />
The magnetic inversion was performed for the entire<br />
study area (Figs. 3a–b).<br />
Due to the strong remanent magnetization of<br />
the black schists, in particular, it is challenging to<br />
find reasonable ways to employ geological or petrophysical<br />
inversion constraints on the Miihkali<br />
region. Constraining the variation in the magnetic<br />
properties based on the density model would disregard<br />
the black schists altogether, as they may<br />
occur outside the density model bodies; similarly,<br />
guiding the inversion towards a reference model<br />
built from measured drill core susceptibilities<br />
would bias the calculation. Thus, the inversion was<br />
finally left unconstrained. The inversion parameters<br />
are presented in Table 1.<br />
Looking at the recovered magnetic susceptibility<br />
model at various depths (Fig. 18), the shallow<br />
parts of the model reflect the known Miihkali massif<br />
rocks and black schists. The deeper parts of the<br />
magnetic structure, visible on the magnetic map<br />
(Fig. 18a) as long-wavelength anomalies, become<br />
clearly visible in the model at depths greater than<br />
500 m below the surface.<br />
The 3D model can be clipped to only show<br />
magnetic susceptibilities (k) exceeding a certain<br />
threshold value. In Figure 19a, clipping the model<br />
to show higher susceptibilities only (k > 0.05 SI),<br />
we can see a structure closely corre<strong>sp</strong>onding to the<br />
surface presentation of the Miihkali massif rocks,<br />
although the dip of the model structure can be<br />
considered unduly steep with regard to prior geological<br />
knowledge. With a lower threshold value<br />
(k > 0.025 SI) in Figure 19b, the deep-set curving<br />
“extensions” of the magnetic body (also detected<br />
in Fig. 18a) can be outlined.<br />
Comparison of the recovered susceptibility<br />
model with drill-hole information (e.g. Fig. 20)<br />
draws attention to the dip and depth extent of<br />
high-susceptibility parts of the model. Considering<br />
the effects introduced in Figure 17, the remanent<br />
magnetization of the black schists (top part<br />
of drill hole JU-MI-81, bottom parts of the drill<br />
holes JU-MI-114 and JU-MI-78 in Figure 20) may<br />
well cause an overly vertical dip for the structure,<br />
as well as a false low-magnetization region on<br />
the eastern side of the black schists flanking the<br />
meta-ultramafic and gabbro rocks. In this case, it<br />
is difficult to estimate the exact effects of the remanent<br />
magnetization on the inversion results.<br />
In addition to the dip directions, the high total<br />
magnetization in the vicinity of the black schists<br />
(c. ten-fold in comparison to induced magnetization)<br />
may well cause the depth extent of the structures<br />
to be unreliably portrayed; comparison of the<br />
model and the measured susceptibilities certainly<br />
reveals inaccuracies in the inversion results. However,<br />
drill hole JU-MI-78 shows a section of highsusceptibility<br />
serpentinite rocks, and the inversion<br />
model susceptibilities also increase east of the drill<br />
hole; the top depth of the inversion structure fits<br />
the drilling results. This suggests that even though<br />
the recovered inversion model result is admittedly<br />
at least partially open to di<strong>sp</strong>ute, the model can<br />
still highlight interesting magnetic features outside<br />
the scope of the current drilling information.<br />
Table 1. Parameters used in the magnetic 3D inversion.<br />
Inversion parameter Value<br />
Mesh size<br />
194 × 169 × 40 cells<br />
Cell size<br />
100 × 100 m, cell height increasing downwards<br />
Sample interval<br />
100 × 100 m<br />
Maximum depth<br />
4000 m<br />
Data error<br />
20 nT<br />
Chifact 1.0<br />
Model bounds<br />
0.0–1.0 SI<br />
Topography<br />
Constant 150 m<br />
Elevation<br />
Constant 200 m<br />
Depth weighting β = 3.0, z 0<br />
= 74.45<br />
Initial and reference models 0.0 SI<br />
Field parameters B = 51219 nT, I = 74.5°, D = 7.5°<br />
127
Geological Survey of Finland, Special Paper 59<br />
Ilkka Lahti, Hanna Leväniemi, Asko Kontinen, Peter Sorjonen-Ward, Soile Aatos and Esko Koistinen<br />
a) b)<br />
c) d)<br />
Fig. 18. Residual total magnetic intensity data (a) and the recovered magnetic susceptibility model at depths of<br />
b) 200 m, c) 500 m and d) 1000 m below the surface.<br />
a) b)<br />
Fig. 19. Recovered magnetic susceptibility model clipped at a) 0.05 SI and b) 0.025 SI for the Miihkali massif,<br />
which is outlined in both a) and b) for its surface geology.<br />
128
Geological Survey of Finland, Special Paper 59<br />
Geophysical surveys of the Miihkali area, Eastern Finland<br />
Fig. 20. Comparison of the recovered magnetic susceptibility model with drill-hole profile N=6989000. Magnetic<br />
susceptibilities logged from the drill holes are shown as black profiles plotted along the holes, and the anomalous<br />
density model is outlined with a dashed line. Drill-hole lithology colours: green = serpentinite, orange =<br />
OAUM rocks and metagabbros, purple = black schists, blue = mica schists.<br />
DEEP ELECTROMAGNETIC SURVEYS<br />
In the Outokumpu region, the Miihkali area is exceptionally<br />
favourable for electromagnetic (EM)<br />
measurements, as the area is located far from major<br />
sources of anthropogenic electromagnetic disturbances.<br />
This is particularly beneficial for ZTEM<br />
and AMT surveys, which utilize natural electromagnetic<br />
fields. Prior to the current project, scalar<br />
AMT (Soininen 1979, Lehtonen 1980) and Gefinex<br />
400s (Kuronen et al. 2003) surveys had been carried<br />
out in the Miihkali area. New ZTEM and tensor<br />
AMT data were collected during this project. Figure<br />
21 presents the survey lines of the aforementioned<br />
deep EM measurements plotted on airborne magnetic<br />
and electromagnetic maps. The airborne EM<br />
map (Fig. 21b) shows a shallow conductivity structure<br />
(generally < 50 m), which helps to assess the<br />
<strong>sp</strong>atial correlation of surface and deep conductivity<br />
anomalies.<br />
ZTEM survey<br />
As a part of the Outokumpu mining camp project,<br />
GTK purchased a helicopter Z-axis tipper electromagnetic<br />
(ZTEM) survey that was carried out by<br />
Geotech Airborne Ltd in June 2013. The ZTEM system<br />
provides information from sources located in<br />
the depth range of approximately 0.5–2 km. Altogether,<br />
~ 1250 line km were measured with line<br />
<strong>sp</strong>acing of 500 m, 1 km and 2 km. Line <strong>sp</strong>acing in<br />
the Miihkali area was either 1 or 2 km. The contractor<br />
provided 2D and 3D inversions of the ZTEM data<br />
(Geotech Ltd 2013). The description of the survey<br />
and the inversion results are presented in the same<br />
volume by Kurimo et al. (2016).<br />
129
Geological Survey of Finland, Special Paper 59<br />
Ilkka Lahti, Hanna Leväniemi, Asko Kontinen, Peter Sorjonen-Ward, Soile Aatos and Esko Koistinen<br />
a) b)<br />
Fig. 21. Location of deep EM sounding profiles in the Miihkali area. The background image is a) an airborne magnetic<br />
and b) an airborne EM in-phase component map at 3222 Hz.<br />
The ZTEM system measures naturally occurring<br />
magnetic field variations as the magnetotelluric<br />
(MT) technique (Condor Consulting Inc. 2012).<br />
From a geological point of view, the ZTEM system<br />
re<strong>sp</strong>onds best to conductivity contrasts associated<br />
with large-scale geological features. The moving<br />
receiver measures the vertical magnetic field<br />
(H z<br />
) and the horizontal components (H x<br />
, H y<br />
) are<br />
measured simultaneously at a base station. The<br />
processed data (tipper components) comprise the<br />
ratios of H z<br />
/H y<br />
and H z<br />
/H x<br />
, commonly referred to as<br />
the tipper ratios T zx<br />
and T zy<br />
. The data consist of 24<br />
parameters in total: real (in-phase) and imaginary<br />
(quadrature) parts of the tipper transfer functions<br />
derived from the in-line (T zx<br />
) and the cross-line<br />
(T zy<br />
) components of six frequencies (25, 37, 75, 150,<br />
300 and 600 Hz). It is noteworthy that H z<br />
is generated<br />
by the horizontal conductivity contrasts (2D<br />
and 3D structures), and the system is consequently<br />
not sensitive to 1D (layered earth) structures. The<br />
obvious advantage of ZTEM is that multi-frequency<br />
deep EM data can be acquired from a large area in a<br />
short time.<br />
It is well known that owing to the inherently<br />
ambiguous nature of geophysical data, significantly<br />
differing interpretations can be relevantly produced<br />
from the same data. However, features that<br />
are consistent between various interpretations are<br />
probably more reliable. Top views of 2D (interpolated)<br />
and 3D inversion results are compared in<br />
Figure 22. As an example of modelling differences,<br />
the Saramäki deposit area (Fig. 22a) is conductive<br />
in the 2D results, whereas 3D results do not show<br />
a clear conductivity anomaly associated with the<br />
target. On the other hand, the Saramäki area is<br />
not optimal for 2D inversion, as the conductivity<br />
anomalies are not perpendicular to the modelling<br />
lines (flight lines), which is a pre-assumption of<br />
2D inversion. Therefore, the obtained conductivity<br />
structure could partly be a modelling artefact.<br />
Both results, however, show conductive graphitebearing<br />
schist to the west of the deposit, which is<br />
clearly seen in the airborne EM results (Fig. 21b).<br />
2D inversion is independently performed for<br />
each survey line, whereas 3D inversion uses all<br />
data simultaneously. Thus, for cases with a large<br />
line separation, 3D results may become unreliable,<br />
as the geoelectric structure is “under-sampled”,<br />
that is, the penetration depth or the EM field is<br />
less than the line <strong>sp</strong>acing. This might be the case<br />
in the NE part of the ZTEM survey area, where the<br />
line <strong>sp</strong>acing was 2 km. The limitation of 2D inversion,<br />
in turn, is the abovementioned pre-assumption<br />
that the electrical structure is perpendicular<br />
to the modelled survey lines. This assumption is<br />
often likely to be violated in the study area. In this<br />
study, for example, in the north-easternmost part<br />
of the survey area, at least shallow conductors are<br />
elongated along the flight lines (e.g. see Fig. 21b).<br />
The other disadvantage of 2D inversion is that only<br />
50% of ZTEM data are used, i.e. the in-line (T zx<br />
, i.e.<br />
TE mode) component, as the TM mode tipper re<strong>sp</strong>onse<br />
is zero in a 2D model.<br />
Figure 23 shows ZTEM models in a per<strong>sp</strong>ective<br />
view together with the surface geology. It can be<br />
seen from the images that both the 2D and 3D<br />
130
Geological Survey of Finland, Special Paper 59<br />
Geophysical surveys of the Miihkali area, Eastern Finland<br />
a)<br />
b)<br />
Fig. 22. Spatial distribution of ZTEM conductors: a) interpolated 2D and b) 3D inversion results. A red colour<br />
denotes 500 Ωm and blue (at 50% tran<strong>sp</strong>arency) 3000 Ωm isosurfaces, re<strong>sp</strong>ectively. The locations of the deep<br />
EM profiles presented in Figure 21 are shown as thin black lines. Thick black lines outline some main geological<br />
boundaries. The Saramäki deposit is indicated by a yellow star.<br />
a)<br />
b)<br />
Fig. 23. Per<strong>sp</strong>ective views of a) the interpolated 2D and b) 3D ZTEM inversion results. A red colour denotes 500<br />
Ωm and blue (50% tran<strong>sp</strong>arency) 3000 Ωm isosurfaces, re<strong>sp</strong>ectively. For reference, a tran<strong>sp</strong>arent geological map<br />
is also presented. The view is from the south.<br />
models show a pronounced conductor (C1), which<br />
appears <strong>sp</strong>atially closely related to the Miihkali<br />
massif. The geological explanation for the apparently<br />
enhanced electrical conductivity of the<br />
serpentinite-metagabbro massif is unclear. It<br />
is noteworthy, however, that according to galvanic<br />
electrical conductivity measurements (Ketola<br />
1973), for instance, Outokumpu serpentinities<br />
could themselves be quite conductive. The band of<br />
conductive sulphide-graphite bearing schists occurring<br />
along the western margin of the Miihkali<br />
mica gneiss area may also contribute to the observed<br />
ZTEM anomaly. Furthermore, the thin black<br />
schist layers and/or sulphides frequently occurring<br />
in or at the serpentinite body margins certainly<br />
cause EM anomalies. In the 2D model images, the<br />
C1 conductor is seen to gently dip eastwards below<br />
an overlying resistive unit (R1). In the 3D model, a<br />
deep conductor C2 is detected at the depths of 500–<br />
750 m. Although the deep conductor C2 is absent in<br />
2D inversion results, many conductive and resistive<br />
features are quite similar (C1, C3, C4 and R2) in both<br />
the 2D and 2D inversion results. The conductor C2<br />
is located in the area of widely <strong>sp</strong>aced survey lines<br />
(2 km), and its existence should thus be tested with<br />
drilling or by additional deep EM measurements.<br />
131
Geological Survey of Finland, Special Paper 59<br />
Ilkka Lahti, Hanna Leväniemi, Asko Kontinen, Peter Sorjonen-Ward, Soile Aatos and Esko Koistinen<br />
AMT soundings<br />
AMT soundings were performed in the Miihkali<br />
area in 1979–1980 and during the current project.<br />
The older measurements were performed by Outokumpu<br />
Oy with scalar AMT equipment (Soininen<br />
1979, Lehtonen 1980). In addition, Lakanen<br />
(1981) reported results from control source AMT<br />
tests in Miihkali. In the scalar measurement of the<br />
1979–1980 survey, a single polarization impedance<br />
sounding curve was acquired and the sensors<br />
needed to be rotated in order to obtain information<br />
from other polarizations. The system measured<br />
nine apparent resistivity values in the frequency<br />
range of 8–3700 Hz. The older survey was carried<br />
out along a 14 km long profile, which transected<br />
the Miihkali mica gneiss area in the E–W direction<br />
(Fig. 21). The measurements in “TE mode”<br />
were performed using 200 m site <strong>sp</strong>acing and in<br />
“TM mode” at 400 m site <strong>sp</strong>acing. In the TE mode,<br />
the induction coil magnetometer is perpendicular<br />
and electric dipole parallel to the geoelectric strike<br />
direction. In the TM mode, the electric dipole is<br />
perpendicular and induction coil magnetometers<br />
parallel to the strike. Therefore, when using these<br />
concepts, the structure is assumed to be 2D, and in<br />
the case of Miihkali the 2D electrical conductivity<br />
structure was assumed to be N–S elongated. Onedimensional<br />
interpretation was carried out for both<br />
modes and results were di<strong>sp</strong>layed as pseudosections.<br />
An eastwards-dipping conductor was interpreted<br />
to follow the lower boundary of the Miihkali<br />
mica gneiss/Sukkulansalo nappe. The results also<br />
inferred a shallower depth for the central part of<br />
the mica gneiss unit (depths 600–900 m) followed<br />
by an abrupt increase in depth to the east. In the<br />
easternmost part, the unit was interpreted to be<br />
thinning eastwards.<br />
GTK has recently carried out tensor AMT surveys<br />
using acquisition procedures that include remote<br />
referenced measurements (Gamble et al. 1979),<br />
robust processing (Egbert & Booker 1986, Chave et<br />
al. 1987) and subsequent 1D/2D/3D modelling and<br />
inversion. The instruments used and the surveys<br />
have been described in Lahti (2015). In the measurement<br />
procedure, five components (H x<br />
, H y<br />
, H z<br />
, E x<br />
and E y<br />
) of the EM field are simultaneously recorded.<br />
In addition, a remote reference site records two<br />
components (H x<br />
and H y<br />
) during the survey, which<br />
helps to reduce uncorrelated EM disturbances.<br />
During this project, AMT data were acquired along<br />
five profiles, including one for the Miihkali area.<br />
The AMT data at the frequency range 1–10 000 Hz<br />
were acquired during the day, whereas long night<br />
recordings enabled data to be obtained in the frequency<br />
range of 0.01–10 000 Hz. Measurements<br />
were performed using two Metronix 24bit ADU-<br />
07e broadband electromagnetic acquisition systems.<br />
Robust remote reference processing mostly<br />
yielded good data quality, particularly for data recorded<br />
during the night.<br />
The central part of the Miihkali mica gneiss unit<br />
is appropriate for E–W 2D modelling, as it is characterized<br />
by roughly N–S elongated, laterally extensive<br />
conductors indicated by low-altitude airborne<br />
electromagnetic data. The remote referenced<br />
AMT data were acquired at 21 sites along an 18 km<br />
long E–W profile. The profile is located ca. 2 km to<br />
the north of the old Outokumpu Oy AMT profile. 2D<br />
inversion was jointly carried out for the TE and TM<br />
data using the nonlinear conjugate gradient algorithm<br />
by Rodi and Mackie (2001). It is well known<br />
that galvanic distortion can shift apparent resistivity<br />
curves (e.g. Wannamaker et al. 1984, Jiracek<br />
1990). Therefore, an error floor of 15% was assigned<br />
for the apparent resistivity and 5% for the phase,<br />
re<strong>sp</strong>ectively. Satisfactory fit and stable inversion<br />
solution was obtained for the profile with the RMS<br />
error of 3.3. The inversion result (Fig. 24a) shows a<br />
gently eastwards dipping conductor in the Miihkali<br />
mica gneiss located at the bottom of the inferred<br />
Miihkali nappe, reaching depths greater than 1 km<br />
at approximately the eastern margin of the oval<br />
Miihkali nappe. Further to the east, the conducting<br />
feature vanishes. The conductivity model is mainly<br />
consistent with the old AMT survey results and the<br />
new ZTEM 2D model (Fig. 24b). The gently dipping<br />
conductor is probably related to N–S elongated airborne<br />
EM anomalies that are seen to coincide with<br />
the Miihkali serpentinite massif and black schist<br />
band along the western margin of the allochthonous<br />
Miihkali mica gneisses. The old AMT results<br />
inferred a steeply west-dipping conductor at the<br />
eastern margin of the Miihkali nappe, which is<br />
probably related to conductor C4 seen in ZTEM results.<br />
The AMT model in Figure 24 does not clearly<br />
show this feature, most likely because the profile<br />
is located north of C4 and the old AMT profile. The<br />
ZTEM conductor C2 in 3D ZTEM inversion results is<br />
not seen in the new AMT 2D model.<br />
132
Geological Survey of Finland, Special Paper 59<br />
Geophysical surveys of the Miihkali area, Eastern Finland<br />
a)<br />
b)<br />
Fig. 24. a) New AMT 2D inversion model (RMS = 3.3) and b) comparison of new AMT 2D and interpolated ZTEM 2D<br />
models (grey 500 Ωm isosurface). For reference, surface geology is also shown as a tran<strong>sp</strong>arent layer. The view<br />
is from the southeast.<br />
Sampo soundings<br />
Sampo (Gefinex 400S) is a frequency domain EM<br />
system developed by the Outokumpu Oy for Outokumpu<br />
Exploration and GTK (Aittoniemi et al. 1987,<br />
Soininen & Jokinen 1991, Sipola 2002). The practical<br />
maximum survey depth of the method is less than<br />
1 km, but if dense measurement <strong>sp</strong>acing is used,<br />
the <strong>sp</strong>atial resolution is higher compared to other<br />
deep EM techniques. The measurements in the<br />
Miihkali area were carried out in 2002 during the<br />
joint Outokumpu-GTK GEOMEX project (Kuronen<br />
et al. 2003) in two target areas at Kiskonjoki and<br />
Lipa<strong>sp</strong>uro. The measurements were performed using<br />
a “broadside” loop configuration in which the<br />
transmitter and receiver were located at opposite<br />
sides of the E–W directed profiles. The distance between<br />
the transmitter and receiver was 500 m. The<br />
line <strong>sp</strong>acing was 500 m and the station <strong>sp</strong>acing 100<br />
m. Altogether 224 soundings were made along 10<br />
profiles with a total length of 21.4 km. The acquired<br />
data were interpreted using 1D inversion software<br />
developed by GTK and the results were visualized as<br />
pseudosections (Fig. 25).<br />
The densely <strong>sp</strong>aced Sampo soundings enable<br />
distinguishing separate conductors in the Miihkali<br />
serpentinite massif and within the western margin<br />
of the Miihkali mica gneiss. These conductors are<br />
probably all superimposed in one larger coherent<br />
feature in the image of the 2D AMT results due to<br />
the larger site distance and the smooth 2D inversion<br />
procedure used (Fig. 25). The Sampo method<br />
133
Geological Survey of Finland, Special Paper 59<br />
Ilkka Lahti, Hanna Leväniemi, Asko Kontinen, Peter Sorjonen-Ward, Soile Aatos and Esko Koistinen<br />
Fig. 25. A stacked image of the Lipa<strong>sp</strong>uro and Kiskonjoki Sampo (Gefinex 400S) 1D conductivity model pseudosections.<br />
An image of the AMT 2D model and the surface geology, the latter as a tran<strong>sp</strong>arent map layer, are also<br />
presented. Orange to red colours denote conductive features. The view is from the southwest.<br />
detected conductors in the Lipa<strong>sp</strong>uro area and in<br />
the northernmost profiles of the Kiskonjoki survey<br />
area (Kuronen et al. 2003). To the south, no significant<br />
shallow conductors were detected, which is in<br />
agreement with all the deep EM results previously<br />
presented here.<br />
A total of four drill holes (1382.85m) were drilled<br />
during 2001–2002 at the Kiskonjoki pro<strong>sp</strong>ect. A<br />
significant intersection of Outokumpu-type rocks<br />
was made, starting approximately at the depth<br />
of 300 m. The drill hole is located at the northernmost<br />
Sampo survey profiles at Kiskojoki. The<br />
drilled Outokumpu rocks are seen as conductors in<br />
the Sampo models.<br />
The nearly flat-lying conductor at Lipa<strong>sp</strong>uro<br />
most likely represents black schist on the top of an<br />
Outokumpu-type formation or within mica schist<br />
(Kuronen et al. 2002). The GEOMEX project had<br />
no drilling resources to test these Sampo results<br />
further.<br />
Electrical conductivity of Miihkali drill core samples<br />
Petrophysical measurements of the Miihkali drill<br />
core samples indicate significant resistivity variations<br />
in the target area. This is illustrated by Figure<br />
26, showing galvanic resistivity loggings for four<br />
drill holes. The resistivity of the granitic gneisses,<br />
mica gneisses and schists is high, mainly above<br />
10 5 Ωm (JU-MI-80). The resistivity of the skarns,<br />
carbonate rocks and metabasites is typically over<br />
10 4 Ωm (JU-MI-81, JU-MI-85). Resistivities of<br />
the Miihkali serpentinites are lower, usually 10 1 –<br />
10 4 Ωm (JU-MI-81, JU-MI-85). The serpentinites<br />
therefore have a resistivity contrast of about 2–4<br />
orders of magnitude with background rocks, which<br />
together with narrow and extremely conductive<br />
black schists layers (
Geological Survey of Finland, Special Paper 59<br />
Geophysical surveys of the Miihkali area, Eastern Finland<br />
Fig. 26. Lithology and resistivity logs of four Miihkali area drill cores with a map showing the location of the drill<br />
holes.<br />
CONCLUSIONS<br />
In this research, both forward modelling and inversion<br />
approaches were employed in potential<br />
field data modelling. The forward modelling of the<br />
residual gravity data benefited from the relatively<br />
dense drilling in the region, as the model could be<br />
constrained with the drill core logging results and<br />
the related density values. In general, the regional<br />
model and the residual model are both well in accordance<br />
with the geological cross-sections and<br />
drilling results, which implies that the current<br />
drilling scope covers the majority of the gravity<br />
sources. However, some (relatively small) discrepancies<br />
remain between the density model and the<br />
drill core logs, mainly because of inconsistencies<br />
and inordinate generalization in the rock identification<br />
and naming in the existing drill core logging<br />
data, resulting in possibly biased density classifications<br />
and density model / drill core log comparisons.<br />
High remanent magnetization intensities pose<br />
a challenge in magnetic modelling and inversion.<br />
The direction of remanent magnetization differs<br />
notably from the inducing field direction, and as<br />
such the high Q ratios in the region should not be<br />
ignored in modelling. However, accommodating<br />
magnetic inversion techniques to include remanent<br />
magnetization over large areas is still largely<br />
an unfeasible task. In Miihkali, most notably the<br />
black schists with high Q values contort the inversion<br />
results and render the inversion model results<br />
at least locally imprecise; however, in limited regions,<br />
the inversion model was related to the drillcore<br />
data and could be used as guidance, as long as<br />
the inaccuracies due to the high remanent magnetization<br />
intensities are taken into account.<br />
In general, the potential field models do not<br />
reveal entirely new and unknown features in the<br />
Miihkali region. The deep-set magnetic and highdensity<br />
features running along the main Miihkali<br />
massif have not, based on the potential field models,<br />
been thoroughly covered by drilling, and further<br />
research on these features could provide some<br />
new information on the Miihkali massif and its<br />
geological setting.<br />
Deep EM results demonstrate conductors related<br />
to the western margin of the Miihkali mica<br />
gneisses and the Miihkali serpentinite massif. The<br />
ZTEM and AMT 2D inversion results show a gently<br />
eastwards-dipping conductor in the Miihkali<br />
mica gneiss located at the bottom of the inferred<br />
Miihkali nappe, reaching depths greater than 1 km<br />
at approximately the eastern margin. The gently<br />
dipping conductor is probably related to N–S<br />
elongated airborne EM anomalies that are seen<br />
to coincide with the Miihkali serpentinite massif<br />
and black schist band along the western margin of<br />
the allochthonous Miihkali mica gneisses. In most<br />
cases, the surficial EM anomalies indicated by<br />
135
Geological Survey of Finland, Special Paper 59<br />
Ilkka Lahti, Hanna Leväniemi, Asko Kontinen, Peter Sorjonen-Ward, Soile Aatos and Esko Koistinen<br />
low-altitude airborne surveys can be connected to<br />
deep ZTEM anomalies, showing the continuation<br />
of elongated conductive features to greater depths.<br />
The densely <strong>sp</strong>aced Sampo soundings distinguish<br />
separate conductors in the Miihkali serpentinite<br />
massif and within the western margin of the<br />
Miihkali mica gneisses. In addition, the Sampo<br />
technique detected conductors in the Kiskonjoki<br />
pro<strong>sp</strong>ect, which proved to be caused by Outokumpu-type<br />
rocks intersected by drillings at the depth<br />
of 300 m.<br />
ACKNOWLEDGEMENTS<br />
The authors acknowledge reviews of the manuscript by Aimo Hattula and Markku Pirttijärvi.<br />
REFERENCES<br />
Ahokas, T. 1980. Petrofysikaalisia sovellusesimerkkejä.<br />
In: Pesonen, L. J. (ed.) Sovelletun geofysiikan jatkokurssi<br />
1979−1980 6.33.35. Teknillinen korkeakoulu. (in<br />
Finnish)<br />
Aittoniemi, K., Rajala, J., & Sarvas, J. 1987. Interactive<br />
Inversion Algorithm and Apparent Resistivity Versus<br />
Depth (ARD) Plot in Multifrequency Depth Soundings.<br />
Acta Polytechnica Scandinavica Applied Physics Series<br />
157. 34 p.<br />
Bedrock of Finland – DigiKP. Digital map database [Electronic<br />
resource]. E<strong>sp</strong>oo: Geological Survey of Finland<br />
[referred 14.04.2016]. Version 2.0.<br />
Chave, A. D., Thomson D. J. & Ander, M. E. 1987. On the<br />
robust estimation of power <strong>sp</strong>ectra, coherences and<br />
transfer functions. Journal of Geophysical Research<br />
92, 633–648.<br />
Condor Consulting Inc, 2012. THE ZTEM PRIMER. Rev 3.<br />
Egbert G. D. & Booker J. R. 1986. Robust estimation of<br />
geomagnetic transfer functions. Geophysical Journal<br />
of the Royal Astronomical Society 87, 173–194.<br />
Gamble, T., Goubau, W. & Clarke, J. 1979. Magnetotellurics<br />
with a remote magnetic reference. Geophysics<br />
44, 53−68.<br />
Geotech Ltd. 2013. Report on a helicopter-borne Z-axis<br />
tipper electromagnetic (ZTEM) and aeromagnetic<br />
geophysical survey, Outokumpu Mining Camp Area,<br />
Finland. Project AB130076.<br />
Gaál, G. & Parkkinen, J. 1993. Early Proterozoic ophiolite-hosted<br />
copper-zinc-cobalt deposits of the Outokumpu<br />
type. In: Kirkham R.V., Sinclair, W.D., Thorpe,<br />
R.I. & Duke, J.M. (eds) Mineral Deposit Modeling.<br />
Geological Association of Canada, Special Paper 40,<br />
335-341.<br />
Gaál, G., Koistinen, T. & Mattila, E. 1975. Tectonics and<br />
stratigraphy of the vicinity of Outokumpu, North Karelia,<br />
Finland : including a structural analysis of the<br />
Outokumpu ore deposit. Geological Survey of Finland,<br />
Bulletin 271. 67 p.<br />
Hallikainen O. 1980. Kaivo<strong>sp</strong>iirihakemus Polvijärvi,<br />
Saramäki, kaiv.rek.nro 2501/1a. Outokumpu Oy. (in<br />
Finnish)<br />
Hautaniemi, H., Kurimo, M., Multala, J., Leväniemi,<br />
H. & Vironmäki, J. 2005. The “Three In One” aerogeophysical<br />
concept of GTK in 2004. In: Airo, M.-L.<br />
(ed.) Aerogeophysics in Finland 1972-2004: Methods,<br />
System Characteristics and Applications. Geological<br />
Survey of Finland, Special Paper 38, 21−74.<br />
Jiracek, G. 1990. Near surface and topographic distortions<br />
in electromagnetic induction, Surv. Geophys.,<br />
11, 163–203.<br />
Ketola, M. 1973. Outokummun alueen geofysiikasta.<br />
Outokumpu Oy, unpublished report. 15 p. (in Finnish)<br />
Ketola, M. 1974. Karttalehdellä 4313 suoritetun alueellisen<br />
gravimetraustuloksen tulkinta profiililla X=990,00.<br />
Outokumpu Oy, unpublished report. 1 p. (in Finnish)<br />
Koistinen, T. 1981. Structural evolution of an early Proterozoic<br />
strata-bound Cu-Co-Zn deposit, Outokumpu,<br />
Finland: Transactions of the Royal Society of Edinburgh:<br />
Earth Sciences, 72, 115–158.<br />
Kontinen, A. 1998. The nature of the serpentinites, associated<br />
dolomite-skarn-quartz rocks and massive Co-<br />
Cu-Zn sulphide ores in the Outokumpu area, eastern<br />
Finland. In: Hanski, E. & Vuollo, J. (eds) International<br />
ophiolite symposium and field excursion: generation<br />
and emplacement of ophiolites through time, August<br />
10-15, 1998, Oulu, Finland. Abstracts, excursion guide.<br />
Geological Survey of Finland, Special Paper 26, p. 33.<br />
Kontinen, A., Peltonen, P. & Huhma, H. 2006. Description<br />
and genetic modelling of the Outokumpu-type<br />
rock assemblage and associated sulphide deposits.<br />
Final technical report for GEOMEX J.V., Workpackage<br />
Geology. Geological Survey of Finland, archive report<br />
M10.4/2006/1. 378 p.<br />
Kurimo, M., Lahti, I. & Nousiainen, M. 2016. ZTEM survey<br />
in the Outokumpu region. In: Aatos, S. (ed.) Developing<br />
Mining Camp Exploration Concepts and Technologies<br />
– Brownfield Exploration Project 2013–2016.<br />
Geological Survey of Finland, Special Paper 59. (this<br />
volume)<br />
Kuronen, U., Kontinen, A. & Kokkonen, J. 2003. GEO-<br />
MEX project report. (unpublished report)<br />
Lahti, I. 2015. Audiomagnetotelluric (AMT) measurements:<br />
A new tool for mineral exploration and upper<br />
crustal research at the Geological Survey of Finland.<br />
In: Sarala, P. (ed.) Novel Technologies for greenfield<br />
exploration. Geological Survey of Finland, Special<br />
Paper 57, 155−172.<br />
Lakanen, E. 1981. Lähetin AMT (LAMT) kokeilu Miihkalissa<br />
ja Saramäessä 1980. Outokumpu Oy:n malminetsinnän<br />
raportit. (in Finnish)<br />
Lehtonen, T. 1980. AMT-mittaus Miihkalin Kaaren yli.<br />
Outokumpu Oy:n malmin-etsinnän raportit. (in Finnish)<br />
Lehtonen, T. 1981. Outokummun alueen kivilajien petrofysikaalisista<br />
ominaisuuksista. Unpublished master’s<br />
thesis, Helsinki University of Technology. 77 p. (in<br />
Finnish)<br />
Leväniemi, H. 2016. Petrophysical parameters and potential<br />
field modelling in the Outokumpu Belt. In:<br />
Aatos, S. (ed.) Developing Mining Camp Exploration<br />
136
Geological Survey of Finland, Special Paper 59<br />
Geophysical surveys of the Miihkali area, Eastern Finland<br />
Concepts and Technologies – Brownfield Exploration<br />
Project 2013–2016. Geological Survey of Finland, Special<br />
Paper 59. (this volume)<br />
Li, Y. & Oldenburg, D. W. 1996. 3-D inversion of magnetic<br />
data. Geophysics 61 (2), 394-408.<br />
Li, Y. & Oldenburg, D. W. 1998. 3D inversion of gravity<br />
data. Geophysics 63, 109–119.<br />
Park, A. F. 1988. Nature of the early Proterozoic Outokumpu<br />
assemblage, eastern Finland. Precambrian<br />
Research 38, 131−146.<br />
Park, A. F. & Bowes, D. R. 1983. Basement-cover relationships<br />
during polyphase deformation in the Svecokarelides<br />
of the Kaavi district, eastern Finland.<br />
Transactions of the Royal Society of Edinburgh: Earth<br />
Sciences 74, 95−118.<br />
Park, A. F. & Doody, J. J. 1990. Structural styles in the<br />
deep levels of an Early Proterozoic foreland thrust<br />
belt. In: Lewry, J. F. & Stauffer, M. R. (eds) The Early<br />
Proterozoic Trans-Hudson Orogen of North America.<br />
Geological Association of Canada, Special Paper 37,<br />
465-482.<br />
Park, A. F., Bowes, D. R., Halden, N. M. & Koistinen, T. J.<br />
1984. Tectonic evolution at an early Proterozoic continental<br />
margin: the Svecokarelides of eastern Finland.<br />
Journal of Geodynamics 1, 359−386.<br />
Peltonen, P., Kontinen, A., Huhma, H. & Kuronen, U.<br />
2008. Outokumpu revisited: New mineral deposit model<br />
for the mantle peridotite-associated Cu-Co-Zn-<br />
Ni-Ag-Au sulphide deposits. Ore Geology Reviews 33,<br />
559−617.<br />
Rodi, W. & Mackie, R. 2001. Nonlinear conjugate gradients<br />
algorithm for 2-D magnetotelluric inversion.<br />
Geophysics 66, 174−187.<br />
Saastamoinen, J. 1972. Miihkalin jakson tutkimukset v.<br />
1966−72. Outokumpu Oy:n malminetsinnän raportit<br />
001/4311, 4313/JYS/72. (in Finnish)<br />
Säntti, J., Kontinen, A., Sorjonen-Ward, P., Johanson,<br />
B. & Pakkanen, L. 2006. Metamorphism and chromite<br />
in serpentinized and carbonate-silica–altered peridotites<br />
of the Paleoproterozoic Outokumpu-Jormua<br />
ophiolite belt, eastern Finland. International Geology<br />
Review 48, 494–546.<br />
Sipola, V.-P. 2002. A new data processing and interpretation<br />
program for the Sampo electromagnetic multifrequency<br />
sounding system. Master’s thesis, Helsinki<br />
University of Technology, Otaniemi, 69 p. (in Finnish<br />
with an English abstract)<br />
Soininen, H. 1979. AMT-luotaus Miihkalin ns. Pitkällä<br />
profiililla. Outokumpu Oy:n malminetsinnän raportit.<br />
(in Finnish)<br />
Soininen, H. & Jokinen, T. 1991. Sampo, a new wide-band<br />
electromagnetic system. European Association of<br />
Exploration Geophysics 53rd meeting and Technical<br />
Exhibition, Florence, Italy. Technical programme and<br />
Abstracts of papers, 366–367.<br />
Sorjonen-Ward, P., Nironen, M. & Luukkonen, E. 1997.<br />
Greenstone associations in Finland. In: De Wit, M. J. &<br />
Ashwal, L. (eds) Greenstone belts. Oxford Monographs<br />
on Geology and Geophysics 35, 677–698.<br />
Väyrynen, H. 1939. On the geology and tectonics of the<br />
Outokumpu ore field and region. Bulletin de la Commission<br />
Géologique Finlande 124, 1−91.<br />
Wannamaker, P., Hohmann, G. W. & Ward, S. 1984.<br />
Magnetotelluric re<strong>sp</strong>onses of three-dimensional bodies<br />
in layered earths, Geophysics, 49, 1517–1533.<br />
Wegmann, C. E. 1928. Über die tectonik der jüngeren<br />
Faltungen in Ostfinnland. Fennia 50, 1−22.<br />
Wegmann, C. E. 1929. Bei<strong>sp</strong>iele tektonischer Analysen<br />
des Grundgebirges in Finnland. Bulletin de la Commission<br />
Géologique de Finlande 87, 98−127.<br />
137
Geological Survey of Finland, Special Paper 59<br />
Ilkka Lahti, Hanna Leväniemi, Asko Kontinen, Peter Sorjonen-Ward, Soile Aatos and Esko Koistinen<br />
138
Developing Mining Camp Exploration Concepts and Technologies – Brownfield Exploration Project 2013–2016<br />
Edited by Soile Aatos<br />
Geological Survey of Finland, Special Paper 59, 139–162, 2016<br />
3D MODELLING OF OUTOKUMPU ASSEMBLAGE ROCKS<br />
– A GEOSTATISTICAL APPROACH<br />
by<br />
Eevaliisa Laine<br />
Laine, E. 2016. 3D modelling of Outokumpu assemblage rocks – a geostatistical<br />
approach. Geological Survey of Finland, Special Paper 59, 139−162,<br />
20 figures.<br />
The targets of the present 3D modeling study are the middle part of the<br />
Outokumpu assemblage and Sola mineralization in the Outokumpu ore<br />
district in Eastern Finland – a metallogenic province about 100 km long<br />
x 60 km wide - hosting a Palaeoproterozoic sulfide deposit. Cu-Co-Zn-<br />
Ni-Ag-Au sulfide ores are associated with Palaeoproterozoic ophiolitic<br />
metaserpentinites derived from depleted mantle peridotites that were<br />
subsequently tectonically interleaved with allochthonous metaturbidites.<br />
The metaperidotites have been extensively altered to quartz–carbonate–<br />
calc–silicate rocks which are called as Outokumpu assemblage. The aim of<br />
the present study was to visualize, model and analyse structures related to<br />
Keretti, Vuonos and Sola sulphide mineralizations. The methods included<br />
3D geological modelling and geostatistical simulation by using geological<br />
cross sections, drill core data, seismic profiles and the helicopter-borne<br />
Z-axis tipper electromagnetic (ZTEM) inversion results. 3D visualization<br />
of 3D inversion results of ZTEM measurements were used together with<br />
the earlier fault interpretations to define large crustal discontinuities of<br />
10–30 km in length. Geological structures and lithological heterogeneity<br />
was studied by using geostatistical variogram analysis and turning bands<br />
and sequential indicator simulations. The unfolding of drill core data was<br />
done by flattening the gently folded geological layers. This unfolding process<br />
made it possible to model anisotropy parallel to layering. As a result,<br />
geostatistical simulations applied to metal contents and rock types as categorical<br />
variables indicate lithological heterogeneity and the elongation of<br />
rock units and mineralizations striking parallel to Outokumpu assemblage<br />
and very little continuity perpendicularly to the observed elongation. In<br />
addition, faulting and major shear zones divide the Outokumpu assemblage<br />
into separate blocks which differ structurally and geochemically from<br />
each other and with small relative di<strong>sp</strong>lacements. However, these small<br />
di<strong>sp</strong>lacements may affect thin (~10 m) ore bodies, and make the ore exploration<br />
in the Outokumpu area challenging.<br />
Keywords: three-dimensional models, geostatistics, Finland<br />
Geological Survey of Finland, P.O. Box 96, FI-02151 E<strong>sp</strong>oo, Finland<br />
E-mail: eevaliisa.laine@gtk.fi<br />
139
Geological Survey of Finland, Special Paper 59<br />
Eevaliisa Laine<br />
INTRODUCTION<br />
The target of the present 3D modelling study is the<br />
Outokumpu assemblage located in Eastern Finland<br />
(Fig. 1) in the Outokumpu ore district - a metallogenic<br />
province about 100 km long x 60 km wide<br />
- hosting a Palaeoproterozoic sulfide deposits (Cu-<br />
Co-Zn-Ni sulfide ores) characterized by an lithological<br />
association called Outokumpu assemblage.<br />
The aim of this study was to build regional (study<br />
area A; Fig. 1) and camp scale 3D geological models<br />
(study areas B-E; Fig. 2) using geological cross sections,<br />
drill core logs, structural geological observations<br />
and geological maps in order to analyse structural<br />
controls of sulphide mineralizations in the<br />
Outokumpu area. Geostatistical tools were tested<br />
to characterize and visualize the geological structures<br />
found surrounding the ore mineralizations.<br />
The traditional 3D modelling and visualization was<br />
combined with geostatistical simulations of subsurface<br />
rock type distributions. The present work<br />
uses the earlier built 3D geological models, and<br />
fault and shear zone interpretations by Saalmann &<br />
Laine (2014) to unfold data and divide interpolation<br />
grids for geostatistical analysis and simulation. The<br />
resulted geostatistically simulated realizations of<br />
subsurface geology are not locally accurate but they<br />
reproduce the modelled <strong>sp</strong>atial correlation and data<br />
variability. Together with traditional 3D geological<br />
modelling, geostatistical simulations makes it possible<br />
to create and test several different alternative<br />
3D voxel representations for subsurface geology.<br />
Hundreds of alternative voxet models representing<br />
the subsurface geology may be used to quantify the<br />
uncertainty. There are several different simulation<br />
approaches, such as turning bands (Mantoglou<br />
and Wilson 1982), sequential indicator (Journel &<br />
Alabert 1990, Journel & Gómez-Hernández 1993),<br />
multiple-point (Strebelle 2002), truncated Gaussian<br />
(e.g. Allard 1994) and plurigaussian (Armstrong<br />
et al. 2011) simulation. Geostatistical simulation<br />
can be applied to study lithofacies or rock type<br />
distributions of mine sites or mining camps (e.g.<br />
Schetselaar 2013).<br />
De<strong>sp</strong>ite of data <strong>sp</strong>arsity and complex geology,<br />
geostatistical simulation techniques were tested<br />
with selected data sets from the Outokumpu area.<br />
The ZTEM (Z-axis tipper electromagnetic system)<br />
3D inversion results (Kurimo et al., this volume)<br />
were used to model large fault zones in order to<br />
find new possible targets for ore exploration in the<br />
Outokumpu area.<br />
GEOLOGICAL SETTING<br />
Outokumpu assemblage comprises of lens-shaped<br />
serpentinized mafic and ultramafic bodies and<br />
their alteration association including tremoliteor<br />
diopside bearing calcite, dolomite and quartz<br />
rocks, fuchsite, tremolite and uvarovite (Peltonen<br />
et al. 2008). Outokumpu assemblage (Fig. 1) is located<br />
in the North Karelia Schist Belt, which was<br />
thrusted on the late Archaean gneissic–granitoid<br />
basement of the Karelian craton during the early<br />
stages of the Svecofennian Orogeny between 1.92<br />
and 1.87 Ga (Koistinen 1981). Two major tectonostratigraphic<br />
units can be distinguished, a lower,<br />
parautochthonous ‘Lower Kaleva’ unit and<br />
an upper, allochthonous ‘Upper Kaleva’ unit or<br />
‘Outokumpu allochthon’. The latter consists of<br />
tightly-folded deep marine turbiditic mica schists<br />
and metagraywackes containing intercalations<br />
of black schist, and the Outo kumpu assemblage,<br />
which comprises ca. 1950 Ma old, serpentinized<br />
peridotites surrounded by carbonate–calc-silicate<br />
(‘skarn’)–quartz rocks. Late tectonic solid-state<br />
remobilisation, related to the duplexing of the ore<br />
by isoclinal folding, upgraded the sulphides into<br />
economic deposits.<br />
The studied Keretti and Vuonos orebodies, and<br />
Sola sulphide mineralisations are enclosed in the<br />
Outokumpu assemblage, which is thought to be one<br />
part of a disrupted and incomplete ophiolite complex<br />
(Vuollo & Piirainen 1989) that can be traced to<br />
the Kainuu schist belt (Fig. 1) further north where<br />
the well-preserved Jormua ophiolite is ex posed<br />
(Kontinen 1987, Peltonen & Kontinen 2004). In<br />
general, ophiolites have been defined as “suites<br />
of temporarily and <strong>sp</strong>atially associated ultramafic<br />
to felsic rocks related to separate melting episodes<br />
and processes of magmatic differentiation in particular<br />
oceanic tectonic environments” by Dilek &<br />
Furnes (2011). Their geochemical characteristics,<br />
internal structure, and thickness are strongly controlled<br />
by <strong>sp</strong>reading rate, proximity to plumes or<br />
trenches, mantle temperature, mantle fertility,<br />
and the availability of fluids. The age distribution<br />
of ophiolites di<strong>sp</strong>lays pronounced maxima during<br />
the time intervals 50-200 Ma, 450-1000 Ma,<br />
140
Geological Survey of Finland, Special Paper 59<br />
3D modelling of Outokumpu assemblage rocks – a geostatistical approach<br />
Fig. 1. Geological map of the Kainuu and North Karelia schist belts and location of the Jormua ophiolite and Outokumpu<br />
ore district and distribution of deposits. The box outlines the study area A for the regional 3D geological<br />
model (Fig. 4). Cu deposits: Outokumpu/Keretti (1), Vuonos (2), Perttilahti (3), Kylylahti (4), Sola (5), Saramäki<br />
(6), Luikonlahti (7). Talc deposits: Horsmanaho (a), Alanen (b), Uutela (c), Lahnaslampi/Punasuo (d), Maailmankorpi<br />
(e), Tyynelä (f), Jormua (g), Mieslahti/Pitkänperä (h), Tiittolanvaara (i), Vasikkakangas (j). Modified<br />
after Säntti et al. (2006), Peltonen et al. (2008) and Saalmann & Laine (2014).<br />
141
Geological Survey of Finland, Special Paper 59<br />
Eevaliisa Laine<br />
Fig. 2. The geological map after Gáal et al. (1975). Targets for 3D geological models: Outokumpu assemblage rocks<br />
(area B); Keretti ore body and surrounding rocks (area C); Vuonos ore body and surrounding rocks (area D); Sola<br />
serpentinite (area E).<br />
and 2500-2750 Ma. Outokumpu assemblage rocks<br />
represent the rare occurrence of early Proterozoic<br />
ophiolites. In addition to Finland, early Proterozoic<br />
ophiolites have been reported from Canada (Scott<br />
et al. 1992).<br />
The Keretti orebody was discovered in 1910 following<br />
a recognition, in 1908, of a large ice-borne<br />
boulder 50 km to the SE (Trüstedt 1921). It contained<br />
28 million tons of ore of which 23 million<br />
tons was extracted by the end of 1980. The Keretti<br />
Cu orebody is lens-shaped, ca. 4000 m long, 250<br />
to 300 m wide, and usually less than 10 m thick,<br />
but it may attain a thickness of 30-40 m. The ore<br />
averages 3.80 % Cu, 1.00 % Zn, 0.24 % Co, 0.12 %<br />
Ni, 28.10 % Fe and 25.30 % S. The Vuonos orebody,<br />
10km NE of Keretti, contained 6 million tons of ore<br />
of which 4 million tons was extracted. At Vuonos,<br />
Outokumpu-type ore body is ca. 3500 m long, 50-<br />
200 m wide and an average of 5 to 6 m thick. Characteristic<br />
average tenors of metals were 2.18 % Cu,<br />
1.38 % Zn, 0.13 % Co, 0.12 % Ni, 14.76 % S, 10 ppm<br />
Ag and 12 ppm Se. Its discovery in 1965 followed<br />
the geochemical studies conducted by Huhma and<br />
Huhma (1970). In addition, the Ni ore above the<br />
main orebody was mined. Sola is a minor sulphide<br />
mineralization at ca. 0.1 Mt at 2 wt.% Cu, 1 wt.%<br />
Zn, 0.1 wt.% Co, 0.15 wt.% Ni and 17 wt.% S associated<br />
to skarn-quartz rocks within roundish Sola<br />
serpentinite formation to the east from the main<br />
Outokumpu ore field (Fig. 2).<br />
Regional scale structural interpretations have<br />
been conducted by several geologists. Frosterus<br />
& Wilkman (1920) presented the emplacement of<br />
allochtonous Archaean basement gneisses over<br />
Lower Proterozoic cover sequences in Eastern Finland.<br />
Wegmann (1928) and Väyrynen (1939) emphasized<br />
the significance of nappe tectonics during<br />
the Svecofennian orogeny. Bowes et al. (1984)<br />
and Koistinen (1981) made a structural geological<br />
interpretation of the polyphase deformation in<br />
the Outokumpu area while Ward (1987) proposed<br />
a model for the progressive deformational history<br />
of the Outokumpu area. Kohonen et al. (1991) constructed<br />
the regional structural geological model<br />
of North Karelia including the major Proterozoic<br />
shear zone – the Nunnanlahti-Holinmäki Shear<br />
zone as well as numerous related second order<br />
structures that traverse the Outokumpu area.<br />
Even though Outokumpu assemblage rocks form<br />
a seemingly continuous formation (Fig. 2), it has<br />
been dissected by several crosscutting discontinuities.<br />
Faulting can be seen in different scales from<br />
outcrop scale to regional structures that divide the<br />
bedrock into large blocks when cutting the former<br />
shear zones. According to Saalmann & Laine (2014)<br />
thrust stacking was followed by several stages of<br />
faulting that divided the ore belt into fault-bounded<br />
blocks with heterogeneous di<strong>sp</strong>lacements: (i)<br />
NW-dipping faults with unresolved kinematics,<br />
(ii) reverse faults along c. 50 degrees-60 degrees<br />
SW-dipping faults, and (iii) SW-NE to SSW-NNE<br />
striking faults which may have formed at an earlier<br />
stage and have been reactivated. Figure 3a<br />
shows the faulting and fracturing of the Outokumpu<br />
assemblage rocks in the Horsmanaho open<br />
pit. Keretti ore body faults have been interpreted<br />
by Saalmann & Laine (2014) by using the old mine<br />
sections from GTK archives (Laine et al. 2012) (Fig.<br />
3b). Regional faulting and shearing is shown in<br />
the Figure 3c. Ore bodies were found to be located<br />
142
Geological Survey of Finland, Special Paper 59<br />
3D modelling of Outokumpu assemblage rocks – a geostatistical approach<br />
A<br />
B<br />
C<br />
Fig. 3. Faulting in different scales. a) A Sirovision model from the Horsmanaho open pit. Photo and interpretation<br />
(Esko Koistinen in Laine et al. 2012); b) Faulting of the Keretti ore body after Saalmann & Laine (2014) c) A<br />
geological map of the Outokumpu region after Gáal et al. (1975) and faults and shear zones along the Outokumpu<br />
assemblage (Saalmann & Laine 2014) colored according to the associated uncertainty with light colors for structures<br />
inferred solely from surface data and dark colors for structures inferred using seismic sections and surficial<br />
geological and geophysical data.<br />
between two major shear zones and cut by several<br />
faults (Saalmann & Laine 2014). According to Saalmann<br />
& Laine 2014 there might have been uplift<br />
between Keretti and Vuonos orebodies, and a possible<br />
ore body has been eroded away. In addition,<br />
the metamorphic grade of Outokumpu assemblage<br />
rocks change from high amphibolites facies in<br />
the southwest to lower amphibilite facies rocks in<br />
the Kylylahti area in the northeastern part of the<br />
Outokumpu area (Säntti et al. 2006).<br />
143
Geological Survey of Finland, Special Paper 59<br />
Eevaliisa Laine<br />
DATA AND 3D MODELLING METHODS<br />
Data<br />
The applied structural geological framework was<br />
based on the structural observations derived from<br />
geological maps and structural geological interpretations<br />
(e.g. Gáal et al. 1975, Koistinen 1981,<br />
Saalmann & Laine 2014). Lithological data were<br />
obtained from the drill core logs and mine sections<br />
(GTK database) and from the geological cross<br />
sections done by Koistinen (1981). Geochemical<br />
data consisted of Cu, Ni, Zn and Co contents along<br />
Outokumpu drill cores (GTK database).<br />
The two geophysical data sets were used for<br />
geological interpretations and 3D visualisations,<br />
ZTEM inversions (Kurimo et al., this volume) and<br />
seismic profiles. ZTEM is a variant of the electromagnetic<br />
(EM) airborne tipper AFMAG method<br />
(Ward 1959) for studying the electrical conductivity<br />
of bedrock in the depth range of 0–2 km. High<br />
resolution reflection seismic profiles in the Outokumpu<br />
area have been measured during the FIRE<br />
project (Kukkonen & Lahtinen 2006) and the HIRE<br />
project (Kukkonen et al. 2009). Seismic profiles<br />
have been interpreted by Saalmann & Laine (2014)<br />
and the results were used in the present study.<br />
3D modelling<br />
The 3D modelling was done at three different scales:<br />
1. Regional 3D model (study area A) was built for an<br />
interpretation of 3D ZTEM inversion results together<br />
with faults and shear zones (Saalmann &<br />
Laine 2014). In addition, the regional features<br />
were investigated using schistosities (S 0<br />
and S 1<br />
)<br />
digitized from the structural geological map of<br />
Koistinen (1981) and visualized by small discs<br />
in 3D (Mira Geoscience tools and Paradigm GO-<br />
CAD).<br />
2. 3D model of the Outokumpu assemblage (study<br />
area B) consisted of a fault block model and 3D<br />
visualization of the Outokumpu assemblage<br />
rocks together with ZTEM inversion results.<br />
3. Camp scale 3D models were built for Keretti<br />
and Sola areas. Keretti camp scale 3D model<br />
was built by using geological cross sections by<br />
Koistinen (1981) and Keretti ore model built by<br />
Esko Koistinen (Laine et al. 2012), and Saalmann<br />
& Laine (2014). The lithological contacts<br />
were drawn using implicit approach by Geomodeller<br />
software. The implicit representation<br />
was done by isosurfaces of a 3D scalar field<br />
(f(x,y,z)=constant) (e.g. Calcagno et al. 2008,<br />
Lajaunie et al. 1997). The Sola serpentinite was<br />
modelled using similar approach with Geomodeller<br />
software. Geostatistical simulation was<br />
used to analyze the distribution of rock types and<br />
geochemical contents in the Vuonos and Keretti<br />
areas using ISATIS software. In the Vuonos case,<br />
geostatistical analysis was based on the earlier<br />
3D geological model by Saalmann & Laine (2014).<br />
Geostatistical simulation methods<br />
Different kind of geostatistical simulations were<br />
applied for metal grades and rock types as categorical<br />
variables. In general, the main task of geostatistics<br />
is to predict unknown values between<br />
known values using a <strong>sp</strong>atial correlation model.<br />
Bedrock mineralogy and geochemistry are products<br />
of many interacting tectonic, physical and chemical<br />
processes. These processes are physically determined,<br />
but their interactions are so complex that<br />
the variation appears to be random. This complexity<br />
and incomplete understanding of the processes<br />
means that a deterministic or mathematical solution<br />
to quantify the variation is hardly possible.<br />
Accordingly, geostatistics applies a random model<br />
(Matheron 1965) for the estimation the unknown<br />
values Z(x) (called random function) constrained<br />
by known z(x) values using a <strong>sp</strong>atio-statistical<br />
variogram model.<br />
Geostatistics is based on a <strong>sp</strong>atial correlation<br />
model. If one single <strong>sp</strong>atial model is applied on an<br />
entire domain, an assumption is made that random<br />
function Z is a stationary, which means that<br />
the statistical properties are assumed to be similar<br />
on the entire domain. For the strict stationarity,<br />
the random function satisfies the invariance of the<br />
statistical distributions under an arbitrary translation<br />
of the points by a vector h. The milder form<br />
is the second order stationarity when the mean is<br />
constant on the entire domain and the covariance<br />
function only depends on the separation h. In geo-<br />
144
an assumption is made that random function Z is a stationary, which means that the statistical properties are <br />
invariance processes means of the statistical that a deterministic distributions or under mathematical an arbitrary solution translation to quantify of the the points variation by a is vector hardly h. possible. The milder <br />
assumed to be similar on the entire domain. For the strict stationarity, the random function satisfies the <br />
form Accordingly, is the second geostatistics order stationarity applies a random when the model mean (Matheron is constant 1965) the for the entire estimation domain and the unknown the covariance values <br />
invariance of the statistical distributions under arbitrary translation of the points by a vector h. The milder <br />
function Z(x) (called only random depends function) the constrained separation h. by In known geostatistics, z(x) values even using milder a <strong>sp</strong>atio-‐statistical hypothesis, so called variogram intrinsic model. <br />
form is the statistics, second order even stationarity milder hypothesis, when the so mean called intrinsic<br />
is assumed depends hypothesis so on that the is assumed separation for every so vector h. that In geostatistics, for h, the every increment vector<br />
even Z(x+h)-‐Z(x) milder under unbiasedness hypothesis, second so order condition. called stationary. intrinsic Geostatistical <br />
The sim-<br />
constant on variogram the entire model domain by and minimizing the covariance estimation error<br />
hypothesis function only <br />
Geostatistics is based on a <strong>sp</strong>atial correlation model. If one single <strong>sp</strong>atial model applied on an entire domain, <br />
h, the increment Z(x+h)-Z(x) is second order stationary.<br />
is assumed is made The so that variance that random for of every the function increment vector Z h, is the a is stationary, increment which Z(x+h)-‐Z(x) Delfiner means 1999) is that second are the based statistical order on stationary. the properties variogram The are model but<br />
ulations (e.g. Deutsch and Journel 1998, Chiles and<br />
variance hypothesis of the increment is an assumption <br />
(1) variance of (1) the VVVVVV increment ZZ xx + his <br />
values are estimated along the random path using<br />
assumed to be similar on the −entire ZZ(xx) domain. = 2γγ h For the strict stationarity, the random function satisfies the <br />
known and earlier estimated values. Geostatistical<br />
and (1) invariance γ (h) is of and called the VVVVVV γ (h) statistical the ZZ variogram called xx + h distributions the − ZZ(xx) function variogram = under 2γγ which function h can arbitrary be which approximated can translation simulations by of calculating the points reproduce the by a sample vector the original variogram: h. The data milder variability <br />
be approximated<br />
(2) γγ h = ! (zz by xx + calculating h − zz xx the sample vario- and given <strong>sp</strong>atial properties including <strong>sp</strong>atial correlation<br />
modeled by the sample variogram. Based<br />
form and γ is (h) the is called second the order variogram stationarity function when which the<br />
! )! mean can be is approximated constant on the by entire calculating domain the and sample the covariance variogram: <br />
gram:<br />
where function (2) N only is (2) number depends γγ h of = sample ! on the (zz xx separation pairs + h having − zz h. xx a In distance h (approximately) between each other. Theoretically the <br />
! )! geostatistics, even milder on summary hypothesis, statistics so called of several intrinsic realizations, <br />
the<br />
probability distributions of ore grades and rock<br />
sample hypothesis variogram is assumed is zero so for that a for zero every distance. vector However, h, the increment the sample Z(x+h)-‐Z(x) variogram is second is calculated order for stationary. distance The classes, <br />
where N is where number N of is sample number pairs of sample having pairs a distance having h (approximately) a distance<br />
the smallest increment h (approximately)<br />
types can between calculated each other. and visualized Theoretically in 3D. the <br />
so variance<br />
sample that variogram the of<br />
is zero distance <br />
for a class zero between<br />
distance. reflects the each<br />
However, nearby other.<br />
the variation Theoretically<br />
the sample variogram is zero for a zero The main emphasis of the present study was to use<br />
sample of variogram sample values. is calculated E<strong>sp</strong>ecially for distance in the case classes, of <br />
metal so<br />
(1)<br />
<br />
<br />
that grades, the distance. smallest this VVVVVV value, ZZHowever, distance xx + so h called − the class ZZ(xx) sample nugget reflects = 2γγ variogram effect, h the nearby is often is calculated<br />
for<br />
variation high. Usually, variogram of sample the modeling sample values. variogram E<strong>sp</strong>ecially in order to increases analyse the case <strong>sp</strong>atial with of distribution<br />
increasing metal grades, distance, this value, distance i.e. the so sample classes,<br />
called nugget values so that are the<br />
effect, getting smallest<br />
is often more distance<br />
class reflects the nearby variation of sample tions relative to 3D modeled faults and shear zones.<br />
high. and more Usually, dissimilar. of rock<br />
the sample The types value and<br />
variogram or geochemical the increases distance with h composi-<br />
and γ (h) is called the variogram function which can be approximated by calculating the sample variogram: at <br />
which increasing (2) the variogram distance, values. γγ h E<strong>sp</strong>ecially = i.e. values ! the (zz stop sample xx in + the increasing h values case − zz of xx are is metal called getting grades, the more range this and of more the sample dissimilar. variogram. The value The or maximum the distance value h of at <br />
! )! <br />
The simulated realizations were used to study<br />
the which sample<br />
value,<br />
the variogram so called<br />
values is called<br />
nugget<br />
stop sill. increasing <br />
effect,<br />
The sample<br />
is often<br />
is called variogram<br />
high. Usually,<br />
number the sample of sample variogram pairs having increases a distance with increasing h (approximately) statistical between simulation each other. several Theoretically different realizations the <br />
the range is modelled<br />
probable<br />
of the sample by using<br />
3D<br />
variogram. <br />
structural<br />
these three<br />
geological<br />
The parameters,<br />
features.<br />
maximum value nugget,<br />
By<br />
of geo-<br />
where N is range the sample and sill, distance, variogram as a simple i.e. is called the functions sample sill. The of values h. sample The are obtained variogram getting variogram more is modelled parameters by using are these used three in kriging parameters, interpolation, nugget, sample variogram zero for a zero distance. However, the sample can variogram be produced. is calculated The used for geostatistical distance classes, interpola-<br />
<br />
and more dissimilar. The value or the distance tion and simulation methods included:<br />
which range and is similar sill, as to a inverse simple functions distance interpolation. of h. The obtained Both methods variogram weight parameters the surrounding are used in known kriging values interpolation, order so that the h smallest at which distance the variogram class reflects values the stop nearby increasing variation 1) of Ordinary sample values. kriging E<strong>sp</strong>ecially (e.g. Chiles in the & Delfiner case of 1999)<br />
to which predict is similar is values called to for inverse the unmeasured range distance of the interpolation. locations. sample The variogram. Both formula methods The for these weight interpolators the surrounding is a known weighted values sum of order the metal grades, this value, so called nugget effect, is often high. Usually, is used the when sample the variogram mean is not increases known. with Ordinary<br />
<br />
known to predict data<br />
maximum values surrounding<br />
value<br />
for unmeasured the<br />
of<br />
unknown<br />
the sample locations. value<br />
variogram<br />
location: The formula is called kriging was applied to map the Co contents<br />
increasing distance, for these interpolators is a weighted sum of the sill. The i.e. sample the sample variogram values is are modelled getting by more using and more along dissimilar. the Outokumpu The value or assemblage. the distance h at <br />
(5) ZZ ∗ !<br />
known which the data variogram these surrounding three xx ! values = parameters, the !!! stop unknown λλ ! increasing ZZ(xx nugget, ! ) value is range location: called and the sill, range as a of the 2) Turning sample variogram. bands simulation The maximum (Mantoglou value of & Wilson<br />
1982), in which, at first, the data are kriged<br />
simple<br />
where<br />
(5) Z(x i ) is the ZZ ∗ functions of h. The obtained variogram parameters<br />
variogram known xx ! are is = called value, used !!! in sill. λλ λ ! ZZ(xx<br />
!<br />
the sample I kriging is The an ! ) sample unknown interpolation, variogram weight which for is modelled the measured and by using then value these conditional at the three ith location. parameters, simulations x 0 is nugget, the are created <br />
is similar to inverse distance interpolation. Both<br />
location range and<br />
where Z(x for sill,<br />
i ) is the as<br />
the predictive a simple known value, functions value and <br />
λ I is of<br />
an N is h.<br />
unknown the The number obtained<br />
weight of variogram known for the variable parameters using a set<br />
measured values. are of<br />
value In at inverse used randomly in<br />
the ith distance kriging distributed interpolation, bands,<br />
location. <br />
or<br />
methods weight the surrounding known values in lines. Turning bands simulations x 0 is the were done<br />
interpolation which is similar<br />
location for order the the to predictive to weight, inverse λdistance value I , values depend <br />
and for interpolation. on N is unmeasured the the distance Both<br />
number locations. between methods<br />
of known the weight<br />
variable unknown using the values. ISATIS-software and surrounding<br />
In known inverse values. known<br />
distance to In values simulate kriging, in<br />
<br />
the order Cu and Ni<br />
to predict The values formula unmeasured for these interpolators locations. The is a formula weighted for these content interpolators distributions a weighted in the sum central of the Vuonos <br />
interpolation sum the of weight, the known λ I , depend data surrounding on the distance the between unknown the unknown area. and known values. In kriging, the <br />
known data value surrounding location: the unknown value location: <br />
3) Sequential indicator simulation (Deutsch &<br />
Geological Survey of Finland, Special Paper 59<br />
3D modelling of Outokumpu assemblage rocks – a geostatistical approach<br />
(5) (5) ZZ ∗ !<br />
Journel 1998) was applied to rock types as categorical<br />
variables in the Vuonos area, and to Ni<br />
xx ! = !!! λλ ! ZZ(xx ! )<br />
where Z(x<br />
where Z(x i ) is the known i<br />
) is the known value, λ<br />
value, λ I is an unknown I<br />
is an unknown and Zn contents inside a small block bordered by<br />
weight for the measured value at the ith location. x 0 is the <br />
weight for the measured value at the ith location. faults and shearing within Vuonos area. Instead<br />
location for x 0<br />
the is the predictive location value for and the predictive N is the number value of and known N is variable of values. original In Ni- inverse and distance Zn-grades, the indicator<br />
the number of known variable values. In inverse transforms were used. The sequential indicator<br />
interpolation the weight, λ I , depend on the distance between the unknown and known values. In kriging, the <br />
distance interpolation the weight, λ I<br />
, depend on the simulation method was also used to visualize<br />
distance between the unknown and known values. quartz rock distribution in the Keretti area.<br />
In kriging, the weights λ I<br />
are solved based on the<br />
Unfolding methods<br />
Geostatistical methods are mainly using rectilinear<br />
coordinates and the Cartesian grid. However, geological<br />
formations are mostly at least gently folded.<br />
Different methods have been developed in order to<br />
be able to model <strong>sp</strong>atial properties parallel to the<br />
naturally folded surfaces:<br />
1) The unfolding can be done by a simple vertical<br />
translation of data (e.g. ISATIS), according to<br />
(or with) a flattened reference surface.<br />
2) In the unfolding based on the coordinate transformation,<br />
two of the coordinate axes are rotated<br />
locally to be parallel and the third one to<br />
145
Geological Survey of Finland, Special Paper 59<br />
Eevaliisa Laine<br />
be perpendicular to the reference surface. The<br />
coordinate transformation may be done using<br />
the reference surface in Paradigm GOCAD. Resulted<br />
grid, so called SGrid, is sophisticated in<br />
that the user can conform the SGrid to bounding<br />
surfaces and <strong>sp</strong>lit the SGrid along fault Surfaces.<br />
3) In the case of tectonically complicated terrains<br />
it would be ideal to use local orientations<br />
defined by a vector field. The problem<br />
is the lack of knowledge of subsurface orientations.<br />
In the present study, local orientations<br />
were derived from a piece of flat ore<br />
body using ISATIS software. In this way, the<br />
unfolding does not differ from the previous<br />
ones.<br />
It is obvious that in the case of Outokumpu<br />
area there is very little information about exact<br />
geometries of lithological contacts and shear zones.<br />
Hence, all the unfolding techniques described above<br />
are questionable and uncertain except for well-defined<br />
ore bodies. However, the geostatistical analysis<br />
can be used to validate the used geometries. If after<br />
unfolding process, the studied variable values show a<br />
clear <strong>sp</strong>atial correlation, the reference surfaces, such<br />
as lithological contacts or shear zones, corre<strong>sp</strong>ond<br />
probably the real subsurface structures. In the tectonically<br />
complicated areas, the best alternative could<br />
be to use local anisotropy orientations which may be<br />
obtained from the oriented drill cores. Even though<br />
almost all the rock properties follow the main layering,<br />
the shearing or intense faulting change the orientations<br />
to be oblique to the main orientation field.<br />
Moreover, very often partial melting may change the<br />
orientations of the rock units quite randomly in high<br />
grade terraines.<br />
Discontinuity structures<br />
Outokumpu assemblage is cut by several faults and<br />
shear zones. They were used to build a discontinuity<br />
model (or fault block model) based on the interpretation<br />
of faults and shear zones by Saalmann &<br />
Laine (2014). The discontinuity model could be used<br />
for geostatistical simulations and kriging to honour<br />
the the structural discontinuities. In the case<br />
of camp scale models, structurally different units<br />
were separated manually for geostatistical analysis.<br />
3D MODELS<br />
Regional 3D model<br />
The area for the regional 3D geological model is<br />
shown in the Figure 1. The large scale structures<br />
were modeled using tectonic observations in 3D<br />
and ZTEM 3D inversion.<br />
Planar structures (mostly S 1<br />
) were digitized from<br />
the geological map of Tapio Koistinen (Koistinen,<br />
1981) and visualized in 3D using discs using Mira<br />
Geoscience tools for Paradigm GOCAD software<br />
(Fig. 15a). The schistosities strike mainly from<br />
southwest to northeast. Dip directions have bipolar<br />
distribution with two modes about 125 and 280<br />
degrees from the north (Fig. 15b) i.e. to the southeast<br />
and northeast dipping planar structures. In<br />
the northwestern part of the Outokumpu area<br />
schistosities are mainly gently dipping (10–40 degrees).<br />
Ore bodies (Keretti, Vuonos and Kylylahti)<br />
are located in the narrow zone from southwest to<br />
northeast, along which there are also almost vertical<br />
schistosities. The area between this ore zone<br />
(O) and Sotkuma dome seem to be divided by possible<br />
shear zones (S) along which the schistosities<br />
are steeply dipping (Fig. 4). Sola serpentinite hosting<br />
minor Cu-mineralization is located in the wide<br />
zone where the schistosities are steeply dipping.<br />
Figure 5 shows resistivity values resulted by 3D<br />
inversion from the ZTEM measurements together<br />
with faults and shear zones (Saalmann & Laine<br />
2014). The high resistivity values (>3000 Ωm) are<br />
shown. SW dipping and S-N striking faults (S-N)<br />
could be continued as electrically conductive zones<br />
to probable faults of more than 20 km in length.<br />
The ore zone (O) is clearly visible and there seem<br />
to be several parallel high conductivity zones. The<br />
possible uplifted block interpreted by (Saalmann<br />
& Laine 2014) is electrically resistive. The regional<br />
fault/shear zones seem to be form a clear pattern<br />
by two orientations. Ore mineralizations locate<br />
along these electrically conductive zones.<br />
146
Geological Survey of Finland, Special Paper 59<br />
3D modelling of Outokumpu assemblage rocks – a geostatistical approach<br />
Fig. 4. a) Planar structures digitized from the geological map by Koistinen (1981) and visualized in 3D using Mira<br />
Geoscience and Paradigm GOCAD software. The ore zone (O) and a shear zone (S) from South to North are marked<br />
by arrows. Letter K is for the Keretti ore and letter V for the Vuonos ore. Black lines (m) mark the metamorphic<br />
zoning after Säntti et al. 2006. b) A histogram of the dip directions of the digitized planar structures on the map.<br />
147
Geological Survey of Finland, Special Paper 59<br />
Eevaliisa Laine<br />
Fig. 5. Electrical resistivity (values larger than 3000 Ωm) resulted from the regional ZTEM 3D inversion together<br />
with Outokumpu shear and fault structures after Saalmann & Laine (2014). Shear zones with a green color and<br />
faults with a light brown color. The black dashed lines are interpreted probable large fault/shear zones.<br />
148
Geological Survey of Finland, Special Paper 59<br />
3D modelling of Outokumpu assemblage rocks – a geostatistical approach<br />
Outokumpu assemblage in 3D<br />
Figure 6 shows the inversion done by ZTEM MT-<br />
3Dinv program with a grid with 72x61x74 cells<br />
(Kurimo et al., this volume). The cell size in the<br />
core area is 60x250x50 m. Six-frequency data<br />
(XIP, XQD, YIP, and YQD) were used in the 3D inversion<br />
topography and bird altitude effects considered.<br />
Electrical resistivity values less than<br />
3000 Ωm were filtered from the visualization.<br />
The electrically resistive rocks locate as elongated<br />
bodies to the northwest from the electrically<br />
conductive Outokumpu assemblage rocks<br />
hosting thin and elongated ore bodies. Seismic<br />
reflections probably representing the Outokumpu<br />
assemblage rocks (Saalmann & Laine 2014)<br />
are visible as green points at locations with high<br />
reflectivity (the amplitude > 2.0).<br />
The discontinuity models (Fig. 7) were used to<br />
constrain the kriging interpolation of the Co-content.<br />
Geochemical analyses were available mainly<br />
from the Vuonos area (Fig. 7a). Co, Cu, Ni and Zn<br />
contents have all skewed distributions. Because<br />
variogram modelling and kriging prerequisite normally<br />
distributed data, the normal score transformation<br />
was applied to Co, Cu, Ni and Zn contents.<br />
The resulted kriged section (Fig. 7b) shows the thin<br />
layer of Co-rich ore. Kriging was based on the exponential<br />
variogram with a nugget of 0.5, the sill<br />
of 0.47 and the range of 185 m (Fig. 7c). Very similar<br />
models were obtained for Cu and Zn contents.<br />
These results are in accordance with the ore model.<br />
In addition, structural features related to faulting<br />
and folding could be interpreted from this visualization<br />
(Fig. 7).<br />
The Vuonos drill cores were composited, so that<br />
every sample had an equal length of 1 m. In case<br />
of a change in rock type, the sample was colored<br />
red. The resulted visualization of the drill cores,<br />
shows that at least Vuonos and Keretti are located<br />
in heterogeneous parts of the Outokumpu assemblage<br />
(Fig. 8). Lithologies such as serpentinite,<br />
soap stone, calc-silicate rocks, quartz rocks and<br />
ore were coded separately. Mica shists, gneisses<br />
and felsic volcanites were grouped together as well<br />
as felsic intrusive rocks.<br />
Fig. 6. Outokumpu assemblage, Keretti ore and Vuonos ore in 3D. Electrical resistivity (values larger than<br />
3000 Ωm) resulted from the detail ZTEM 3D inversion along the Outokumpu assemblage with a red color and<br />
probable Outokumpu assemblage rocks along seismic sections with amplitudes greater than 2.0 (interpreted by<br />
Saalmann & Laine (2014)) with a green color. The direction of the elongation is marked by a dashed line.<br />
149
Geological Survey of Finland, Special Paper 59<br />
Eevaliisa Laine<br />
Fig. 7. a) Drill holes and Co contents along the drill holes in the Keretti and Vuonos areas. b) Kriged Co contents.<br />
c) The sample variogram (dashed line) and the corre<strong>sp</strong>onding variogram model (solid line) for normal score<br />
transformed Co contents.<br />
150
Geological Survey of Finland, Special Paper 59<br />
3D modelling of Outokumpu assemblage rocks – a geostatistical approach<br />
Fig. 8. Lithological contacts from the drill core data marked with a red color within the Outokumpu assemblage.<br />
Violet marks the black schist (Laine et al. 2012) and grey fault surfaces (Saalmann & Laine 2014).<br />
Keretti<br />
Keretti and Vuonos ore bodies were surrounded by<br />
Outokumpu assemblage rocks (Fig. 9). The Keretti<br />
3D geological model shows how the Keretti ore was<br />
located on the southeast dipping shear zone (Fig.<br />
10). In addition, it was cut by faults vertically and<br />
horizontally (Saalmann & Laine 2014). The ore was<br />
enclosed inside the Outokumpu assemblage which,<br />
in turn, is inside the black schist envelope. In detail,<br />
mine sections (e.g. Fig. 10) show that the thin<br />
ore was mainly associated thin layers of country<br />
rocks, such as calc-silicate rocks, quartz rocks and<br />
serpentinites. Contacts were sharp between the<br />
country rock and the Keretti ore, so the ore body<br />
could be quite uniquely modeled from the mine<br />
sections.<br />
Geostatistical simulation was tested on the<br />
distribution of altered rocks such as quartz rocks<br />
around the middle part of the Keretti ore body.<br />
Quartz rock has a density below 2600 kg/m 3 and<br />
it forms a clear density contrast to the dense<br />
calc-silicate rocks containing pyroxenes (densities<br />
about 2800 kg/m 3 ). Rock type data from drill<br />
cores were composited to samples of a length of<br />
1 m and integer-coded for geostatistical analysis.<br />
In the present study, the rock type variable was<br />
transformed to an indicator variable for each rock<br />
Fig. 9. Geological map and sections of the surroundings of the Keretti/Outokumpu and Vuonos ore mineralisations<br />
after Gáal et al. (1975).<br />
151
Geological Survey of Finland, Special Paper 59<br />
Eevaliisa Laine<br />
type. For example, indicator variable for quartz<br />
rock gets a value of 1 if quartz rock is present and<br />
0 else. Local orientations were derived from the<br />
geometry of the flat ore body (Fig. 12e) and copied<br />
to the voxet cells of a size of 5x5x5 m 3 above and<br />
below the flat ore body. The sample variogram of<br />
the indicator transformation for quartz rocks was<br />
modelled with an exponential model (a nugget of<br />
0.07, a range of 50–130 meters and a sill of 0.12)<br />
(Figs. 12a and 12b). The corre<strong>sp</strong>onding 2D simulation<br />
was used to visualize the variogram model<br />
(Fig. 12d). Search ellipsoids were oriented parallel<br />
to local orientations derived from the flat orebody.<br />
Summary statistics of 100 sequential indicator<br />
simulations was used to visualize the probable<br />
<strong>sp</strong>atial distribution of quartz rocks below and above<br />
Fig. 10. Keretti/Outokumpu mine section 48 from GTK database.<br />
Fig. 11. Keretti 3D model. The lithological contact between black schist and mica gneisses have been colored with<br />
a violet color and between black schist and Outokumpu assemblage with a dark green color. The shear zone is<br />
colored using light green and Keretti ore using red.<br />
152
Geological Survey of Finland, Special Paper 59<br />
3D modelling of Outokumpu assemblage rocks – a geostatistical approach<br />
Keretti orebody (Fig. 12e). The results indicate that<br />
quartz rocks might not occur as continuous, but<br />
rather as successive slightly elongated inclusions<br />
parallel to the main elongation of the ore body.<br />
The geological section drawn by Koistinen (1981)<br />
(Fig. 12c) shows the similar distribution of quartz<br />
rocks but with a geological interpretation based<br />
on the structural geological analysis and drill core<br />
logs.<br />
Fig. 12. The directed sample variogram and the corre<strong>sp</strong>onding model for the quartz rock as a categorical variable<br />
in the Keretti area a) 41 gegrees and b) 131 degrees from the North; c) Geological Keretti cross section by Tapio<br />
Koistinen (1981); d) the 2D simulation based on the variogram model; e) A small part of the Keretti ore body in<br />
red and simulated 3D grid of the probability that quartz rock prevails at a certain certain location, grid cells with<br />
the probability of greater than o.45 are colored with a yellow color.<br />
153
Geological Survey of Finland, Special Paper 59<br />
Eevaliisa Laine<br />
Vuonos<br />
The Vuonos Cu-orebody has been earlier modeled<br />
during the project “3D/4D modeling – Outokumpu<br />
area as a case study” (Laine et al. 2012) by using<br />
Paradigm GOCAD software and mine sections (Fig.<br />
13). As in Keretti, also in Vuonos the ore body was<br />
located on the shear zone (Fig. 13b). In Vuonos,<br />
there is a clear difference between rocks below and<br />
above the shear zone. The rock unit above the shear<br />
zone was called the serpentinite zone and below it<br />
the transition zone according to Saalmann & Laine<br />
(2014). Geostatistical variogram modeling and turning<br />
band simulation were used to study the differences<br />
between structures in these two rock units.<br />
Gently folded Vuonos structures (Fig. 14) were<br />
used to transfer the drill core data parallel to flattened<br />
reference surface, in this case the boundary<br />
between the transition and serpentinite zones.<br />
The new simulation grid of a cell size of 5x5x5 m 3<br />
was created for the unfolded drill core data parallel<br />
to flattened reference surface. The same<br />
boundary was used to divide the data and the simulation<br />
grid for the geostatistical analysis (Fig.<br />
14). In the Vuonos case the used indicator variable<br />
represents the presence of the calc-silicate rock<br />
or serpentinite.<br />
According to the sample variograms and the<br />
corre<strong>sp</strong>onding models for the calc-silicate rock as<br />
a categorical variable (Fig. 15) there are structural<br />
differences between the transition and serpentinite<br />
zones. In the transition zone the variogram<br />
range was 105 m in the direction of 41 degrees from<br />
north, 60 m in the perpendicular direction and only<br />
40 m in the vertical direction. In the serpentinite<br />
zone the variogram ranges were almost the same<br />
(about 40 m) in all directions. However the variograms<br />
have high nugget effects implying that the<br />
calc-silicate rocks are nearly randomly distributed<br />
in <strong>sp</strong>ace. This is visualized by the 2D unconditional<br />
simulation.<br />
Fig. 13. a) Vuonos mine sections (GTK database) in 3D; b) Vuonos Cu-ore body (red) and serpentinites (green) and<br />
black schists (violet) after (Saalmann & Laine 2014).<br />
154
Geological Survey of Finland, Special Paper 59<br />
3D modelling of Outokumpu assemblage rocks – a geostatistical approach<br />
Fig. 14. The blue surface is a boundary between the paragneisses and Outokumpu assemblage rocks. The green<br />
surface is the boundary between serpentinite ans transition zones. The 3D simulation grid was divided and<br />
bounded using these surfaces.<br />
The <strong>sp</strong>atial correlation of the indicator variables for<br />
the presence of serpentinites was tested using the<br />
same unfolded data set. In the serpentinite zone the<br />
sample variogram for the presence of serpentinite<br />
was modeled with a nugget of 0.03 and a <strong>sp</strong>herical<br />
model having a range of 100 m in all directions, and<br />
a sill of 0.16 (Fig. 16a). Figure 16b shows the corre<strong>sp</strong>onding<br />
2D simulation. In the transition zone<br />
the sample variograms for the presence of the<br />
serpentinite was modelled by a nugget 0.02 and a<br />
<strong>sp</strong>herical model having, a range of 160 m parallel<br />
to the Vuonos deposit and 80 m perpendicularly to<br />
this direction, a sill of 0.07 parallel to the Vuonos<br />
deposit and 0.15 perpendicularly to this direction<br />
(Fig. 16 c). Figure 16d shows the corre<strong>sp</strong>onding 2D<br />
simulation. The result of 100 sequential indicator<br />
simulations were performed and the simulation<br />
grid was folded back to the original geometry<br />
(Fig. 17). These results are in accordance with the<br />
general idea of the roundish geometry of the serpentinite<br />
bodies along the Outokumpu assemblage.<br />
In addition to structural differences, the serpentinite<br />
and transition zones differ geochemically.<br />
The turning bands simulation was tested for Cu and<br />
Ni contents in the Vuonos area (Fig. 18). Structural<br />
differences are appearant in both cases. Based on<br />
the variogram model and 100 simulations, the elevated<br />
Cu contents (greater than 0.5%) are more<br />
probable within the thin layers in the transition<br />
zone. Based on the variogram modelling and 100<br />
simulations the Ni contents greater than 0.1%<br />
seem to occur in elongated zones in the transition<br />
zone. Cu and Ni contents show only weak <strong>sp</strong>atial<br />
correlation in the serpentinite zone. In the small<br />
block in the Vuonos area, bordered by faults and<br />
shearing (Fig. 19), the sequential indicator simulation<br />
was applied to indicator variables for Ni greater<br />
than 0.03% and Zn greater than 0.01%. In this<br />
case the sequential indicator simulation was done<br />
into a SGrid built using the boundary between the<br />
serpentinite and the transition zone using Paradigm<br />
GOCAD. The results show a clear enrichment<br />
of the nickel in the serpentinite zone (Fig. 19a) and<br />
of the zinc in the transition zone (Fig. 19b).<br />
155
Geological Survey of Finland, Special Paper 59<br />
Eevaliisa Laine<br />
Fig. 15. a) Directed variograms and corre<strong>sp</strong>onding variogram models for the calc-silicate rock as a categorical<br />
variable in the serpentinite zone, 41 degrees and 131 degrees from the North, and b) the unconditional simulation<br />
based on this variogram model; c) Directed variograms and corre<strong>sp</strong>onding variogram models for the calc-silicate<br />
rock as a categorical variable in the transition zone, 41 degrees and 131 degrees from the North, and d) the unconditional<br />
simulation based on this variogram model.<br />
156
Geological Survey of Finland, Special Paper 59<br />
3D modelling of Outokumpu assemblage rocks – a geostatistical approach<br />
Fig. 16. a) Directed variograms and corre<strong>sp</strong>onding variogram models for the serpentinite as a categorical variable<br />
in the serpentinite zone, 41 degrees and 131 degrees from the North, and b) the unconditional simulation based<br />
on this variogram model; c) directed variograms and corre<strong>sp</strong>onding variogram models for the serpentinite as a<br />
categorical variable in the transition zone, 41 degrees and 131 degrees from the North, and d) the unconditional<br />
simulation based on this variogram model.<br />
157
Geological Survey of Finland, Special Paper 59<br />
Eevaliisa Laine<br />
Fig. 17. Sequential indicator simulation of the serpentinite as a categorical variable. Simulation grid cells with<br />
the probability values greater than 0.1 are shown.<br />
A<br />
B<br />
Fig. 18. Turning bands simulation of a) Cu contents in the transition zone, the probability that Cu content is<br />
greater than 0.5 %, simulation grid cells with values greater than 0.1 are shown; b) Ni contents in the transition<br />
zone, the probability that Ni content is greater than 0.1 %, simulation grid cells with values greater than 0.1 are<br />
shown.<br />
158
Geological Survey of Finland, Special Paper 59<br />
3D modelling of Outokumpu assemblage rocks – a geostatistical approach<br />
Fig. 19. Indicator sequential simulation, Sgrid cells are black when a) the Ni content is larger than 0.01 %;<br />
b) the Zn content is larger than 0.03 %.<br />
Sola<br />
At Sola area (Fig. 2) the Outokumpu assemblage<br />
rocks occur as a roundish body slightly elongated in<br />
the SW-NE direction. The 3D model of Sola serpentinite<br />
was built using geological cross sections and<br />
drill core data. The implicit approach (e.g. Lajaunie<br />
et al. 1997) was applied using Geomodeller software<br />
(Fig. 20a). Fig. 20a shows 3D geological model<br />
of Sola serpentinite on the old map (GTK database)<br />
of the Sola area between two to the west dipping<br />
large faults (Saalmann & Laine 2014). The old map<br />
by an unknown author (GTK database) (Fig. 18b)<br />
shows an interesting fault interpretations which<br />
are mostly in an agreement with the faults interpreted<br />
from the seismic sections by Saalmann &<br />
Laine (2014). In addition, the interpreted fault zone<br />
is parallel with the ore zone (O) and the large structures<br />
(S) interpreted from the visualization of the<br />
planar structures by Koistinen (1981) and the ZTEM<br />
inversion results (Figs. 15a and 16).<br />
159
Geological Survey of Finland, Special Paper 59<br />
Eevaliisa Laine<br />
A<br />
B<br />
Fig. 20. a) Sola 3D model built using GeoModeller with the geological map of the Polvijärvi map sheet and three<br />
west dipping faults Saalmann & Laine (2014). b) Polvijärvi map sheet 4224 02 (GTK database).<br />
160
Geological Survey of Finland, Special Paper 59<br />
3D modelling of Outokumpu assemblage rocks – a geostatistical approach<br />
CONCLUSIONS<br />
In the regional scale, large fault/shear zones could<br />
be interpreted from the subsurface electrical resistivity<br />
distribution obtained by 3D inversion of<br />
ZTEM data. The regional fault/shear zones seem to<br />
form a clear pattern by two orientations striking to<br />
the north and to the northwest. The similar structures<br />
could be interpreted by visualizing the planar<br />
structures (schistosities) in 3D. All the known ore<br />
mineralizations are located along these ore potential<br />
structures characterized by higher electric conductivity<br />
and near vertical planar structures (schistosities).<br />
ZTEM inversion results along the Outokumpu<br />
assemblage show an elongation of electrically resistive<br />
rocks parallel to the Outokumpu assemblage.<br />
The kriged Co contents along the Outokumpu<br />
assemblage show discontinuities and gentle<br />
folding. Similar elongation could be modeled using<br />
geostatistical simulation. The structures surrounding<br />
the Keretti and Vuonos ore body show a<br />
clear elongation along the ore zone (O). In addition,<br />
using geostatistical simulation methods, it<br />
was found structural and geochemical differences<br />
between different fault blocks e<strong>sp</strong>ecially in the<br />
Vuonos area. Moreover, geostatistical modelling<br />
results indicate elongated and planar structures<br />
below the Vuonos ore associated with shearing.<br />
This is in line with the ore body geometries and<br />
earlier interpretations. Geostatistical simulations<br />
reproduced geometries characteristic for different<br />
rock types within the Outokumpu assemblage.<br />
These alternative realizations may be useful in the<br />
future, e<strong>sp</strong>ecially in the numerical modelling.<br />
Keretti, Vuonos and Sola mineralizations are<br />
mainly associated with sheared zones, which was<br />
demonstrated by 3D geological models. The ore<br />
bodies are thin and surrounded by altered and<br />
sheared rocks, hence the stochastic methods such<br />
as geostatistical kriging and simulation may be an<br />
alternative to explore this kind of ore bodies in the<br />
Outokumpu area. Because the drill cores are mostly<br />
about 300 m deep and the thickness of Outokumpu<br />
assemblage is in many places over 500 meters,<br />
there might be several undiscovered ore bodies at<br />
greater depths. Furthermore, the understanding of<br />
fault di<strong>sp</strong>lacements could aid the ore exploration<br />
and also interpretation of ductile structures across<br />
the discontinuities.<br />
REFERENCES<br />
Allard, D. 1994. Simulating a geological lithofacies with<br />
re<strong>sp</strong>ect to connectivity information using the truncated<br />
Gaussian model. In: Armstrong, M. & Dowd, P. A.<br />
(eds) Geostatistical simulations. Kluwer, Dordrecht,<br />
Netherlands, 197−211.<br />
Armstrong, M., Galli, A., Beucher, H., Loc’h, G., Renard,<br />
D., Doligez, B., Eschard, R. & Geffroy, F. 2011. Plurigaussian<br />
Simulations in Geosciences. Berlin: Springer.<br />
115 p.<br />
Bowes, D. R., Halden, N. M., Koistinen, T. J. & Park, A. F.<br />
1984. Structural features of basement and cover rocks<br />
in the eastern Svecokarelides, Finland. Stuttgart: E.<br />
Schweizerbart’sche Verlagsbuchhandl. (Naegele u.<br />
Obermiller)<br />
Calcagno, P, Chilès J. P., Courriouxa, G. & Guillen, A.<br />
2008. Geological modelling from field data and geological<br />
knowledge Part I. Modelling method coupling<br />
3D potential-field interpolation and geological rules.<br />
Physics of the Earth and Planetary Interiors 171, 147–<br />
157.<br />
Chiles, J. P. & Delfiner, P. 1999. Geostatistics, Modelling<br />
Spatial Uncertainty. Wiley-Interscience.<br />
Deutsch, C. V. & Journel, A. G. 1998. GSLIB: Geostatistical<br />
Software Library and User’s Guide. Second Edition.<br />
Oxford University Press. 369 p.<br />
Dilek, Y. & Furnes, H. 2011. Ophiolite genesis and global<br />
tectonics; geochemical and tectonic fingerprinting<br />
of ancient oceanic litho<strong>sp</strong>here. Geological Society of<br />
America Bulletin 123, 387−411.<br />
Frosterus, B. & Wilkman, W. W. 1920. Suomen geologinen<br />
yleiskartta: vuorilajikartan selitys: Lehti D 3 Joensuu.<br />
Helsinki: Geologinen toimisto.<br />
Gáal, G., Koistinen, T. & Mattila, E. 1975. Tectonics and<br />
stratigraphy of the vicinity of Outokumpu, North<br />
Karelia, Finland: including a structural analysis of the<br />
Outokumpu ore deposit. Geological Survey of Finland,<br />
Bulletin Geological Survey of Finland 271. 67 p.<br />
Gómez-Hernández, J. J. & Journel, A. G. 1993. Joint sequential<br />
simulation of multi-Gaussian fields. In: Geostatistics.<br />
Netherlands: Kluwer Academic Publishers<br />
Dordrect.<br />
Huhma, A. & Huhma, M. 1970. Contribution to the geology<br />
and geochemistry of the Outokumpu region. Bulletin<br />
of the Geological Society of Finland 42, 57−88.<br />
Journel, A. G. & Alabert, F. G. 1990. New method for reservoir<br />
mapping. JPT Journal of Petroleum Technology<br />
42, 212−218.<br />
Journel, A. G. & Gómez-Hernández, J. J. 1993. Stochastic<br />
imaging of the Wilmington clastic sequence. SPE Formation<br />
Evaluation 8, 33−40.<br />
Kohonen, J., Luukkonen, E. & SorjonenWard, P. G. 1991.<br />
Nunnanlahti and Holinmaki shear zones in North<br />
Karelia; evidence for major early Proterozoic ductile<br />
deformation of Archaean basement and further discussion<br />
of regional kinematic evolution. In: Autio, S.<br />
(ed.) Geological Survey of Finland, Current research<br />
1989-1990. Geological Survey of Finland, Special<br />
Paper 12, 11−16.<br />
Koistinen, T. J. 1981. Structural evolution of an early Proterozoic<br />
stratabound Cu-Co-Zn deposit, Outokumpu,<br />
161
Geological Survey of Finland, Special Paper 59<br />
Eevaliisa Laine<br />
Finland. Transactions of the Royal Society of Edinburgh:<br />
Earth Sciences 72 (2), 115−158.<br />
Kontinen, A. 1987. An early Proterozoic ophiolite − the<br />
Jormua mafic-ultramafic complex, northeastern<br />
Finland. Precambrian Res. 35, 313−341.<br />
Kukkonen, I. 2009. Reflection seismics in exploration.<br />
In: 7th Fennoscandian Exploration and Mining, 1−3<br />
December 2009, Rovaniemi, Finland: final programme<br />
and abstracts, p. 47.<br />
Kukkonen, I. & Lahtinen, R. 2006. Finnish Reflection<br />
Experiment FIRE 2001–2005. In: Kukkonen,<br />
I. T. & Lahtinen, R. (eds) Finnish Reflection Experiment<br />
FIRE 2001-2005. Geological Survey of Finland,<br />
Special Paper 43, 77−103.<br />
Kurimo, M., Lahti, I. & Nousiainen, M. 2016. ZTEM survey<br />
in the Outokumpu region. In: Aatos, S. (ed.) Developing<br />
Mining Camp Exploration Concepts and<br />
Technologies – Brownfield Exploration Project 2013–<br />
2016. Geological Survey of Finland, Special Paper 59.<br />
(this volume)<br />
Laine, E. (ed.) 2012. 3D modeling of polydeformed and<br />
metamorphosed rocks: the old Outokumpu Cu-Co-Zn<br />
mine area as a case study. Geological Survey of Finland,<br />
Report of Investigation 195. 77 p. (electronic<br />
publication)<br />
Lajaunie, C., Courrioux, G. & Manuel, L. 1997. Foliation<br />
fields and 3D cartography in geology; principles of a<br />
method based on potential interpolation. Mathematical<br />
Geology 29, 571–584.<br />
Mantoglou, A. & Wilson, J. L. 1982. The turning bands<br />
method for simulation of random fields using line<br />
generation by a <strong>sp</strong>ectral method. Water Resources Research<br />
18 (5), 1379−1394.<br />
Matheron, G. 1965. Le variables régionalisées et leur estimation.<br />
Paris: Editions Technip.<br />
Peltonen, P. & Kontinen, A. 2004. The Jormua Ophiolite;<br />
a mafic-ultramafic complex from an ancient oceancontinent<br />
transition zone. Developments in Precambrian<br />
Geology 13, 35−71.<br />
Peltonen, P., Kontinen, A., Huhma, H. & Kuronen, U.<br />
2008. Outokumpu revisited; new mineral deposit<br />
model for the mantle peridotite-associated Cu-Co-<br />
Zn-Ni-Ag-Au sulphide deposits. Ore Geology Reviews<br />
33, 559−617.<br />
Saalmann, K. & Laine, E. L. 2014. Structure of the Outokumpu<br />
ore district and ophiolite-hosted Cu-Co-Zn-<br />
Ni-Ag-Au sulfide deposits revealed from 3D modeling<br />
and 2D high-resolution seismic reflection data. Ore<br />
Geology Reviews 62, 156−180.<br />
Säntti, J., Kontinen, A., Sorjonen-Ward, P., Johanson,<br />
B. & Pakkanen, L. 2006. Metamorphism and Chromite<br />
in Serpentinized and Carbonate-Silica-Altered<br />
Peridotites of the Paleoproterozoic Outokumpu-Jormua<br />
Ophiolite Belt, eastern Finland. International<br />
Geology Review, 48:6, 494−546.<br />
Schetselaar, E. M. 2013. Mapping the 3D lithofacies<br />
architecture of a VMS ore system on a curvilinearfaulted<br />
grid; a case study from the Flin Flon mining<br />
camp, Canada. Ore Geology Reviews 53, 261−275.<br />
Scott, D. J., Helmstaedt, H. & Bickle, M. J. 1992. Purtuniq<br />
Ophiolite, Cape Smith Belt, northern Quebec, Canada;<br />
a reconstructed section of early Proterozoic oceanic<br />
crust. Geology Boulder 20, 173-176.<br />
Strebelle, S. 2002. Conditional simulation of complex<br />
geological structures using multiple-point statistics.<br />
Mathematical Geology 34, 1−21.<br />
Trüstedt, O. 1921. Över geologin inom Outokumpu omrädet,<br />
diskussion. Medd. Geol. Fören. Helsingfors<br />
1919−1920, p. 16.<br />
Väyrynen, H. 1939. On the geology and tectonics of the<br />
Outokumpu ore field and region. Bulletin de la Commission<br />
géologique de Finlande 124. 91 p.<br />
Vuollo, J. & Piirainen, T. A. 1989. Mineralogical evidence<br />
for an ophiolite from the Outokumpu serpentinites<br />
in North Karelia, Finland. Bulletin of the Geological<br />
Society of Finland 61 (1), 95−112.<br />
Ward, P. 1987. Early Proterozoic deposition and deformation<br />
at the Karelian craton margin in southeastern<br />
Finland. Precambrian Research 35, 71−93.<br />
Ward, S. H. 1959. AFMAG; airborne and ground. Geophysics<br />
24 (4), 761−789.<br />
Wegmann, C. E. 1928. Über die Tektonik der jüngeren<br />
Faltung in Ostfinnland. Fennia 50, 1–22.<br />
162
Developing Mining Camp Exploration Concepts and Technologies – Brownfield Exploration Project 2013–2016<br />
Edited by Soile Aatos<br />
Geological Survey of Finland, Special Paper 59, 163–188, 2016<br />
SUKKULANSALO NATIONAL TEST LINE IN OUTOKUMPU:<br />
A GROUND REFERENCE FOR DEEP EXPLORATION METHODS<br />
by<br />
Suvi Heinonen 1) , Asko Kontinen 2) , Hanna Leväniemi 1) , Ilkka Lahti 3) , Niina Junno 4) ,<br />
Maija Kurimo 3) and Emilia Koivisto 5)<br />
Heinonen, S., Kontinen, A., Leväniemi, H., Lahti, I., Junno, N.,<br />
Kurimo, M. & Koivisto, E. 2016. Sukkulansalo National Test Line in Outokumpu:<br />
A ground reference for deep exploration methods. Geological Survey<br />
of Finland, Special Paper 59, 163−188, 16 figures and 1 table.<br />
The Sukkulansalo National Test Line (SNTL) is located in the historical mining<br />
district of Outokumpu, Finland. The purpose of the SNTL is to establish<br />
a well-known test site for exploration in order to facilitate the development<br />
and testing of new deep exploration methods, including not only new<br />
measurement technologies but also methods for data integration and common<br />
earth modelling. The data set from the SNTL includes high-resolution<br />
seismic reflection profile V7, acquired as part of the HIRE project, providing<br />
an image of subsurface reflectivity down to the depth of 10 km. Due to the<br />
lack of deep drill holes along the SNTL, the seismic reflection profile forms<br />
the basis for geological interpretation in addition to a few outcrop observations<br />
and aero-geophysical maps.<br />
The high-resolution seismic reflection data are complemented by deeppenetrating<br />
audio-magnetotelluric measurements. Furthermore, airborne<br />
ZTEM (Z-axis tipper electromagnetic) data inversions solving the conductivity<br />
structure of the subsurface down to 2 km depth have been acquired<br />
in the Outokumpu area, and here we integrate the results of these deeppenetrating<br />
methods. Additionally, forward modelling of the gravity data<br />
provides information on the subsurface density distribution underneath<br />
the SNTL. We present a tentative geological cross-section of the SNTL that<br />
is based on the integrated interpretation of the deep-penetrating geophysical<br />
data. In the future, this cross-section and geophysical data of the SNTL<br />
could be used as a basis for testing new geophysical methods.<br />
Keywords: deep exploration, geophysical data, seismic reflection, ZTEM,<br />
AMT, gravity, integrated interpretation, Outokumpu, Miihkali, Eastern<br />
Finland, Finland<br />
1)<br />
Geological Survey of Finland, P.O. Box 96, FI-02151 E<strong>sp</strong>oo, Finland<br />
2)<br />
Geological Survey of Finland, P.O. Box 1237, FI-70211 Kuopio, Finland<br />
3)<br />
Geological Survey of Finland, P.O. Box 77, FI-96101 Rovaniemi, Finland<br />
4)<br />
University of Helsinki, Department of Geosciences and Geography, Institute of<br />
Seismology, P.O. Box 68, FI-00014 University of Helsinki, Finland<br />
5)<br />
University of Helsinki, Department of Geosciences and Geography, Division of<br />
Geology and Geochemistry, P.O. Box 64, FI-00014 University of Helsinki, Finland<br />
E-mail: suvi.heinonen@gtk.fi<br />
163
Geological Survey of Finland, Special Paper 59<br />
Suvi Heinonen, Asko Kontinen, Hanna Leväniemi, Ilkka Lahti, Niina Junno, Maija Kurimo and Emilia Koivisto<br />
INTRODUCTION<br />
In recent years, finding new ore deposits has become<br />
a major challenge almost all around the<br />
world because easy-to-find outcropping ore deposits<br />
have already been found during the decades<br />
of exploration. However, Fennoscandia has<br />
substantial ore potential e<strong>sp</strong>ecially in the deep<br />
subsurface. In the vicinity of mining camps, in<br />
so called brownfield environments, easy-to-find<br />
shallowly buried deposits have typically already<br />
been discovered but the continuation of mining<br />
urgently requires new resources. Consequently,<br />
exploration is increasingly turning towards<br />
deeply seated mineral deposits. With increasing<br />
exploration depth, the resolution of the conventional<br />
geophysical methods is decreasing and new<br />
efficient methods are needed to aid the detection<br />
of mineralization at depth in the vicinity of<br />
the known ore deposits in order to continue the<br />
mining activities and utilization of existing infrastructure.<br />
High resolution methods are e<strong>sp</strong>ecially<br />
needed to guide expensive deep drilling. The development<br />
of deep exploration methods benefits<br />
from geologically and geophysically well-known<br />
test sites where methods can be tested and new<br />
data compared with existing information about<br />
the area. Choosing and providing publicly available<br />
background information for a possible test<br />
line was among the objectives of the Developing<br />
Mining Camp Exploration Concepts and Technologies<br />
– Brownfield Exploration project led by<br />
the Geological Survey of Finland, and is hereafter<br />
referred to as the Sukkulansalo National Test<br />
Line (SNTL). This article provides data from multi-parameter<br />
geophysical surveys together with a<br />
geological cross-section that has been reconciled<br />
with all the available geophysical data.<br />
The SNTL is located within the Outokumpu<br />
area, which is one of the historically most important<br />
mining districts in Finland. This article presents<br />
the data currently available for the SNTL as<br />
Fig. 1. Location of the Sukkulansalo National Test Line (SNTL) in Outokumpu, shown in purple. The line is located<br />
in a rural area extending from Lake Viinijärvi to Ontreinpuoli in the north. Close to the southern extent of the<br />
profile lies the Perttilahti deposit. The SNTL is parallel to the Sukkulansalo road, which provides easy access to<br />
the profile. Contains data from the National Land Survey of Finland Topographic Database 01/2016.<br />
164
Geological Survey of Finland, Special Paper 59<br />
Sukkulansalo National Test Line in Outokumpu: A ground reference for deep exploration methods<br />
well as a geological interpretation along the profile.<br />
Most important objective of the article is to<br />
support future development of deep exploration<br />
methods. It must be noted that understanding of<br />
the subsurface physical rock properties and geology<br />
are expected to improve with time and as new<br />
data and interpretations will be accumulated in<br />
the future projects. The Outokumpu area still has<br />
a large potential for as yet undiscovered mineral<br />
deposits (Rasilainen et al. 2014), and the results<br />
of this and future studies will thus undoubtedly<br />
have practical importance and application for<br />
exploration.<br />
The surface track of the SNTL is presented in a<br />
map in Figure 1. The line is ca. 25 km long, beginning<br />
from the Archaean bedrock in Ontreinpuoli<br />
and continuing southeast to the Murtoniemi area.<br />
The line crosses the margin of the Outokumpu allochthon,<br />
just east of the Outokumpu-Vuonos-<br />
Perttilahti zone, which consists Outokumpu-type<br />
rocks and massive sulphide deposits. Geological<br />
background of the SNTL area is described in the<br />
following chapters. The line was selected mainly<br />
on the basis of an high-resolution seismic reflection<br />
profile (HIRE V7; Kukkonen et al. 2012) providing<br />
optimal image of the subsurface regional<br />
structures. Profile is crossing all relevant geological<br />
units of the Outokumpu district and can thus<br />
improve the understanding of the setting of the ore<br />
deposit in the entire mining district on a regional<br />
scale. It is noteworthy that geoscientific data are<br />
typically not acquired exactly at the SNTL but in<br />
its close vicinity for practical reasons such as the<br />
existence of roads, suitable locations for measurement<br />
field stations or rock outcrops. Furthermore,<br />
not all data are available along the full profile, but<br />
from parts of it.<br />
As already mentioned, the good quality of the<br />
seismic reflection profile HIRE V7 acquired in 2008<br />
supported the selection of the Sukkulansalo test<br />
line. ZTEM data were acquired during this project,<br />
and complement well the HIRE V7, as the two sets<br />
of data were collected along almost parallel measurement<br />
lines. In 2012, GTK also acquired audiomagnetotelluric<br />
(AMT) data along the profile. The<br />
depth penetration of the seismic reflection surveys,<br />
AMT and ZTEM is much better than for conventional<br />
geophysical methods used in mineral<br />
exploration, and this particular location was thus<br />
chosen as a deep exploration baseline instead of<br />
some other site in Outokumpu with more abundant<br />
data collected from rock outcrops or using<br />
conventional geophysical methods.<br />
One of the aims of the SNTL is to provide, with<br />
time, a location that has been geophysically and<br />
geologically studied in a thorough and diverse way,<br />
where different and e<strong>sp</strong>ecially new methods can be<br />
effectively tested and compared with existing data,<br />
and important new knowledge can be accumulated<br />
and shared. We believe that future deep exploration<br />
efforts in the Outokumpu area would be best<br />
supported if new data collected along the SNTL<br />
was always made publicly available. Data already<br />
collected along this profile are available upon request<br />
from Geological Survey of Finland and its use<br />
is strongly encouraged, for example, in teaching<br />
deep exploration and data integration methods at<br />
universities.<br />
GEOLOGICAL BACKGROUND<br />
The Sukkulansalo National Test Line is located on<br />
the western margin of the Outokumpu nappe complex<br />
in the Outokumpu area. Published geological<br />
information along the SNTL include geological map<br />
compilations by Huhma (1976), Gaal et al. (1975)<br />
and Koistinen (1981). The test-line area is poorly<br />
exposed and has a nearly flat topographic relief,<br />
restricting opportunities for field-based structural<br />
geological analysis. The maps by Huhma (1971a,b,c)<br />
and Gaal et al. (1975), as summarized in the Bedrock<br />
of Finland − DigiKP compilation by GTK (Fig.<br />
2), show that the main surface rock type along the<br />
SNTL is mica gneiss. At its southeastern end, the<br />
SNTL crosses the Outokumpu-Vuonos-Perttilahti<br />
serpentinite-black schist zone with Outokumputype<br />
sulphides. The mica schist dominating the<br />
middle part of the test area hosts some thin intercalations<br />
of more sulphidic-graphitic black schists<br />
enclosing lenses of serpentinised meta-ultramafic<br />
rocks and rocks marked as skarns in the geological<br />
maps. Within its northwestern part, the SNTL<br />
crosses the basal contact of the Outokumpu allochthon.<br />
The basement below the contact consists<br />
of stacked thrust slices of Archaean granodioritegranite<br />
gneiss, Marine Jatuli quartzites (1.97 -2.20<br />
Ga; Laajoki and Paakkola 1988), calc-silicate rocks<br />
and partly graphitic-sulphidic mica schists. Both<br />
the basement gneisses and Proterozoic rocks have<br />
been extensively intruded by metadolerite sills and<br />
dykes. All these rocks are deformed to mylonite<br />
165
Geological Survey of Finland, Special Paper 59<br />
Suvi Heinonen, Asko Kontinen, Hanna Leväniemi, Ilkka Lahti, Niina Junno, Maija Kurimo and Emilia Koivisto<br />
Fig. 2. The Sukkulansalo National Test Line on a geological map (Huhma 1975). The locations of deep-penetrating<br />
geophysical data, geological bedrock observation points and drill hole collars are also shown. Map Bedrock<br />
of Finland − DigiKP. Digital map database [Electronic resource]. E<strong>sp</strong>oo: Geological Survey of Finland [referred<br />
01.01.2016]. Version 1.0.<br />
gneisses and schists. Major structural boundaries<br />
crossed by the SNTL are also demonstrating their<br />
existence in the geophysical data.<br />
There is only few drill holes in the vicinity of the<br />
SNTL. There is a 2-km long drill hole profile paralleling<br />
the SNTL just 1 km northwest of it, across the<br />
Sukkulansalo area. A few drill holes are intersecting<br />
the Perttilahti Co-Cu-Zn mineralization, just<br />
at the southeastern end of seismic profile V7. Additionally,<br />
GTK has recently made a profile of four<br />
holes with nominal depth of 150-m across the Outokumpu<br />
allochthon-basement contact at Saarivaara<br />
(Kontinen & Säävuori 2012). The geological information<br />
obtained from these drill holes is included<br />
in the geological cross-section presented at the<br />
end of this article.<br />
166
Geological Survey of Finland, Special Paper 59<br />
Sukkulansalo National Test Line in Outokumpu: A ground reference for deep exploration methods<br />
GEOPHYSICAL DATA ALONG THE SNTL<br />
The area of the Sukkulansalo National Test Line<br />
has been covered by several geophysical surveys,<br />
including low-altitude airborne magnetic, electromagnetic<br />
and radiometric data, high-resolution<br />
seismic reflection data, airborne ZTEM data and<br />
audiomagnetotelluric (AMT) data.<br />
Airborne magnetic and electromagnetic surveys in the SNTL area<br />
Figure 3, 4 and 5 show different geophysical maps<br />
acquired in the airborne surveys conducted by the<br />
Geological Survey of Finland. A detailed description<br />
of the methodology and measurement system<br />
(e.g. equipment used, measurement configuration<br />
and processing details) can be found in Airo<br />
(2005) and references therein. The SNTL crosses<br />
several prominent electromagnetic (Figs. 3 and 4)<br />
and magnetic anomalies (Fig. 5). These anomalies<br />
are continuous throughout the wider area in the<br />
Outokumpu region, and the SNTL crosses the SW<br />
end of the magnetic anomaly caused by an apparent<br />
overthrusted Miihkali nappe between Alakylä<br />
and Saunasuo.<br />
In electromagnetic (EM) measurements, an alternating<br />
magnetic field is established by passing a<br />
current through a coil. In the presence of conductive<br />
earth material, a secondary magnetic field is<br />
induced and the strength of this secondary field is<br />
measured and compared with the strength of the<br />
Fig. 3. Quadrature component of airborne electromagnetic mapping in the SNTL area. Data courtesy of the<br />
Geological Survey of Finland.<br />
167
Geological Survey of Finland, Special Paper 59<br />
Suvi Heinonen, Asko Kontinen, Hanna Leväniemi, Ilkka Lahti, Niina Junno, Maija Kurimo and Emilia Koivisto<br />
primary field. Typical conductive minerals causing<br />
anomalies in EM measurements are graphite, pyrite<br />
and pyrrhotite. The depth penetration of the GTK 3<br />
kHz airborne electromagnetic (AEM) data (Figs. 3<br />
and 4) is up to 50 m. The AEM in-phase map (Fig.<br />
4) generally shows the most conductive features<br />
in the bedrock, while the quadrature component<br />
(Fig. 3) is more sensitive to moderately conducting<br />
features and overburden conductors such as clays.<br />
No prominent outcropping sulphide mineralizations<br />
are known in the Outokumpu region, and<br />
the main conductors are black schists due to their<br />
graphite and sulphide content. Thus, most highamplitude<br />
AEM anomalies in the SNTL area can be<br />
attributed to black schists. Serpentinites can also<br />
have higher conductivity than the surrounding resistive<br />
bedrock (Lahti et al., this volume), and they<br />
typically have high susceptibilities (Leväniemi<br />
2016, this volume). In GTK’s frequency-domain<br />
AEM surveys, serpentines are shown as a negative<br />
re<strong>sp</strong>onse of the in-phase component (e.g. Grant<br />
& West 1965). The black schists often additionally<br />
carry pyrrhotite, which also causes a re<strong>sp</strong>onse in<br />
magnetic measurements.<br />
Aeromagnetic measurements record the total<br />
intensity of the magnetic field, which is locally<br />
influenced by the relative abundance of magnetic<br />
minerals. The most common magnetic mineral is<br />
magnetite. According to Ruotoistenmäki and Tervo<br />
(2006), magnetic linear anomaly zones are related<br />
to traces of fault surfaces separating overlapping<br />
thrust sheets in the Outokumpu area. Similar features<br />
are seen in the AEM data. In the southeastern<br />
part, the SNTL profile reaches the anomalies<br />
Fig. 4. In-phase component of airborne electromagnetic mapping by the Geological Survey of Finland in the<br />
SNTL area.<br />
168
Geological Survey of Finland, Special Paper 59<br />
Sukkulansalo National Test Line in Outokumpu: A ground reference for deep exploration methods<br />
Fig. 5. Total magnetic intensity in the vicinity of the SNTL. Data courtesy of the Geological Survey of Finland.<br />
caused by the Outokumpu formation proper in<br />
the Perttilahti area (Fig. 5). In general, coinciding<br />
anomalies in magnetic and electromagnetic maps<br />
mark electrically conductive, pyrrhotite-bearing<br />
black schist layers, while locations with high magnetic<br />
but low electromagnetic readings are attributed<br />
to magnetite-bearing poorly conductive rocks<br />
(Ruotoistenmäki and Tervo 2006). In the case of<br />
a negative AEM in-phase and high magnetic re<strong>sp</strong>onse,<br />
the rock can be presumed to be serpentinite<br />
because of its high susceptibilities.<br />
In Figure 6, a geological map is overlain with<br />
aeromagnetic and electromagnetic in-phase data<br />
plotted in grey scale. In the northwest of the SNTL,<br />
both magnetic and EM data show a clear positive<br />
anomaly on the contact between tonalitic gneisses<br />
in the north and mica gneisses in the south. Structural<br />
forms, such as the Miihkali and Outokumpu<br />
nappes, are clearly demonstrated in the airborne<br />
geophysical maps. The majority of narrow anomalies<br />
in the mica gneiss are caused by thin black<br />
schist interlayers having a strong re<strong>sp</strong>onse in both<br />
EM and magnetic measurements.<br />
169
Geological Survey of Finland, Special Paper 59<br />
Suvi Heinonen, Asko Kontinen, Hanna Leväniemi, Ilkka Lahti, Niina Junno, Maija Kurimo and Emilia Koivisto<br />
Fig. 6. A geological map (see Fig. 2 for legend) overlain by grey scale magnetic (left) and EM in-phase (right)<br />
maps.<br />
Seismic reflection data<br />
In the course of the FIRE (Finnish Reflection Experiment<br />
2003–2006; Kukkonen & Lahtinen. 2006)<br />
and HIRE (High Resolution Reflection Seismics for<br />
Ore Exploration, 2007–2010; Kukkonen et al. 2012)<br />
projects, altogether 82 km of high-resolution 2D<br />
seismic data were acquired in the Outokumpu region.<br />
Seismic reflection surveys are used to image<br />
subsurface structures to depths of several kilometres.<br />
Seismic waves are produced using a controlled<br />
source, such as explosives or <strong>sp</strong>ecial vibrator trucks.<br />
The waves propagate through the subsurface until<br />
they encounter an abrupt change in acoustic impedance<br />
(product of seismic velocity and density).<br />
The contrast can be caused, for example, by lithological<br />
changes or a fracture zone. Reflected seismic<br />
waves are registered in the surface with geophones.<br />
In the case of the HIRE surveys, a <strong>sp</strong>read of<br />
402 geophone groups was used. Because the ratio of<br />
the actual reflection signal to the noise is typically<br />
very low, seismic surveys are designed so that the<br />
same subsurface point is measured several tens of<br />
times with different source-to-receiver distances.<br />
As already pointed out, the SNTL parallels one<br />
of the HIRE survey lines, providing information<br />
on subsurface reflectivity down to almost 10 km<br />
depth. The data acquisition for this HIRE V7 was<br />
carried out by the Russian company Vniigeofizika,<br />
which also carried out the basic data processing.<br />
Even though the resulting 2D seismic image is of<br />
good quality, carefully tailored algorithms have<br />
been found to further enhance the quality of final<br />
seismic sections, as demonstrated in the studies<br />
by Koivisto et al. (2012) and Heinonen et al. (2013).<br />
Reflection seismic data along V7 have been reprocessed<br />
and described in detail in the Master’s thesis<br />
of Aihemaiti (2014).<br />
Profile V7 was measured by using a vibroseis<br />
source along a slightly winding road (Figs. 1 and 2).<br />
Although the winding is mostly only a minor factor,<br />
it nevertheless leads to the <strong>sp</strong>reading of theoretical<br />
reflection points locally into a broader zone<br />
instead of common depth points being located underneath<br />
the acquisition line. In the parts where<br />
the acquisition road turns more sharply, the near<br />
and far offset reflection points can diverge almost<br />
300 m in a cross-line direction. Clearly, in such<br />
parts of the final seismic profile, the observed reflectivity<br />
does not represent features exactly below<br />
the surface trace of the profile, but rather a certain<br />
smeared average of reflectivity. This is important<br />
to keep in mind in detailed interpretation, such as<br />
when setting drilling targets, solely based on seismic<br />
data.<br />
Figure 7 presents an example of shot gathers<br />
acquired along the SNTL and V7 seismic profile. In<br />
these unprocessed shot gathers, clear reflectivity<br />
is observed at two-way travel times greater than<br />
600 ms. Prominent first breaks demonstrate the<br />
high quality of the raw data.<br />
170
Geological Survey of Finland, Special Paper 59<br />
Sukkulansalo National Test Line in Outokumpu: A ground reference for deep exploration methods<br />
Fig. 7. Examples of raw shot gathers (AGC with 500 ms window applied for plotting purposes) from the SNTL<br />
showing clear first breaks and the prominent reflectivity of the subsurface.<br />
Fig. 8. Seismic reflection profile V7 forms a basis for the Sukkulansalo National Test Line (SNTL).<br />
An image of the seismic section commercially processed<br />
by Vniigeofizika is provided in Figure 8.<br />
Details of the commercial data processing are presented<br />
in technical reports by Vniigeofizika and<br />
Kukkonen et al. (2012). The reflectivity is characterized<br />
by a few strong continuous features along<br />
profile reaching surface at CMP 2500 and 3100,<br />
dipping towards the southeast with angles of 25°<br />
and 20°. These reflectors coincide at the surface<br />
with skarn rock formations in contact with mica<br />
gneisses and thrust faults. Strong reflectivity in the<br />
northwestern part of the profile at two-way travel<br />
times above 0.5 s (~1.5 km) projects in the surface<br />
at the border between Maarianvaara granites and<br />
mica gneisses of the Outokumpu allochthon. A<br />
more detailed geological interpretation of the seismic<br />
reflection data is provided in the context of the<br />
geological cross-section provided for the SNTL.<br />
Gravity data<br />
Most of the Outokumpu Belt has been covered by<br />
regional gravity measurements; the dataset has<br />
an average point density of 2.1 points/km 2 . The<br />
regional gravity dataset is suitable for modelling<br />
larger units (e.g. the Outokumpu formation as one<br />
unit), but for detailed modelling it is necessary to<br />
use the systematic gravity survey dataset. These<br />
data are a legacy of Outokumpu Oy (Ketola, 1973),<br />
and were acquired with 100-m line <strong>sp</strong>acing and<br />
20-m point <strong>sp</strong>acing for the majority of the data.<br />
Figure 9 di<strong>sp</strong>lays a regional Bouguer anomaly gravity<br />
map of the SNTL surroundings.<br />
171
Geological Survey of Finland, Special Paper 59<br />
Suvi Heinonen, Asko Kontinen, Hanna Leväniemi, Ilkka Lahti, Niina Junno, Maija Kurimo and Emilia Koivisto<br />
Fig. 9. Regional gravity map in the area of the SNTL.<br />
ZTEM<br />
GTK acquired a ZTEM (Z-axis tipper electromagnetic<br />
system) helicopter survey from Geotech in<br />
June 2013. ZTEM was used in the Outokumpu area<br />
to reveal the resistivity contrasts of the surface<br />
down to depths of 2 km. The method uses the natural<br />
or passive fields of the Earth as the source of<br />
transmitted energy. These natural electromagnetic<br />
fields originate from global thunderstorm activity.<br />
The vertical magnetic component of the EM field is<br />
recorded by a moving receiver and horizontal components<br />
of the electromagnetic field are simultaneously<br />
measured with ground base stations. Any<br />
vertical field is caused by conductivity changes in<br />
the Earth. The method primarily re<strong>sp</strong>onds to the<br />
resistivity gradient at the contacts.<br />
Most of the Outokumpu mining camp has been<br />
covered by ZTEM flight line <strong>sp</strong>acing of 1000 m or,<br />
at the edges, 2000 m, but in the central survey<br />
area, also including the SNTL, the line <strong>sp</strong>acing was<br />
reduced to 500 m. The total number of flight lines<br />
of the ZTEM survey was 51, with a total of 1200<br />
line kilometres flown. The flight altitude was ca.<br />
95 m. The estimated skin depth of the ZTEM data<br />
collected in Outokumpu is 600–2000 m measured<br />
with six frequencies (25, 37, 75, 150, 300 and 600<br />
Hz). GTK ordered both 2D and 3D inversions of<br />
the ZTEM data from Geotech. Details of the ZTEM<br />
measurements, data processing and interpretation<br />
are presented in Kurimo et al. (this volume).<br />
Two different sets of inversion results along the<br />
ZTEM flight lines close to the SNTL are presented<br />
in Figure 10. The first inversions were carried out<br />
along the flight lines by Geotech Ltd. The 2D inversion<br />
code used takes into account the variation in<br />
topography and flight altitude. The code assumes<br />
that the strike length of subsurface features is infinite<br />
and orthogonal to the profile. A homogeneous<br />
half-<strong>sp</strong>ace with a resistivity of 2000 Ωm was<br />
used as an initial model. Figure 10 also shows the<br />
results of fine mesh 3D inversion with a cell size<br />
of 50 x 250 x 50 m. Similarly to 2D inversions, the<br />
3D inversion also used 2000 Ωm in a start model,<br />
172
Geological Survey of Finland, Special Paper 59<br />
Sukkulansalo National Test Line in Outokumpu: A ground reference for deep exploration methods<br />
Fig. 10. Resistivity distribution along the ZTEM flight lines L1100, L1102, L1104 and LL1106 close to the SNTL.<br />
a) 2D inversion results and b) results of 3D inversion in the area of 500-m flight line <strong>sp</strong>acing along the same lines.<br />
and resistivity was allowed to vary between 1 and<br />
100,000 Ωm. In addition to the results presented<br />
here, a 3D inversion with a coarser grid cell size<br />
was run with resistivity limits of 100–100,000 Ωm.<br />
In Figure 10, a resistivity anomaly at a distance<br />
of about 4000 m along the profile coincides with<br />
the contact between the Maarianvaara granites<br />
and mica gneiss of the Outokumpu allochthon.<br />
Anomalies at distances of approximately 6000 m<br />
and 10,000 m can be attributed to the thrust zones<br />
and skarn rocks on the geological map (Fig. 2), although<br />
the increased conductivity can probably be<br />
attributed to the black schist in the thrust zone, not<br />
to the skarns. Additionally, a power line at 8900 m<br />
influences the results. Similarly to the previous on,<br />
an anomaly at around 1400 m distance is related to<br />
thrust structures. Outokumpu assemblage rocks in<br />
the Perttilahti area also cause a clear re<strong>sp</strong>onse in<br />
the ZTEM data (distance 16,000–18,000 m).<br />
AMT<br />
Audio-magnetotelluric (AMT) data were collected<br />
along the SNTL alongside four other profiles<br />
in the Outokumpu area during field campaigns in<br />
2012–2014 with the aim of imaging deep conductivity<br />
structures. The SNTL AMT profile consists of<br />
11 measurement sites (Fig. 2). High-frequency data<br />
173
Geological Survey of Finland, Special Paper 59<br />
Suvi Heinonen, Asko Kontinen, Hanna Leväniemi, Ilkka Lahti, Niina Junno, Maija Kurimo and Emilia Koivisto<br />
Fig. 11. AMT profile at the SNTL site. View from the southwest.<br />
(f = 1–10,000 Hz) were acquired using two Metronix<br />
24-bit ADU-07e broadband electromagnetic acquisition<br />
systems. Each AMT measurement was made<br />
with a perpendicular pair of 50–100-m electric dipoles<br />
that consist of two non-polarizing Pb-PbCl 2<br />
electrodes (EFP06), two orthogonal magnetic field<br />
sensors (MFS07e) and one vertical magnetic field<br />
sensor (MFS07e). Two-dimensional inversion was<br />
jointly carried out for TE and TM data. Further details<br />
of the data processing are provided in Lahti et<br />
al. (this volume). The motivation to do both ZTEM<br />
and AMT surveys in the same area was to compare<br />
the resolution and results of the two methods. Additionally,<br />
AMT data provides information of deeper<br />
structures than ZTEM.<br />
The AMT profile along the SNTL shows low resistivity<br />
values underneath the southwestern end<br />
of the synform of the Miihkali nappe and in the<br />
vicinity of the thrust fault related to the northwestern<br />
edge of the Outokumpu nappe, while the<br />
area between these thrusts is characterized by high<br />
resistivity values. Due to electromagnetic disturbances<br />
caused by a high-voltage power line, there<br />
is a long gap in the data between sites B11 and B12.<br />
Therefore, conductivity structures are not optimally<br />
solved between these points and additional<br />
conductors could be present in this area.<br />
MODELLING AND INTEGRATION OF THE GEOPHYSICAL DATA<br />
Seismic forward modelling<br />
Seismic forward modelling is used to simulate the<br />
seismic data that would be recorded given an assumed<br />
geological structure and a particular acquisition<br />
geometry. For forward seismic modelling,<br />
a preliminary geological model of the target<br />
of interest is needed, along with knowledge of the<br />
density and seismic velocity structure of the medium<br />
in which the seismic waves propagate. Based<br />
on comparisons of the forward modelling results<br />
with measured reflection seismic data, the geological<br />
model can be tested and further improved.<br />
More throughout discussion about seismic forward<br />
modelling is provided by Komminaho et al. (this<br />
volume).<br />
For the SNTL, an algorithm based on the Born<br />
approximation (Eaton 1997) was used for seismic<br />
forward modelling. The Born approximation gives<br />
the theoretical elastic-wave scattering re<strong>sp</strong>onse of<br />
174
Geological Survey of Finland, Special Paper 59<br />
Sukkulansalo National Test Line in Outokumpu: A ground reference for deep exploration methods<br />
Fig. 12. A) Pseudo-3D geological model of the Outokumpu area near seismic line V7 by Eevaliisa Laine (modified<br />
from Saalmann & Laine 2014). B) The main lithological units of the Outokumpu area used for seismic forward<br />
modelling are shown on top of the simulated data. C) Seismic forward modelling results along V7. For the<br />
background velocity and density values, we have used the average values for mica schist (Table 1, Fig. 2). R1–R5<br />
indicate reflections comparable between the measured and simulated seismic data (see text for details). The<br />
modelling was performed using Paradigm GOCAD® and Mira Geosciences Ltd. GOCAD® Mining Suite. D) Measured<br />
reflection seismic data (CMP stack) from line V7 (re-processed at the Institute of Seismology in 2015). R1–R5<br />
indicate reflections comparable between the measured and simulated seismic data (see text for details).<br />
a geological model in a weakly heterogeneous medium.<br />
It is based on a representation of the geological<br />
model as a distribution of weak elastic perturbations<br />
superimposed on a smoothly varying,<br />
or constant, background model (Eaton 1997). The<br />
forward modelling was performed using Paradigm<br />
GOCAD® and Mira Geosciences Ltd. GOCAD®<br />
Mining Suite.<br />
The geological model used for forward modelling<br />
is based on the model by Saalmann & Laine (2014),<br />
part of which located along seismic line V7 is illustrated<br />
in Figure 12. The 3D geological model is<br />
based on drill core observations and loggings, surface<br />
geology, geological cross-sections by Koistinen<br />
(1981), and aeromagnetic and reflection seismic<br />
data. Details of the 3D geological model can be<br />
found in Saalmann & Laine (2014). The geological<br />
model used for forward modelling consists of surfaces<br />
representing contacts between different rock<br />
units. Each surface was assigned P-wave velocities<br />
and density values, or more precisely, the change<br />
in these values compared to the background value<br />
representing mica schist. The average density and<br />
seismic velocity values for each rock type were<br />
Table 1. Average density and seismic P-wave velocity (Vp) values for the rock types present in the 3D geological<br />
model used for seismic forward modelling (mica and black schists from Airo et al. (2011) and Elbra et al. (2011);<br />
Archaean basement and gabbro from Salisbury et al. (2003); values for ore theoretically calculated (see text for<br />
details)).<br />
Rock type Vp (m/s) Density (kg/m 3 )<br />
Mica schist 5443 2668<br />
Mica schist (heterogeneous, dense) 5361 2790<br />
Archaean gneiss 6910 2940<br />
Gabbro 6910 2940<br />
Outokumpu assemblage (black schist) 5330 2899<br />
Massive sulphide ore 5997 3813<br />
175
Geological Survey of Finland, Special Paper 59<br />
Suvi Heinonen, Asko Kontinen, Hanna Leväniemi, Ilkka Lahti, Niina Junno, Maija Kurimo and Emilia Koivisto<br />
obtained from measurements made in the Outokumpu<br />
Deep Drill Hole (Airo et al. 2011, Elbra et al.<br />
2011) and are listed in Table 1 and also presented<br />
in Figure 12. The Achaean basement was assumed<br />
to consist of mafic rocks and the average density<br />
values and seismic velocities (6910 m/s and 2940<br />
kg/m 2 ) were obtained from Salisbury et al. (2003).<br />
Black schist envelopes the Outokumpu assemblage<br />
rocks (e.g., Koistinen 1981) and its density<br />
and seismic velocity were chosen to represent the<br />
Outokumpu assemblage in the forward modelling.<br />
In order to keep the model simple, it does not have<br />
the internal structure typical for the Outokumpu<br />
assemblage. The values for gabbro units were also<br />
obtained from Salisbury et al. (2003), since the Outokumpu<br />
Deep Drill Hole does not intersect any<br />
gabbroic rocks.<br />
To demonstrate how the Outokumpu-type ore<br />
would be detectable in reflection seismic data,<br />
theoretical P-wave velocity and density values<br />
were calculated for ore. The massive sulphide ore<br />
was assumed to have the following composition:<br />
pyrrhotite 23.2 vol%, pyrite 21.0 vol%, chalcopyrite<br />
11.0 vol%, <strong>sp</strong>halerite 1.7 vol%, pentlandite 0.5 vol%<br />
and, as a main gangue mineral, quartz 42.6 vol%<br />
(Peltola 1978, Kukkonen et al. 2012). The values for<br />
P-wave velocities and densities for individual minerals<br />
were obtained from Salisbury et al. (2003) and<br />
Schön (2004), and the values for Outokumpu ore<br />
were calculated from the assumed mineral composition<br />
of the ore and from the theoretical property<br />
values for these individual minerals (Table 1). A<br />
small ore inclusion (ca. 500 m x 100 m) was added<br />
to the southeastern part of the 3D geological model<br />
within the Outokumpu assemblage unit (Fig. 1A<br />
indicated in red).<br />
The modelled results are presented in Figures<br />
12b and 12c together with the measured reflection<br />
seismic data from line V7 in Figure 12d. Reflections<br />
that are comparable between the simulated<br />
and measured data from line V7 are marked with<br />
R1–R5. Reflections R1 and R2 originate from the<br />
assumed contacts to the Archaean basement and<br />
they can be found in both simulated and measured<br />
data. As expected, the detailed reflectivity of the<br />
unit cannot be explained by the geological model<br />
used. Komminaho et al. (this volume) <strong>sp</strong>eculate<br />
that the reflections attributed here to a continuous<br />
Archaean basement below the measurement line<br />
might partly, in particular the reflections marked<br />
by R1, be caused by 3D effects and be produced by<br />
features that are not located immediately below<br />
the measurement line.<br />
Reflections due to assumed gabbros are marked<br />
with R3. The overall shape of the observed reflections<br />
(R3 in Fig. 12c) can be explained by that of the<br />
high-density gabbros in the geological model. Reflections<br />
marked by R4 indicate the contact to the<br />
assumed Outokumpu assemblage unit in the mica<br />
schist background. It should be noted that in the<br />
model, this unit is not internally reflective because<br />
of a homogeneous composition (i.e., no internal<br />
Fig. 13. The average P-wave velocity and density values calculated for each rock type (mica and black schists from<br />
Airo et al. (2011) and Elbra et al. (2011); Archaean basement and gabbro from Salisbury et al. (2003)). The values<br />
for ore (indicated with a solid red diamond) have been theoretically calculated (see text for details). Solid black<br />
lines represent constant acoustic impedance curves (in 106 kg/m2s). The difference between two solid black impedance<br />
curves marks the difference in acoustic impedance sufficient to cause a detectable reflection.<br />
176
Geological Survey of Finland, Special Paper 59<br />
Sukkulansalo National Test Line in Outokumpu: A ground reference for deep exploration methods<br />
lithological contacts within the formation that<br />
would produce reflections), and the theoretical ore<br />
inclusion produces a clear diffracted signal in the<br />
synthetic data (Fig. 12c). Typically, Outokumpu assemblage<br />
rocks are associated with a strongly reflective<br />
internal structure (Kukkonen et al. 2012),<br />
which complicates the use of seismic reflection<br />
data for direct ore exploration. Reflections marked<br />
by R5 are the reflections due to more dense altered<br />
mica schists within the homogeneous and light<br />
mica schists. However, these reflections are not<br />
clearly visible in the measured data from V7 (Fig.<br />
12d), as also indicated by similar acoustic impedances<br />
(Fig. 13).<br />
Seismic forward modelling shows that the relatively<br />
simple geological model presented by Saalman<br />
and Laine (2014) can explain the majority of<br />
the observed reflectivity, but the geological complexity<br />
and internal structure of the reflective<br />
formations cannot be repeated with the forward<br />
modelling algorithm using Born approximation.<br />
In particular, this type of algorithm is not able to<br />
repeat the amplitude variations of the real seismic<br />
data and does not take into consideration the full<br />
waveform behaviour of the seismic waves, including<br />
diffraction, scattering and wave conversions.<br />
However, because the algorithm is fast and easy<br />
to use, it provides a rapid tool to test whether the<br />
geological interpretation of the seismic data is feasible<br />
in the first level. Furthermore, the discrepancies<br />
between modeled and measured seismic data<br />
are areas can reveal interesting features for exploration.<br />
Forward modelling of gravity data<br />
Gravity modelling on the SNTL profile was performed<br />
as forward modelling using Tensor Research<br />
ModelVision 14.1. The initial model capitalized on<br />
the Saarivaara interpretation, which concluded<br />
that the strong reflectors in the V7 seismic profile<br />
are due to alternating and internally strongly foliated<br />
sequences of low-density quartzite, arkosite,<br />
high-density amphibolites, calc-silicate rocks<br />
and amphibolite layers in the underlying Archaean<br />
gneisses (Kontinen & Säävuori 2013). Based on<br />
the density measurements of Kontinen & Säävuori<br />
(2013), we used the total bulk density of 2800 kg/m 3<br />
for this highly varying rock package. It should be<br />
noted that this is very close to the densities of the<br />
altered ultramafic rocks in the Outokumpu association<br />
(e.g. Leväniemi 2016, this volume) and these<br />
two rocks cannot be distinguished by using gravity<br />
method. It is noteworthy that uncertainties related<br />
to the dimensions and geometries of the gravity<br />
model bodies are substantial, and forward modelling<br />
is suggestive rather than definitive. As usual in<br />
geophysical modelling, several different geological<br />
models can cause a similar re<strong>sp</strong>onse in the gravity<br />
measurements.<br />
Outlining for the Saarivaara sequence of rocks in<br />
the V7 seismic profile (Fig. 14) constrains the rest<br />
of the model. The metasediments (mica schists)<br />
in the Outokumpu allochthon are estimated to be<br />
of a higher density than the underlying Archaean<br />
gneisses (Leväniemi, this volume). Thickness of<br />
mica schist increases towards the southeast and it<br />
is a major component in the regional long-wavelength<br />
gravity anomaly. The presumed high-density<br />
amphibolites and calc-silicate rocks are modelled<br />
with a single density value, and it should be<br />
noted that based on the seismic profile they are<br />
internally layered. Thus, the gravity model bodies<br />
are inevitably simplifications of the true geological<br />
features.<br />
At the northwest end of the gravimetric profile<br />
there are two small maxima in the measurement<br />
data on the Archaean rocks. These were modelled<br />
as two upward-reaching limbs of the Saarivaara<br />
sequence rocks. The surficial counterparts for the<br />
limbs can be located on the detailed geological<br />
map of the Saarivaara area by Kontinen & Säävuori<br />
(2013) and are included in the geological interpretation<br />
of the SNTL at the end of this article.<br />
177
Geological Survey of Finland, Special Paper 59<br />
Suvi Heinonen, Asko Kontinen, Hanna Leväniemi, Ilkka Lahti, Niina Junno, Maija Kurimo and Emilia Koivisto<br />
Fig. 14. Forward modelling results for the gravity data along the SNTL profile based on the interpretation of<br />
seismic reflection profile V7. Top: profile location on a bedrock map. Middle: measured gravity re<strong>sp</strong>onse, chosen<br />
regional level and results of forward modelling. Gravity modelling profiles. Bottom: vertical section combining<br />
the gravity model and seismic profile V7.<br />
178
Geological Survey of Finland, Special Paper 59<br />
Sukkulansalo National Test Line in Outokumpu: A ground reference for deep exploration methods<br />
Joint interpretation of the geophysical data on SNTL<br />
Figure 15 presents a combination of seismic, ZTEM,<br />
AMT and gravity data together with aerogeophysical<br />
maps of the SNTL area. In Figure 15f, the 2Dinversion<br />
results of ZTEM flight line 1104 are projected<br />
on the seismic profile. In Figure 14e, the<br />
seismic reflection profile is overlain by a gravity<br />
model and isocurves of the AMT measurements.<br />
Gravity model is based on the seismic reflection<br />
data due to the fact that both of these methods re<strong>sp</strong>ond<br />
to density changes unless change in density<br />
is compensated with opposite change in velocity<br />
(that is, acoustic impedance remains the same). In<br />
the northwestern part of the SNTL, ZTEM and AMT<br />
data both show similar conductivity structures, but<br />
in the middle part of the profile and on its southern<br />
end the results do not correlate. Possible reasons<br />
for this include the presence of a 110 kV power line<br />
at a distance of ~10 km in Figure 15 and the gap in<br />
AMT stations around this same area (see Fig. 2 for<br />
AMT measurement points). ZTEM data have much<br />
denser sampling compared to AMT, and conductors<br />
of AMT data might be superpositioned.<br />
The most common conductors in the SNTL area<br />
are the black schists interlayers in the mica gneiss<br />
that also envelopes ore-hosting Outokumpu assemblage<br />
rocks. However, black schists do not<br />
have a significant density contrast to mica gneiss<br />
and are not a source of gravity anomalies, resulting<br />
in a general lack of correlation between gravity<br />
and ZTEM anomalies (Fig. 15). However, base of the<br />
allochton metasediments was interpreted from<br />
gravity and seismic data and this same feature is<br />
delineated with the conductor isocurves in the NW<br />
part of the profile. Increase of conductivity can indicate<br />
presence of black schists in the contact imaged<br />
with seismic data.<br />
A closer comparison of the ZTEM 2D inversion<br />
results on profile 1104 with the bedrock map and<br />
other geophysical datasets reveals the origin of<br />
several conductors (Fig. 15). At the contact of the<br />
Maarianvaara granite and the Kaleva allochthon<br />
(conductor 1 in Fig. 15), Kontinen & Säävuori (2013)<br />
report black schists in Saarivaara drill holes. The<br />
general shape of this conductor follows the seismic<br />
reflector that Kontinen & Säävuori (2013) attributed<br />
to the Heinä-Sukkula sequence rocks of highly<br />
variable densities and seismic velocities, and as<br />
such most likely marks the eastward-dipping basin<br />
of the metasediments. A similar feature is also<br />
apparent in AMT data (Fig. 12). A separate conductor<br />
(2) could be related to this feature or be an individual<br />
conductor of unknown origin; no strong<br />
seismic reflectors coincide with this feature, but<br />
it is rather located between strong reflectors in a<br />
non-reflective zone. The tip of the Miihkali nappe<br />
and its conductors (presumably also black schists)<br />
can also be observed in the ZTEM inversion results<br />
(conductor 3).<br />
Between Saarivaara and Perttilahti there is<br />
one strongly conductive feature (conductor 4)<br />
that can be connected to a surface conductor in<br />
the AEM in-phase map (Fig. 15b). This feature is<br />
possibly caused by graphite schist layers within<br />
the mica schist, as they are abundant in the area.<br />
Based on the surface geological map, skarn rocks<br />
have been observed in the vicinity of the conductor<br />
but skarns are not known to contain conductive<br />
minerals. The top of the conductor aligns with<br />
a gently SE-dipping reflector, and AMT isocurves<br />
at this site seem to divide the seismic section into<br />
an area of prominent reflectivity and a seismically<br />
homogeneous area. This observations suggest that<br />
conductor 4 may be related to a tectonic feature,<br />
such as a fault zone in which black schist has acted<br />
as a sliding surface according to interpretation by<br />
Kukkonen et al. (2012).<br />
Strong subvertical ZTEM conductor 5 is associated<br />
with the known Outokumpu Belt. However,<br />
neither AMT nor seismic data extend to this zone.<br />
The southeastern end of the seismic profile shows<br />
discontinuous reflectivity that could result from<br />
the subvertical general direction of structures or<br />
extensive faulting. Comparison of Perttilahti geological<br />
cross-sections (Kontinen et al. 2006) of the<br />
Outokumpu Belt with ZTEM conductivity anomalies<br />
reveal that conductor 5 is related to a shallow<br />
Outokumpu assemblage series with black schists<br />
on the fringes of the altered ultramafic rocks.<br />
However, the deeper Outokumpu “sequence”<br />
hosting the mineralization cannot be clearly distinguished<br />
in the inversion results. On the southeast<br />
side of the Outokumpu Belt, the conducting<br />
features 6, 7 and 8 in the inversion results can be<br />
linked to weak surficial conductors on the AEM inphase<br />
map that appear to be a continuation of the<br />
features surrounding the Sola formation (Fig. 4),<br />
and are also visible on the magnetic map in Figure<br />
15d and Figure 5.<br />
179
Geological Survey of Finland, Special Paper 59<br />
Suvi Heinonen, Asko Kontinen, Hanna Leväniemi, Ilkka Lahti, Niina Junno, Maija Kurimo and Emilia Koivisto<br />
Fig. 15. The Sukkulansalo National Test Line on geological (a) in-phase electromagnetic (b), gravity (c) and magnetic<br />
maps (d). In Figure e) 2D inversion results of flight line 1104 are shown, and in f) these results are underlain<br />
by seismic profile V7. Figure g) shows the seismic data, isocurves of conductivity along the AMT profile and<br />
density blocks resulting from gravity modelling (green 2800 kg/m 3 , light blue 2720 kg/m 3 , dark blue 2740 kg/m 3 ,<br />
background 2670 kg/m 3 ). Geological cross section in figure h) is discussed in detail below.<br />
180
Geological Survey of Finland, Special Paper 59<br />
Sukkulansalo National Test Line in Outokumpu: A ground reference for deep exploration methods<br />
GEOLOGICAL CROSS-SECTION ALONG THE SNTL<br />
The in-depth geology and structure along the Sukkulansalo<br />
National Test Line is only tentatively<br />
understood due to poor exposure and a lack of<br />
dedicated structural mapping for most of it. In order<br />
to make the SNTL a more prominent location<br />
for testing deep exploration methods and to draw<br />
more reliable conclusions regarding the geological<br />
structures, the interpretation presented here needs<br />
to be tested by deep drilling. Current geological understanding<br />
of the SNTL is mainly based on the<br />
geophysical data and is presented in the following.<br />
The archaean basement rocks in the northwest<br />
of the SNTL profile contain younger sedimentary<br />
Jatuli rock sequence that projects at a shallow angle<br />
(c. 20°) below the Outokumpu allochthon. The<br />
stack appears as a strongly reflective unit in seismic<br />
reflection profile V7 because it containts both high<br />
density amphibolites and less dense felsic rocks.<br />
This Saarivaara reflector can be traced over 10 km<br />
to the southeast below the Outokumpu-Vuonos-<br />
Perttilahti zone, where the base of the allochthon<br />
appears to be at approximately 4 km depth.<br />
A geologically complicating factor is the presence<br />
of the young pegmatitic Maarianvaara granites extensively<br />
exposed c. 10 km west of the Saarivaara/<br />
Pohjoi<strong>sp</strong>ää hill. Based on Bouguer gravity anomaly<br />
maps (Fig. 9) and observations from the Outokumpu<br />
Deep Drill Hole (Västi 2011), these light (density<br />
2631 kg/m 3 , Airo et al. 2011) granites underlie the<br />
whole SNTL area below 0–2 km in terms of depth.<br />
Although the exposure over large parts of the<br />
SNTL is poor, existing ground and low-altitude<br />
airborne geophysical surveys indicate some occurrences<br />
of serpentinite and sulphidic-graphitic<br />
rocks along the SNTL. Down-plunge analysis from<br />
the sides towards the SNTL suggest this is also the<br />
case at depth. Considerable bodies of gabbros at<br />
depth have been suggested to contribute to the reflectivity<br />
underneath the SNTL (Saalman & Laine<br />
2014) but we attribute many of the reflectors in<br />
V7 above the interpreted allochthon-basement<br />
contact to late fault planes in the turbidite stack<br />
because currently no known surface examples of<br />
gabbro bodies in the Outokumpu allochthon area<br />
exist.<br />
The term Maarianvaara granite (A in Fig. 16)<br />
originally referred to the fairly uniform granodiorite-granite-pegmatite<br />
granite domain NE of Lake<br />
Rikkavesi and between the Kaavi and Outokumpu<br />
branches of the Outokumpu allochthon. The SNTL<br />
interpretation recognizes three separate large<br />
masses of Maarianvaara-type granite, labelled as<br />
A1, A2 and A3. From these, A1 refers to the welland<br />
widely exposed Maarianvaara granite proper,<br />
whereas A2 and A3 are unexposed subsurface elements<br />
inferred from the indications by the Outokumpu<br />
Deep Drill Hole and seismic reflection<br />
profiles. Maarianvaara granites are an important<br />
component below the entire Outokumpu area,<br />
but the subsurface shapes and depth extent of the<br />
granite cannot be realistically outlined based on<br />
the currently available data. As the potential to<br />
generate granite from the crust or/and mantlederived<br />
magmas is limited, there must be some<br />
other, genetically related rock masses below the<br />
granites. Regional gravity anomaly maps suggest<br />
that in the North Karelia belt the subsurface becomes<br />
increasingly dense with an increase in the<br />
granodiorite-granite component in the surface towards<br />
the SE. This correlation and the presence of<br />
dioritic enclaves within the granodiorite-granites<br />
in the SW areas suggest that intermediate-mafic<br />
plutonic rocks are an important component of the<br />
deeper crust below 5 km. The presence of A3, for<br />
Fig. 16. Geological cross-section showing different lithological units of the National Test Line. A1, A2 and A3 –<br />
Maarianvaara type granites, B Archaean gneisses of the Onnivaara domal structure, C – Saarivaara impricate<br />
package, D – down-dip extension of the Saarivaara package, E– Basal part of the Outokumpu allochthon at Saarivaara,<br />
F – Mutkanvaara zone, G – Sukkulanjoki synform, H – Outokumpu Mining Zone, I - Viinijärvi basin, J-Sola<br />
shear zone, K – the Huutokoski-Orivesi sheet at Ahtoniemi, L – epicontinental sediments fringing the Sotkuma<br />
basement inlier and M – Sotkuma basement inlier.<br />
181
Geological Survey of Finland, Special Paper 59<br />
Suvi Heinonen, Asko Kontinen, Hanna Leväniemi, Ilkka Lahti, Niina Junno, Maija Kurimo and Emilia Koivisto<br />
which there is no direct evidence, as there is for A2<br />
provided by granite in Outokumpu Deep Drill Hole,<br />
has also been suggested by Sorjonen-Ward (2006).<br />
Archaean gneisses of the Onnivaara domal<br />
structure are marked with B in Figure 16. The<br />
domal structure has been interpreted from the foliation<br />
and magnetic anomaly patterns. The magnetic<br />
anomalies are related to the Proterozoic gabbroic<br />
sills intrusive in the mostly gently dipping<br />
Archaean gneisses, which are dominantly granodiorite-granite,<br />
often with large K-feld<strong>sp</strong>ar phenocrysts<br />
or porphyroblasts. Further in the north,<br />
in the Nilsiä area, similar granodiorites-granites<br />
have been identified in the Sanukitoid clan. As in<br />
the Nilsiä area, in the Onnivaara structure the Archaean<br />
granitoids are also typically strongly foliated<br />
or lineated. This additionally applies to the<br />
Proterozoic mafic dykes and sills intrusive in the<br />
Archaean gneisses.<br />
The Saarivaara imbricate package (C) consists<br />
of the interface of the Onnivaara gneisses and allochthonous<br />
Kaleva. The Saarivaara package is an<br />
approximately 1.5-km-thick, gently east-dipping<br />
unit of thin fault-bounded slices of pervasively<br />
foliated Archaean gneisses and Proterozoic, “marine<br />
Jatulian” quartzites, amphibolites, calc-silicate<br />
rocks and graphitic-sulphidic wacke-pelite<br />
schists. A recent drilling profile across the poorly<br />
exposed package on the eastern slope of Pohjoi<strong>sp</strong>ää<br />
hill at Saarivaara has revealed that a thin<br />
sliver of Archaean gneisses is underlain by the<br />
marine Jatuli rocks just below the Outokumpu allochthon,<br />
emphasizing the tectonic stack nature<br />
of the Saarivaara package (Kontinen & Säävuori<br />
2013). The down-dip extension of the Saarivaara<br />
package (D) is clearly seen in the seismic reflection<br />
data as a laterally extensive, 1–1.5-km-thick<br />
reflectivity pattern, greyed and labelled with the<br />
letter D in Figure 16. The upper surface of the<br />
package is an east-dipping reflector at the depth<br />
of 500 m at the western end of seismic profile<br />
V7. Down-dip projection of the Saarivaara package<br />
observed in the drill holes results in a perfect<br />
match with the reflectivity layer. Measured physical<br />
properties of the Saarivaara package indicate<br />
that it has highly variable seismic velocities and<br />
densities, resulting in strong reflectivity. Based<br />
on these observations, Kontinen & Säävuori (2013)<br />
proposed that the D feature in Figure 16 was a lateral<br />
continuation of the Saarivaara package and<br />
that its upper boundary was marking the basal<br />
contact of the allochthonous Kaleva mica gneisses<br />
of the Outokumpu. This interpretation is consistent<br />
with the results from ZTEM, AMT and gravity<br />
measurements.<br />
The basal part of the Outokumpu allochthon<br />
in the Saarivaara area (E) solely consists of<br />
wacke-dominated metaturbidites typical of the allochthonous<br />
Upper Kaleva. Based on geophysical<br />
maps, these rocks are fairly homogeneous and do<br />
not contain significant occurrences of sulphidiccarbonaceous<br />
interlayers or enclosures of Outokumpu-type<br />
mafic-ultramafic bodies.<br />
As in the previous zone, the Mutkavaara zone<br />
(F) is also for its surface part mostly composed of<br />
wacke-dominated metaturbidite. Only within the<br />
western part of the intersection does it cross the<br />
hinge of the traditionally assumed Miihkali nappe<br />
or synform, indicated in the sketch by a form line<br />
and the label Mi. To match up with the local schistosity<br />
data, the synform has been sketched assuming<br />
an E-dipping axial plane. The shape of the<br />
Miihkali synform can be interpreted from seismic<br />
data, and ZTEM inversion results show indications<br />
of the structure. Fault-bound sheets and lenses<br />
of Outokumpu-type ultramafic-derived rocks occur<br />
along the alleged basal contact of the Miihkali<br />
synform, also here within its southern hinge, and<br />
these ultramafic rocks enveloped in black schists<br />
probably cause the conductivity anomalies in<br />
ZTEM inversion results. A dozen shallow (
Geological Survey of Finland, Special Paper 59<br />
Sukkulansalo National Test Line in Outokumpu: A ground reference for deep exploration methods<br />
tivity and ZTEM conductivity anomalies probably<br />
caused by black schist.<br />
Seismic profile V7 terminates prior to proper intersection<br />
with the Outokumpu Mining Zone (H),<br />
which is magnificently distinguished from the<br />
surroundings in its richness in geophysically welldiscernible<br />
rock types such as highly sulphidicgraphitic<br />
black schist and reasonably large masses<br />
of various types of primarily ultramafic rocks. The<br />
latter are the environment of all mining in the<br />
Outokumpu area. As a reflection of the exploration<br />
interest, abundant drilling has been directed<br />
to this zone and its structural style is fairly well<br />
documented down to a depth of 200–600 m for almost<br />
its entire length from Outokumpu to Horsmanaho.<br />
Many cross-section sketches of the zone<br />
have been published, and these fairly consistently<br />
indicate that the commanding structural feature<br />
was from ten-metre to kilometre-scale tight folding<br />
with 40–70 degrees eastwards-dipping axial<br />
planes and a shallow SW- or NE-plunging axis,<br />
with some NW-verging thrusts and imbrication<br />
faulting along the axial planes. The dominant folds<br />
are usually interpreted as the earliest regionally<br />
observed (F2) folds. Perhaps the most intriguing<br />
structural a<strong>sp</strong>ect of the Outokumpu Mining<br />
Zone is the remarkably straight-striking nature<br />
of the black schist-dominated turbidite layers up<br />
to tens of kilometres long, which are obvious from<br />
geophysical maps. Clearly, any folding and faulting<br />
post-dating the remarkably coherent F2 event<br />
must have been of relatively minor structural importance<br />
for the Outokumpu Mining Zone.<br />
The wide, and for its large parts also reasonably<br />
well-exposed Viinijärvi domain (I) between the<br />
Outokumpu Mining Zone (H) and Sotkuma dome<br />
(M) has been interpreted as a remnant nappe sheet<br />
deformed into a synformal structural basin marked<br />
at its base by the Outokumpu and Sola zones. However,<br />
the Viinijärvi basin lacks published structural<br />
analysis that is based on systematic field mapping.<br />
The lack of research reflects the lack of intercalations<br />
of such materials as sulphide-graphite-rich<br />
black schists or Outokumpu-type mafic-ultramafic<br />
rocks that would be of interest for exploration.<br />
The SNTL crosses the northeastern part of<br />
the alleged Viinijärvi synform in the area where it<br />
is largely covered by Lake Viinijärvi. The limited<br />
structural data on published maps indicate consistently<br />
steep-dipping prominent foliation across<br />
the whole area. The situation is also similar within<br />
the better-exposed central part of the basin, in the<br />
Harmaansalo area SW of Lake Viinijärvi. Recent<br />
observations from this area suggest that bedding<br />
is also consistently steep dipping (>60), often near<br />
vertical. With insufficient critical structural data,<br />
such as younging information, it is impossible to<br />
infer what types of structural processes have rotated<br />
the bedding and foliation to their present<br />
steep attitudes. Although signs of isoclinal folding<br />
are rare on the outcrop scale, kilometre-scale isoclinal<br />
folding may be involved. This is conceptually<br />
indicated by the form lines in the SNTL cross-section.<br />
This interpretation indicates that the monotonously<br />
wacke-pelite nature of the Viinijärvi<br />
structure probably continues to depth.<br />
The total thickness of the Outokumpu allochthon<br />
with serpentinite enclosures below the Viinijärvi<br />
basin is difficult to constrain from the <strong>sp</strong>arse<br />
available data. Previous proposals include >8 km<br />
by Gaal et al. (1975) from a down-plunge model<br />
for the N part of the Viinijärvi basin and >15 km by<br />
Park & Doody (1990) from regional structural modelling.<br />
Gaal et al. (1975) noted the problem with<br />
steep-dipping (km-scale) structural elements<br />
and the shallow depth (c. 2 km) of the Viinijärvi<br />
basin interpreted from the seismic data acquired<br />
by Penttilä (1972). Based on our interpretation of<br />
the bottom contacts of the Outokumpu allochthon<br />
west of the Outokumpu zone and Sola inlier, the<br />
maximum thickness of the allochthon at Viinijärvi<br />
on the SNTL could hardly be more than about 5<br />
km. This is also supported by the interpretation of<br />
the FIRE 3 crustal-scale seismic reflection profile<br />
presented by Sorjonen-Ward (2006), suggesting a<br />
thickness of about 4 km for the allochthon.<br />
Along the Sukkulansalo National Test Line, the<br />
Sola shear zone (J) appears as a narrow zone between<br />
two steeply west-dipping faults. It is at<br />
the southwards continuation of the northwardswidening<br />
shear zone, which contains the Sola<br />
serpentinite lenses and additionally some other<br />
serpentinite lenses in the north and south from<br />
Sola. Foliations reported further north from the<br />
Sola shear zone are mostly steeply dipping (75–<br />
85°) towards the west–southwest (Gaal et al. 1975,<br />
Huhma 1976). Although the zone is generally interpreted<br />
as a shear zone, there is little evidence<br />
of shear-related rotations in the foliation patterns<br />
on the published maps, de<strong>sp</strong>ite the zone being<br />
fairly well exposed. On the other hand, bedding<br />
in the zone is reported with a ubiquitous outcrop<br />
scale, typically 30–50° S–SW dipping dextral folds<br />
(Gaal et al. 1975). Based on the bedding, younging<br />
and lineation (stretching, fold axis) data for the<br />
Sola and the below-described Huutokoski-Orivesi<br />
183
Geological Survey of Finland, Special Paper 59<br />
Suvi Heinonen, Asko Kontinen, Hanna Leväniemi, Ilkka Lahti, Niina Junno, Maija Kurimo and Emilia Koivisto<br />
zones reported by Gaal et al. (1975), the area is<br />
characterized by kilometre-scale isoclinal folding<br />
with very steeply west-dipping axial planes and<br />
30–50° plunging axes. Gaal et al. (1975) interpreted<br />
the structure at Sola to be an overturned synform<br />
overprinting older, very large recumbent folding<br />
that is seen in the outcrops as refolded isoclinal<br />
folds (F3).<br />
The Huutokoski-Orivesi sheet at Ahoniemi (K)<br />
is a 1–4-km-wide N–S-oriented fault-bound sheet<br />
of sand-dominated Upper Kaleva-type metaturbidite<br />
schists, extending over 70 km from Huutokoski<br />
in the north to Orivesi in the south. The<br />
orientation of bedding, foliation and, most likely,<br />
stretching lineation of the schist are remarkably<br />
consistent. Foliations are mostly 50–70° south–<br />
southwest dipping over the whole sheet and lineations<br />
20–60° S –SW plunging. At Ahoniemi, where<br />
the SNTL crosses the Huutokoski-Orivesi sheet,<br />
the typical figures for foliation and lineation are<br />
50–70° W–SW and 30–50° S–SW, re<strong>sp</strong>ectively. As<br />
for the Sola shear zone, the structural data of Gaal<br />
et al. (1975) suggest kilometre-scale isoclinal folds.<br />
In the Ahoniemi area, there are a few narrow slivers<br />
of partly skarnoid metabasites (carbonate-altered<br />
and metamorphosed) along the eastern footwall<br />
contact. Otherwise, the Huutokoski-Orivesi sheet<br />
is without any observations of possible Outokumpu-type<br />
ultramafic–mafic-derived rocks. Gaal et<br />
al. (1975) marked the eastern footwall contact east<br />
of Sola with a narrow zone of mylonite schist.<br />
Epicontinental sediments fringing the Sotkuma<br />
basement inlier (L) form a narrow sheet of<br />
partly graphitic-sulphidic mica schist with 1–130<br />
m quartzites, calc-silicate-bearing quartzites, diopsides<br />
skarns, chlorite-biotite schist and various<br />
breccias and conglomerate rocks at its base between<br />
the mica schists of the Upper Kaleva type,<br />
as at Ahoniemi, and the Archaean gneisses of the<br />
Sotkuma inlier. Gaal et al. (1975) considered the<br />
basal quartzitic rocks “epicontinental” and suggested<br />
that they have directly deposited on palaeoweathered<br />
granitoid gneisses of the Sotkuma<br />
dome.<br />
The foliations of the sedimentary rocks fringing<br />
the Sotkuma dome dip 40 degrees W at the<br />
SNTL intersection. A thin strip of epicontinental<br />
sedimentary rocks, without much depth extension,<br />
is marked in the geological cross-section in<br />
Figure 16, although exactly at the profile line they<br />
may be missing. As is shown in the cross-section,<br />
the dome is also fringed on its southern margin by<br />
epicontinental conglomerates and quartzites (Laiti<br />
1985). Note here that the profile only crosses the<br />
very SW corner of the inlier. The gravity gradient<br />
south of the dome suggest the cover–basement<br />
interface to be dipping towards the south with a<br />
relatively shallow angle, and the sediment rock<br />
lid south of the dome is thus rather thin. Actually,<br />
the entire Pyhäselkä block south of the Sola inlier<br />
appears to be a basement block with only a thin,<br />
gently folded (E–W hinge lines) if not almost flatlying<br />
sediment cover. The very different deformation<br />
pattern in the Pyhäselkä block compared to<br />
that of the above-described Huutokoski-Orivesi<br />
zone is a striking contrast, but obviously as such<br />
a key a<strong>sp</strong>ect in understanding the structure of the<br />
North Karelia schist belt.<br />
The traditional interpretation of the 10 x 20 km<br />
Sola basement inlier (M), mainly comprising late<br />
Archaean granitic gneissic rocks plus Proterozoic<br />
mafic dykes, is a structural dome or a fault-bound,<br />
uplifted basement block (e.g. Gaal et al. 1975, Kohonen<br />
1995, Park & Doody 1987). Possible interpretations<br />
of Sola inlier also include it being a relatively<br />
thin thrust lens pushed from the west or sheet in<br />
the sedimentary. Based on gravity modelling, Ruotoistenmäki<br />
& Tervo (2006) have proposed that the<br />
inlier would represent an approximately 4-kmthick<br />
thrust lens while. Sorjonen-Ward (2006)<br />
has interpreted the inlier as a 2-km-thick thrust<br />
sheet, stating that at least the eastern margin of<br />
the inlier is evidently a thrust contact. The FIRE3<br />
seismic reflection profile indicates distinct layered<br />
reflectivity below the inlier, down to a depth of 10<br />
km (black lines in the sketch pick up some major<br />
reflector traces). Sorjonen-Ward (2006) interpreted<br />
the reflectivity by correlatives of the Höytiäinen<br />
domain sediments below the inlier, down to 10 km<br />
depth. However, gravity maps suggest that the inlier<br />
would have a subsurface extent, under only a<br />
thin sediment cover, at least 7–8 km further east<br />
of its exposed east contact. Furthermore, a recent<br />
deep-sounding AMT survey has found crust below<br />
the inlayer free of conductors at least down to a<br />
depth of 8–9 km, de<strong>sp</strong>ite the fact that highly conductive<br />
N–S-running units comprise a major part<br />
of the strata in the Höytiäinen domain.<br />
The gneisses as exposed in the surface part of<br />
the Sola basement inlier seem an inappropriate<br />
source of the layered reflectivity deeper below the<br />
inlier, even noting the abundant mafic dykes along<br />
its eastern contact. In the FIRE3 seismic reflection<br />
profile, similar reflectivity fabric to the Sotkuma<br />
inlier is only seen in the presumably Archaean<br />
basement below the Outokumpu allochthon and<br />
184
Geological Survey of Finland, Special Paper 59<br />
Sukkulansalo National Test Line in Outokumpu: A ground reference for deep exploration methods<br />
Maarianvaara granite domain. Furthermore, we<br />
note the stark difference in the reflectivity of the<br />
Archaean crust between the strongly reflective Iisalmi<br />
and seismically almost tran<strong>sp</strong>arent Ilomantsi<br />
blocks. Consequently, the relatively reflective<br />
crust below the North Karelia Schist belt could be a<br />
continuation of that in the Iisalmi rather than the<br />
Ilomantsi block.<br />
Even though the metasediments immediately<br />
east of the Sotkuma inlier appear to dip at an approximately<br />
40° angle below the inlier, this cannot<br />
be considered a permissible interpretation. The<br />
best explanation seems to be that the east contact<br />
was actually defined by a somewhat steeper<br />
than 40° west-dipping fault with a reverse dip-slip<br />
component. The gravity anomaly maps and FIRE3<br />
image consistently indicate that the western contact<br />
of the Sotkuma inlier was west dipping at an<br />
angle of less than 45°. Consequently, at the Sola<br />
shear about 4 km west of the inlier, the Archaean-Proterozoic<br />
contact would be at the depth of<br />
c. 4 km. Based on the assumptions presented<br />
above, at this same depth further to the west, bodies<br />
of young Maarianvaara granite could appear.<br />
CONCLUSIONS<br />
The Sukkulansalo National Test Line (SNTL) is located<br />
in the historical mining district of Outokumpu,<br />
Finland. High-resolution seismic reflection<br />
data, audio-magnetotelluric (AMT) measurements,<br />
gravity modelling and deep penetrating ZTEM (Zaxis<br />
tipper electromagnetic) data supplemented<br />
with geological interpretation provide a ground<br />
reference for the development and testing of new<br />
deep exploration methods.<br />
In addition to massive sulphide ore, sulphidebearing<br />
black schists are the main cause of conductivity<br />
anomalies in the SNTL area. This is demonstrated<br />
in the ZTEM inversion results as abundant<br />
conductive anomalies that in some locations also<br />
coincide with seismic reflectors. Black schists have<br />
probably acted as sliding surfaces during past tectonic<br />
evolution and are thus also reflective due<br />
to the acoustic impedance contrast with the surroundings.<br />
In gravity data, black schists are not<br />
separable from the mica gneisses that dominate<br />
the geology in SNTL area due to the lack of density<br />
contrast, and there is no clear correlation between<br />
the gravity and ZTEM results. Seismic reflection<br />
data and the results of forward modelling of gravity<br />
data are compatible due to the fact that both<br />
methods re<strong>sp</strong>ond to changes in density.<br />
All available geophysical data sets consistently<br />
show a similar base contact for the basal part of the<br />
Outokumpu allochthon in the northwestern part of<br />
the SNTL, in Saarivaara. The allochthon is underlain<br />
by a so-called Saarivaara imbricate package,<br />
characterized by strong reflectivity due to gneisses,<br />
quartzites, amphibolites, calc-silicate rocks<br />
and black schists having varying acoustic properties.<br />
The presence of black schist results in conductivity<br />
anomalies in ZTEM and AMT data, while<br />
high-density amphibolites might be the main<br />
reason for the gravity anomaly. The continuation<br />
of Saarivaara-type reflectivity, or the base of the<br />
Outokumpu allochthon, can be followed on seismic<br />
reflection profile V7 towards the southeast at<br />
depths of 3–4 km.<br />
The geological cross-section of the SNTL suggests<br />
the presence of low-density young granites<br />
along the SNTL underneath the Outokumpu allochthon,<br />
characterized in the seismic reflection<br />
profile by tran<strong>sp</strong>arent areas. The shapes of Miihkali<br />
and Sukkulanjoki synforms can be identified<br />
from the seismic reflection data, and these thrustrelated<br />
synformal structures are also characterized<br />
by conductivity anomalies due to the presence of<br />
black schists.<br />
Currently, the lack of deep drill holes and systematic<br />
structural geological mapping prevents<br />
the detailed interpretation of the SNTL geology.<br />
Furthermore, in situ petrophysical studies are required<br />
to link geological observations to geophysics,<br />
and to improve the inversions and interpretation<br />
of the geophysical data. However, results<br />
presented in this paper provide a solid basis and<br />
reference data for the future deep exploration efforts<br />
by providing geological framework that can<br />
be used to build structural model of the ore deposits<br />
in the area and even to aid targeting of the drilling.<br />
E<strong>sp</strong>ecially interesting are anomalous features<br />
in the geophysical data that are not explained by<br />
the current geological model.<br />
185
Geological Survey of Finland, Special Paper 59<br />
Suvi Heinonen, Asko Kontinen, Hanna Leväniemi, Ilkka Lahti, Niina Junno, Maija Kurimo and Emilia Koivisto<br />
REFERENCES<br />
Aihemaiti, M. 2014. Seismic reflection method for ore exploration<br />
in Outokumpu area, Finland: Insights from<br />
data processing. Master’s thesis in Geophysical Pro<strong>sp</strong>ecting,<br />
University of Camerino, School of Science and<br />
Technology, Geology Division.<br />
Airo, M.-L. (ed.) 2005. Aerogeophysics inFinland<br />
1972-2004:Methods, System Characteristics and Application.<br />
Geological Survey of Finland, Special Paper<br />
39. 197 p.<br />
Airo, M.-L., Säävuori, H. & Vuoriainen, S. 2011. Petrophysical<br />
properties of the Outokumpu deep drill core<br />
and the surrounding bedrock. In: Kukkonen, I. T. (ed.)<br />
Outokumpu Deep Drilling Project 2003-2010. Geological<br />
Survey of Finland, Special Paper 51, 63−82.<br />
Bedrock of Finland − DigiKP. Digital map database [Electronic<br />
resource]. E<strong>sp</strong>oo: Geological Survey of Finland<br />
[referred 01.01.2016]. Version 2.0.<br />
Eaton, D. 1997. BMOD3D: A program for three-dimensional<br />
seismic modelling using Born approximation.<br />
Geological Survey of Canada. Open File 3357. 25 p.<br />
Elbra, T., Karlqvist, R., Lassila, I., Haeggström, E. & Pesonen,<br />
L. 2011. P- and S-wave velocities from the upper<br />
1.5 km crustal section sampled by the Outokumpu<br />
deep drilling project, Finland. In: Kukkonen, I. T. (ed.)<br />
Outokumpu Deep Drilling Project 2003-2010. Geological<br />
Survey of Finland, Special Paper 51, 95−104.<br />
Gaál, G., Koistinen T. & Mattila, E. 1975. Tectonics and<br />
stratigraphy of the vicinity of Outokumpu, North Karelia,<br />
Finland. Geological Survey of Finland Bulletin<br />
271. 67 p.<br />
Grant, F. S. & West, G. F. 1965. Interpretation Theory<br />
in Applied Geophysics. McGraw Hill Book Company.<br />
584 p.<br />
Heinonen, S., Heikkinen, P. J., Kousa, J., Kukkonen, I.<br />
T. & Snyder, D. B. 2013. Enhancing hardrock seismic<br />
images: reprocessing of high resolution seismic reflection<br />
data from Vihanti, Finland. Journal of Applied<br />
Geophysics 93, 1−11.<br />
Huhma. A. 1971a Kontiolahti. Geological Map of Finland<br />
1:100 000, Pre-Quaternary Rocks, Sheet 4224. Geological<br />
Survey of Finland.<br />
Huhma, A. 1971b. Outokumpu. Geological Map of Finland<br />
1:100 000, Pre-Quaternary Rocks, Sheet 4222. Geological<br />
Survey of Finland.<br />
Huhma, A. 1971c. Sivakkavara. Geological Map of Finland<br />
1:100 000, Pre-Quaternary Rocks, Sheet 4311. Geological<br />
Survey of Finland.<br />
Huhma, A. 1975. Outokummun, Polvijärven ja Sivakkavaaran<br />
kartta-alueiden kallioperä. Summary: Precambrian<br />
rocks of the Outokumpu, Polvijarvi and Sivakkavaara<br />
map-sheet areas, sheets 4222, 4224 and<br />
4311. Geological Survey of Finland. 151 p.<br />
Huhma, A. 1976. New a<strong>sp</strong>ects to the geology of the Outokumpu<br />
region. Bulletin of Geological Society of Finland<br />
48, 5−24.<br />
Ketola, M. 1973. Outokummun alueen geofysiikasta. Outokumpu<br />
Oy:n malminetsinnän raportit. 34 p.<br />
Kohonen. J. 1995. From continental rifting to collisional<br />
crustal shortering - Paleoproterozoic Kaleva metasediments<br />
of the Höytiäinen area in North Karelia, Finland.<br />
Geological Survey of Finland, Bulletin 380. 79 p.<br />
Koistinen, T. 1981. Structural evolution of an early Proterozoic<br />
strata-bound Cu-Co-Zn deposit, Outokumpu,<br />
Finland. Transactions of the Royal Society of Edinburgh:<br />
Earth Sciences, 72, 115-158.<br />
Koivisto, E., Malehmir, A., Heikkinen, P. J., Heinonen,<br />
S. & Kukkonen, I. T. 2012. 2D reflection seismic investigations<br />
at the Kevitsa Ni-Cu-PGE deposit, northern<br />
Finland. Geophysics. 77 p. WC149–WC162.<br />
Komminaho, K., Koivisto, E., Heikkinen, P. J., Tuomi,<br />
H., Junno, N. & Kukkonen, I. 2016. Seismic ore exploration<br />
in the Outokumpu area, Eastern Finland:<br />
Constraints from seismic forward modeling and geometrical<br />
considerations. In: Aatos, S. (ed.) Developing<br />
Mining Camp Exploration Concepts and Technologies<br />
– Brownfield Exploration Project 2013–2016. Geological<br />
Survey of Finland, Special Paper 59. (this volume)<br />
Kontinen, A. & Säävuori, H. 2013. Geologic correlation<br />
and significance of the prominent Saarivaara reflector<br />
from the HIRE V7 vibroseismic survey in the Outokumpu<br />
area. Geological Survey of Finland, Report of<br />
Investigation 198, 8–85.<br />
Kukkonen, I. T. & Lahtinen, R. (eds) 2006. Finnish reflection<br />
experiment 2001–2005. Geological Survey of<br />
Finland, Special Paper 43. 247 p.<br />
Kukkonen, I. T., Heikkinen, P. J., Heinonen, S., Laitinen,<br />
J., Sorjonen-Ward, P. & HIRE Working Group of<br />
the Geological Survey of Finland 2012. HIRE Seismic<br />
Reflection Survey in the Outokumpu-Polvijärvi Cu-<br />
Co-Zn mining and exploration area, Eastern Finland.<br />
Geological Survey of Finland, archive report 55/2012.<br />
64 p.<br />
Kurimo, M., Lahti, I. & Nousiainen, M. 2016. ZTEM survey<br />
in the Outokumpu region. In: Aatos, S. (ed.) Developing<br />
Mining Camp Exploration Concepts and<br />
Technologies – Brownfield Exploration Project 2013–<br />
2016. Geological Survey of Finland, Special Paper 59.<br />
(this volume)<br />
Laajoki, K. 1998. Karjalaiset liuskealueet. In: Lehtinen,<br />
M., Nurmi. P. & Rämö, T. (eds) Suomen kallioperä:<br />
3000 vuosimiljoonaa. Helsinki: Suomen Geologinen<br />
Seura ry. 375 p<br />
Laajoki, K. & Paakkola, J. 1988. Sedimentology of the Precambrian<br />
formations in eastern and northern Finland.<br />
Geological Survey of Finland, Special Paper 5. 264 p.<br />
Lahti, I., Leväniemi, H., Kontinen, A., Sorjonen-Ward,<br />
P., Aatos, S. & Koistinen, E. 2016. Geophysical surveys<br />
of the Miihkali area, Eastern Finland. In: Aatos, S.<br />
(ed.) Developing Mining Camp Exploration Concepts<br />
and Technologies – Brownfield Exploration Project<br />
2013–2016. Geological Survey of Finland, Special Paper<br />
59. (this volume)<br />
Laiti, O. 1985. Joensuu. Geological Map of Finland 1:100<br />
000, Pre-Quaternary Rocks, sheet 4223. Geological<br />
Suvey of Finland.<br />
Leväniemi, H. 2016. Petrophysical parameters and potential<br />
field modelling in the Outokumpu Belt. In:<br />
Aatos, S. (ed.) Developing Mining Camp Exploration<br />
Concepts and Technologies – Brownfield Exploration<br />
Project 2013–2016. Geological Survey of Finland, Special<br />
Paper 59. (this volume)<br />
Park, A. F. & Doody, J. J. 1987. Structural styles in the<br />
deep-levels of a foreland thrust belt: the Kaavi-Outokumpu<br />
area of the Savo thrust belt, the Svecokarelides,<br />
East Finland. In: Geological Association of Canada<br />
& Mineralogical Association of Canada 1987 joint<br />
annual meeting, May 25-27, 1987, Saskatoon. Program<br />
with abstracts 12, p. 78.<br />
Peltola, E. 1978. Origin of Precambrian copper sulfides of<br />
the Outokumpu district, Finland. Economic Geology<br />
and the Bulletin of the Society of Economic Geologists,<br />
73(4), 461−477.<br />
Penttilä, E. 1972. Selostus räjäytysseismologisesta kairanreikämittauskokeilusta<br />
Hammaslahdessa 3-4.10.1972.<br />
Outokumpu Oy:n malminetsinnän raportit. 12 p.<br />
Rasilainen, K., Eilu, P., Halkoaho, T., Karvinen, A., Kontinen,<br />
A., Kousa, J., Lauri, L., Luukas, J., Niiranen, T.,<br />
Nikander, J., Sipilä, P., Sorjonen-Ward, P., Tiainen,<br />
186
Geological Survey of Finland, Special Paper 59<br />
Sukkulansalo National Test Line in Outokumpu: A ground reference for deep exploration methods<br />
M., Törmänen, T. & Västi, K. 2014. Quantitative assessment<br />
of undiscovered resources in volcanogenic<br />
massive sulphide deposits, porphyry copper deposits<br />
and Outokumpu-type deposits in Finland. Geological<br />
Survey of Finland, Report of Investigation 208. 393 p.<br />
Available at: http://tupa.gtk.fi/julkaisu/tutkimusraportti/tr_208.pdf<br />
(electronic publication)<br />
Ruotoistenmäki, T. & Tervo, T. 2006. Geophysical characteristics<br />
of Outokumpu area, SE Finland. Geological<br />
Survey of Finland, Report of Investigation 162. 37 p.<br />
Saalman, K. & Laine, E. 2014. Structure of the Outokumpu<br />
ore district and ophiolite-hosted Cu–Co–Zn–<br />
Ni–Ag–Au sulfide deposits revealed from 3D modeling<br />
and 2D high-resolution seismic reflection data. Ore<br />
Geology Reviews 62,156−180.<br />
Salisbury, M. H., Harvey, C. & Matthews, L. 2003. The<br />
acoustic properties of ores and host rocks in hardrock<br />
terranes. Hardrock Seismic Exploration10, 9−19.<br />
Schön, J. H. 2004. Physical properties of rocks: Fundamentals<br />
and principles of petrophysics (1st paperback<br />
ed.). Amsterdam: Elsevier.<br />
Sorjonen-Ward, P. 2006. Geological and structural<br />
framework and preliminary interpretation of the FIRE<br />
3 and FIRE 3A reflection seismic profiles, central Finlan.<br />
In: Kukkonen, I. T. & Lahtinen, R. (eds) Finnish<br />
Reflection Experiment FIRE 2001–2005. Geological<br />
Survey of Finland, Special Paper 43, 105–160.<br />
Västi, K. 2011. Petrology of the drill hole R2500 at Outokumpu,<br />
eastern Finland – the deepest drill hole ever<br />
drilled in Finland. In: Kukkonen, I. T. (ed.) Outokumpu<br />
Deep Drilling Project 2003-2010. Geological Survey of<br />
Finland, Special Paper 51, 17−46.<br />
187
Geological Survey of Finland, Special Paper 59<br />
Suvi Heinonen, Asko Kontinen, Hanna Leväniemi, Ilkka Lahti, Niina Junno, Maija Kurimo and Emilia Koivisto<br />
188
Developing Mining Camp Exploration Concepts and Technologies – Brownfield Exploration Project 2013–2016<br />
Edited by Soile Aatos<br />
Geological Survey of Finland, Special Paper 59, 189–214, 2016<br />
REGIONAL ANALYSIS OF HYDROTHERMAL NICKEL<br />
PROSPECTIVITY IN THE OUTOKUMPU MINERAL DISTRICT<br />
by<br />
Soile Aatos<br />
Aatos, S. 2016. Regional analysis of hydrothermal nickel pro<strong>sp</strong>ectivity in<br />
the Outokumpu Mineral District. Geological Survey of Finland, Special Paper 59,<br />
189−214, 13 figures and 4 tables.<br />
This paper describes the methodology and analysis of the regional pro<strong>sp</strong>ectivity<br />
of hydrothermal nickel in the Outokumpu Mineral District.This<br />
forms a case study which is part of the Developing Mining Camp Exploration<br />
Concepts and Technologies − Brownfield Exploration project that<br />
focused on developing deep exploration concepts and technologies for<br />
Outokumpu-type metal deposits in crystalline bedrock areas.<br />
Although the focus in future metal exploration and mining is gradually<br />
concentrated in greater depths, the key to understanding deep ore potential<br />
is still grounded on a good understanding of the geology of the Earth’s<br />
surface. Evolving mineral deposit concepts, good geophysical and geochemical<br />
data coverage and modern GIS modelling tools enable us to identify<br />
and evaluate regional geological characteristics and the related metal<br />
potential of brownfield areas.<br />
In this semi-quantitative study, pseudo-lithological features of the Outokumpu<br />
Mineral District were mapped from airborne electromagnetic and<br />
magnetic data using GIS technology and tools. Geochemical data were also<br />
used to delineate the regional to target scale pro<strong>sp</strong>ective areas for followup<br />
exploration of Outokumpu-type hydrothermal nickel deposits using GIS<br />
fuzzy modelling techniques.<br />
Keywords: nickel, pro<strong>sp</strong>ectivity mapping, GIS, models, geophysical data,<br />
geochemical data, Outokumpu, Miihkali, Maarianvaara, Eastern Finland,<br />
Finland<br />
Geological Survey of Finland, P.O. Box 1237, FI-70211 Kuopio, Finland<br />
E-mail: soile.aatos@gtk.fi<br />
189
Geological Survey of Finland, Special Paper 59<br />
Soile Aatos<br />
INTRODUCTION<br />
After a century of exploration and mining activities,<br />
the regional Outokumpu-type metal potential<br />
of Northern Karelia, Finland (Fig. 1), has recently<br />
been quantitatively assessed by Rasilainen et al.<br />
(2014). They focused on the still undiscovered resources<br />
of copper, zinc, cobalt and nickel a permissive<br />
tract area of ca. 9800 km 2 to the depth of<br />
one kilometre and estimated a median tonnage of<br />
580,000 t Cu, 220,000 t Zn, 53,000 t Co and 41,000<br />
t Ni in one Outokumpu-type permissive tract area.<br />
Genetic models of Outokumpu-type deposits in<br />
tectonized and metasomatized serpentinites have<br />
previously been described by Kontinen et al. (2006)<br />
and Peltonen et al. (2008) for the period from 1921<br />
to 1999. Saalmann & Laine (2014) pointed out the<br />
significance of deep structural controls on the ore<br />
deposit settings after Kontinen et al. (2006), Peltonen<br />
et al. (2008) and Kukkonen et al. (2012).<br />
Zhang et al. (2006) concluded, based on their fluid<br />
flow modelling results, that multiphase regional<br />
structural processes affected hydrothermal events<br />
at Kylylahti, Polvijärvi, and thus also the metal<br />
enrichment and remobilization in the Outokumpu<br />
nappe area (Fig. 2). Peltonen et al. (2008) described<br />
Outokumpu as a Red Sea-type ophiolitic<br />
ore deposit originating from a tectonic setting resembling<br />
Phanerozoic passive margins.<br />
Due to the ongoing active exploration and mining<br />
in the Outokumpu Mineral District (Fig. 2),<br />
GIS-based raster calculation and knowledgedriven<br />
fuzzy logic pro<strong>sp</strong>ectivity modelling techniques<br />
were here used to identify tectonized<br />
Palaeoproterozoic mantle peridotites associated<br />
with Outokumpu-type nickel metallogeny that<br />
were described in Kontinen et al. (2006) and Peltonen<br />
et al. (2008) as having potential for hydrothermal<br />
nickel sulphides.<br />
The concept for producing an Outokumputype<br />
ore deposit model was initially developed in<br />
the GEOMEX J.V. project operating in Finland in<br />
1998–2003 (Kuronen et al. 2004, Kontinen et al.<br />
2006, Peltonen et al. 2008), and later modified<br />
by Kontinen (2014). Their conceptual model of<br />
Outokumpu-type mineralization consists of two<br />
sub-concepts, the Cu-rich proto ore and the secondary<br />
Ni-Co sulphide disseminations. During the<br />
course of this study work, an interesting report<br />
on the hydrothermal nickel-(PGE) potential related<br />
to accretionary environments was published<br />
(González-Álvarez et al. 2010, 2013), leading to a<br />
need to explore for similar nickel-(PGE) deposits in<br />
the Outokumpu region. In this study, supplementary<br />
exploration vectors are added to the previous<br />
concept of the Outokumpu-type Cu-Co-Zn mineral<br />
deposit model based on new exploration knowledge<br />
of accretionary ophiolitic environments.<br />
These include the role of chromium, lithium and<br />
PGE as possible indicators of hydrothermal nickel-<br />
PGE and lithium deposits in the Outokumpu-type<br />
geological settings.<br />
190
Geological Survey of Finland, Special Paper 59<br />
Regional analysis of hydrothermal nickel pro<strong>sp</strong>ectivity in the Outokumpu Mineral District<br />
Fig. 1. The Outokumpu Mineral District (black quadrangle) is located in the Karelian metasedimentary border<br />
zone (light blue) partly thrust during the Svecofennian orogeny on the Archaean basement (beige) of the Karelian<br />
craton (Lahtinen et al. 2009). The Outokumpu Mining Camp area of the present project, also coinciding<br />
the ZTEM flight survey area (Kurimo et al. 2016), is outlined as a black octagon inside the Outokumpu Mineral<br />
District area. Bedrock map: Digital Bedrock Map Database of Finland (Bedrock of Finland − DigiKP).<br />
191
Geological Survey of Finland, Special Paper 59<br />
Soile Aatos<br />
Fig. 2. Lithology of the Outokumpu Mineral District modified from the 1:200 000 scaled Bedrock of Finland −<br />
DigiKP showing the main Outokumpu ore deposits. The modelling study area covers the Finnish 1:100 000 map<br />
sheet areas 4221 Heinävesi, 4222 Outokumpu, 4223 Joensuu, 4224 Kontiolahti, 4311 Luikonlahti (Sivakkavaara)<br />
and 4313 Koli (framed by black lines), coinciding with the area of the GEOMEX project (Kuronen et al. 2004).<br />
The Outokumpu Mining Camp area is outlined as a grey octagon inside the Outokumpu Mineral District area.<br />
Geological line features: thrust faulting (triangulated), major faulting (black), a minor fault (dashed) and black<br />
shales (purple). The <strong>sp</strong>atial reference of the study was Finland zone 3 (KKJ 3). Ore deposits: GTK digital archives<br />
(see FODD 2015).<br />
192
Geological Survey of Finland, Special Paper 59<br />
Regional analysis of hydrothermal nickel pro<strong>sp</strong>ectivity in the Outokumpu Mineral District<br />
MATERIALS AND METHODS<br />
GIS-based tools and integrative computational<br />
analyses have been used in predicting regional<br />
metal pro<strong>sp</strong>ectivity for over 20 years (e.g. Harris<br />
et al. 2000, Bonham-Carter & Cheng 2008,<br />
Nykänen 2008, Porwal & Kreuzer 2010, Leväniemi<br />
2013, Torppa et al. 2015). However, recent developments<br />
in proxy setting and pro<strong>sp</strong>ectivity analysis<br />
in regional nickel pro<strong>sp</strong>ectivity mapping has been<br />
undertaken also, for example, in Zimbabwe by<br />
Markwitz et al. (2010), and for Avebury-style hydrothermal-remobilized<br />
nickel mineral systems in<br />
Australia by González-Álvarez (2010) and Lisitsin<br />
et al. (2013).<br />
In this study the conceptualization modelling<br />
approaches presented in the above papers were integrated<br />
with the model of Outokumpu-type mineral<br />
deposits by Peltonen et al. (2008) and summarized<br />
in Rasilainen et al. (2014). The vectors used<br />
for producing pro<strong>sp</strong>ectivity analysis of the nickel<br />
sulphide pro<strong>sp</strong>ectivity map for Outokumpu Mineral<br />
District are listed and described in Table 1.<br />
This study concentrated on outlining the practical<br />
features and constraints (Tables 1–3) revealed<br />
by geophysical and geochemical GIS data related to<br />
the pro<strong>sp</strong>ectivity of secondary Ni sulphides originating<br />
along with serpentinization processes in<br />
the Outokumpu nappe complex. Visualization and<br />
enhancement techniques used by Airo (2015) were<br />
applied to Outokumpu-type geophysical anomalies<br />
for enhancing pro<strong>sp</strong>ective areas and for the<br />
selection of additional geophysical vectors for<br />
modelling within the GIS. The study area was extended<br />
to match the previous GEOMEX project area<br />
delineation and was not restricted to the present<br />
mining camp project covering just the ZTEM flight<br />
area. This provides a wider area to explore (Fig. 2),<br />
and also matches the area in which a regional 3D<br />
geological interpretation of the mineral district<br />
was undertaken (see Aatos et al., this volume). The<br />
maximum depth of this pro<strong>sp</strong>ectivity analysis data<br />
varies from surficial to shallow, according to the<br />
airborne electromagnetic (EM, 70-100 m depth<br />
at its best) and surface gamma-ray <strong>sp</strong>ectrometry<br />
data (Airo et al. 2014) used. The pro<strong>sp</strong>ectivity<br />
model would primarily be considered a 2D model.<br />
The presented 2D pro<strong>sp</strong>ectivity analysis was<br />
based on existing geological, geochemical or geophysical<br />
data as summarized in Table 1. Airo (2015)<br />
has established the high magnetic susceptibility<br />
and some other characteristic geophysical features<br />
of Outokumpu ore (e.g. density, conductivity and<br />
Königsberger ratio) and Outokumpu-type anomalies<br />
(classified regional airborne conductivity and<br />
magnetic anomaly maps). Kontny & Dietze (2014)<br />
noted that magnetite and monoclinic pyrrhotite<br />
of ferromagnetic metaperidotite result in the<br />
high magnetic susceptibility of the Outokumpu<br />
assemblage. GTK’s in-house interpreted airborne<br />
electromagnetic (EM), magnetic and radiometric<br />
uranium data (Airo et al. 2014, Airo 2015) along<br />
with regional till geochemical (Salminen 1995)<br />
and lithogeochemical data (Rasilainen et al. 2007,<br />
2008) were used to produce the Ni mineral pro<strong>sp</strong>ectivity<br />
maps of the Outokumpu region (Tables<br />
1 and 2).<br />
A geoprocessing tool for <strong>sp</strong>atial data modelling<br />
using fuzzy logic was used to build experimental<br />
models to produce pro<strong>sp</strong>ectivity maps (Sawatzky<br />
et al. 2009) based on Outokumpu-type exploration<br />
vectors. Figure 3 presents an example of a built<br />
fuzzy logic model to produce a preliminary Ni pro<strong>sp</strong>ectivity<br />
map based on Outokumpu-type exploration<br />
vectors (Table 2).<br />
In the data conditioning phase, the point geochemical<br />
data were interpolated using a nearest<br />
neighbor algorithm for the till data and an inversed<br />
distance weighting algorithm for the lithogeochemical<br />
data due to the irregular or scattered<br />
sample points grid and non-normal distribution<br />
of the data values (Table 2). Whole-rock analyses<br />
in the Finnish lithogeochemical rock geochemistry<br />
database (RGDB) data (Rasilainen et al. 2007,<br />
2008) were used to compute CIPW norms with the<br />
R application Geochemical Data Toolkit (GCDkit)<br />
(Janoušek et al. 2006) to test whether there were<br />
any differences in Mg-bearing mineralogical distributions<br />
in the region (Tables 1 and 2).<br />
As an intermediate product in the GIS pro<strong>sp</strong>ectivity<br />
analysis process a 2D pseudo-lithological<br />
interpretation (Fig. 4) based on airborne magnetic<br />
and apparent resistivity data (Airo et al. 2014) was<br />
also used in the modelling.<br />
For the basis of this work, I compiled a set of<br />
exploration proxies conducted from the available<br />
geophysical and geochemical data and a pro<strong>sp</strong>ectivity<br />
analysis workflow for the Outokumpu-type<br />
secondary Ni sulphide disseminations (Tables 1<br />
and 2). As a result of applying the methodology and<br />
tools described in the previous sections, I produced<br />
a 2D computational GIS interpretation process<br />
for the Outokumpu-type secondary Ni potential<br />
occurring in or in relation to the serpentinized<br />
193
Geological Survey of Finland, Special Paper 59<br />
Soile Aatos<br />
Table 1. A simplified conceptual mineral system model for Outokumpu-type hydrothermal Ni deposits modified<br />
after Peltonen et al. (2008), Markwitz et al. (2010) and Lisitsin et al. (2013), and exploration vectors used for<br />
Outokumpu Mineral District pro<strong>sp</strong>ectivity modelling.<br />
Mineral systems<br />
concept<br />
Exploration vector<br />
Signature or re<strong>sp</strong>onse for modelling<br />
Availability of Ni<br />
source<br />
Mobility of Ni<br />
(endogenous<br />
hydrothermal<br />
processes caused<br />
by regional metamorphism)<br />
Mobility of Ni<br />
(introduced by<br />
hydrothermal<br />
activity)<br />
Deposition of Ni<br />
Presence of ultramafic rocks containing<br />
ophiolitic packages, ultramafic<br />
rocks (picritic basalts >12% MgO)<br />
Magnetite and Mg-bearing minerals<br />
formed after disintegration of olivine<br />
Serpentinization<br />
Skarnification<br />
Introduction of U<br />
Introduction of Cr (secondary),<br />
Li and B<br />
Deposition of sulphides (black<br />
schists) vs. trap (tectonic contacts)<br />
Deposition of sulpharsenides, sulphosalts<br />
(granitoids, black schists) vs.<br />
trap (tectonic contacts)<br />
Regional: Ultramafics detected in the area of<br />
interest<br />
Targeting: Olivine or hypersthene in CIPW norm<br />
(Cross et al. 1902), lithogeochemical data<br />
Regional: Positive airborne magnetic anomalies<br />
associated with massive magnetite occurrences<br />
within ultramafic rocks<br />
Regional: High simultaneous airborne EM imaginary<br />
(quadrature) component and magnetic<br />
anomalies associated with serpentinites and<br />
skarns<br />
Regional to site-<strong>sp</strong>ecific targeting: High acid<br />
(aq. reg.) leachable Mg concentrations in till<br />
(reflecting the presence of serpentine and/or<br />
magnesite)<br />
Regional: Airborne U anomalies<br />
Targeting: High U concentration in lithogeochemical<br />
data<br />
Regional to site <strong>sp</strong>ecific targeting: High acid<br />
(aq. reg.) leachable Cr and Li anomalies in till.<br />
Detected boron-bearing minerals in bedrock<br />
Regional: High conductivity due to possible<br />
pyrrhotite and other conductive metal sulphides,<br />
mainly in black schists<br />
Regional to site-<strong>sp</strong>ecific targeting: Identification<br />
of suitable nappes, thrust zones, shear zones<br />
and faults<br />
Regional to site-<strong>sp</strong>ecific targeting: High lithogeochemical<br />
concentrations of Cu and Pd<br />
Regional to site-<strong>sp</strong>ecific targeting: High acid<br />
leachable Cu, Co and Ni anomalies in till<br />
Site-<strong>sp</strong>ecific targets: Identification of podiform<br />
chromitites (stratigraphic constraint)<br />
Site-<strong>sp</strong>ecific targets: Identification of boron<br />
minerals related to high-strain zones<br />
194
Geological Survey of Finland, Special Paper 59<br />
Regional analysis of hydrothermal nickel pro<strong>sp</strong>ectivity in the Outokumpu Mineral District<br />
Fig. 3. An example of a fuzzy logic model built in this study. The model was built in a graphic user interphase of<br />
an object-oriented <strong>sp</strong>atial data model builder (Sawatzky et al. 2009). Fuzzy membership function algorithms<br />
based on the mean and standard deviation of the input data where either small or large values of data have high<br />
memberships (Sawatzky et al. 2009) were used. Mean multiplier and standard deviation multipliers were defined<br />
as 1. The application-<strong>sp</strong>ecific methods used to combine two or more membership data were overlay types AND,<br />
OR or GAMMA (Sawatzky et al. 2009).<br />
peridotites of the ophiolite bodies. Some of the<br />
most interesting of the produced pro<strong>sp</strong>ectivity<br />
maps are reported in this study (Figs. 4–10).<br />
In the case of brownfield exploration in mining<br />
camps, suitable bedrock maps that can be used<br />
for validating 2D GIS pro<strong>sp</strong>ectivity maps are often<br />
more abundant than in the greenfield areas,<br />
depending on the scope, number and quality of<br />
previous surface exploration programmes or observations.<br />
In this study area the Outokumpu hydrothermal<br />
nickel pro<strong>sp</strong>ectivity maps produced<br />
were validated based on expert knowledge and<br />
qualitative field-based observations.<br />
The regional pseudo-lithological model (Table<br />
2, Fig. 4) was validated in discussions with experienced<br />
geologists having expertise in regional<br />
bedrock and structural mapping of the Outokumpu<br />
Mineral District. The geophysical anomaly mapping<br />
based on pseudo-lithological composite geodatasets<br />
with cut-offs (Table 2, Figs. 5 and 6) were<br />
validated using data available from known ore deposits<br />
and mineral showings from the Outokumpu<br />
Mineral District (FODD 2015, layman’s samples<br />
and observations archived in the GTK database).<br />
Geochemical metal anomalies in till were validated<br />
visually together with boulder data (Table 2, Fig. 8).<br />
195
Geological Survey of Finland, Special Paper 59<br />
Soile Aatos<br />
Table 2. Regional data used for pro<strong>sp</strong>ectivity modelling. The pixel size of each raster was 50 m x 50 m. The electrical<br />
conductivity and radiation of bedrock is dependent not only on the mineral composition but as well as,<br />
for instance, on the texture and water content of the mineral material of the glacigenic overburden (Airo 2015).<br />
Local anthropogenic anomalies have been visually screened out in the expert validation phase, e<strong>sp</strong>ecially in the<br />
interpretation of radiometric U results, as there are anomalous <strong>sp</strong>ots because of some human land construction<br />
activities, such as mining waste dumps.<br />
Modelling<br />
data<br />
KKJ map<br />
sheet areas,<br />
1:100 000<br />
Reference<br />
Digital Bedrock of<br />
Bedrock Map Finland −<br />
Database, DigiKP<br />
1:200 000<br />
Apparent<br />
resistivity,<br />
real (in<br />
phase) and<br />
imaginary<br />
(quadrature)<br />
conductivity<br />
Magnetic<br />
Natural<br />
radioactivity<br />
Rock geochemistry<br />
database<br />
Till geochemistry<br />
database<br />
CIPW norm<br />
mineralogy<br />
Pseudolithology<br />
Airo et al.<br />
(2014)<br />
Airo et al.<br />
(2014)<br />
Airo et al.<br />
(2014)<br />
(Rasilainen<br />
et al. 2007,<br />
2008)<br />
Salminen<br />
(1995)<br />
In preparation<br />
(Aatos)<br />
This study<br />
Data<br />
provider<br />
National<br />
Land Survey<br />
of Finland<br />
(NLS)<br />
Geological<br />
Survey of<br />
Finland (GTK)<br />
Data<br />
domain<br />
Subject<br />
Land survey Geographical<br />
<strong>sp</strong>atial data<br />
Geology<br />
Bedrock<br />
geology<br />
Spatial data<br />
type or<br />
geometry<br />
Modelling<br />
parameters [range of<br />
raster value]<br />
Vector Study area (Fig. 2)<br />
Vector<br />
Background data for<br />
comparison (bedrock<br />
types, faults)<br />
GTK Geophysics Airborne EM Raster Electromagnetic anomalies:<br />
apparent resistivity<br />
= [0,5178], real (3 kHz)<br />
= [-2223,17144] and<br />
imaginary (3 kHz) =<br />
[-1856,11569]<br />
GTK Geophysics Airborne<br />
magnetics<br />
GTK Geophysics Airborne<br />
radiometrics<br />
GTK<br />
GTK<br />
S. Aatos,<br />
unpublished<br />
computational<br />
model<br />
evidence<br />
layer data<br />
This study,<br />
computational<br />
model<br />
evidence<br />
layer data<br />
Geochemistry<br />
Geochemistry<br />
Petrology<br />
Geophysics<br />
Regional lithogeochemistry<br />
Raster<br />
Raster<br />
Interpolated<br />
point data<br />
(raster)<br />
Regional geochemistry<br />
of till point data<br />
Interpolated<br />
(raster)<br />
Inferred<br />
regional ultramafic-mafic<br />
mineralogy<br />
Inferred<br />
regional bedrock<br />
geology<br />
Interpolated<br />
point data<br />
(raster)<br />
Multiplication<br />
of the<br />
values of two<br />
rasters on a<br />
cell-by-cell<br />
basis (raster)<br />
Magnetic anomalies<br />
(DGRF-65) =<br />
[-3240,9769]<br />
U anomalies of the<br />
Earth’s surface: U (eq.) =<br />
[-1.84,11.08]<br />
Ni, Cr, Cu and Pd anomalies<br />
of bedrock (ppm):<br />
Ni = [14,2722], Cr =<br />
[19,3138], Cu =[17,579],<br />
and Pd = [5,26]<br />
Mg, Ni, Cr, Cu, Co, Li<br />
anomalies of till (ppm):<br />
Mg = [836,41956],Ni =<br />
[3.1,859], Cr = [7.5,208],<br />
Cu = [5.8,303], Co =<br />
[1.9,90], Li = [0-95.9]<br />
Computationally interpreted<br />
olivine anomalies<br />
of rocks (%): ol = [0,68]<br />
Classified composite<br />
geodatasets:<br />
1) apparent resistivity<br />
(EM) * magnetic anomalies<br />
= [-6958404,<br />
17964170]<br />
2) quadrature component<br />
(EM) * magnetic<br />
anomalies<br />
= [-2311669.25,<br />
11987580]<br />
3) in-phase component<br />
(EM) * magnetic<br />
anomalies = [-13671361,<br />
50215728]<br />
196
Geological Survey of Finland, Special Paper 59<br />
Regional analysis of hydrothermal nickel pro<strong>sp</strong>ectivity in the Outokumpu Mineral District<br />
RESULTS<br />
The pseudo-lithological map (Fig. 4) was found to<br />
be useful for not only as inclusion in the pro<strong>sp</strong>ectivity<br />
modelling but also as an information source<br />
for bedrock mapping in places where geological<br />
information was <strong>sp</strong>arse. For example, regional<br />
pseudo-lithological map provided indications<br />
that the airborne geophysical anomalies probably<br />
caused by 2.2 Ga old diabase sills originating from<br />
low-Al or karjalitic magma (Nykänen et al. 1994),<br />
ultramafic rocks and Maarianvaara granitoid can be<br />
visually separated from Lower and Upper Kalevian<br />
metasedimentary rocks, or that Outokumpu and<br />
Miihkali nappes can be clearly mapped (Figs. 1, 2<br />
and 4).<br />
Fig. 4. Pseudo-lithological map of the study area based on airborne geophysical apparent resistivity and magnetic<br />
GIS raster data. The model area comprises six 1:100 000 map sheets (grey outline), an area about 7200 km 2<br />
in total. Colours of the model: purple = conductive and magnetic rock units (e.g. black schists), green = magnetic<br />
and resistive ground (karjalites, soapstone, Outokumpu-type talc rocks), blue = Lower Kalevian rock units, pale<br />
blue = Upper Kalevian rock units, and red = granitoids (e.g. Maarianvaara granite north-west of Vuonos). Raster<br />
data source: GTK (see e.g. Airo et al. 2014). Ore deposits: GTK digital archives (see FODD 2015).<br />
197
Geological Survey of Finland, Special Paper 59<br />
Soile Aatos<br />
Fig. 5. A pseudo-lithological map based on a composite quadrature and magnetic aerogeophysical GIS raster data<br />
(Table 2) with a model cut-off value coincide well with Outokumpu assemblage-type rock areas (e.g. serpentinites,<br />
skarns) or features having simultaneous high-electric imaginary (quadrature) and magnetic anomalies<br />
(grey to black areas). Metals reported from the layman’s bedrock observation database: Cu, Ni, Zn and U (GTK<br />
digital archives). Raster data source: GTK (see e.g. Airo et al. 2014). Base map: pseudolithological map from<br />
Figure 4.<br />
198
Geological Survey of Finland, Special Paper 59<br />
Regional analysis of hydrothermal nickel pro<strong>sp</strong>ectivity in the Outokumpu Mineral District<br />
Fig. 6. A pseudo-lithological map based on a composite in-phase EM and magnetic aerogeophysical GIS raster<br />
data (Table 2). The model delineates the conductive and magnetic pyrrhotite and other sulphides containing<br />
zones as overlapping high-electric EM real (in phase) component and magnetic anomalies (red purple). Lowmagnetic,<br />
high-conductive anomalies (blue violet) may correlate, for example, with highly graphitic schists,<br />
low-sulphide or pyrite-only black schists. Besides Outokumpu assemblage-type rocks, copper anomalies may<br />
be originated also from karjalitic rocks. Metals reported from the layman’s bedrock observation data: Cu, Ni, Zn<br />
and U (GTK digital archives). Raster data source: GTK (see e.g. Airo et al. 2014). Base map: pseudo-lithological<br />
map from Figure 4.<br />
199
Geological Survey of Finland, Special Paper 59<br />
Soile Aatos<br />
Fig. 7. A lithogeochemistry-based fuzzy logic pro<strong>sp</strong>ectivity model of the Outokumpu Mineral District suggesting<br />
areas of the most primitive ultramafic rocks with hydrothermal Ni (± PGE) potential (dark grey shading).<br />
The possible indications of chromitites (± related PGE minerals) as modelled based on the pseudo-lithological<br />
indications of serpentinite or ultramafic rock (Fig. 5), computed normative olivine in ultramafic rocks, and<br />
concentration of Cr, Ni, Cu or Pd in lithogeochemical data from the RGDB by Rasilainen et al. (2007, 2008) as<br />
conceptualized in Tables 1 and 2 (dark grey shading). Ore deposits: GTK digital archives (see FODD 2015). Base<br />
map: pseudo-lithological map from Figure 4.<br />
200
Geological Survey of Finland, Special Paper 59<br />
Regional analysis of hydrothermal nickel pro<strong>sp</strong>ectivity in the Outokumpu Mineral District<br />
Fig. 8. A till geochemistry-based fuzzy logic pro<strong>sp</strong>ectivity model (deep purple) of the Outokumpu Mineral District<br />
suggesting areas having potential for remobilized hydrothermal Ni (± PGE). During the GIS visualization<br />
experiments of regional metal anomalies (e.g. Cu, Co, Ni, Zn, Cr) in till before constructing Outokumpu-type<br />
pro<strong>sp</strong>ectivity models, anomalies of other than base metals, e.g. lithium, were also recognized. In the Paakkila-<br />
Kuusjärvi area, south-southwest of Maarianvaara granitoid, there exists a regional lithium anomaly (green dots)<br />
in till over an area of granite pegmatites related to a shear zone, which may indicate younger or more differentiated<br />
magmatic hydrothermal activity in the area compared to Maarianvaara granitoid. The lithium anomaly<br />
(24-95.9 ppm) appears to be in the close vicinity of maximum values of Outokumpu-type combined geophysical<br />
(pseudo-lithological serpentinite interpretation in Figure 5, airborne U) and till (Mg, Ni, Cr, Cu, Co) anomaly<br />
models (deep purple) (see model concepts in Tables 1 and 2). Purple circles mark nickel-mineralized boulders in<br />
the layman’s sample database of GTK. Base map: pseudo-lithological map from Figure 4.<br />
201
Geological Survey of Finland, Special Paper 59<br />
Soile Aatos<br />
Fig. 9. A 2D GIS view combining the two 2D geophysical GIS raster models from Figures 5 and 6, 2D GIS data on<br />
lithium anomalies in till within a range of 24 to 95.9 ppm from Figure 8, and 3D ZTEM inversion results (Kurimo<br />
et al. 2016, Lahti et al. 2016) interpolated with a cut-off value of 750 Ωm in a 3D grid (grey mesh), see also Figure<br />
11. Base map: pseudo-lithological map from Figure 4.<br />
202
Geological Survey of Finland, Special Paper 59<br />
Regional analysis of hydrothermal nickel pro<strong>sp</strong>ectivity in the Outokumpu Mineral District<br />
Fig. 10. Regional 2D GIS pro<strong>sp</strong>ectivity models with cut-off contours can be presented in same <strong>sp</strong>ace, for example,<br />
with 3D geological models to further visualize the pro<strong>sp</strong>ectivity scenarios in a 3D geology and mine planning<br />
software application. In this example, the main bedrock geological units of the Outokumpu Mineral District were<br />
visualized as 3D solid models (beige = Archaean basement, tran<strong>sp</strong>arent blue = Palaeoproterozoic metasedimentary<br />
rocks and red = Maarianvaara granitoid). An example of an Outokumpu-type fuzzy logic GIS pro<strong>sp</strong>ectivity<br />
model (orange contour = model cut-off value) based on geophysical and geochemical data of the Outokumpu<br />
Mineral District is visualized on top of the 3D geological solid model. The bedrock geological and fault interpretation<br />
were based on digital bedrock map of Finland (Bedrock of Finland − DigiKP), gravity map of GEOMEX project<br />
(Ruotoistenmäki 2006), pseudo-lithological interpretations of this study, and aerogeophysical raster data<br />
(Airo et al. 2014). The dimensions of the 3D solid model in this figure caption are about 80 km x 120 km x 5 km,<br />
corre<strong>sp</strong>onding to the 2D pro<strong>sp</strong>ectivity modelling area of this article.<br />
203
Geological Survey of Finland, Special Paper 59<br />
Soile Aatos<br />
Fig. 11. A figure caption of Outokumpu-type serpentinite-skarn model (grey-orange pixels), interpolated ZTEM<br />
3D inversion (Kurimo et al. 2016) results with with a cut-off value (deep purple), and lithium in till visualized in a<br />
common 3D GIS scenery with a solid model of Maariavaara granite (pink). The ZTEM model data reveal some unknown<br />
zones of deep conductivity beneath the Earth’s surface, e.g. the anomalous belt in Kuminvaara between<br />
the main Outokumpu Belt and Maarianvaara granitoid. Outlining of the research area as in Figure 2. Depth extent<br />
of the model ca. 2 km.<br />
DISCUSSION<br />
Underexplored hydrothermal nickel-(± PGE) pro<strong>sp</strong>ectivity of the Palaeoproterozoic<br />
Outokumpu ophiolite regime<br />
Global context of hydrothermal nickel-(PGE)<br />
deposits<br />
Interest in hydrothermal-remobilized type nickel-<br />
(PGE) deposits and systems has increased in recent<br />
years (González-Álvarez et al. 2013). The hydrothermal<br />
multi-metallic nickel ore type potential in<br />
collisional or accretionary environments of different<br />
ages related to mafic-ultramafic magmatic and<br />
ophiolitic rocks has been identified, for example in<br />
North and South Africa (Ghorfi et al. 2008, Markwitz<br />
et al. 2010), Canada (Chen et al. 1993, Heaman<br />
et al. 2009, Laznicka 2010), Western Australia<br />
(Pirajno et al. 2016) and in Russia (Grokhovskaya<br />
et al. 2009). Proterozoic Ni-PGE remobilizing hydrothermal<br />
processes and mineralization have also<br />
been detected in sediment-hosted environments<br />
(Distler et al. 2004), such as unconformities having<br />
U-Au potential (McCready et al. 2004, Cuzens<br />
2010). Many of these deposits have world-class<br />
mineral potential.<br />
According to the composite data, updated regional<br />
exploration vectors of remobilized hydrothermal<br />
Ni-(±PGE) deposits and the preliminary<br />
<strong>sp</strong>atial modelling results of this study imply that<br />
many of these global features can be identified from<br />
Outokumpu-type deposits (e.g. Kokka, Vuonos,<br />
Horsmanaho and Vasarakangas at Kylylahti, too.<br />
204
Geological Survey of Finland, Special Paper 59<br />
Regional analysis of hydrothermal nickel pro<strong>sp</strong>ectivity in the Outokumpu Mineral District<br />
Table 3. Hydrothermal Ni-Cr-(±PGE) deposits detected from Proterozoic to Palaeozoic collisional or accretionary<br />
environments. This particular branch of mineral occurrences has a variety of ages and deposition environments.<br />
Mineral<br />
system<br />
Avebury<br />
Sukhoi Log<br />
Location Ore type Age<br />
(ca. Ma)<br />
McIvor Hill<br />
Complex<br />
Lena Goldfield,<br />
Boidabo<br />
Synclinorium<br />
Low Cu, Ni with W,<br />
Pb, Bi, Mo, Sn, Sb<br />
and Au, Cr-<strong>sp</strong>inels<br />
Multi-stage origin<br />
with a late metamorphic<br />
overprint<br />
Domain<br />
510-390 Collision between a passive<br />
continental margin<br />
and intra-oceanic arc,<br />
later granitic intrusions.<br />
Ultramafic body, local<br />
skarns, contact aureole<br />
of a granite<br />
516–320 Thrusted passive margin<br />
sequence connected<br />
with ophiolites<br />
Reference<br />
Lisitsin et al. 2013<br />
Distler et al.<br />
(2004),<br />
Pirajno (2009)<br />
Bou Azzer<br />
Coronation Hill,<br />
Rum Jungle<br />
Mineral Field<br />
Thompson<br />
Mine, O<strong>sp</strong>wagan<br />
Group<br />
Kokka<br />
(Figs. 2, 4 and 7)<br />
Sikomäki open<br />
pit, Vuonos Ni<br />
Mine (Figs. 2, 4<br />
and 7)<br />
Horsmanaho<br />
Vasarakangas at<br />
Kylylahti (Figs. 2,<br />
4 and 7)<br />
Anti-Atlas,<br />
Morocco<br />
Pine Creek,<br />
Northern Territory,<br />
Australia<br />
Thompson<br />
Nickel Belt,<br />
Manitoba,<br />
Canada<br />
Outokumpu<br />
Mineral District,<br />
Eastern Finland<br />
Outokumpu<br />
Mining Camp,<br />
Eastern Finland<br />
Outokumpu<br />
Mining Camp,<br />
Eastern Finland<br />
Outokumpu<br />
Mining Camp,<br />
Eastern Finland<br />
Chromitite alteration,<br />
Co-Ni-As sulphide,<br />
low in PGE<br />
U-Au-PGE, Ni-Co<br />
pyrite<br />
Ni-Cu-PGE sulphide<br />
mineralizations,<br />
PGE-Au sulphosalts<br />
Co-bearing, weak<br />
Ni mineralization<br />
(PGE?) in skarn or<br />
contact of serpentinite,<br />
black schist<br />
Ni ore (PGE?),<br />
Co-bearing Ni<br />
sulphides-arsenides,<br />
chromite, U-bearing<br />
minerals<br />
Ni mineralization<br />
(PGE?), Co-bearing<br />
Ni sulphides-arsenides<br />
in concentration<br />
of talc mine<br />
Chromitite, PGM,<br />
laurite, irarsite,<br />
osarsite in euhedral<br />
matrix gersdorffites<br />
788–305 Ophiolite under sedimentary<br />
cover<br />
1607 Unconformity, mafic<br />
magmatism, reduced<br />
basement lithologies<br />
1880 Ultramafic sill – sediment<br />
complexes,<br />
intensive remobilization<br />
Ghorfi et al.<br />
(2008)<br />
Mernagh et al.<br />
(1998), McCready<br />
et al. (2004),<br />
Cuzens (2010),<br />
Orth et al. (2014)<br />
Chen (1993), Heaman<br />
et al. (2009)<br />
1970 Allochthonous ophiolite Inkinen (1969),<br />
Koistinen (1976),<br />
Jokela (2012)<br />
1970 Allochthonous ophiolite Rauhamäki<br />
(1975),<br />
Kauppinen<br />
(1976),<br />
Hänninen (1978)<br />
1970 Allochthonous ophiolite Hänninen (1983)<br />
1970 Allochthonous ophiolite Liipo (1999)<br />
Raglan, Delta Cape Smith Belt, Fe-Ni-Cu-PGE<br />
(Povungnituk<br />
Group, Chukotat<br />
Group), Purtuniq<br />
Ophiolite<br />
Canada mineralization<br />
DeGrussa, Red Narracoota-<br />
Bore, Doolgunna Karalundi,<br />
(?)<br />
Bryah-Yerrida,<br />
Australia<br />
Monchetundra<br />
Pechenga-Imandra-Varzuga<br />
Rift<br />
System<br />
Cu and Au mining<br />
and exploration<br />
(PGE potential not<br />
reported, but<br />
possible?)<br />
Hydrothermal<br />
complex and multiphased<br />
secondary<br />
PGE<br />
1999 Ultramafic-mafic<br />
differentiated bodies,<br />
sedimentary rocks<br />
2020 Ophiolite under sedimentary<br />
cover, thrusted<br />
2495 Tectonized, intense and<br />
long magmatic activity,<br />
layered ultramafic rocks<br />
St-Onge & Lucas<br />
(1994), Scott<br />
et al. (1998)<br />
Enterprise Metals<br />
Limited (2015),<br />
Pirajno<br />
et al. (2016)<br />
Grokhovskaya<br />
et al. (2009)<br />
205
Geological Survey of Finland, Special Paper 59<br />
Soile Aatos<br />
Some of the potential mineral systems are related<br />
to the marginal hydrothermal mineralization processes<br />
of primary Ni deposits (e.g. Thompson, Purtuniq<br />
and Monchetundra). (Table 3).<br />
During rifting and in accretionary orogens of<br />
Palaeoproterozoic age, existing or forming metal<br />
deposits were affected by complex processes related<br />
to deformation, metamorphism or even partial<br />
melting, causing various types of hydrothermal<br />
activity (Bierlein et al. 2009, Sharma 2009, Singh<br />
et al. 2016). Hydrothermal processes related to<br />
Palaeoproterozoic continental growth and cyclicity<br />
of shearing-controlled remobilization of chromium<br />
and PGE of chromites have been described,<br />
for example, from the Archaean Singhbhum craton<br />
– Palaeoproterozoic Singhbhum Mobile Belt, India<br />
(Mondal 2009).<br />
In Finland, the role of structural processes in<br />
Ni-PGE remobilization was already identified in<br />
the 1970s at the Hitura nickel sulphide mine, Nivala,<br />
where PGE mineralization in the Palaeoproterozoic,<br />
originally sill-like ultramafic intrusive<br />
cumulate nickel ore deposit was detected to be<br />
controlled by hydrothermal processes, and shearing<br />
or contacting structures in sulphide enriched<br />
layers and veins (Häkli et al. 1976, Makkonen et al.<br />
2011), with secondary PGM (Kojonen et al. 2004).<br />
The role of chromium in the Outokumpu-type mineral concept<br />
Mozier et al. (2012) have thoroughly described the<br />
USGS concept of global podiform chromitite metallogeny<br />
and potential and according to their work,<br />
podiform chromitites in ophiolites mainly occur<br />
within ultramafic rocks near cumulate contacts or<br />
tectonic zones, and they may indicate enrichment<br />
of PGEs (Table 4).<br />
Palaeoproterozoic continental passive margins<br />
and accretionary orogens (Condie 2002, LIP Commission<br />
2016) related to the Cr-(Ni)-PGE potential<br />
in podiform chromitites in 2.2 Ga highly differentiated<br />
karjalitic sills occur worldwide. Karjalites of<br />
the same age range also exist in the Outokumpu<br />
Mineral District (Vuollo et al. 1995, LIP Commission<br />
2006, Knauf et al. 1999, Pekkarinen et al.<br />
2006). Their origination may have a resemblance,<br />
for example, with the conditions in the Palaeoproterozoic<br />
margins of Singhbhum Craton (Singh et<br />
al. 2016). Hanski (2015) has described the primary<br />
metallogeny of the Outokumpu Palaeoproterozoic<br />
ophiolites from formation to the final breakup of<br />
the Kenorland supercontinent. Later Palaeoproterozoic<br />
multi-phased Cr-Ni-(PGE) alteration, remobilization<br />
or accumulating processes in maficultramafic<br />
Outokumpu-type ophiolites have been<br />
described and conceptualized by Knauf et al. (1999),<br />
Kuronen et al. (2004), Kontinen et al. (2006), Säntti<br />
et al. (2006) and Peltonen et al. (2008).<br />
Hydrothermal remobilization of the original PGE<br />
mineralogy of Outokumpu chromitites by PGEgersdorffites<br />
is suggested to be linked with regional<br />
metamorphism after the formation of chromitites<br />
(Knauf et al. 1999). Regional thermal activity<br />
is also supported by the metasomatic alteration or<br />
even breakdown of chromite described by Säntti<br />
et al. (2006). Later hydrothermal replacement of<br />
the original PGE minerals reveals that PGE-related<br />
cobaltoan gersdorffite ((Ni,Co)AsS) could be an interesting<br />
pathfinder mineral for PGE pro<strong>sp</strong>ectivity<br />
in the Outokumpu region. However, the economic<br />
value of the PGE in the Outokumpu region remains<br />
unknown due to insufficient information (Knauf et<br />
al. 1999).<br />
In this study, at least two or three different<br />
kinds of chromium-bearing, structure-controlled<br />
PGE mineralization-favouring processes could be<br />
identified in the Outokumpu region that are presently<br />
intermingled in the same geological <strong>sp</strong>ace<br />
(Figs. 7 and 8). Firstly, karjalites may include some<br />
PGE minerals (Srivastava et al. 2014). Secondly,<br />
ophiolite complexes may have chromitite pods<br />
enriched in PGE when they are sulphide-bearing<br />
(Prichard & Brough 2009). Chromitite pods with<br />
PGE minerals have been detected in the Outokumpu<br />
ophiolite complex by Vuollo et al. (1995), Liipo<br />
et al. (1998), and Liipo (1999) at Vasarakangas. The<br />
ophiolite bodies also contain Outokumpu-type<br />
massive or semi-massive Cu-Co-Zn-Ni±Au sulphide<br />
potential in ophiolite assemblages, which<br />
have been identified to belong to this geological<br />
context (Peltonen et al. 2008, Hanski 2015).<br />
Thirdly, later nickel-PGE remobilization connected<br />
with the disintegration of podiform chromites<br />
in cobalt-bearing hydrothermal mineralization<br />
processes has been identified near Outokumpu by<br />
Knauf et al. (1999).<br />
The Outokumpu-type polymetallic sulphide<br />
ores are strongly remobilized and tectonized, and<br />
they seem to have received their metals from ultramafic<br />
rocks, and a minor part of the sulphur<br />
from black schists (Peltonen et al. 2008, Saalmann<br />
& Laine 2014). Hydrothermal alteration in the<br />
206
Geological Survey of Finland, Special Paper 59<br />
Regional analysis of hydrothermal nickel pro<strong>sp</strong>ectivity in the Outokumpu Mineral District<br />
Outokumpu Mineral District may have been related<br />
to regional metamorphism or late orogenic magmatic<br />
activity during the Svecokarelian orogeny,<br />
represented by ca. 1.86 Ga old Maarianvaara granitoid<br />
(Huhma 1986, Peltonen et al. 2008) and possibly<br />
Kitee-type granite pegmatites (Figs. 8–11).<br />
These magmatic events may have impacted on the<br />
podiform chromitites, chromites or chromiumbearing<br />
magnetites, also altering or remobilizing<br />
the possible PGE in them.<br />
Additional pathfinder proxies for targeting the exploration of hydrothermal Ni-(PGE)<br />
in the Outokumpu Mineral District<br />
Although zones and locations pro<strong>sp</strong>ective for Outokumpu-type<br />
mineralization can be traced quite<br />
easily with geophysical anomalies at the regional<br />
scale, unfortunately they do not help in distinguishing<br />
or targeting the individual trace metal<br />
potential in them without geochemical or mineralogical<br />
parameters. For targeting trace metal mineralizations,<br />
lithogeochemistry or geochemistry of<br />
till may provide more detailed characteristics of the<br />
pro<strong>sp</strong>ective <strong>sp</strong>ots (Tables 1 and 4). The regional till<br />
geochemistry data may reveal the presence of regional<br />
hydrothermal alteration more clearly than<br />
lithogeochemistry of less altered bedrock in situ. It<br />
is likely that metal anomalies of till generally originate<br />
from fragmented and weathered boulder material<br />
di<strong>sp</strong>ersed geographically and topographically<br />
by glaciogene forces (Fig. 8). Some of the weathered<br />
or secondary mineral material in till originating<br />
from the exotic mineralogy of bedrock may dissolve<br />
more easily with acids than fresh rock samples.<br />
A few additions to the conceptual exploration<br />
model of Outokumpu-type hydrothermal-remobilised<br />
multi-metallic Ni-Cr-(PGE) mineral systems<br />
in the Outokumpu Mineral District can be made<br />
based on the features of analogous deposits elsewhere.<br />
Some of these exploration vectors (Table 4)<br />
resemble quite closely those developed for younger<br />
analogies (e.g. Grapes & Palmer 1996, Lisitsin et al.<br />
2013, Rajendran & Nasir 2014, Cooper & Ireland<br />
2015). As podiform chromitites are known to occur<br />
in Vasarakangas (Tables 3 and 4), in the Outokumpu<br />
case a surface or zone of chromitite pods<br />
could be used as a structural constraint in interpreting<br />
the boundaries of the ophiolite complex,<br />
as was predicted in the model presented in Figure<br />
7. Nikkarinen & Salminen (1982) have developed a<br />
heavy mineralogical exploration proxy for till material<br />
connected to Outokumpu serpentinites. According<br />
to them, the abundance of tremolite and<br />
iron sulphides together with uvarovite can be used<br />
as pathfinder minerals in the bottom till material<br />
tracing the Outokumpu serpentinites. It should<br />
be noted that uvarovite is lacking from lower amphibolites<br />
facies environments, such as Kylylahti,<br />
Sola and the northern part of Miihkali (pers.<br />
comm. Asko Kontinen). Cameron & Hattori (2005)<br />
have compiled <strong>sp</strong>ecifications for exploring PGE in<br />
surface environments, e.g. with Quaternary cover<br />
materials. Mernagh et al. (1998) have suggested<br />
the U 2 /Th ratio of airborne radiometrics to regionally<br />
uncover the unconformity type U-mineral<br />
sources caused by hydrothermal remobilization by<br />
metamorphism or granitic magmatism. Recently,<br />
Lehtonen et al. (2015) have developed new laboratory<br />
technologies and procedures for more costeffective<br />
indicator mineral (e.g. PGM) exploration.<br />
Regionally and, in places, in connection with<br />
some of the Outokumpu-type ore deposits, secondary<br />
chromium and boron have both been concentrated<br />
enough to form, for example, draviteelbaite-type<br />
Cr-bearing tourmalines (Outokumpu<br />
dravite and Kaavi Cr tourmaline (Peltola et al. 1968,<br />
Hytönen 1999)). Maarianvaara granitoid or later<br />
pegmatites related to the shear zone in Outokumpu<br />
show complex geochemical characteristics<br />
in places, e.g. chromian Na-Mg tourmaline<br />
dravite, and hydrothermal or otherwise secondary<br />
Cr minerals in Outokumpu-type skarns (Peltola et<br />
al. 1968). The presence of high chromium in highgrade<br />
silicate minerals in the Outokumpu mining<br />
area implies derivation from the original chromites<br />
and the migration of the released chromium<br />
into new minerals either in regional or contact<br />
metamorphic processes. Further disintegration of<br />
possible secondary chromium minerals can be witnessed,<br />
for instance, as anomalies of easily leachable<br />
(aq. reg.) chromium possibly of silicate origin<br />
in till (Fig. 8) or as overprinting of remobilized<br />
Cr-bearing hydrothermal minerals on the walls of<br />
underground museum tunnels of the closed Outokumpu<br />
mine (Fig. 12).<br />
The role of Maarianvaara granitoid in the Outokumpu-type<br />
ore deposition style has once again<br />
come under discussion after a few decades of silence<br />
(pers. comm. Urpo Kuronen and Jarmo Vesanto).<br />
After the formation of the mineralized<br />
207
Geological Survey of Finland, Special Paper 59<br />
Soile Aatos<br />
Table 4. Some complementary suggestions of features that could be useful as exploration vectors for the Ni-Cr-<br />
(PGE) potential mapping of Outokumpu-type deposits.<br />
Mineralization<br />
style<br />
Outokumpu<br />
assemblage<br />
(Podiform) chromite<br />
> remnants<br />
and secondary<br />
Cr minerals due<br />
to hydrothermal<br />
alteration<br />
> strain-related<br />
Cr-Ni-(PGE?)<br />
Remobilized<br />
Ni-PGE<br />
Primary and<br />
secondary Ni<br />
deposits<br />
Strain-related<br />
Cr-Li-B, can also<br />
be found in the<br />
Outokumpu<br />
Mineral District<br />
Pathfinder<br />
mineralogy<br />
Pentlandite,<br />
cobaltoan<br />
minerals<br />
Chromite,<br />
uvarovite,<br />
Cr-bearing mica<br />
etc.<br />
Hydrothermally<br />
altered Cr<br />
minerals and<br />
Ni-sulphides<br />
in tectonized<br />
quartz rocks of<br />
the Outokumpu<br />
assemblage<br />
Co-gersdorffite,<br />
Ni-arsenides<br />
Secondary<br />
magnetites<br />
depleted of<br />
Ni and Cr<br />
Dravite, Cr-Libearing<br />
mica,<br />
corundum<br />
Significance<br />
in the<br />
concept<br />
Significant at<br />
the targeting<br />
scale<br />
Original<br />
deposit style<br />
minor. It would<br />
be indicative<br />
in targeting or<br />
deposit-scale<br />
exploration of<br />
altered zones<br />
Original deposit<br />
style minor,<br />
but indicative<br />
on the regional<br />
to deposit<br />
scale<br />
Detection of<br />
eroded Ni–Cu–<br />
PGE deposits<br />
under e.g.<br />
Quaternary<br />
sedimentary<br />
coverage<br />
Structural-genetic<br />
interest in<br />
case of serpentinites.<br />
In case<br />
of pegmatites,<br />
may indicate<br />
economic Li<br />
deposits<br />
Study material<br />
Ni-Co anomaly<br />
in till<br />
Cr anomaly in till<br />
Ni-As anomaly in<br />
till, Pd in humus<br />
Differentiated or<br />
altered composition<br />
of magnetite<br />
in surficial sediments<br />
Cr-Li anomaly<br />
in till<br />
Exploration<br />
proxy for<br />
pro<strong>sp</strong>ectivity<br />
modelling<br />
Ni/Co ratio in<br />
heavy mineral<br />
fraction of till<br />
Acid-soluble<br />
Cr<br />
Identification<br />
of potential<br />
minerals,<br />
metal distributions<br />
in them<br />
Trace element<br />
distribution of<br />
magnetites<br />
Acid-soluble<br />
Cr, Li<br />
Reference<br />
Nikkarinen & Salminen<br />
(1982), Kontinen<br />
et al. (2006)<br />
Vuollo et al. (1995),<br />
Knauf et al. (1999),<br />
Aatos et al. (2006),<br />
Säntti et al. (2006),<br />
Prichard & Brought<br />
(2009), Mosier et al.<br />
(2012)<br />
Knauf et al. (1999),<br />
Cameron & Hattori<br />
(2005)<br />
Boutroy et al. (2014)<br />
Peltola et al. (1968),<br />
Grapes & Palmer<br />
(1996), Hytönen<br />
(1999), Cooper &<br />
Ireland (2015)<br />
Fig. 12. Remobilization of chromium can be observed, for example, in the barren rock walls of a driven tunnel in<br />
the Outokumpu mine museum, Outokumpu, Finland. The green wedge-shaped bodies dipping gently from left<br />
to right on the upper right edge of the image set contain abundant secondary chromium minerals other than<br />
chromite (photo collage by Esko Koistinen, GTK).<br />
208
Geological Survey of Finland, Special Paper 59<br />
Regional analysis of hydrothermal nickel pro<strong>sp</strong>ectivity in the Outokumpu Mineral District<br />
protolithic mafic-ultramafic – sedimentary sequences,<br />
later Paleoproterozoic orogens may have<br />
involved granitic – alkaline magmatism enriched<br />
with REE, Th and U, and having economic potential<br />
for lithium (LCT-type pegmatite dykes containing,<br />
for example, tourmaline). One example is the<br />
Trans-Hudsonian Wekusko Lake pegmatite field in<br />
the Flin-Flon domain, Manitoba, Western Canada.<br />
(Manitoba Geological Survey 2015)<br />
According to young metasomatic Cr-Li-B analogies<br />
from the Pounamu Ultramafic Belt in New<br />
Zealand, Cr-Li-bearing minerals can be encountered<br />
in collisional metamorphic fault zones of LIP<br />
plateau-originated allochthonous ultramafics, although<br />
the mobility of Cr and introduction of external<br />
B and Li by granitic alkaline fluids from continent-derived<br />
sources may be needed to explain<br />
the abundance of, for instance, chromian minerals<br />
in this zone. (Grapes & Palmer 1996, Cooper & Ireland<br />
2015)<br />
The Tohmajärvi region further southeast of the<br />
Outokumpu Mineral District is known for its Li<br />
pegmatites, being part of the Kitee granite (Alviola<br />
1974). Li-bearing minerals found in till in the<br />
Tohmajärvi region are mostly biotites rich in lithium<br />
(Nikkarinen & Wennerström 1982). Outside<br />
this study’s scope and without any further investigations,<br />
these ideas concerning metamorphic lithium<br />
enrichment or potential complex pegmatites<br />
in the Paakkila-Kuusjärvi area of the Outokumpu<br />
Mineral District remain untested.<br />
Outokumpu and Miihkali nappes involve differences in lithology<br />
The GIS fuzzy logic pro<strong>sp</strong>ectivity models presented<br />
in this study (Figs. 7 and 8), based on regional till<br />
(Salminen et al. 1995) and bedrock lithogeochemistry<br />
(Rasilainen et al. 2007, 2008), indicate that<br />
Ni and Cr anomalies do not fully correlate with each<br />
other geographically, e.g. between Outokumpu and<br />
Miihkali nappes. According to the pseudolithological<br />
model presented here (Figs. 4 and 13), the<br />
metasedimentary rocks of the Miihkali and Outokumpu<br />
nappes have differing geophysical characteristics<br />
compared with each other, also implying<br />
differences in geology. The main cause for this<br />
may be different geological settings with diverging<br />
physico-chemical conditions of sedimentation or<br />
metamorphosis of metasedimentary rock units,<br />
probably caused by tectonic effects on the present<br />
stratigraphic positioning. In addition, some later<br />
tectono-magmatic events with complex hydrothermal<br />
activities after deposition following proto-ore<br />
may also have caused or enhanced the incoherent<br />
<strong>sp</strong>atial distribution of chemical elements<br />
regionally (Figs. 2, 7−13).<br />
Miihkali could have reserved more of its original<br />
ultramafic Ni-(PGE) potential and integrity<br />
towards the thermo-chemical effects caused by<br />
the granitic - alkaline magmatic or metamorphic<br />
fluids containing differentiated or dissolved base<br />
metals and U compared to the ultramafic bodies<br />
in contact with graphite schists in the Outokumpu<br />
nappe. The surface part of the Miihkali nappe area<br />
may have been stratigraphically or <strong>sp</strong>atially more<br />
distant than the Outokumpu nappe, or weakly or<br />
not affected, for instance, by the regional metamorphic<br />
fluids or the Maarianvaara granitoid<br />
or younger pegmatite granite fluid fluxes, unless<br />
these dynamics could be evidenced in deeper<br />
parts of the Miihkali lithodeme.<br />
If the Outokumpu and Miihkali nappes were of<br />
the same lithological origin, the Outokumpu ore<br />
belt could have been similar to the Miihkali type<br />
ultramafic formation, until it was exposed to the<br />
end phase of the collision-related thermal sources<br />
(Maarianvaara granitoid and younger pegmatites)<br />
or surficial fluids (fluxing agents, noble elements,<br />
Co, U, Li, B and others) (mobile Cr, Ni and possibly<br />
PGE), but at present it could be tectonically<br />
dislocated compared to the Miihkali basin. If the<br />
Miihkali basin showed fewer indications of hydrothermal<br />
remobilization of the original nickel and<br />
chromium, it could be considered as being more of<br />
an original mantle formation and a less tectonized<br />
upper thrust slice of the Outokumpu allochthon<br />
than the Outokumpu nappe.<br />
209
Geological Survey of Finland, Special Paper 59<br />
Soile Aatos<br />
Fig. 13. The interpreted metasedimentary units of Outokumpu (dominated by blue) and Miihkali nappes (more<br />
beige than blue) differ from each other in geophysical characteristics, as indicated in this excerpt of a pseudolithological<br />
map of inferred Outokumpu assemblage (Fig. 5) of the Outokumpu Mineral District coinciding with<br />
the Outokumpu Mining Camp and the ZTEM flight area. Interpreted thrust faults are shown by triangulated lines<br />
(Bedrock of Finland − DigiKP). Inside the nappes, Outokumpu-type anomalies of ultramafic rocks and skarns are<br />
indicated by grey and orange colours, re<strong>sp</strong>ectively. Base map: pseudo-lithological map from Figure 4.<br />
CONCLUSIONS<br />
In this study, supplementary exploration vectors<br />
were added to the previous concept of the Outokumpu-type<br />
Cu-Co-Zn mineral deposit model<br />
based on new exploration knowledge of collisional<br />
or accretionary ophiolitic environments. These include<br />
the role of remobilized chromium, lithium<br />
and PGE as possible indicators of hydrothermal<br />
nickel (±PGE) and lithium deposits in the Outokumpu-type<br />
geological setting.<br />
The Palaeoproterozoic regime of the dismembered<br />
ophiolitic Outokumpu nappe complex,<br />
consisting of Outokumpu and Miihkali nappes<br />
piled up on each other, includes potential for Red<br />
Sea–Oman-type Cu-Co-Zn-Ni metallogeny in a<br />
highly tectonized and remobilized environment.<br />
Olivine in the ophiolites was hydrated to serpentines,<br />
which in turn may have disintegrated and<br />
donated their nickel in the regional metamorphic<br />
processes to form conductive sulphidic minerals<br />
with external sulphur from sedimentary sources.<br />
In the serpentinization process, magnetite was<br />
also formed, making the ultramafic rocks magnetic<br />
in their present form in their regional tectonic<br />
setting. Regional metamorphic and later granitic<br />
– alkaline magmatic fluid activity launched by accretionary<br />
or collisional tectonic events may have<br />
remobilized and enriched parts of the nickeland<br />
cobalt-bearing sulphides to form secondary<br />
210
Geological Survey of Finland, Special Paper 59<br />
Regional analysis of hydrothermal nickel pro<strong>sp</strong>ectivity in the Outokumpu Mineral District<br />
multi-metallic hydrothermal nickel type sulphide<br />
deposits, in which elevated PGE may or may not<br />
also occasionally be met. Zones enriched in sometimes<br />
exotic, hydrothermal or metamorphosed<br />
secondary chromium minerals originating from<br />
altered or decomposed chromites formed in the<br />
highly sheared footwalls of the Upper Kalevian<br />
Outokumpu nappe complex, which was thrust onto<br />
the Archaean basement covered by Lower Kalevian<br />
metasedimentary rocks. The existing Outokumputype<br />
mineral deposit model could be slightly updated<br />
with a hydrothermal nickel-(±PGE) deposit<br />
concept, developed based on its essential characteristics<br />
as identified worldwide. Structural proxies<br />
to delineate the boundaries of the Outokumpu<br />
nappe complex units in exploration were introduced<br />
by taking into account the chromite-bearing<br />
rock units as a structural constraint. Exotic secondary<br />
chromium minerals originating from chromite,<br />
such as dravite or other Cr-bearing silicates,<br />
could perhaps be used as indicators of tectonic high<br />
strain zones related to Outokumpu-type ophiolite<br />
constraining structures. Remobilized hydrothermal<br />
nickel-(±PGE) mineralizations may provide a<br />
complementary pathfinder feature to the structural<br />
boundary controls of the Outokumpu-type<br />
ophiolitic units. In addition to this, a regionalscale<br />
Li-anomaly detected around Maarianvaara<br />
granitoid in the western part of the research area<br />
was tentatively hypothesised as being related to<br />
younger pegmatite granites.<br />
Interpretation of the metal pro<strong>sp</strong>ectivity of the<br />
Outokumpu region was replenished by using GIS<br />
fuzzy logic modelling to compile and further develop<br />
conceptual and GIS pro<strong>sp</strong>ectivity analysis of<br />
the region based on the electric, magnetic, radiation<br />
and geochemical properties of the geological<br />
surface materials, such as bedrock and till. A<br />
GIS fuzzy logic approach and other GIS tools were<br />
used in geophysical and geochemical data processing<br />
and in integrating computational mineralogy<br />
and modelling-based geological inference data<br />
with more conventional exploration data. Computational<br />
interpretation was used to help improve<br />
the surficial geological and ore pro<strong>sp</strong>ectivity interpretation<br />
for deep exploration purposes.<br />
Computational GIS analysis tools integrating<br />
aerogeophysical and surface geochemical data can<br />
also be used as delineating aids in the orienting<br />
phase of deep exploration of hydrothermal multimetallic<br />
nickel-(±PGE) potential in brownfields at<br />
the regional scale. Computational pseudo-lithological<br />
interpretation may serve as one additional<br />
source of distinguishing information for geological<br />
and structural mapping in regions where an abundance<br />
of a seemingly monotonous single rock type<br />
dominates the geological interpretation, like the<br />
Palaeoproterozoic schists and gneisses do in the<br />
Outokumpu Mineral District. Pseudo-lithological<br />
and pro<strong>sp</strong>ectivity interpretation layers can be used<br />
as surface faces of 3D exploration cuboids for further<br />
3D pro<strong>sp</strong>ectivity modelling or integrative visualization<br />
of different earth model data elements<br />
in 3D.<br />
According to the pro<strong>sp</strong>ectivity analysis of this<br />
study and the available regional GIS data, interesting<br />
metal-bearing geochemical anomalies were<br />
detected related to Outokumpu-type geophysical<br />
conductive and magnetic, as well as U anomalies in<br />
compliance with the regional 3D geological and exploration<br />
interpretations modelled in this project.<br />
The pseudo-lithology approach may provide some<br />
aid in locating mafic-ultramafic rocks and interpreting<br />
lithological variation in abundant, monotonous-looking<br />
schist areas in the Outokumpu<br />
Mineral District.<br />
ACKNOWLEDGEMENTS<br />
I am grateful to Hannu V. Makkonen and the<br />
anonymous reviewer for their most constructive<br />
comments on the manuscript. Asko Kontinen is<br />
thanked for sharing his knowledge of Outokumpu<br />
rocks, discussions about the extent of Maarianvaara<br />
granitoid and pseudolithological interpretations<br />
regarding the Miihkali nappe. The quality of<br />
this manuscript was greatly enhanced with his and<br />
Ilkka Lahti’s comments, too. Eevaliisa Laine and<br />
Peter Sorjonen-Ward are thanked for introductions<br />
to the structural geological a<strong>sp</strong>ects of the Outokumpu<br />
Mining Camp area. Jouni Luukas is thanked<br />
for the unceasing discussions of regional geology,<br />
major tectonic features and dynamics of the Early<br />
Palaeoproterozoic regime in Finland, life and<br />
everything.<br />
211
Geological Survey of Finland, Special Paper 59<br />
Soile Aatos<br />
REFERENCES<br />
Aatos, S., Sorjonen-Ward, P., Kontinen, A. & Kuivasaari,<br />
T. 2006. Serpentiinin ja serpentiniitin hyötykäyttönäkymiä.<br />
Geological Survey of Finland, archive<br />
report M10.1/2006/3. 34 p. (in Finnish)<br />
Airo, M.-L. (ed.) 2015. Geophysical signatures of mineral<br />
deposit types in Finland. Geological Survey of Finland,<br />
Special Paper 58. 144 p.<br />
Airo, M.-L., Hyvönen, E., Lerssi, J., Leväniemi, H. &<br />
Ruotsalainen, A. 2014. Tips and tools for the application<br />
of GTK’s airborne geophysical data. Geological<br />
Survey of Finland, Report of Investigation 215. 33 p.<br />
Alviola, R. 1974. Selostus pegmatiittimutkimuksista<br />
Kiteen-Tohmajärven alueella vuosina 1972−1973. Geological<br />
Survey of Finland, archive report M19/4232/-<br />
74/1/82. 11 p. (in Finnish)<br />
Bedrock of Finland − DigiKP. Digital map database [Electronic<br />
resource]. E<strong>sp</strong>oo: Geological Survey of Finland<br />
[referred 22.02.2016]. Version 2.0.<br />
Bierlein, F. P, Groves, D. I. & Cawood, P. A. 2009. Metallogeny<br />
of accretionary orogens - The connection<br />
between litho<strong>sp</strong>heric processes and metal endowment.<br />
Ore Geology Reviews 36, 282–292.<br />
Bonham-Carter, G. & Cheng, Q. (eds) 2008. Progress in<br />
Geomathematics. Berlin Heidelberg: Springer-Verlag.<br />
553 p.<br />
Boutroy, E., Dare, S. A. S., Beaudoin, G., Barnes, S.-J.<br />
& Lightfoot, P. 2014. Magnetite composition in Ni-<br />
Cu-PGE deposits worldwide: application to mineral<br />
exploration. Journal of Geochemical Exploration 145,<br />
64-81.<br />
Cameron, E. M. & Hattori, K. H. 2005. Chapter 13: Platinum<br />
group elements in geochemical exploration. In:<br />
Mungall, J. E. (ed.) Exploration for deposits of platinum-group<br />
elements. Mineralogical Association of<br />
Canada, Short Course Series 35, 287−307.<br />
Chen, Y., Fleet, M. E. & Pan, Y. 1993. Platinum-group<br />
minerals and gold in Arsenic-rich ore at the Thompson<br />
mine, Thompson Nickel Belt, Manitoba, Canada.<br />
Mineralogy and Petrology 49, 127−146.<br />
Condie, K. C. 2002. Continental growth during a 1.9-Ga<br />
superplume event. Journal of Geodynamics 34, 249–<br />
264.<br />
Cooper, A. F. & Ireland, T. R. 2015. The Pounamu terrane,<br />
a new Cretaceous exotic terrane within the Alpine<br />
Schist, New Zealand; tectonically emplaced, deformed<br />
and metamorphosed during collision of the LIP Hikurangi<br />
Plateau with Zealandia. Gondwana Research 27,<br />
1255−1269.<br />
Cross, W., Iddings, J. P., Pirsson, L. V. & Washington, H.<br />
S. 1902. A Quantitative Chemico-Mineralogical Classification<br />
and Nomenclature of Igneous Rocks. The<br />
Journal of Geology 10, 555−690.<br />
Cuzens, H. 2010. The Genesis and Spatial Distribution of<br />
Platinum-Group Elements in the Coronation Hill Deposit,<br />
Northern Territory, Australia. Honour’s thesis,<br />
The University of Western Australia. 64 p.<br />
Enterprise Metals Limited 2015. “Sandfire’s Monty opens<br />
up potential for more Cu/Au discoveries at Doolgunna…..”<br />
24 November 2015. Annual General Meeting<br />
Presentation. 27 slides. Available at: http://www.asx.<br />
com.au/asxpdf/20151124/pdf/43372tglkrkcyp.pdf<br />
FODD 2015. Fennoscandian Ore Deposit Database. Geological<br />
Survey of Finland (GTK), Geological Survey of<br />
Norway (NGU), Geological Survey of Russia (VSEGEI),<br />
Geological Survey of Sweden (SGU), SC Mineral. Online<br />
database. [Electronic resource]. Available at:<br />
http://en.gtk.fi/informationservices/databases/fodd/<br />
index.html<br />
González-Álvarez, I., Pirajno, F. & Kerrich, R. 2013.<br />
Hydrothermal nickel deposits: Secular variation and<br />
diversity. Ore Geology Reviews 52, 1−3.<br />
González-Álvarez, I., Porwal, A., Beresford, S. W., Mc-<br />
Cuaig, T. C. & Maier, W. D. 2010. Hydrothermal Ni<br />
pro<strong>sp</strong>ectivity analysis of Tasmania, Australia. Ore<br />
Geology Reviews 38, 168−183.<br />
Ghorfi, M. E., Melcher, F., Oberthur, T., Boukhari, A. E.,<br />
Maacha, L., Maddi, A. & Mhaili, M. 2008. Platinum<br />
group minerals in podiform chromitites of the Bou<br />
Azzer ophiolite, Anti Atlas, Central Morocco. Mineralogy<br />
and Petrology 92, 59–80.<br />
Grapes, R. & Palmer, K. 1996. (Ruby-Sapphire)-Chromian<br />
Mica-Tourmaline Rocks from Westland, New<br />
Zealand. Journal of Petrology 37, 293−315.<br />
Grokhovskaya, T. L., Lapina, M. I. & Mokhov, A. V.<br />
2009. Assemblages and genesis of platinum-group<br />
minerals in low-sulfide ores of the monchetundra deposit,<br />
Kola Peninsula, Russia. Geology of Ore Deposits<br />
51, 467−485.<br />
Häkli, T. A., Hänninen, E., Vuorelainen, Y. & Papunen,<br />
H. 1976. Platinum-Group Minerals in the Hitura Nickel<br />
Deposit, Finland. Economic Geology 71, 1206−1213.<br />
Hänninen, E. 1978. Luettelo Vuonoksen kupari- ja nikkelimalmien<br />
malmimineraaleista ja päämineraalien<br />
koostumuksista. Malminetsintä, Outokumpu Oy, report<br />
070/4222 11 C/EH/1978. OKU_3008. 3 p. (in Finnish)<br />
Hänninen, E. 1983. Vuonoksen talkkirikastamon/nikkelipiirin<br />
malmimineralogiaa. Malminetsintä, Outokumpu<br />
Oy, report 070/Vuonos/4222 11, NiR/EH/83.<br />
OKU_3003. 13 p. (in Finnish)<br />
Harris, J. R., Wilkinson, L. & Ggrunsky, E. C. 2000.<br />
Effective use and interpretation of lithogeochemical<br />
data in regional mineral exploration programs: application<br />
of Geographic Information Systems (GIS) technology.<br />
Ore Geology Reviews 16, 107−143.<br />
Heaman, L. M., Peck, D. & Toope, K. 2009. Timing and<br />
geochemistry of 1.88 Ga Molson Igneous Events, Manitoba:<br />
Insights into the formation of a craton-scale<br />
magmatic and metallogenic province. Precambrian<br />
Research 172, 143−162.<br />
Hoatson, D. M., Jaireth, S. & Jaques, A. L. 2006. Nickel<br />
sulfide deposits in Australia: Characteristics, resources,<br />
and potential. Ore Geology Reviews 29, 177−241.<br />
Inkinen, O. 1969. Selostus Kaavin Kokan tutkimuksista<br />
vv. 1967−1968. Malminetsintä, Outokumpu Oy, report<br />
001/4311/OI/69. OKU_679. 18 p. (in Finnish)<br />
Janoušek, V., Farrow, C. M. & Erban, V. 2006. Interpretation<br />
of whole-rock geochemical data in igneous<br />
geochemistry: introducing Geochemical Data Toolkit<br />
(GCDkit). Journal of Petrology 47, 1255−1259.<br />
Jokela, T. 2012. Geology, geochemistry and 3D model of<br />
the Kokka nickel mineralization, Eastern Finland.<br />
Master’s thesis, University of Turku. 81 p.<br />
Kauppinen, H. 1976. Vuonoksen malmiarviot (Yhteenveto<br />
kuparimalmivaroista ja Sikomäen avolouhoksen<br />
nikkelimalmivaroista). Vuonos, Outokummun kaivos,<br />
Outokumpu Oy, report OKU_1483. 49 p. (in Finnish)<br />
Knauf, V. V., Tabuns, E. V. & Sokolov, P. B.1999. Platinum-Group<br />
Element Mineralization in the Early<br />
Proterozoic Outokumpu Ophiolite Complex. Symposium<br />
O07, Mineralogy, Ore Geology, Mineral Resources.<br />
EUG 10, 28th March−1st April, 1999, Strasbourg,<br />
France. Journal of Conference Abstracts, Volume 4,<br />
Number 1. Cambridge Publications Home Page. Last<br />
Updated on Thursday, March 18, 1999. Available at:<br />
http://www.the-conference.com/JConfAbs/4/764.<br />
html<br />
212
Geological Survey of Finland, Special Paper 59<br />
Regional analysis of hydrothermal nickel pro<strong>sp</strong>ectivity in the Outokumpu Mineral District<br />
Koistinen, T. 1976. Kairausraportti, Kokka, Kaavi. Outokumpu<br />
Oy:n malminetsinnän raportit. Malminetsintä,<br />
Outokumpu Oy, report OKU_1495. 23 p. (in Finnish)<br />
Kojonen, K. K., Roberts, A. C., Isomäki, O.-P., Knauf,<br />
V. V., Johanson, B. & Pakkanen, L. 2004. Tarkianite,<br />
(Cu,Fe)(Re,Mo) 4<br />
S 8<br />
, a new mineral <strong>sp</strong>ecies from the<br />
Hitura Mine, Nivala, Finland. The Canadian Mineralogist,<br />
42, 539−544.<br />
Kontinen, A. 2014. Appendix 5. Descriptive model of Outokumpu-type<br />
Cu-Zn-Co. In: Rasilainen, K., Eilu, P.,<br />
Halkoaho, T., Karvinen, A., Kontinen, A., Kousa, J.,<br />
Lauri, L., Luukas, J., Niiranen, T., Nikander, J., Sipilä,<br />
P., Sorjonen-Ward, P., Tiainen, M., Törmänen, T.<br />
& Västi, K. Quantitative assessment of undiscovered<br />
resources in volcanogenic massive sulphide deposits,<br />
porphyry copper deposits and Outokumpu-type deposits<br />
in Finland. Geological Survey of Finland, Report of<br />
Investigation 208, 83−87.<br />
Kontinen, A., Peltonen, P. & Huhma, H. 2006. Description<br />
and genetic modelling of the Outokumpu-type<br />
rock assemblage and associated sulphide deposits. Final<br />
technical report for GEOMEX JV, Work<strong>sp</strong>ace “Geology”.<br />
Geological Survey of Finland, archive report<br />
M10.4/2006/1. 380 p.<br />
Kontny, A. & Dietze, F. 2014. Magnetic fabrics in deformed<br />
metaperidotites of the Outokumpu Deep Drill<br />
Core, Finland: Implications for a major crustal shear<br />
zone. Tectonophysics 629, 224−237.<br />
Kurimo, M., Lahti, I. & Nousiainen, M. 2016. ZTEM survey<br />
in the Outokumpu region. In: Aatos, S. (ed.) Developing<br />
Mining Camp Exploration Concepts and Technologies<br />
– Brownfield Exploration Project 2013–2016.<br />
Geological Survey of Finland, Special Paper 59. (this<br />
volume)<br />
Kuronen, U., Kontinen, A. & Kokkonen, J. 2004. Geomex<br />
project report 1999-2003. GEOMEX JV Project. Project<br />
report, Outokumpu Mining Oy and Geological Survey<br />
of Finland. 38 p.<br />
Lahti, I., Leväniemi, H., Kontinen, A., Sorjonen-Ward,<br />
P., Aatos, S. & Koistinen, E. 2016. Geophysical surveys<br />
of the Miihkali area, Eastern Finland. In: Aatos, S.<br />
(ed.) Developing Mining Camp Exploration Concepts<br />
and Technologies – Brownfield Exploration Project<br />
2013–2016. Geological Survey of Finland, Special Paper<br />
59. (this volume)<br />
Lahtinen, R., Korja, A., Nironen, M. & Heikkinen, P.<br />
2009. Palaeoproterozoic accretionary processes in<br />
Fennoscandia. In: Cawood, P. A. & Kröner, A. (eds)<br />
Earth Accretionary Systems in Space and Time. London:<br />
The Geological Society, Special Publications 318,<br />
237–256.<br />
Laznicka, P. 2010. Precambrian greenstone-granite<br />
terrains. Giant Metallic Deposits. Chapter 10. 2 nd edition.<br />
Berlin Heidelberg: Springer-Verlag, 375−424.<br />
Lehtonen, M., Lahaye, Y., O’Brien, H., Lukkari, S., Marmo,<br />
J. & Sarala, P. 2015. Novel technologies for indicator<br />
mineral-based exploration. Geological Survey of<br />
Finland, Special Paper 57, 23−62.<br />
Leväniemi, H. 2013. Lithium Pegmatite Pro<strong>sp</strong>ectivity<br />
Modelling in Somero−Tammela Area, Southern Finland.<br />
Geological Survey of Finland, archive report<br />
151/2013. 15 p.<br />
Liipo, J. 1999. Platinum-group minerals from the Paleoproterozoic<br />
chromitite, Outokumpu ophiolite complex,<br />
eastern Finland. In: Hanski, E. & Vuollo, J. (eds)<br />
Ofioliti 24, 217−222.<br />
Liipo, J., Hanski, E. & Vuollo, J. 1998. Palaeoproterozoic<br />
podiform chromitite at Vasarakangas, Outokumpu<br />
ophiolite complex, eastern Finland. In: Hanski, E. &<br />
Vuollo, J. (eds) International ophiolite symposium<br />
and field excursion: generation and emplacement of<br />
ophiolites through time, August 10−15, 1998, Oulu,<br />
Finland. Abstracts, excursion guide. Geological Survey<br />
of Finland, Special Paper 26, p. 34.<br />
LIP Commission 2006. May 2006 LIP of the Month. Large<br />
Igneous Provinces Commission. International Association<br />
of Volcanology and Chemistry of the Earth’s<br />
Interior. Available at: http://www.largeigneou<strong>sp</strong>rovinces.org/06may<br />
LIP Commission 2015. Large Igneous Provinces Commission.<br />
International Association of Volcanology<br />
and Chemistry of the Earth’s Interior. Available at:<br />
http://www.largeigneou<strong>sp</strong>rovinces.org/<br />
Lisitsin, V. A., González-Álvarez, I. & Porwal, A. 2013.<br />
Regional pro<strong>sp</strong>ectivity analysis for hydrothermal-remobilised<br />
nickel mineral systems in western Victoria,<br />
Australia. Ore Geology Reviews 52, 100−112.<br />
Makkonen, H. V., Suikkanen, M., Isomäki, O.-P. & Seppä,<br />
V.-M. 2011. Lithogeochemistry and Geology of<br />
the Palaeoproterozoic (1.88 Ga) Hitura Nickel Deposit,<br />
western Finland. In: Sarala, P., Ojala, V. J. & Porsanger,<br />
M.-L. Programme and abstracts. The 25th International<br />
Applied Geochemistry Symposium 2011, 22−26<br />
August 2011, Rovaniemi, Finland. Vuorimiesyhdistys<br />
− Finnish Association of Mining and Metallurgical Engineers,<br />
Serie B 92-1. 192 p.<br />
Manitoba Geological Survey 2015. Rare Metals in Manitoba,<br />
Mineral Commodities in Manitoba, Geoscience,<br />
Mineral Resources. Manitoba Geological Survey. 4 p.<br />
Available at: http://www.gov.mb.ca/iem/geo/commodity/files/comm_raremetals.pdf<br />
Markwitz, V., Maier, W. D., González-Álvarez, I., Mc-<br />
Cuaig, T. C. & Porwal, A. 2010. Magmatic nickel sulfide<br />
mineralization in Zimbabwe: Review of deposits<br />
and development of exploration criteria for pro<strong>sp</strong>ectivity<br />
analysis. Ore Geology Reviews 38, 139−155.<br />
McGaughey, J. 2006. The Common Earth Model: A Revolution<br />
in Mineral Exploration Data Integration. In: Harris,<br />
J. R. (ed.) GIS applications in the earth sciences.<br />
Geological Association of Canada Special Publication<br />
44, 567−576.<br />
Mernagh, T. P., Wyborn, L. A. I. & Jagodzinski, E.<br />
A. 1998. ‘Unconformity-related’ U ± Au ± platinum-group-element<br />
deposits. AGSO Journal of<br />
Australian Geology & Geophysics 17, 197−205.<br />
Mondal, S. K. 2009. Chromite and PGE Deposits of<br />
Mesoarchaean Ultramafic-Mafic Suites within the<br />
Greenstone Belts of the Singhbhum Craton, India:<br />
Implications for Mantle Heterogeneity and Tectonic<br />
Setting. Journal Geological Society of India 73, 36−51.<br />
Mosier, D. L., Singer, D. A., Moring, B. C. & Galloway,<br />
J. P. 2012. Podiform chromite deposits − database<br />
and grade and tonnage models. U.S. Geological Survey<br />
Scientific Investigations Report 2012–5157. 45<br />
p. and database. Available at http://pubs.usgs.gov/<br />
sir/2012/5157/<br />
Nikkarinen, M. & Salminen, R. 1982. Outokumpu-assosiaation<br />
kivilajien vaikutus moreenin ja mineraalisen<br />
purosedimentin metallipitoisuuksiin ja mineraalikoostumukseen<br />
Petäisen alueella. English summary:<br />
The effect of the rocks of the Outokumpu association<br />
on the metal contents and mineral composition of the<br />
glacial till and mineral stream sediment in the Petäinen<br />
area, North Karelia, Finland. Geological Survey of<br />
Finland, Report of lnvestigation 59. 24 p.<br />
Nikkarinen, M. & Wennerström, M. 1982. Moreenin Litutkimus<br />
Tohmajärven Oriselän alueella. Geological<br />
Survey of Finland, archive report S/41/4232 04/1/1982.<br />
(in Finnish) Available at: http://tupa.gtk.fi/raportti/<br />
arkisto/s41_4232_04_1_1982.pdf<br />
Nykänen, V. M., Vuollo, J. I., Liipo, J. P. & Piirainen, T.<br />
A. 1994. Transitional (2.1 Ga) Fe-tholeiitic-tholeiitic<br />
213
Geological Survey of Finland, Special Paper 59<br />
Soile Aatos<br />
magmatism in the Fennoscandian Shield signifying<br />
litho<strong>sp</strong>heric thinning during Palaeoproterozoic extensional<br />
tectonics. Precambrian Research 70, 4-65.<br />
Orth, K., Meffre, S. & Davidson, G. 2014. Age and paragenesis<br />
of mineralisation at Coronation Hill uranium<br />
deposit, Northern Territory, Australia. Mineralium<br />
Deposita 49, 595−623.<br />
Pekkarinen, L. J., Kohonen, J., Vuollo, J. & Äikäs, O. 2006.<br />
Kolin kartta-alueen kallioperä. Summary: Pre-Quaternary<br />
rocks of the Koli map-sheet area. Geological<br />
map of Finland 1:100 000, Explanation to the maps of<br />
Pre-Quaternary rocks, sheet 4313 Koli. 116 p.<br />
Peltola, E., Vuorelainen, Y. & Häkli, T. A. 1968. A chromian<br />
tourmaline from Outokumpu, Finland. Bull.<br />
Geol. Soc. Finland 40, 35−38.<br />
Peltonen, P., Kontinen, A., Huhma, H. & Kuronen, U.<br />
2008. Outokumpu revisited: New mineral deposit model<br />
for the mantle peridotite-associated Cu-Co-Zn-<br />
Ni-Ag-Au sulphide deposits. Ore Geology Reviews 33,<br />
559−617.<br />
Pirajno, F. 2009. Hydrothermal Processes and Mineral<br />
Systems. Netherlands: Springer. 1250 p.<br />
Pirajno, F., Chen, Y., Li, N., Li, C. & Zhou, L. 2016. Besshi-type<br />
mineral systems in the Paleoproterozoic Bryah<br />
Rift-Basin, Capricorn Orogen, Western Australia: Implications<br />
for tectonic setting and geodynamic evolution.<br />
Geoscience Frontiers 7, 345−357.<br />
Porwal, A. & Kreuzer, O. 2010. Introduction to Special<br />
Issue: Mineral pro<strong>sp</strong>ectivity analysis and quantitative<br />
resource estimation. Ore Geology Reviews 38,121−127.<br />
Prichard, H. M. & Brough, C. P. 2009. Potential of ophiolite<br />
complexes to host PGE deposits. In: Li, C. & Riple,<br />
E. M. (eds) New Developments in Magmatic Ni-Cu and<br />
PGE Deposits, Beijing: Geological Publishing House,<br />
277−290.<br />
Rajendran, S. & Nasir, S. 2014. Hydrothermal altered<br />
serpentinized zone and a study of Ni-magnesioferrite-magnetite-awaruite<br />
occurrences in Wadi Hibi,<br />
Northern Oman Mountain: Discrimination through<br />
ASTER mapping. Ore Geology Reviews 62, 211−226.<br />
Rasilainen, K., Eilu, P., Halkoaho, T., Karvinen, A., Kontinen,<br />
A., Kousa, J., Lauri, L., Luukas, J., Niiranen,<br />
T., Nikander, J., Sipilä, P., Sorjonen-Ward, P., Tiainen,<br />
M., Törmänen, T. & Västi, K. 2014. Quantitative<br />
assessment of undiscovered resources in volcanogenic<br />
massive sulphide deposits, porphyry copper deposits<br />
and Outokumpu-type deposits in Finland. Geological<br />
Survey of Finland, Report of Investigation 208. 60 p.<br />
Rasilainen, K., Lahtinen, R. & Bornhorst, T. J. 2007. The<br />
Rock Geochemical Database of Finland Manual. Geological<br />
Survey of Finland, Report of Investigation 164.<br />
38 p.<br />
Rasilainen, K., Lahtinen, R. & Bornhorst, T. J. 2008.<br />
Chemical Characteristics of Finnish Bedrock – 1:1 000<br />
000 Scale Bedrock Map Units. Geological Survey of<br />
Finland, Report of Investigation 171. 94 p.<br />
Saalmann, K. & Laine, E. L. 2014. Structure of the Outokumpu<br />
ore district and ophiolite-hostedCu–Co–Zn–<br />
Ni–Ag–Au sulfide deposits revealed from 3D modeling<br />
and 2D high-resolution seismic reflection data. Ore<br />
Geology Reviews 62, 156–180.<br />
Salminen, R. (ed.) 1995. Alueellinen geokemiallinen kartoitus<br />
Suomessa vuosina 1982-1994. Summary: Regional<br />
Geochemical Mapping in Finland in 1982−1994.<br />
Geological Survey of Finland, Report of Investigation<br />
130. 47 p.<br />
Säntti, J., Kontinen, A., Sorjonen-Ward, P., Johanson,<br />
B. & Pakkanen, L. 2006. Metamorphism and Chromite<br />
in Serpentinized and Carbonate-Silica-Altered Peridotites<br />
of the Paleoproterozoic Outokumpu−Jormua<br />
Ophiolite Belt, eastern Finland. International Geology<br />
Review 48, 494−546.<br />
Sawatzky, D. L., Raines, G. L., Bonham-Carter, G. F. &<br />
Looney, C. G. 2009. Spatial Data Modeller (SDM): Arc-<br />
MAP 9.3 geoprocessing tools for <strong>sp</strong>atial data modelling<br />
using weights of evidence, logistic regression, fuzzy<br />
logic and neural networks.<br />
Scott, D. J., St-Onge, M. R. & Lucas, S. B. 1998. The 2.00<br />
Ga Purtuniq Ophiolite, Cape Smith Belt, Canada: The<br />
Leading Edge of a Collage of Exotic Paleoproterozoic<br />
Terranes Accreted to the Archean Superior Craton. In:<br />
Hanski, E. & Vuollo (eds) International Ophiolite Symposium<br />
and Field Excursion. Generation and Emplacement<br />
of Ophiolites Through Time, August 10−15, 1998,<br />
Oulu, Finland. Geological Survey of Finland, Special<br />
Paper 26, p. 52.<br />
Sharma, R. 2009. Singhbhum Fold Belt. Cratons and Fold<br />
Belts of India. Lecture Notes in Earth Sciences 127,<br />
209−229.<br />
Singh, M. R., Manikyamba, C., Ray, J., Ganguly, S.,<br />
Santosh, M., Saha, A., Rambabu, S. & Sawant, S. S.<br />
2016. Major, trace and platinum group element (PGE)<br />
geochemistry of Archean Iron Ore Group and Proterozoic<br />
Malangtoli metavolcanic rocks of Singhbhum<br />
Craton, Eastern India: Inferences on mantle melting<br />
and sulphur saturation history. Ore Geology Reviews<br />
72, 1263–1289.<br />
Srivastava, R. K., Jayananda, M., Gautam, G. C. & Samal,<br />
A. K. 2014. Geochemical studies and petrogenesis of<br />
~2.21–2.22 Ga Kunigal mafic dyke swarm (trending<br />
N-S to NNW-SSE) from eastern Dharwar craton, India:<br />
implications for Paleoproterozoic large igneous<br />
provinces and supercraton Superia. Mineralogy and<br />
Petrology 108, 695−711.<br />
St-Onge, M. R. & Lucas, S. B. 1994. Controls on the regional<br />
distribution of iron – nickel – copper – platinum-group<br />
element sulfide mineralization in the<br />
eastern Cape Smith Belt, Quebec. Canadian Journal of<br />
Earth Sciences 31, 206−218.<br />
Vuollo, J., Liipo, J., Nykänen, V., Piirainen, T., Pekkarinen,<br />
L., Tuokko, I. & Ekdahl, E. 1995. An early Proterozoic<br />
podiform chromitite in the Outokumpu Ophiolite<br />
complex, Finland. Economic Geology 90, 445−452.<br />
Wilde, A. 2005. Descriptive ore deposit models: hydrothermal<br />
& supergene Pt & Pd deposits. In: Mungall, J.<br />
(ed.) Exploration for Platinum-Group Element Deposits.<br />
Chapter 7. Short Course Series Volume 35. Mineralogical<br />
Association of Canada, 145−161.<br />
Zhang, Y., Sorjonen-Ward, P. & Ord, A. 2006. Modelling<br />
fluid tran<strong>sp</strong>ort associated with mineralization and deformation<br />
in the Outokumpu Cu–Zn–Co deposit, Finland.<br />
Journal of Geochemical Exploration 89, 465−469.<br />
214
All GTK’s publications online at hakku.gtk.fi<br />
The project Developing Mining Camp Exploration Concepts and<br />
Technologies - Brownfield Exploration (2013–2016), funded by the<br />
Green Mining Programme of Tekes, the Finnish Funding Agency<br />
for Innovation, and operated by the Geological Survey of Finland<br />
and University of Helsinki, developed scalable deep exploration<br />
concepts and technologies for Outokumpu-type mineral deposits<br />
in the Outokumpu Mining Camp area, Eastern Finland. In the nine<br />
articles of this publication, integrative digital earth modelling and<br />
common earth modelling techniques applied in the project are<br />
described, with regional to case study examples where sufficient<br />
geological, geophysical and geochemical survey data, suitable<br />
computational solutions, or modelling and visualization applications<br />
were available. An optimized selection of deep exploration methods<br />
for Outokumpu-type mineral deposits (OKUDEX concept) consisting<br />
of one-to-multidisciplinary interpretations, 3D modelling, pro<strong>sp</strong>ective<br />
GIS techniques and integrative visualization in 3D environments will<br />
help present and future pro<strong>sp</strong>ectors and miners to more efficiently<br />
further delineate the most interesting geological structures and units<br />
implying deep mineral potential in the Outokumpu Mining Camp area<br />
and the surrounding Outokumpu Mineral District.<br />
ISBN 978-952-217-362-1 (pdf)<br />
ISBN 978-952-217-363-8 (paperback)<br />
ISSN 0782-8535